Article

Geography, Climate, and Habitat Shape the Microbiome of the Endangered Rock Gnome Lichen (Cetradonia linearis)

1
Department of Biology, Eastern Washington University, Cheney, WA 99004, USA
2
Biology Department, City University of New York Graduate Center, New York, NY 10016, USA
3
Torrey Botanical Society, Bronx, NY 10458, USA
4
Biology and Chemistry Department, California State University, Monterey Bay, Seaside, CA 93955, USA
*
Author to whom correspondence should be addressed.
Diversity 2024, 16(3), 178; https://doi.org/10.3390/d16030178
Submission received: 21 January 2024 / Revised: 17 February 2024 / Accepted: 26 February 2024 / Published: 13 March 2024
(This article belongs to the Section Biodiversity Conservation)

Abstract

:
Bacterial symbionts are essential components of healthy biological systems. They are increasingly recognized as important factors in the study and management of threatened species and ecosystems. Despite management shifts at the ecosystem level, microbial communities are often neglected in discussions of holobiont conservation in favor of the primary members of a symbiosis. In this study, we addressed the bacterial community knowledge gap for one of two federally endangered lichen species in the United States, Cetradonia linearis (Cladoniaceae). We collected 28 samples of the endangered rock gnome lichen (Cetradonia linearis) from 13 sites and characterized bacterial communities in thalli using 16S rRNA metabarcoding to investigate the factors influencing the microbiome composition and diversity within the thallus. We found that Proteobacteria (37.8% ± 10.3) and Acidobacteria (25.9% ± 6.0) were the most abundant phyla recovered. Cyanobacteria were a major component of the microbiome in some individuals, despite this species associating with a green algal symbiont. Habitat, climate, and geography were all found to have significant influences on bacterial community composition. An analysis of the core microbiome at a 90% threshold revealed shared amplicon sequence variants in the microbiomes of other lichens in the family Cladoniaceae. We concluded that the bacterial microbiome of Cetradonia linearis is influenced by environmental factors and that some bacterial taxa may be core to this group. Further exploration into the microbiomes of rare lichen species is needed to understand the importance of bacterial symbionts to lichen diversity and distributions.

1. Introduction

Healthy microbial communities are essential to all functioning biological systems [1]. Changes in conservation and management strategies reflect the increasing appreciation and application of microbiome research [2]. Analysis of soil microorganisms has been used to track changes in diversity and abundance of keystone microbes during ecosystem recovery from anthropogenic or natural disturbance events [3,4,5]. When relationships between microbial diversity and recovery stage have been established, this data can be used in future ecosystem assessments to determine recovery progress [6,7]. Microbiome data has also informed strategies to decrease the extinction risk faced by threatened species, including informing population management strategies [8,9,10]. and disease mitigation [11,12].
Microbiome–host interactions are one example of the range of potential symbioses. The role of co-evolution in establishing a stable and efficient symbiosis has been illustrated in several prominent systems but generally focuses on the interactions between two distinctly identifiable organisms, a perspective that is frequently applied to rare and threatened species [13,14,15,16]. The holobiont perspective on symbioses has expanded boundaries beyond the dominant symbionts to integrate interactions among minor symbionts, fungal, bacterial, and viral communities, and all other members present [2]. Shifting from a dominant symbiont to holobiont perspective has substantial conservation implications. For instance, previous efforts to understand orchid mycorrhizal associations and their context in conservation have focused on identifying individual fungal strains and assessing their efficacy as a soil inoculant for orchid germination [17,18]. However, several studies have now shown that bacterial communities associated with the orchid endophytically or in the rhizosphere have a positive effect on germination as well as potentially being involved in promoting other biological processes that improve plant health and growth [19,20]. As data further illuminate the role of bacterial communities in orchid survival, new conservation considerations for bacteria as a part of a greater orchid holobiont should be implemented [21].
Lichens are obligate mutualistic symbioses composed of dominant fungal and algal symbionts. Application of the holobiont perspective has now expanded our conception of lichens to encompass the incredibly complex systems of endolichenic fungi, viruses, and bacteria present in each lichen in addition to the main symbionts [22,23]. Mycobiont–photobiont interactions display a range of specificity [24,25]. and are known to affect factors in the symbiosis, such as the range and adaptability to habitat changes [26,27]. Despite bacterial communities only recently being integrated into studies of lichens, there have been rapid, major gains in our knowledge of their microbiomes. The bacteria of the lichen microbiota are influenced by many biotic and abiotic factors, including nutrient availability, growth form, and age of host tissues [28,29,30,31]. In lichens, bacterial microbiomes tend to be dominated by the classes Alphaproteobacteria, Verrucomicrobia, Bacteroidetes, and Actinobacteria [32], but some specific lichen genera have also been found to contain bacteria from the class Acidobacteria [33]. Initial research suggested that the bacterial portion of the lichen microbiota primarily consists of opportunists from the immediate environment that have found an available niche in the thallus [34]; however, comparative population studies and metagenomic analyses suggest some degree of specialization [32,35]. While microbes from the surrounding environment and substrate heavily influence microbiome composition, asexual vegetative propagules can transfer bacteria from the parent to the offspring [36]. As a result, microbial diversity can be highly variable among individuals. Still, patterns of species, genus, and population-specific microbial composition have been well documented [37,38,39,40,41].
Cetradonia linearis (rock gnome lichen) is a federally endangered species narrowly endemic to the southern Appalachian Mountains of the eastern United States [42,43]. It is one of the earliest diverging lineages in Cladoniaceae, a diverse family that includes many abundant and widespread species [44,45]. Cetradonia linearis grows directly attached to non-calcareous rocks at the base of cliff faces with seeping water or above average high water lines on boulders in streams. Morphologically, it is relatively simple, consisting largely of 1–2 cm long, roughly cylindrical projections that grow in colonies (Figure 1). Both asexual (pycnidia) and sexual (apothecia) fungal reproductive structures are frequently present in colonies. Previous research on the population genomics of this species recovered evidence for a high degree of isolation by distance among populations and low rates of recombination [46], a similar pattern to what has been observed in other southern Appalachian endemic species [47,48,49].
Here, we address the following questions to better understand the microbiome of Cetradonia linearis individuals sampled throughout its range: (1) Which bacteria comprise the core microbiome of C. linearis? Alonso-Garcia et al. [37] recovered Proteobacteria and Acidobacteria as key components of the core microbiome of Cladonia stellaris, a more derived lineage of Cladoniaceae. We expect to find an overlap in the core microbiome of Cladonia stellaris and C. linearis due to their somewhat close phylogenetic relationship. (2) Do habitat, climate, or geographic distance influence bacterial community diversity and composition in C. linearis thalli? In other lichens, a variety of environmental factors, such as temperature and habitat, shape lichen microbiomes [37,38,39,40,41] and we aim to test if these factors significantly influence the microbiome of C. linearis, and (3) Do cyanobacteria comprise a major proportion of the bacterial communities? Cyanobacterial mats were often observed growing on and over C. linearis thalli. While the main photobiont is a green alga, we hypothesized that Cyanobacteria may be living inside of the lichen thalli, not only on the surface. To answer these questions, we conducted amplicon sequencing of the 16S rRNA region from 28 individuals of C. linearis collected throughout the range of the species. Sampling sites encompassed a diversity of habitat types, elevations, and all major mountain ranges in the study area.

2. Methods

2.1. Sampling, DNA Extractions, and Amplicon Sequencing

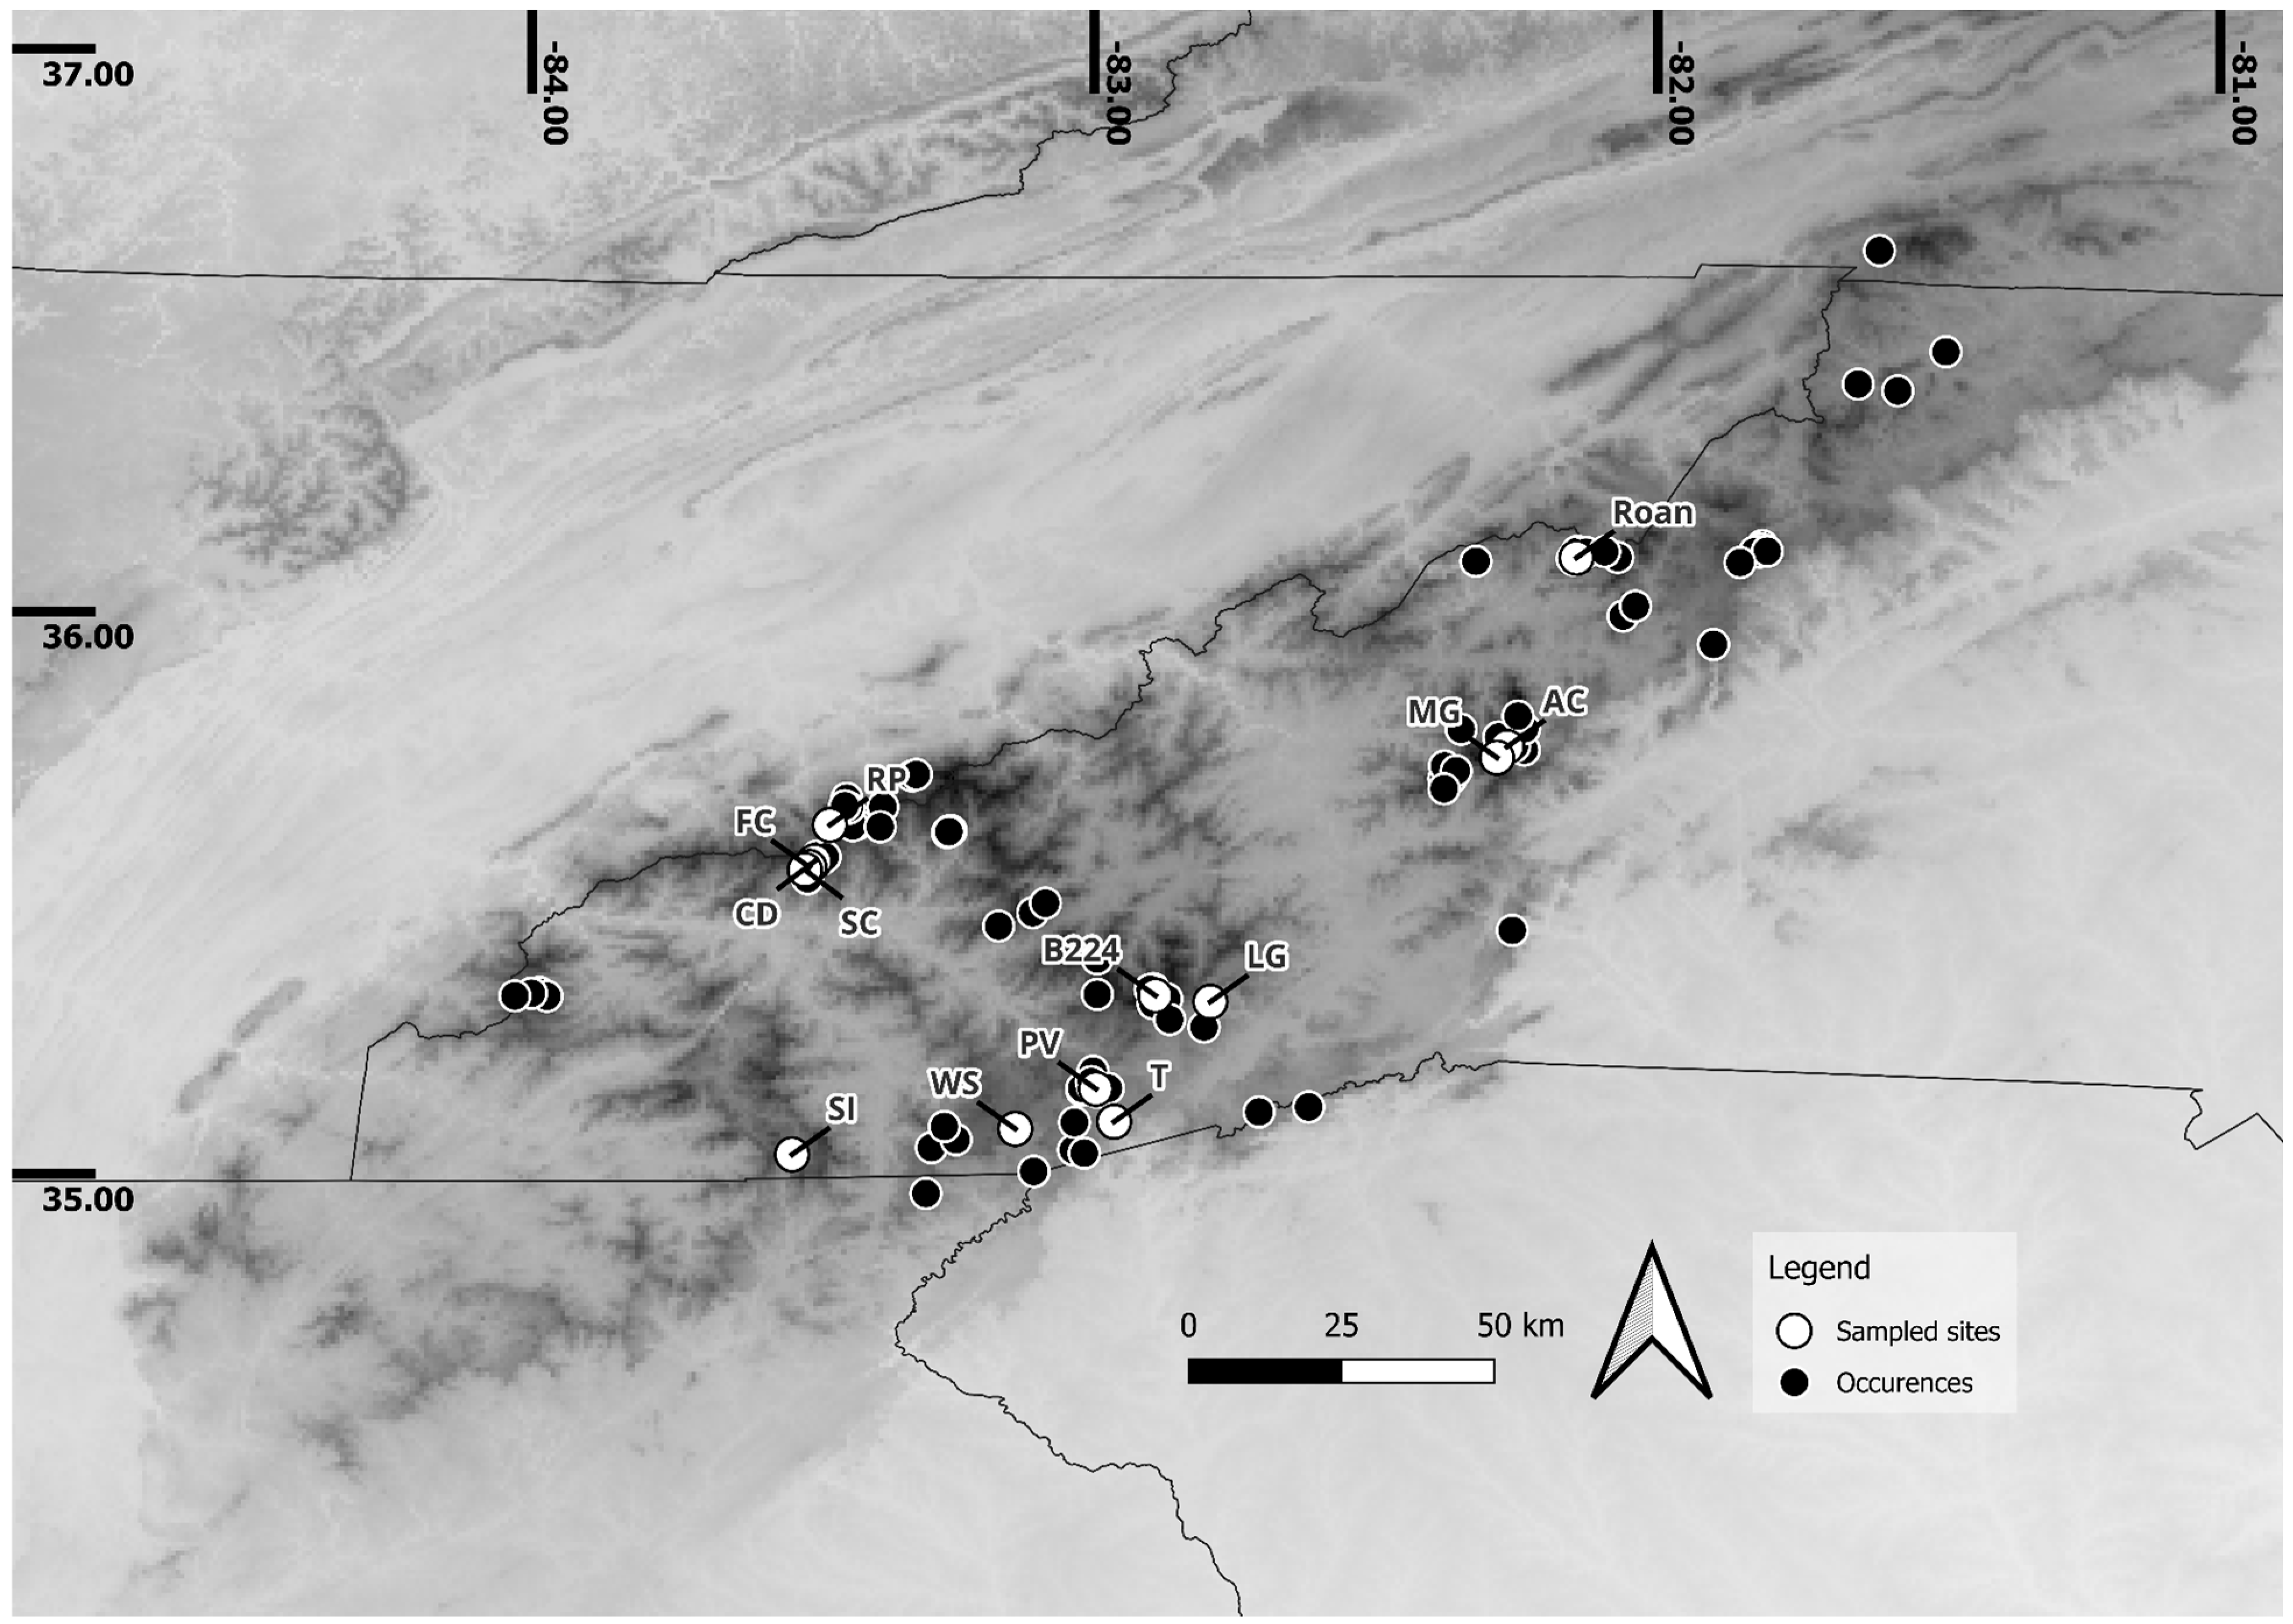
Samples were collected from throughout the range of Cetradonia linearis in August and September 2015 (Figure 2). Thirteen sampling sites were selected to capture habitat (boulders in streams vs. cliff faces) and climatic variation, along with a range of pairwise geographic distances among the sites. At each site, squamules from up to ten individuals were collected using sterilized forceps, and the samples were deposited directly into sterile 1.5 mL Eppendorf tubes. Samples were taken from healthy-looking individuals (green and dense) that were not overgrown by moss or cyanobacteria, covered with soil, or submerged in water. The species is easily identified in the field as there are no similar-looking species present in the region. Specimen identification was completed by the second author. The samples in the tubes were placed in a −40 °C freezer after being allowed to air dry for 24 h and maintained at this temperature except for one brief transport period between laboratories, during which the samples were kept on dry ice. These same exact individuals were used for a population genomic study, wherein 32 individuals were ultimately included in the study due to DNA extraction yields and funding limitations [46]. Twenty-eight of the thirty-two samples were further investigated in this study. The 28 individuals were selected based on the quantity of material availability. One or two squamules of each sample were removed from their original tubes, cleaned of external debris with sterile forceps, and vigorously sprayed clean with acetone, then moved into a fresh Eppendorf tube. The DNA was extracted using the PowerSoil DNA isolation kit according to the manufacturer’s protocols (MO BIO, Carlsbad, CA, USA). The V4 variable region of the 16S rRNA gene was amplified using the 515F/806R primer pair using the HotStarTaq Plus Master Mix Kit (Qiagen, Germantown, MD, USA). The thermal profile included an initial denaturation at 94 °C for 3 min, followed by 28 cycles of denaturation at 94 °C for 30 s, annealing at 53 °C for 40 s, and extension at 72 °C for 1 min, with a final extension at 72 °C for 5 min. Amplicons were pooled at equimolar concentrations and purified using Ampure XP beads. The purified PCR products were subsequently prepared for sequencing following the Illumina TruSeq DNA library preparation protocol. Sequencing was performed on the Illumina MiSeq platform at Molecular Research LP (Shallowater, TX, USA). Data are available for download from the National Center for Biotechnology Information BioProject PRJNA1076914.

2.2. Environmental Data

A suite of environmental variables was generated for each site. Whether the species was growing on a rock outcrop or on boulders in a stream was noted during collection. Slope and bioclimatic variable values were extracted from all 19 bioclimatic variables in the Worldclim dataset at 30-arc-second resolution in R using the raster package [50,51]. Variables were checked for collinearity using pairwise Spearman correlations among all variables. Slope and three bioclimatic variables—BIO8 (mean temperature of wettest quarter), BIO10 (mean temperature of warmest quarter), and BIO12 (annual precipitation)—were retained for downstream analyses (BIO8 vs. BIO10 rs = −0.24; BIO8 vs. BIO12 rs = −0.68; BIO10 vs. BIO 12 rs = 0.10; Supplementary Table S1). In addition to statistical robustness, we also considered the biological relevance of the climatic variables to both the mycobiont and microbiome. Temperature and moisture have well-documented impacts on the diversity of soil microbial communities [52,53,54,55]. The effects of temperature and humidity on lichen distribution have also been documented [56,57], which could relate to the individual effects of climate impacting photobiont distribution [58] or mycobiont distribution, which has not been extensively studied.

2.3. Microbiome Analyses in QIIME2

Read processing and community analyses were conducted in QIIME2 in the virtual box platform [59]. The reads were first demultiplexed, then denoising was conducted using DADA2 [60]. To complete the taxonomic classification, sklearn silva-138-99-515-806-nb-classifier was used [61]. Reads that mapped to mitochondria, chloroplast, Eukaryota, or were unassigned were removed from the dataset. A phylogenetic tree of the remaining reads was built using the mafft fasttree option, and the resulting rooted tree was used for alpha rarefaction with a sampling depth of 14,000. The rarefied taxa table was then used for downstream analyses.
The relationships between alpha diversity and geography and alpha diversity and environmental variables were evaluated using Spearman’s correlation and Kruskal-Wallis tests. Three measures of alpha diversity were calculated: Shannon diversity index, Pielou’s evenness, and Faith’s phylogenetic diversity. The correlations between the three climatic variables (BIO8, BIO10, and BIO12) and each of the diversity metrics were assessed. Kruskal-Wallis tests were used to evaluate differences in diversity based on habitat (cliff-dwelling vs. stream-dwelling), location, and mountain range.
To evaluate differences in beta diversity based on geography and environment we used PERMANOVA and Mantel tests. Four measures of beta diversity were calculated: Bray-Curtis dissimilarity, Jaccard, unweighted Unifrac, and weighted Unifrac. To test if the within-site and within-mountain range communities were significantly different from the among-site and mountain range diversity, a PERMANOVA of all four beta diversity measures was conducted. We used a variety of beta diversity metrics to determine if any significant results were robust to variation among those metrics. The same four measures were used to evaluate the difference in beta diversity between cliff-dwelling and stream-dwelling communities. Mantel tests were used to evaluate correlations between all four beta diversity measures and three climatic variables. Bray-Curtis dissimilarity values were also visualized in a principal coordinates analysis (PCoA) ordination using the Emperor plug-in.

2.4. Core Microbiome Characterization

The core microbiome was identified and visualized using the R Microbiome and Microbiome Utilities packages [62]. Here, the core microbiome was defined as an ASV present at any abundance in a minimum number of samples defined by the threshold and was used to visualize microbes shared across sites. Core bacterial ASVs were analyzed at three minimum prevalence thresholds: 50, 75, and 90 percent. For each prevalence threshold, a table of core taxa IDs and core abundances for each collection site was obtained. Core abundances were formatted according to the mountain range and assigned a value of 1–4 according to the quartile distribution for each prevalence threshold. ASVs were identified and formatted using microbiomeutilities::format_to_besthit(), a function that assigns all ASVs the best taxonomic rankings identified using the Silva classifier. Heatmaps were generated to visualize the relative abundance of bacterial orders at all three prevalence threshold levels. Sequences from the core ASVs identified at the 90% threshold level were extracted to conduct a BLAST search for more accurate identifications. Figures were formatted using Inkscape [63].

3. Results

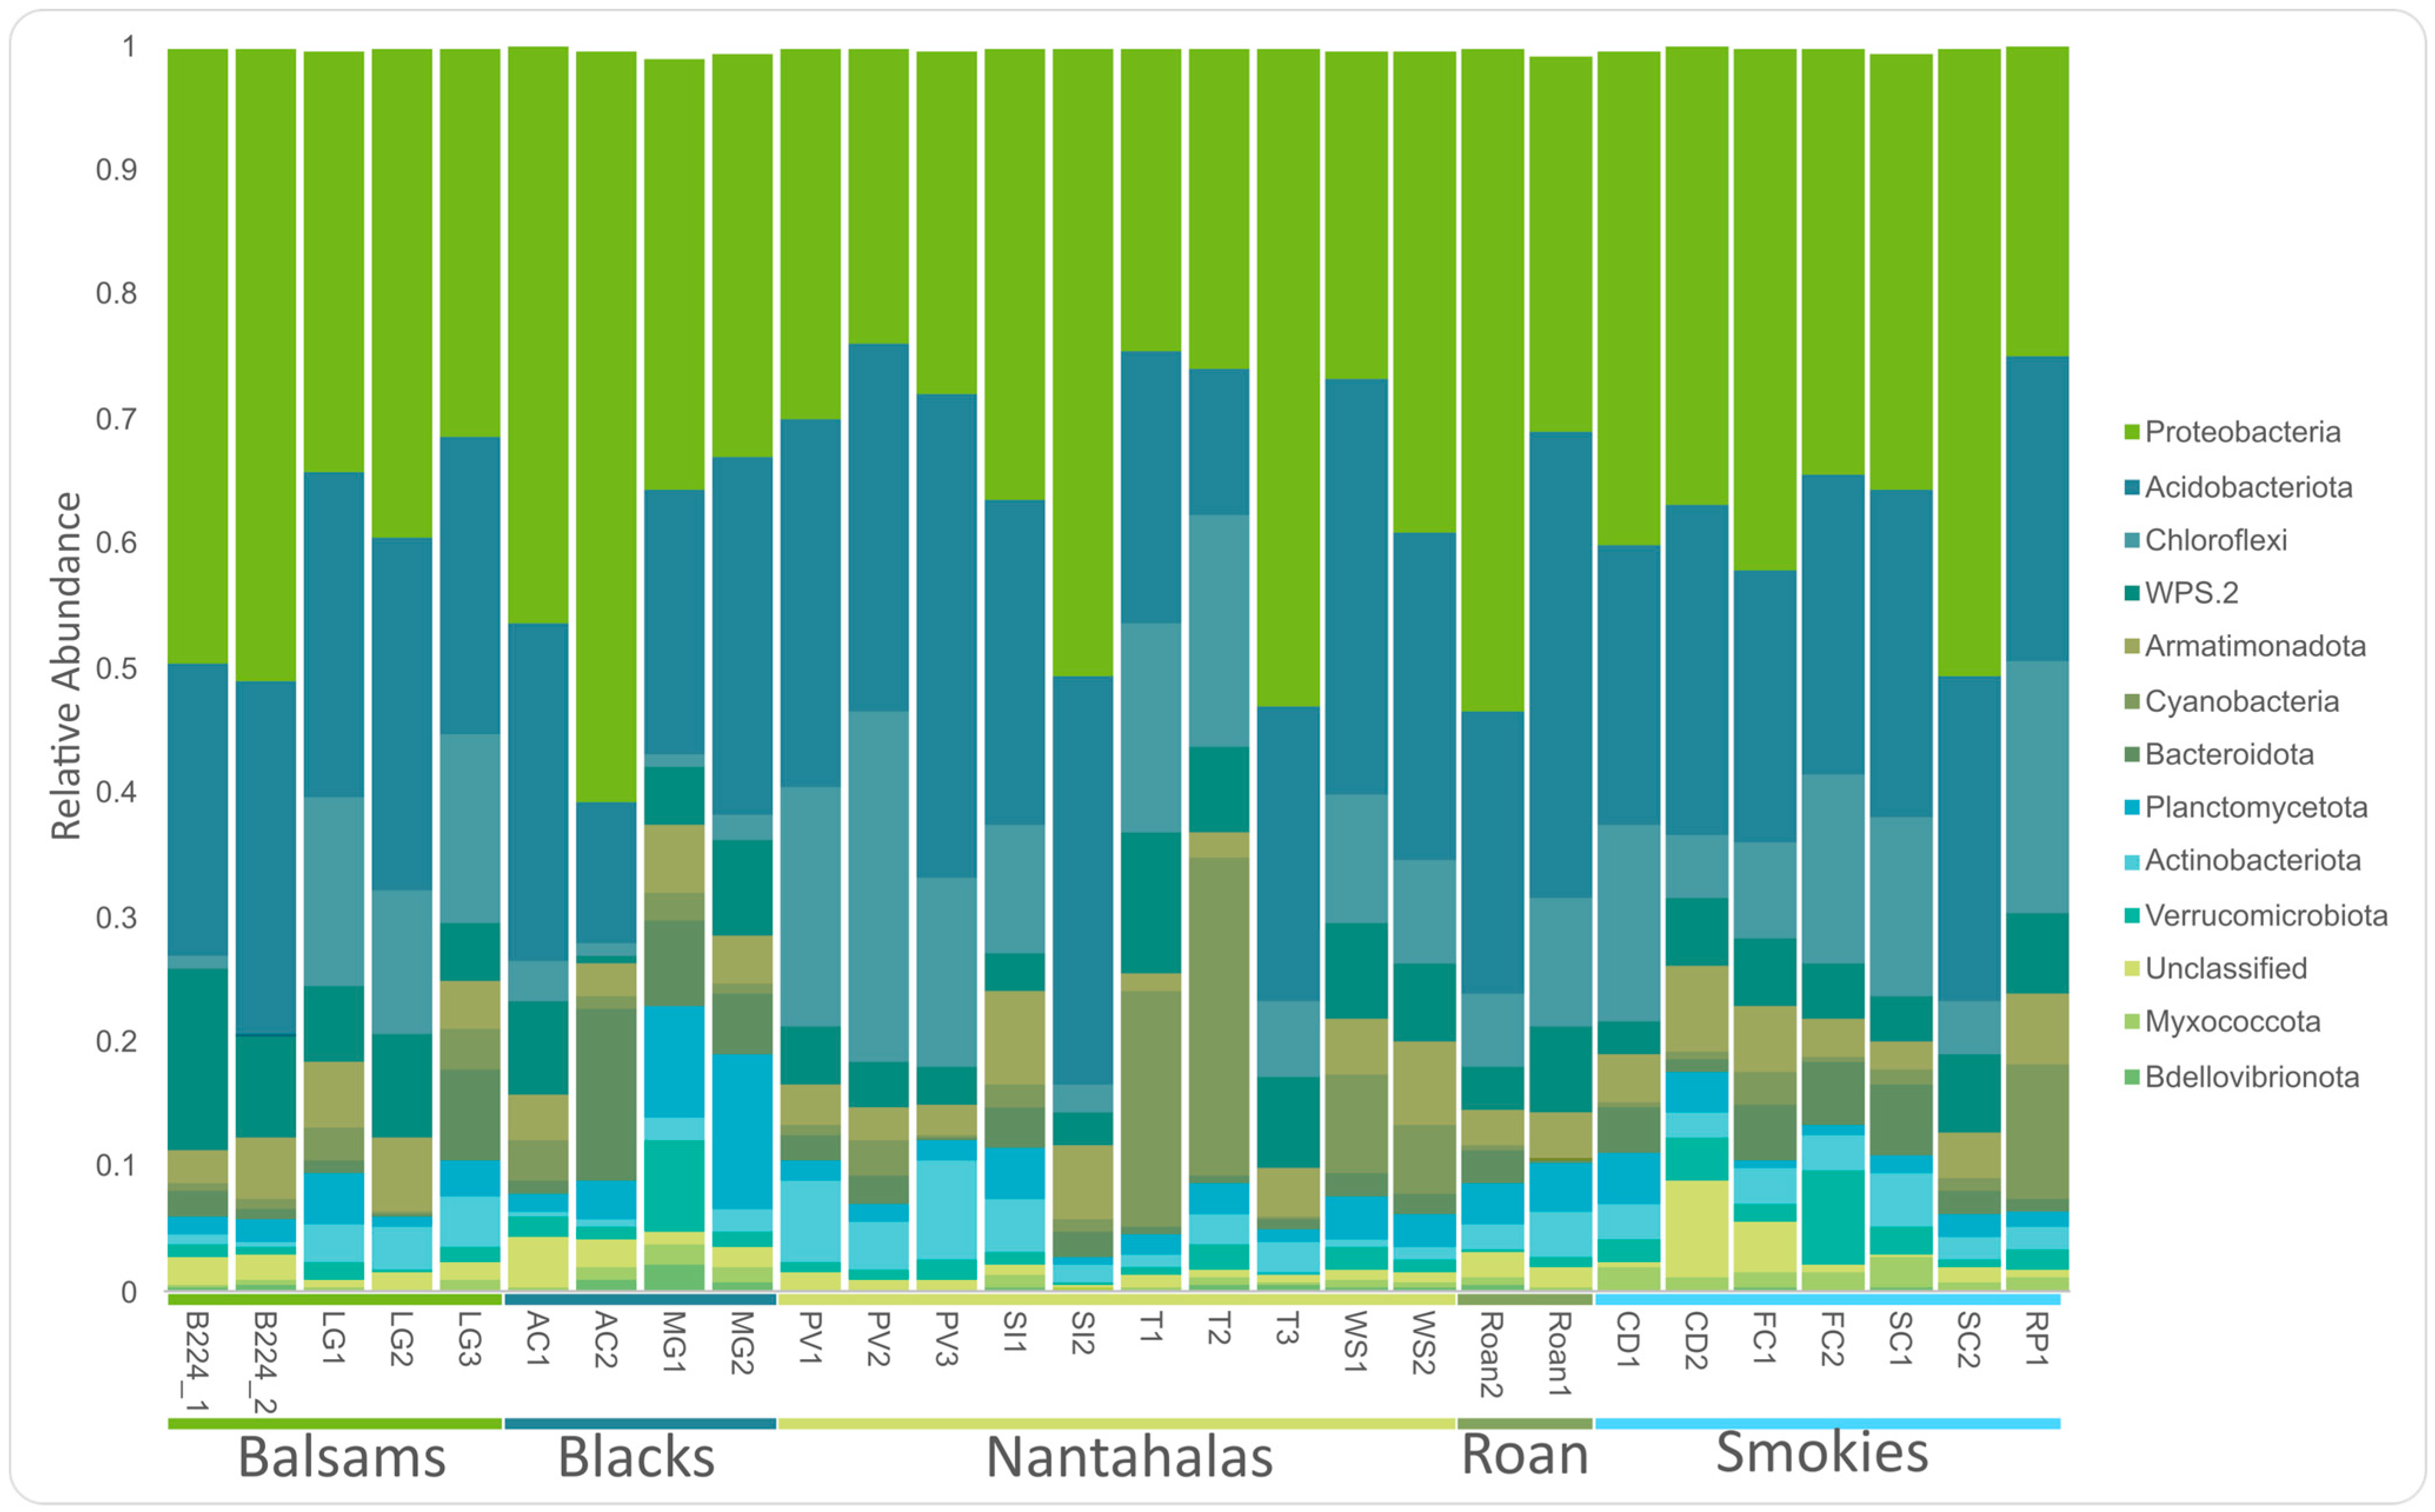
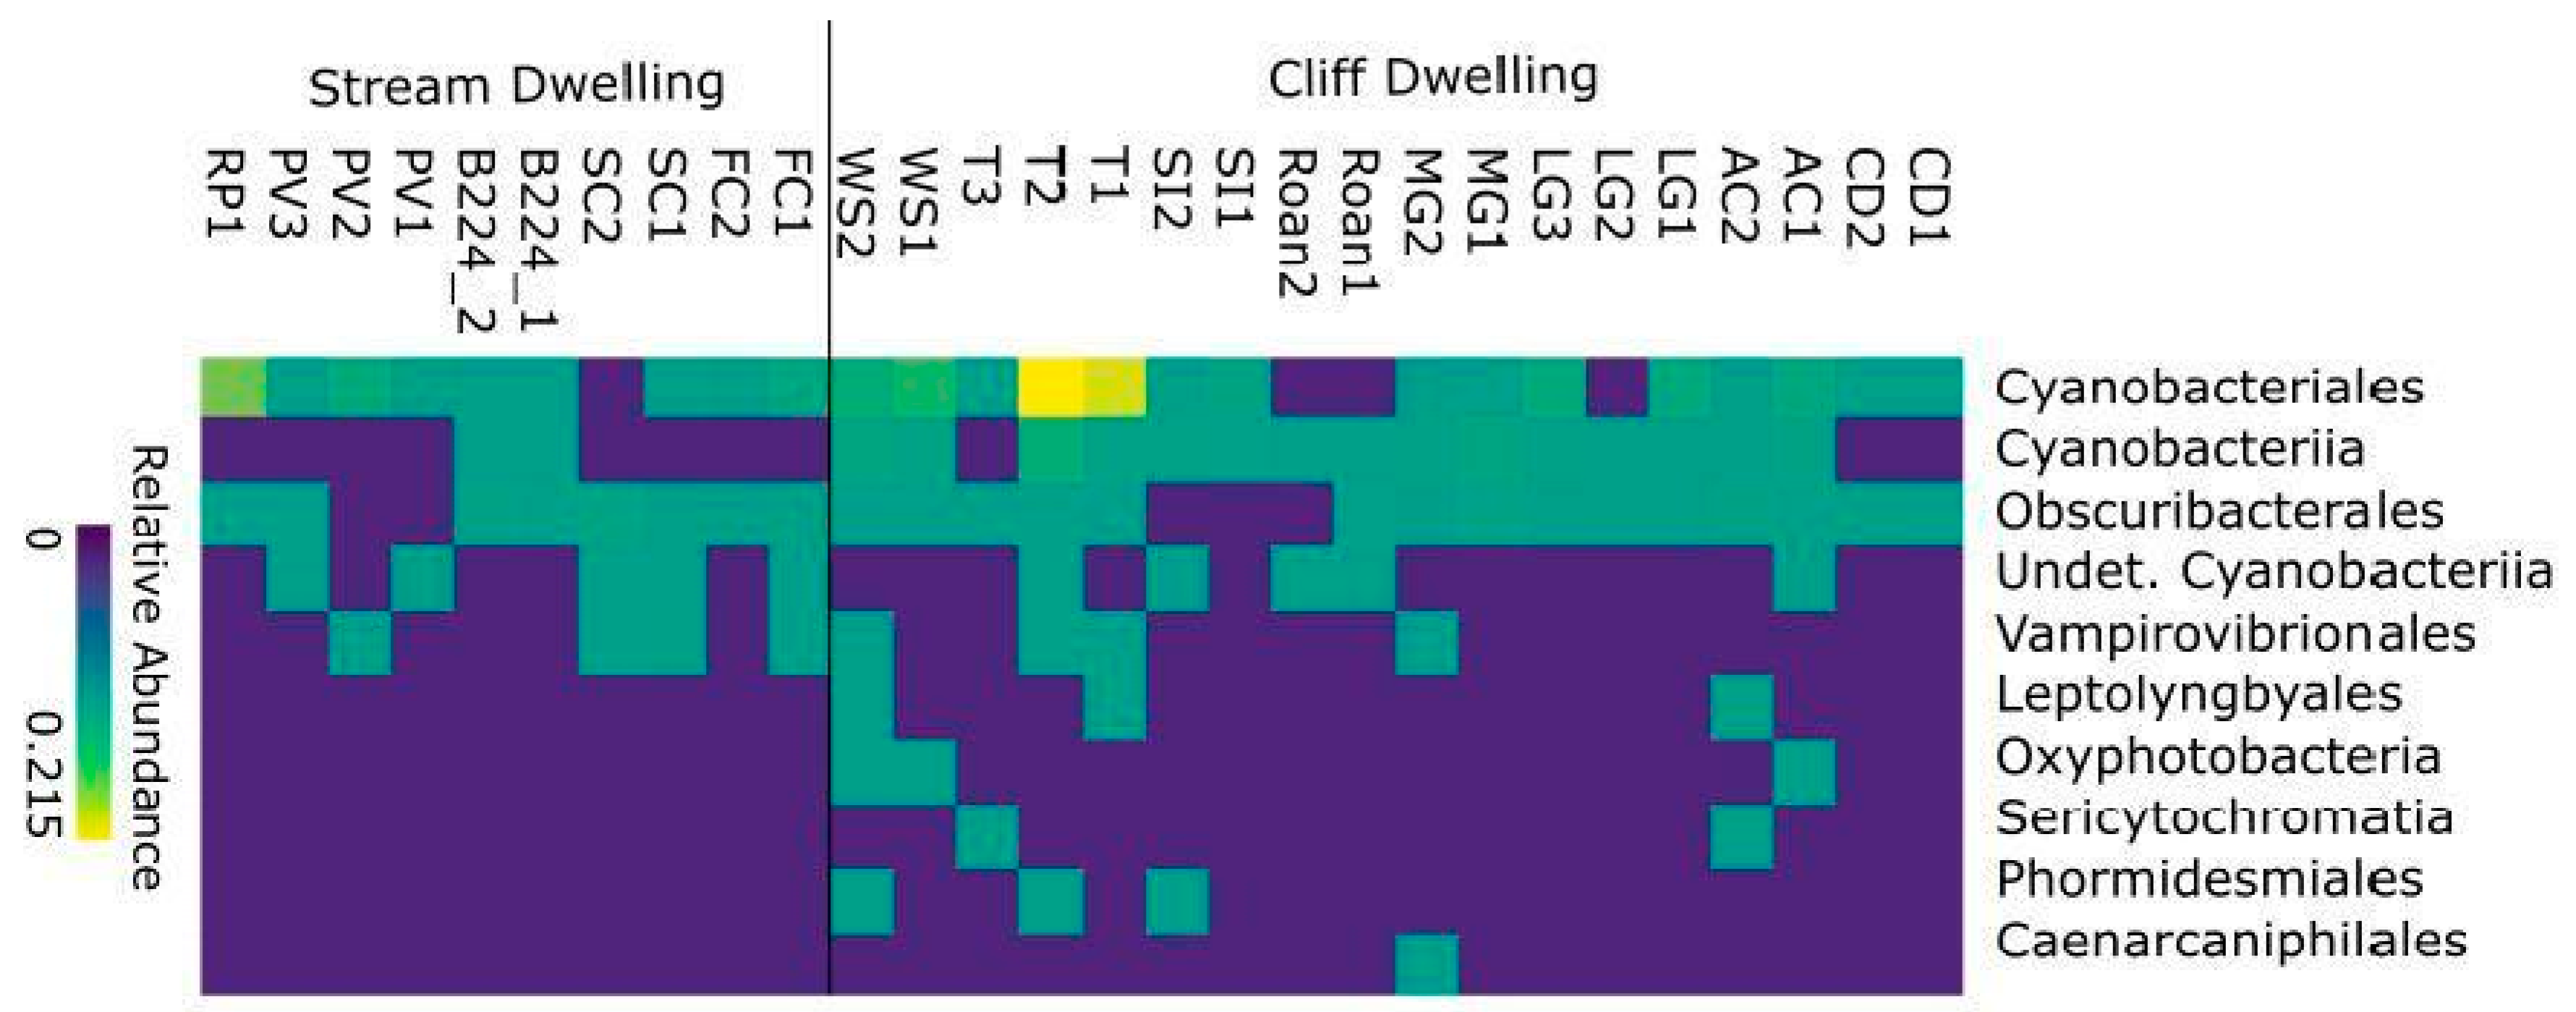
Data cleaning and taxonomy assignment yielded a substantial dataset of 1,453,712 demultiplexed reads. The average number of reads per sample was 51,918. A total of 1,176,440 reads remained in the dataset after denoising was completed with DADA2, with an average of 42,016 reads per sample. Proteobacteria and Acidobacteria were the most abundant bacterial phyla recovered in all samples (Figure 3; 37.8% ± 10.3 and 25.9% ± 6.0, respectively). In some samples, Chloroflexi and/or Cyanobacteria were also abundant members of the communities (10.2% ± 7.2 and 3.5% ± 5.8, respectively). Within Proteobacteria, Alphaproteobacteria was by far the most frequently recovered (29.7% ± 8.4), and Rhizobiales and Acetobacteriales were the two most abundant orders (7.1% ± 4.4 and 17.7% ± 5.9, respectively). Within Acidobacteria, Acidobacteriae dominated (25.8% ± 6), and Acidobacteriales and Bryobacteriales were the two most abundant orders (14.4% ± 5.6 and 8.6% ± 5.2, respectively). Most reads ascribable to Chloroflexi belonged to Ktedonobacteria (9.9% ± 7.2%). Cyanobacteria comprised a major proportion of the bacterial communities in some individuals and were nearly absent from others (Figure 3 and Figure 4; 0.1–25.5% relative abundance). Cyanobacteria largely belonged to Cyanobacteriia in the Cyanobacteriales (2.7% ± 5.4).

3.1. Core Microbiome

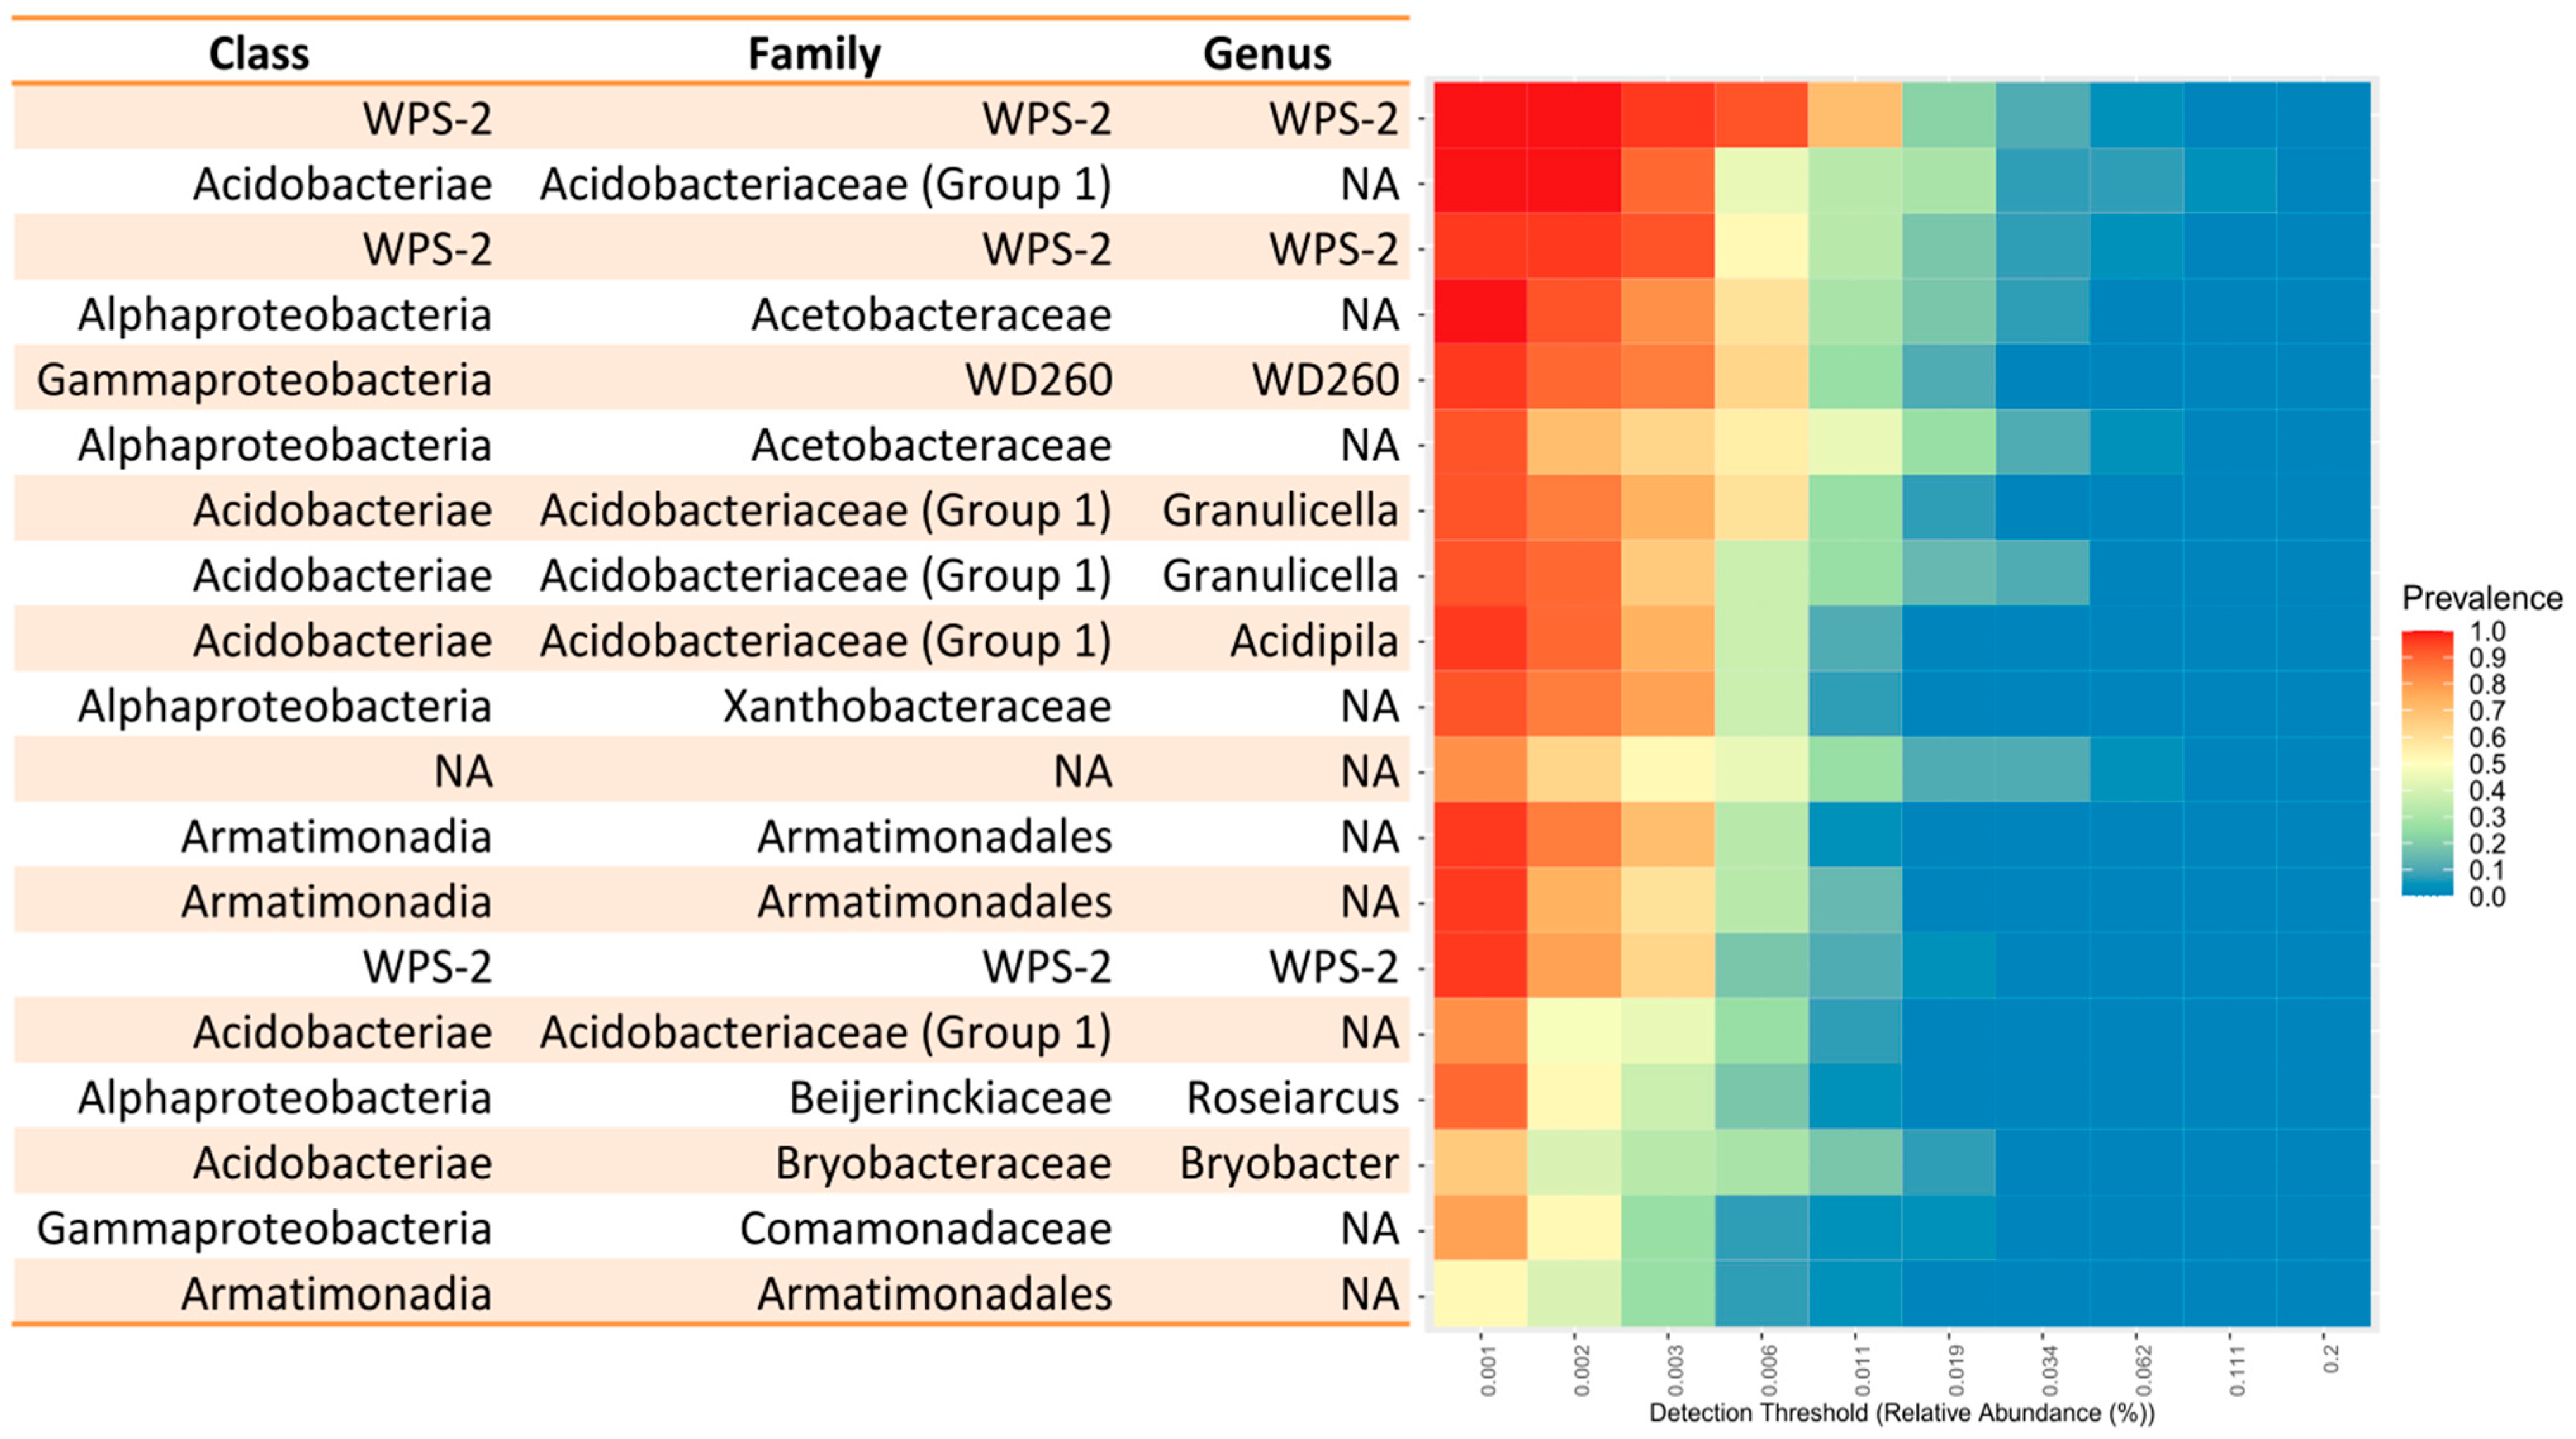
Twenty-eight samples of Cetradonia linearis yielded a total of 4161 bacterial ASVs. At a 90% threshold level, 19 ASVs were identified as core (Figure 5). At the 50% and 75% threshold levels, 115 and 42 ASVs were identified as core, respectively (Supplementary Figures S1 and S2). ASVs from the families Acidobacteraceae and Acetobacteraceae as well as the phylum WPS-2 were the most prevalent ASVs identified at each threshold level (Figure 5; Supplementary Figures S1 and S2). Two Cyanobacterial ASVs, identified as Vampirivibrionia/Obscuribacterales and Cyanobacteriales/Chroococcidiopsaceae, were core constituents of the microbiome at the 50% threshold. No Cyanobacterial ASV was identified as core at the 75% and 90% threshold levels. Across thresholds, the proportion of the total microbiome that was comprised of ASVs identified as core varied among individual samples, but the patterns of relative core abundance were visible when samples were organized according to mountain range (Table 1). The majority of the samples from the Balsams and Roan Mountain ranges remained in the upper two quartiles at all three threshold levels, whereas the majority of samples from the Nantahala and Smokies ranges remained in the lower two quartiles (Table 1).
We conducted a BLAST search on the sequences of the core ASVs identified at the 90% threshold to look for more accurate identifications. The publications from which the top BLAST hit was derived were also noted in Supplementary Table S2 [64,65,66,67,68], [GenBank Accessions FJ625309.1, ON749377.1, ON749382.1, JX967334.1, LC076744.1, AY523615.1, KY876095.1]. Although many of the BLAST search results did not improve our taxonomic classifications, many of the top search results for each ASV were matched with relevant studies in arctic environments or of other lichens (Supplementary Table S2). One ASV, which was present at a low abundance of 0.006% in 50% of the samples, was not assigned to any taxonomic ranking using the silva classifier matched to the Alphaproteobacteria ASV from a study of the microbial community of Cladonia arbuscula, with a percent identity of 98.96%.

3.2. Factors Influencing Diversity and Community Composition

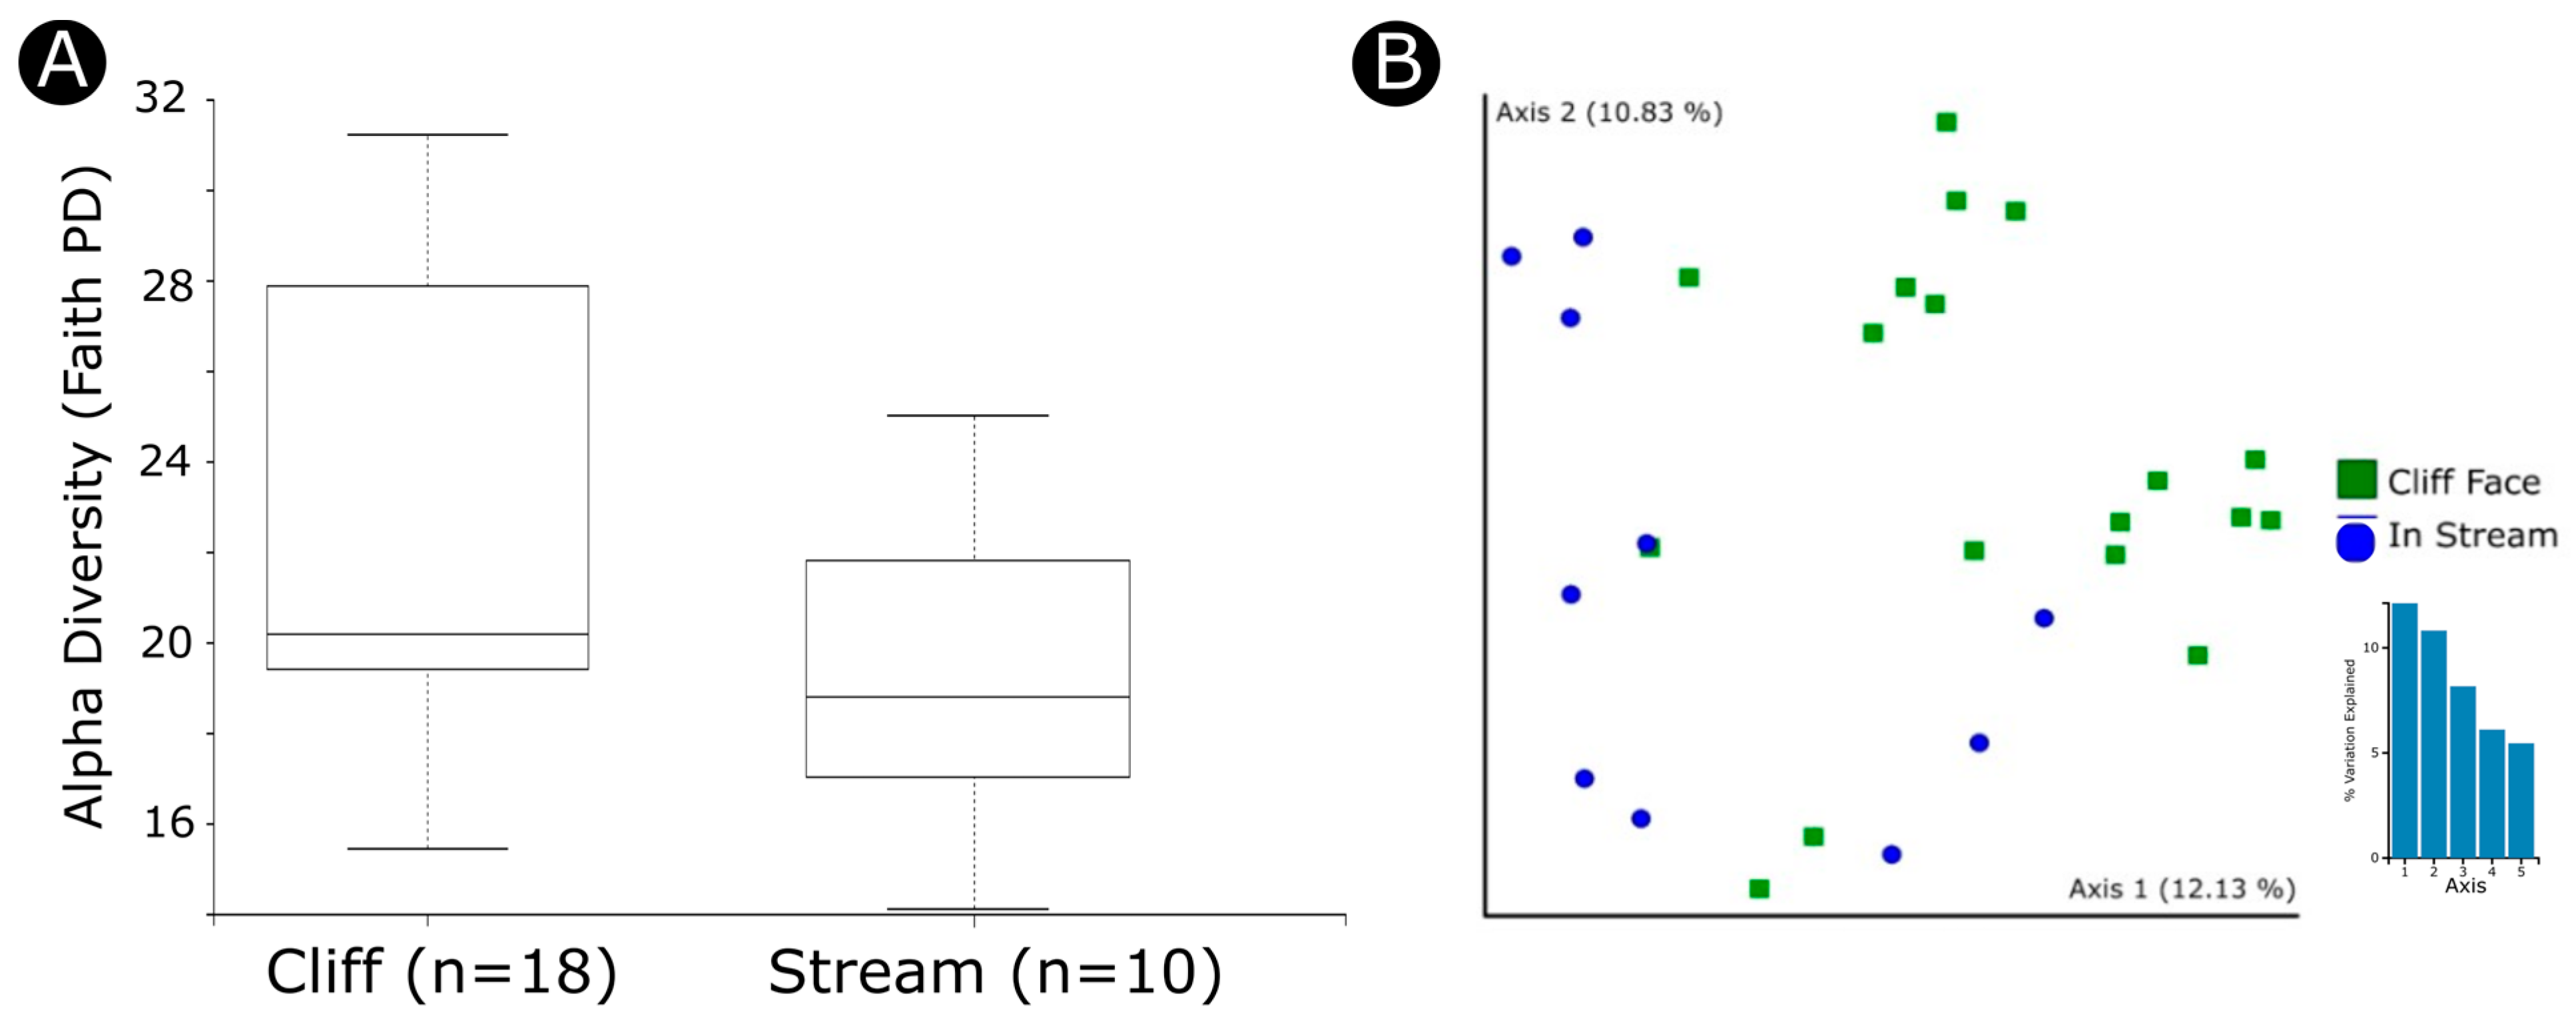
Habitat, climate, and geographic distance influenced bacterial community diversity and composition. Bacterial communities showed significant geographic structure among both sites and mountain ranges (PERMANOVA, p-value = 0.001, mountain range PERMANOVA, p-value = 0.004; Table 2). Bacterial communities in cliff-dwelling individuals were significantly more diverse than those in streams (Kruskal-Wallis, p-value = 0.049; Figure 6A; Table 3). Further, based on Bray-Curtis dissimilarities, individuals within each habitat category were significantly less dissimilar to each other than to the other category (PERMANOVA, p-value = 0.001; Figure 6B, Table 2). There was a positive correlation between the difference in mean temperature of the warmest quarter and all beta diversity metrics (Mantel test, r = 0.214218, p-value = 0.001; Table 4). There were no significant correlations between alpha diversity and other climatic variables (Table 5).

4. Discussion

The stability and efficiency of a symbiotic relationship is driven by co-evolutionary forces that enable both host and symbiont to adapt to changing conditions rapidly and effectively [69]. Recent developments in our understanding of how microbial symbiosis impacts host health and fitness have caused us to update management practices to integrate a meta-organismal approach to conservation [2]. This is especially prudent in the face of increasing extinction threats, as there are many groups of symbiotic organisms that are currently facing extinction [70]. Previous studies of lichen-associated microbial communities have supported both the predominance of environmental influence and host specificity [34,37,38,39,40,41]. In this study, we aimed to better understand the diversity of microbial communities in the endangered rock gnome lichen Cetradonia linearis. Building upon previous studies of more derived lineages in Cladoniaceae, we prioritized examining the co-evolutionary relationships between microbial symbionts and lichens. We also discussed the role of the microbiome in conservation, with an emphasis on how that applies to lichens. The results of this study supported both significant environmental impacts as well as evidence of bacterial host specificity in the family Cladoniaceae.

4.1. Dominant Groups in the Microbiome of Cetradonia linearis Are Consistent with Previous Reports in the Family Cladoniaceae

In previous studies, several groups of bacteria have been identified as prominent microbial symbionts in a diverse array of lichen species. Bates et al. (2011) [32] sequenced 16 samples of four lichen species across three families and found that the microbiomes of these lichens were all dominated by Alphaproteobacteria. This is consistent with the data from Cetradonia linearis, which was also dominated by Alphaproteobacteria (Figure 3). Unique to C. linearis was a high abundance of the phylum Acidobacteria, ranging from 20% to 30% or greater of the microbiome of any given sample; for comparison, none of the selected species from Bates et al. (2011) [32] exceeded 20% relative abundance of Acidobacteria. Other data from the squamulose cup-bearing lichens in the family Cladoniaceae continue this trend, as Acidobacteria is consistently identified as the second most abundant bacterial phylum present in the microbiome of the thallus [32,71,72]. The observed pattern of diversity in specific groups of bacteria within Cladoniaceae supports a certain degree of host specificity for bacterial symbionts in this family. Studies of other lichen families may reveal distinctive patterns of bacterial constituent diversity across broad taxonomic groups.
We found that some of the core ASVs in Cetradonia linearis were shared among other members of Cladoniaceae. Because C. linearis is the earliest diverging lineage in the family, Ref. [44] shared ASVs suggest a long-term stable association with specific bacteria. After identifying the core set of microbes with a 90% threshold, DNA sequences of corresponding ASVs were searched against the whole NCBI nucleotide database using rBLAST (Supplementary Table S2). Several of the ASVs returned matches with lichen-related sequencing efforts, and a few returned studies on Cladonia sp. specifically. One of the core identified ASVs matched an Alphaproteobacterium identified in a study of Cladonia arbuscula [73]. A large proportion of the remaining ASVs closely matched sequences from microbial consortia in arctic and boreal environments, which are the centers of diversity for Cladoniaceae ([63,64,65], GenBank Accession JX967334.1). Host specificity of lichen-associated microbial symbionts is generally understood through phylum-level diversity, but this result calls for further investigation into fine, detailed analyses of the specific microbes associated with particular lichen species.
Comparing the microbiome of C. linearis with another Cladoniaceae species of a different morphotype revealed some similarities but also significant differences. Alonso-García and Villarreal A. (2022) [37] sequenced the microbiomes of C. stellaris, which are the Cladina morphotype, in northern and southern boreal forests of Eastern North America. Similar to C. linearis, Proteobacteria was a dominant phylum present in all of the samples. Acidobacteria also comprised a substantial proportion of the microbial reads. Unlike C. linearis, the core microbiome of C. stellaris, when analyzed with a 50% threshold, was composed of two major families: the Beijerinckiaceae and the Acetobacteraceae. The core microbiome of C. linearis contained reads from both of these families, as well as a diverse array of bacteria in other families; no one bacterial family dominated the core microbiome (Figure 5). Despite these marked differences, the microbial communities of C. stellaris and C. linearis are both geographically structured and dominated by Proteobacteria. The two species occupy different habitat types, which likely contributes to the diverging microbiome composition. Further studies into the two distinct groups in the family Cladoniaceae may provide insight into the effects that morphological differences have on community structure and function and vice versa.
Cyanobacteria were observed growing on the exterior of some individuals in the field. While the growth of algae that may or may not be a photosynthetic symbiont on the surface of lichens is a phenomenon that occurs frequently, it is unclear if or when the external diversity penetrates into the thallus of the lichen. In this case, despite selecting samples that were not overgrown by Cyanobacteria and performing a thorough cleaning step prior to DNA extraction and sequencing, they did comprise a substantial portion of the core microbiome (Figure 5; Supplementary Figure S1). These data suggest that the exterior-dwelling Cyanobacteria may be able to enter the interior of the lichen, and it remains to be determined if this could serve as a mode of additional symbiont acquisition. Microscopic investigations are required to confirm the presence of Cyanobacteria in internal portions of the thallus, as they could instead be associated with the thallus cortices. To our knowledge, no other studies have documented this level of excessive growth of a potential photobiont on the exterior of a lichen thallus and linked it to potential internal occurrence. Further field and microscopy studies are needed to characterize the occurrence and frequency of such an event.

4.2. Both Mycobiont and Bacterial Communities Are Geographically Structured

Our analyses revealed geographical structure to the bacterial communities of C. linearis across sample sites and mountain ranges (Table 2). Relative abundances of the major groups of bacteria in the microbiome differed across sample sites to varying degrees, and sampling sites within the same mountain range showed similarity in relative abundances (Figure 3). This result is reflective of a previous study on the genomic diversity of C. linearis populations, which revealed low rates of recombination and strong geographic structure resulting from populations that are isolated by distance [46]. Sites from this study that were identified to have the highest proportion of shared genetic diversity, the Roan Highlands and Balsam Mountain ranges, were both placed in the highest quartile in terms of the proportion of core microbiome constituents in these samples, suggesting a shared microbial community structure (Table 1). While other studies have demonstrated geographic structure in lichen microbiomes and lichens separately [37,41], the connections between the genomic structure of the host and the structure of the microbiome have not been extensively studied. Previous studies have, however, demonstrated that the microbiome can be co-dispersed via lichen propagules, which could be one explanation for recovering significant geographic structure among the communities [36]. Whether the genetic diversity of C. linearis influences microbial diversity or if this is simply an effect of the isolated populations is unclear. In other studies on endangered organisms with isolated populations, impacts on the microbial diversity of physiologically important biofilms have been observed [8,74,75], but it was assumed that these effects are due to habitat degradation, dietary restrictions, human interferences associated with conservation management, and other stress factors. More in-depth studies on the population-level genetic diversity of the host and symbionts are needed in order to explain the connections between host genetic diversity and microbiome diversity.

4.3. Environmental Factors Significantly Impact the Bacterial Microbiome

We demonstrated habitat specificity in the microbial communities of C. linearis in terms of both diversity and community composition (Table 2 and Table 3; Figure 6B). Across the two habitats that C. linearis occupies, cliff faces and boulders in streams, differing environmental conditions, such as relative humidity, substrate type, and sun/wind exposure, could have caused the observed impacts on microbial communities. Studies on soil and cryptoendolithic biota have identified temperature, UV exposure, and substrate type as significant factors impacting the diversity and structure of bacterial communities [76,77,78]. In lichens, environmental influences on the bacteriome have been investigated across environmental gradients and distinct habitat types [37,79]. Even on extremely fine scales, differences in sunlight and moisture exposure can affect microbial communities residing in different parts of a single thallus, as identified by Noh et al. (2020) [71] in Cladonia squamosa. Although the data collected here are insufficient to identify which specific factors of each habitat contributed to the observed effects on the microbial communities of C. linearis, our results provide support for the general trend of environmental factors significantly impacting the bacteriome of lichens.
We found that the mean temperature of the warmest quarter, which varied among the sites, significantly influenced the beta diversity of C. linearis (Table 4). The samples in this study were collected during the warmest quarter of the year. Temporal shifts of the bacterial communities in lichens are not well studied, but in symbiotic corals, this relationship has been extensively researched [80,81,82]. Corals are susceptible to high oceanic temperatures driven by climate change, resulting in the breakdown of the symbiosis and, ultimately, coral death [83]. Studies on coral microbiomes revealed that the bacteriome plays roles in immune defense and heat tolerance, with direct impacts on host health and adaptability [84,85]. Functional gene analysis and metagenomic studies have revealed that the lichen microbiome has a potentially significant role in thallus maintenance and adaptability, with genes involved in nitrogen fixation, potassium metabolism, vitamin production, pathogen antagonism, and others being attributable to specific bacterial taxa [86,87,88,89,90]. In lichens, further investigation is needed to understand the environmental and temporal impacts on microbial communities and, from there, the potential for the bacteriome to facilitate host adaptations in a globally changing environment. In addition, the previously identified functional roles that microbes play in the lichen symbiosis increase the need for in-depth understanding of the importance of the microbiome and microbial diversity to conservation in this group. Further investigation of the relationship between host genetic diversity and microbiome diversity is needed to fully understand the potential implications that lichen-associated microbes have in the conservation of rare and endangered species.

5. Conclusions

Here we provide a holobiont perspective in support of the conservation of Cetradonia linearis based on the community composition of bacterial communities within thalli. Previous analysis of the C. linearis genome revealed geographically structured populations with strong isolation by distance [46]. This evidence has supported the continued conservation of this species, as the loss of any populations will result in a large loss of unique genetic diversity for the whole species. The microbial data in this study are congruent with the findings of Allen et al. (2018) [46], as we observed that different populations had differentiated microbiome structures, and the diversity was variable among the populations. In endangered and threatened species, genetic homogeneity in a population can reduce the capacity for adaptation to environmental change, increasing the risk of extinction for the group [91]. In multi-species associations, the consequences of genetic homogenization can be buffered by microbial diversity [92,93,94]. In multiple systems, microbiomes have been observed to have an important role in promoting fitness adaptations to the host [12,19,20,81,82], and microbiome dysbiosis has documented negative effects [95,96,97]. Thus, maintenance of both microbiome diversity and dominant symbiont genetic diversity is essential to supporting the long-term survival of species. In C. linearis, due to the congruence in forces shaping mycobiont genetic diversity and microbiome diversity, we suggest that conservation actions that maintain all known populations will likely mutually support all partners in the symbiosis.

Supplementary Materials

The following supporting information can be downloaded at: https://www.mdpi.com/article/10.3390/d16030178/s1, Figure S1: Core Heatmap (50); Figure S2: Core Heatmap (75); Table S1: Environmental Variable Values; Table S2: Core Taxa Blast Results.

Author Contributions

J.P. wrote and edited the manuscript and analyzed data, J.L.A. acquired the funding and collection permits, designed the project, conducted the field and laboratory work, analyzed the data, and wrote and edited the manuscript, N.M. conducted the laboratory work and analyzed the data, J.D. conducted the field work and edited the manuscript, J.B.W. aided with the data analyses and edited the manuscript, and S.E.A. designed the project, acquired the funding, and edited the manuscript. All authors have read and agreed to the published version of the manuscript.

Funding

Funding for this research was provided by the National Science Foundation Graduate Research Program awarded to J.L.A., NSF DEB #2115191 to J.L.A., and Highlands Biological Station.

Institutional Review Board Statement

Not applicable.

Data Availability Statement

Raw data are available for download from the National Center for Biotechnology Information BioProject PRJNA1076914.

Acknowledgments

Support from Gary Kauffman, Chris Ulrey, and James Lendemer were invaluable for completing the field work for this project, and we especially appreciate their aid in acquiring all required collecting permits. We are also grateful for field work assistance from Alex Cecil.

Conflicts of Interest

The authors declare no conflict of interest.

References

  1. Redford, K.H.; Segre, J.A.; Salafsky, N.; del Rio, C.M.; McAloose, D. Conservation and the Microbiome. Conserv. Biol. 2012, 26, 195–197. [Google Scholar] [CrossRef]
  2. Carthey, A.J.R.; Blumstein, D.T.; Gallagher, R.V.; Tetu, S.G.; Gillings, M.R. Conserving the holobiont. Funct. Ecol. 2019, 34, 764–776. [Google Scholar] [CrossRef]
  3. Loiola, M.; Silva, A.E.T.; Krull, M.; Barbosa, F.A.; Galvão, E.H.; Patire, V.F.; Cruz, I.C.S.; Barros, F.; Hatje, V.; Meirelles, P.M. Mangrove microbial community recovery and their role in early stages of forest recolonization within shrimp ponds. Sci. Total Environ. 2023, 855, 158863. [Google Scholar] [CrossRef]
  4. Zheng, F.; Mou, X.; Zhang, J.; Zhang, T.; Xia, L.; Yin, S.; Wu, L.; Leng, X.; An, S.; Zhao, D. Gradual Enhancement of the Assemblage Stability of the Reed Rhizosphere Microbiome with Recovery Time. Microorganisms 2022, 10, 937. [Google Scholar] [CrossRef] [PubMed]
  5. Dove, N.C.; Klingeman, D.M.; Carrell, A.A.; Cregger, M.A.; Schadt, C.W. Fire alters plant microbiome assembly patterns: Integrating the plant and soil microbial response to disturbance. New Phytol. 2021, 230, 2433–2446. [Google Scholar] [CrossRef] [PubMed]
  6. Coban, O.; De Deyn, G.B.; Van Der Ploeg, M. Soil microbiota as game-changers in restoration of degraded lands. Science 2022, 375, abe0725. [Google Scholar] [CrossRef]
  7. Liddicoat, C.; Siegfried, K.L.; Bissett, A.; Borrett, R.J.; Ducki, L.C.; Peddle, S.D.; Bullock, P.; Dobrowolski, M.P.; Grigg, A.; Tibbett, M.; et al. Next generation restoration metrics: Using soil eDNA bacterial community data to measure trajectories towards rehabilitation targets. J. Environ. Manag. 2022, 310, 114748. [Google Scholar] [CrossRef]
  8. Perry, E.K.; Digby, A.; Taylor, M.W. The Low-Diversity Fecal Microbiota of the Critically Endangered Kākāpō is Robust to Anthropogenic Dietary and Geographic Influences. Front. Microbiol. 2017, 8, 2033. [Google Scholar] [CrossRef]
  9. Waite, D.W.; Deines, P.; Taylor, M.W. Gut Microbiome of the Critically Endangered New Zealand Parrot, the Kakapo (Strigops habroptilus). PLoS ONE 2012, 7, e35803. [Google Scholar] [CrossRef]
  10. West, A.G.; Digby, A.; Lear, G.; Kākāpō Recovery Team; Kākāpō Aspergillosis Research Consortium; Taylor, M.W. Influence of management practice on the microbiota of a critically endangered species: A longitudinal study of kākāpō chick feces and associated nest litter. Anim. Microbiome 2022, 4, 55. [Google Scholar] [CrossRef]
  11. Jiménez, R.R.; Carfagno, A.; Linhoff, L.; Gratwicke, B.; Woodhams, D.C.; Chafran, L.S.; Bletz, M.C.; Carly, B.B.; Muletz-Wolz, R. Inhibitory Bacterial Diversity and Mucosome Function Differentiate Susceptibility of Appalachian Salamanders to Chytrid Fungal Infection. Appl. Environ. Microbiol. 2022, 88, e01818-21. [Google Scholar] [CrossRef]
  12. Walke, J.B.; Belden, L.K. Harnessing the Microbiome to Prevent Fungal Infections: Lessons from Amphibians. PLoS Pathog. 2016, 12, e1005796. [Google Scholar] [CrossRef] [PubMed]
  13. Goulet, T.L. Most corals may not change their symbionts. Mar. Ecol. Prog. Ser. 2006, 321, 1–7. [Google Scholar] [CrossRef]
  14. Buerger, P.; Alvarez-Roa, C.; Coppin, C.W.; Pearce, S.L.; Chakravarti, L.J.; Oakeshott, J.G.; Edwards, O.R.; Van Oppen, M.J.H. Heat-evolved microalgal symbionts increase coral bleaching tolerance. Sci. Adv. 2020, 6, eaba2498. [Google Scholar] [CrossRef] [PubMed]
  15. Phillips, R.D.; Reiter, N.; Peakall, R. Orchid conservation: From theory to practice. Ann. Bot. 2020, 126, 345–362. [Google Scholar] [CrossRef]
  16. Huang, Y.-Y.; Carballo-Bolaños, R.; Kuo, C.-Y.; Keshavmurthy, S. Leptoria phrygia in Southern Taiwan shuffles and switches symbionts to resist thermal-induced bleaching. Sci. Rep. 2020, 10, 7808. [Google Scholar] [CrossRef]
  17. Tian, F.; Liao, X.-F.; Wang, L.-H.; Bai, X.-X.; Yang, Y.-B.; Luo, Z.-Q.; Yan, F.-X. Isolation and identification of beneficial orchid mycorrhizal fungi in Paphiopedilum barbigerum (Orchidaceae). Plant Signal. Behav. 2021, 17, 2005882. [Google Scholar] [CrossRef]
  18. Masako, F.; Chihiro, M.; Tatsuki, Y.; Shintaro, K.; Kenji, S.; Takahiro, Y.; Masahide, Y.; Hironori, K. Relative effectiveness of Tulasnella fungal strains in orchid mycorrhizal symbioses between germination and subsequent seedling growth. Symbiosis 2020, 81, 53–63. [Google Scholar]
  19. Altinkaynak, H.; Ozkoc, I. Isolation and molecular characterization of plant growth promoting bacteria from the rhizosphere of orchids in Turkey. Rhizosphere 2020, 16, 100280. [Google Scholar] [CrossRef]
  20. Herrera, H.; Sanhueza, T.; Novotná, A.; Charles, T.C.; Arriagada, C. Isolation and Identification of Endophytic Bacteria from Mycorrhizal Tissues of Terrestrial Orchids from Southern Chile. Diversity 2020, 12, 55. [Google Scholar] [CrossRef]
  21. Kaur, J.; Sharma, J. Orchid Root Associated Bacteria: Linchpins or Accessories? Front. Plant Sci. 2021, 12, 661966. [Google Scholar] [CrossRef]
  22. Hawksworth, D.L.; Grube, M. Reflections on lichens as ecosystems. New Phytol. 2023, 241, 972–973. [Google Scholar] [CrossRef]
  23. Sanders, W.B. The disadvantages of current proposals to redefine lichens. New Phytol. 2023, 241, 969–971. [Google Scholar] [CrossRef]
  24. Jüriado, I.; Kaasalainen, U.; Jylhä, M.; Rikkinen, J. Relationships between mycobiont identity, photobiont specificity and ecological preferences in the lichen genus Peltigera (Ascomycota) in Estonia (northeastern Europe). Fungal Ecol. 2019, 39, 45–54. [Google Scholar] [CrossRef]
  25. Leavitt, S.D.; Kraichak, E.; Vondrak, J.; Nelsen, M.P.; Sohrabi, M.; Perez-Ortega, S.; Clair, L.L.S.; Lumbsch, H.T. Cryptic diversity and symbiont interactions in rock-posy lichens. Mol. Phylogenet. Evol. 2016, 99, 261–274. [Google Scholar] [CrossRef]
  26. Steinová, J.; Škaloud, P.; Yahr, R.; Bestová, H.; Muggia, L. Reproductive and dispersal strategies shape the diversity of mycobiont-photobiont association in Cladonia lichens. Mol. Phylogenetics Evol. 2019, 134, 226–237. [Google Scholar] [CrossRef]
  27. Rolshausen, G.; Grande, F.D.; Sadowska-Deś, A.D.; Otte, J.; Schmitt, I. Quantifying the climatic niche of symbiont partners in a lichen symbiosis indicates mutualist-mediated niche expansions. Ecography 2018, 41, 1380–1392. [Google Scholar] [CrossRef]
  28. Cernava, T.; Aschenbrenner, I.A.; Soh, J.; Sensen, C.W.; Grube, M.; Berg, G. Plasticity of a holobiont: Desiccation induces fasting-like metabolism within the lichen microbiota. ISME J. 2019, 13, 547–556. [Google Scholar] [CrossRef] [PubMed]
  29. Fernández-Brime, S.; Muggia, L.; Maier, S.; Grube, M.; Wedin, M. Bacterial communities in an optional lichen symbiosis are determined by substrate, not algal photobionts. FEMS Microbiol. Ecol. 2019, 95, fiz012. [Google Scholar] [CrossRef]
  30. Aschenbrenner, I.; Cernava, T.; Berg, G.; Grube, M. Understanding Microbial Multi-Species Symbiosis. Front. Microbiol. 2016, 7, 180. [Google Scholar] [CrossRef]
  31. Cardinale, M.; Steinová, J.; Rabensteiner, J.; Berg, G.; Grube, M. Age, sun and substrate: Triggers of bacterial communities in lichens. Environ. Microbiol. Rep. 2011, 4, 23–28. [Google Scholar] [CrossRef]
  32. Bates, S.T.; Cropsey, G.W.G.; Caporaso, J.G.; Knight, R.; Fierer, N. Bacterial Communities Associated with the Lichen Symbiosis. Appl. Environ. Microbiol. 2011, 77, 1309–1314. [Google Scholar] [CrossRef]
  33. Hodkinson, B.; Lutzoni, F. A Microbiotic Survey of Lichen-Associated Bacteria Reveals a New Lineage from the Rhizobiales. Symbiosis 2009, 49, 163–180. [Google Scholar] [CrossRef]
  34. Cardinale, M.; Puglia, A.M.; Grube, M. Molecular analysis of lichen-associated bacterial communities. FEMS Microbiol. Ecol. 2006, 57, 484–495. [Google Scholar] [CrossRef]
  35. Grube, M.; Berg, G. Microbial consortia of bacteria and fungi with focus on the lichen symbiosis. Fungal Biol. Rev. 2009, 23, 72–85. [Google Scholar] [CrossRef]
  36. Aschenbrenner, I.; Cardinale, M.; Berg, G.; Grube, M. Microbial cargo: Do bacteria on symbiotic propagules reinforce the microbiome of lichens? Environ. Microbiol. 2014, 16, 3743–3752. [Google Scholar] [CrossRef] [PubMed]
  37. Alonso-Garcia, M.; Villarreal, J.C.A. Bacterial community of reindeer lichens differs between northern and southern lichen woodlands. Can. J. Forest Res. 2022, 52, 662–673. [Google Scholar] [CrossRef]
  38. Vijayakumar, V.R.; Saravanan, K.; Somasundaram, M.; Jayaraj, R.; Annamalai, P.; Nooruddin, T.; Dharumadurai, D. Metagenomic analysis of lichen-associated bacterial community profiling in Roccella montagnei. Arch. Microbiol. 2022, 204, 54. [Google Scholar] [CrossRef]
  39. Sierra, M.A.; Danko, D.C.; Sandoval, T.A.; Pishchany, G.; Moncada, B.; Kolter, R.; Mason, C.E.; Zambrano, M.M. The Microbiomes of Seven Lichen Genera Reveal Host Specificity, a Reduced Core Community and Potential as Source of Antimicrobials. Front. Microbiol. 2020, 11, 398. [Google Scholar] [CrossRef]
  40. West, N.J.; Parrot, D.; Fayet, C.; Grube, M.; Tomasi, S.; Suzuki, M.T. Marine cyanolichens from different littoral zones are associated with distinct bacterial communities. PeerJ 2018, 17, e5208. [Google Scholar] [CrossRef]
  41. Hodkinson, B.; Gottel, N.; Schadt, C.; Lutzoni, F. Photoautotrophic symbiont and geography are major factors affecting highly structured and diverse bacterial communities in the lichen microbiome. Environ. Microbiol. 2012, 14, 147–161. [Google Scholar] [CrossRef]
  42. U.S. Fish and Wildlife Service. Rock Gnome Lichen (Gymnoderma lineare) 5-Year Review: Summary and Evaluation. 2020. Available online: https://ecos.fws.gov/docs/five_year_review/doc6561.pdf (accessed on 9 March 2023).
  43. Allen, J.L.; Lendemer, J.C.; McMullin, T. Cetradonia linearis; The IUCN Red List of Threatened Species: Cambridge, UK, 2015. [Google Scholar] [CrossRef]
  44. Zhou, Q.-M.; Wei, J.-C.; Ahti, T.; Stenroos, S.; Högnabba, F. The systematic position of Gymnoderma and Cetradonia based on SSU rDNA sequences. J. Hattori Bot. Lab. 2006, 100, 871–880. [Google Scholar]
  45. Wei, J.; Ahti, T. Cetradonia, a new genus in the new family Cetradoniaceae (Lecanorales, Ascomycota). Lichenologist 2002, 34, 19–31. [Google Scholar] [CrossRef]
  46. Allen, J.L.; McKenzie, S.K.; Sleith, R.S.; Alter, S.E. First genome-wide analysis of the endangered, endemic lichen Cetradonia linearis reveals isolation by distance and strong population structure. Am. J. Bot. 2018, 105, 1556–1567. [Google Scholar] [CrossRef] [PubMed]
  47. Alonso-García, M.; Villarreal, A.J.C.; McFarland, K.; Goffinet, B. Population genomics and phylogeography of a clonal bryophyte with spatially separated sexes and extreme sex ratios. Front. Plant Sci. 2020, 11, 495. [Google Scholar] [CrossRef]
  48. Crespi, E.J.; Rissler, L.J.; Browne, R.A. Testing Pleistocene refugia theory: Phylogeographical analysis of Desmognathus wrighti, a high-elevation salamander in the southern Appalachians. Mol. Ecol. 2003, 12, 969–984. [Google Scholar] [CrossRef]
  49. Keith, R.; Hedin, M. Extreme mitochondrial population subdivision in southern Appalachian paleoendemic spiders (Araneae: Hypochilidae: Hypochilus), with implications for species delimitation. J. Arachnol. 2012, 40, 167–181. [Google Scholar] [CrossRef]
  50. Hijmans, R.J.; Van Etten, J.; Mattiuzzi, M.; Cheng, J.; Sumner, M.; Greenberg, J.A. Raster: Geographic Data Analysis and Modeling; R Package Version 2.9-23; R Core Team R Foundation for Statistical Computing: Viena, Austria, 2019. [Google Scholar]
  51. Hijmans, R.J.; Cameron, S.E.; Parra, J.L.; Jones, P.G.; Jarvis, A. Very high resolution interpolated climate surfaces for global land areas. Int. J. Climatol. 2005, 25, 1965–1978. [Google Scholar] [CrossRef]
  52. Yang, X.; Li, Y.; Niu, B.; Chen, Q.; Hu, Y.; Yang, Y.; Song, L.; Wang, J.; Zhang, G. Temperature and Precipitation Drive Elevational Patterns of Microbial Beta Diversity in Alpine Grasslands. Microb. Ecol. 2022, 84, 1141–1153. [Google Scholar] [CrossRef]
  53. Nottingham, A.T.; Fierer, N.; Turner, B.L.; Whitaker, J.; Ostle, N.J.; McNamara, N.P.; Bardgett, R.D.; Leff, J.W.; Salinas, N.; Silman, M.R.; et al. Microbes follow Humboldt: Temperature drives plant and soil microbial diversity patterns from the Amazon to the Andes. Ecology 2018, 99, 2455–2466. [Google Scholar] [CrossRef]
  54. Truu, M.; Ostonen, I.; Preem, J.-K.; Lõhmus, K.; Nõlvak, H.; Ligi, T.; Rosenvald, K.; Parts, K.; Kupper, P.; Truu, J. Elevated Air Humidity Changes Soil Bacterial Community Structure in the Silver Birch Stand. Front. Microbiol. 2017, 8, 557. [Google Scholar] [CrossRef]
  55. Li, H.; Yang, Q.; Li, J.; Gao, H.; Li, P.; Zhou, H. The impact of temperature on microbial diversity and AOA activity in the Tengchong Geothermal Field, China. Sci. Rep. 2015, 5, 17056. [Google Scholar] [CrossRef]
  56. Root, H.T.; McCune, B.; Jovan, S. Lichen communities and species indicate climate thresholds in southeast and south-central Alaska, USA. Bryologist 2014, 117, 241–252. [Google Scholar] [CrossRef]
  57. Pearson, L.C. Influence of Temperature and Humidity on Distribution of Lichens in a Minnesota Bog. Ecology 1969, 50, 740–746. [Google Scholar] [CrossRef]
  58. Vančurová, L.; Malíček, J.; Steinová, J.; Škaloud, P. Choosing the Right Life Partner: Ecological Drivers of Lichen Symbiosis. Front. Microbiol. 2021, 12, 769304. [Google Scholar] [CrossRef]
  59. Bolyen, E.; Rideout, J.R.; Dillon, M.R.; Bokulich, N.A.; Abnet, C.C.; Al-Ghalith, G.A.; Alexander, H.; Alm, E.J.; Arumugam, M.; Asnicar, F.; et al. Reproducible, interactive, scalable and extensible microbiome data science using QIIME 2. Nat. Biotechnol. 2019, 37, 852–857. [Google Scholar] [CrossRef]
  60. Callahan, B.J.; McMurdie, P.J.; Rosen, M.J.; Han, A.W.; Johnson AJ, A.; Holmes, S.P. DADA2: High-resolution sample inference from Illumina amplicon data. Nat. Methods 2016, 13, 581–583. [Google Scholar] [CrossRef]
  61. Quast, C.; Pruesse, E.; Yilmaz, P.; Gerken, J.; Schweer, T.; Yarza, P.; Peplies, J.; Glöckner, F.O. The SILVA ribosomal RNA gene database project: Improved data processing and web-based tools. Nucleic Acids Res. 2013, 41, D590–D596. [Google Scholar] [CrossRef]
  62. Shetty, S.; Lahti, L. Microbiomeutilities: Microbiomeutilities: Utilities for Microbiome Analytics; R Package Version 1.00.17; R Core Team R Foundation for Statistical Computing: Viena, Austria, 2022. [Google Scholar]
  63. Inkscape Project. Inkscape. 2020. Available online: https://inkscape.org (accessed on 9 March 2023).
  64. Zinger, L.; Shahnavaz, B.; Baptist, F.; Geremia, R.A.; Choler, P. Microbial diversity in alpine tundra soils correlates with snow cover dynamics. ISME J. 2009, 3, 850–859. [Google Scholar] [CrossRef]
  65. Schiff, S.L.; Tsuji, J.M.; Wu, L.; Venkiteswaran, J.J.; Molot, L.A.; Elgood, R.J.; Paterson, M.J.; Neufeld, J.D. Millions of Boreal Shield Lakes can be used to Probe Archaean Ocean Biogeochemistry. Sci. Rep. 2017, 7, 46708. [Google Scholar] [CrossRef]
  66. Yergeau, E.; Newsham, K.K.; Pearce, D.A.; Kowalchuk, G.A. Patterns of bacterial diversity across a range of Antarctic terrestrial habitats. Environ. Microbiol. 2007, 9, 2670–2682. [Google Scholar] [CrossRef]
  67. Sigurbjörnsdóttir, M.A.; Andrésson, Ó.S.; Vilhelmsson, O. Analysis of the Peltigera Membranacea Metagenome Indicates That Lichen-Associated Bacteria Are Involved in Phosphate Solubilization. Microbiology 2015, 161, 989–996. [Google Scholar] [CrossRef]
  68. Navarro-Noya, Y.E.; Jiménez-Aguilar, A.; Valenzuela-Encinas, C.; Alcántara-Hernández, R.J.; Ruíz-Valdiviezo, V.M.; Ponce-Mendoza, A.; Luna-Guido, M.; Marsch, R.; Dendooven, L. Bacterial Communities in Soil under Moss and Lichen-Moss Crusts. Geomicrobiol. J. 2013, 31, 152–160. [Google Scholar] [CrossRef]
  69. Hoang, K.L.; Choi, H.; Gerardo, N.M.; Morran, L.T. Coevolution’s conflicting role in the establishment of beneficial associations. Evolution 2022, 76, 1073–1081. [Google Scholar] [CrossRef]
  70. IUCN. The IUCN Red List of Threatened Species. Version 2022-2. 2022. Available online: https://www.iucnredlist.org (accessed on 9 March 2023).
  71. Noh, H.-J.; Lee, Y.M.; Park, C.H.; Lee, H.K.; Cho, J.-C.; Hong, S.G. Microbiome in Cladonia squamosa Is Vertically Stratified According to Microclimatic Conditions. Front. Microbiol. 2020, 11, 268. [Google Scholar] [CrossRef]
  72. Park, C.H.; Kim, K.M.; Kim, O.-S.; Jeong, G.; Hong, S.G. Bacterial communities in Antarctic lichens. Antarct. Sci. 2016, 28, 455–461. [Google Scholar] [CrossRef]
  73. Cardinale, M.; de Castro, J.V.; Müller, H.; Berg, G.; Grube, M. In situ analysis of the bacterial community associated with the reindeer lichen Cladonia arbuscula reveals predominance of Alphaproteobacteria. FEMS Microbiol. Ecol. 2008, 66, 63–71. [Google Scholar] [CrossRef]
  74. Yan, D.; Hu, D.; Li, K.; Li, B.; Zeng, X.; Chen, J.; Li, Y.; Wronski, T. Effects of Chronic Stress on the Fecal Microbiome of Malayan Pangolins (Manis javanica) Rescued from the Illegal Wildlife Trade. Curr. Microbiol. 2021, 78, 1017–1025. [Google Scholar] [CrossRef]
  75. Amato, K.R.; Kuthyar, S.; Ekanayake-Weber, M.; Salmi, R.; Snyder-Mackler, N.; Wijayathunga, L.; Vandercone, R.; Lu, A. Gut microbiome, diet, and conservation of endangered langurs in Sri Lanka. Biotropica 2020, 52, 981–990. [Google Scholar] [CrossRef]
  76. Mezzasoma, A.; Coleine, C.; Sannino, C.; Selbmann, L. Endolithic Bacterial Diversity in Lichen-Dominated Communities Is Shaped by Sun Exposure in McMurdo Dry Valleys, Antarctica. Microb. Ecol. 2022, 83, 328–339. [Google Scholar] [CrossRef]
  77. Shigyo, N.; Umeki, K.; Hirao, T. Seasonal Dynamics of Soil Fungal and Bacterial Communities in Cool-Temperate Montane Forests. Front. Microbiol. 2019, 10, 1944. [Google Scholar] [CrossRef]
  78. Du, C.; Xu, C.-Y.; Jian, J.-S.; He, W.-X.; Hou, L.; Geng, Z.-C. Seasonal dynamics of bacterial communities in a Betula albosinensis forest. Eur. J. Soil Sci. 2018, 69, 666–674. [Google Scholar] [CrossRef]
  79. Rolshausen, G.; Grande, F.D.; Otte, J.; Schmitt, I. Lichen holobionts show compositional structure along elevation. Mol. Ecol. 2022, 32, 6619–6630. [Google Scholar] [CrossRef]
  80. Yu, X.; Yu, K.; Liao, Z.; Chen, B.; Deng, C.; Yu, J.; Yao, Q.; Qin, Z.; Liang, J. Seasonal fluctuations in symbiotic bacteria and their role in environmental adaptation of the scleractinian coral Acropora pruinosa in high-latitude coral reef area of the South China Sea. Sci. Total Environ. 2021, 792, 148438. [Google Scholar] [CrossRef]
  81. Bulan, E.D.; Wilantho, A.; Krainara, P.; Viyakarn, V.; Chavanich, S.; Somboonna, N. Spatial and Seasonal Variability of Reef Bacterial Communities in the Upper Gulf of Thailand. Front. Mar. Sci. 2018, 5, 441. [Google Scholar] [CrossRef]
  82. Sharp, K.H.; Pratte, Z.A.; Kerwin, A.H.; Rotjan, R.D.; Stewart, F.J. Season, but not symbiont state, drives microbiome structure in the temperate coral Astrangia poculata. Microbiome 2017, 5, 120. [Google Scholar] [CrossRef]
  83. Goreau, T.J.F.; Hayes, R.L. Global warming triggers coral reef bleaching tipping point. Ambio 2021, 50, 1137–1140. [Google Scholar] [CrossRef]
  84. Ziegler, M.; Seneca, F.O.; Yum, L.K.; Palumbi, S.R.; Voolstra, C.R. Bacterial community dynamics are linked to patterns of coral heat tolerance. Nat. Commun. 2017, 8, 14213. [Google Scholar] [CrossRef]
  85. Kuek, F.W.I.; Lim, L.-F.; Ngu, L.-H.; Mujahid, A.; Lim, P.-T.; Leaw, C.-P.; Müller, M. The potential roles of bacterial communities in coral defense: A case study at Talang-talang reef. Ocean Sci. J. 2015, 50, 269–282. [Google Scholar] [CrossRef]
  86. Cernava, T.; Erlacher, A.; Aschenbrenner, I.A.; Krug, L.; Lassek, C.; Riedel, K.; Grube, M.; Berg, G. Deciphering Functional Diversification Within the Lichen Microbiota by Meta-omics. Microbiome 2017, 5, 82. [Google Scholar] [CrossRef]
  87. Cernava, T.; Müller, H.; Aschenbrenner, I.A.; Grube, M.; Berg, G. Analyzing the Antagonistic Potential of the Lichen Microbiome Against Pathogens by Bridging Metagenomic with Culture Studies. Front. Microbiol. 2015, 6, 620. [Google Scholar] [CrossRef]
  88. Cernava, T.; Vasfiu, Q.; Erlacher, A.; Francesconi, K.; Grube, M.; Berg, G. Adaptions of Lichen Microbiota Functioning Under Persistent Exposure to Arsenic Contamination. Front. Microbiol. 2018, 9, 2959. [Google Scholar] [CrossRef]
  89. Erlacher, A.; Cernava, T.; Cardinale, M.; Soh, J.; Sensen, C.W.; Grube, M.; Berg, G. Rhizobiales as functional and endosymbiotic members in the lichen symbiosis of Lobaria pulmonaria L. Front. Microbiol. 2015, 6, 53. [Google Scholar] [CrossRef]
  90. Grube, M.; Cernava, T.; Jung, S.; Fuchs, S.; Aschenbrenner, I.; Lassek, C.; Wegner, U.; Becher, D.; Riedel, K.; Sensen, C.W.; et al. Exploring functional contexts of symbiotic sustain within lichen-associated bacteria by comparative omics. ISME J. 2015, 9, 412–424. [Google Scholar] [CrossRef]
  91. Bijlsma, R.; Loeschcke, V. Genetic erosion impedes adaptive responses to stressful environments. Evol. Appl. 2012, 5, 117–129. [Google Scholar] [CrossRef]
  92. Henry, L.P.; Bruijning, M.; Forsberg, S.K.G.; Ayroles, J.F. The microbiome extends host evolutionary potential. Nat. Commun. 2021, 12, 5141. [Google Scholar] [CrossRef]
  93. Carthey, A.J.R.; Gillings, M.R.; Blumstein, D.T. The Extended Genotype: Microbially Mediated Olfactory Communication. Trends Ecol. Evol. 2018, 33, 885–894. [Google Scholar] [CrossRef]
  94. Zilber-Rosenberg, I.; Rosenberg, E. Role of microorganisms in the evolution of animals and plants: The hologenome theory of evolution. FEMS Microbiol. Rev. 2008, 32, 723–735. [Google Scholar] [CrossRef]
  95. Coelho, L.; Afonso, M.; Jesus, F.; Campos, I.; Abrantes, N.; Gonçalves, F.J.M.; Serpa, D.; Marques, S.M. Effects of Eucalypt ashes from moderate and high severity wildfires on the skin microbiome of the Iberian frog (Rana iberica). Environ. Pollut. 2022, 313, 120065. [Google Scholar] [CrossRef]
  96. MacKnight, N.J.; Cobleigh, K.; Lasseigne, D.; Chaves-Fonnegra, A.; Gutting, A.; Dimos, B.; Antoine, J.; Fuess, L.; Ricci, C.; Butler, C.; et al. Microbial dysbiosis reflects disease resistance in diverse coral species. Commun. Biol. 2021, 4, 679. [Google Scholar] [CrossRef]
  97. Maes, P.W.; Rodrigues, P.A.P.; Oliver, R.; Mott, B.M.; Anderson, K.E. Diet-related gut bacterial dysbiosis correlates with impaired development, increased mortality and Nosema disease in the honeybee (Apis mellifera). Mol. Ecol. 2016, 25, 5439–5450. [Google Scholar] [CrossRef]
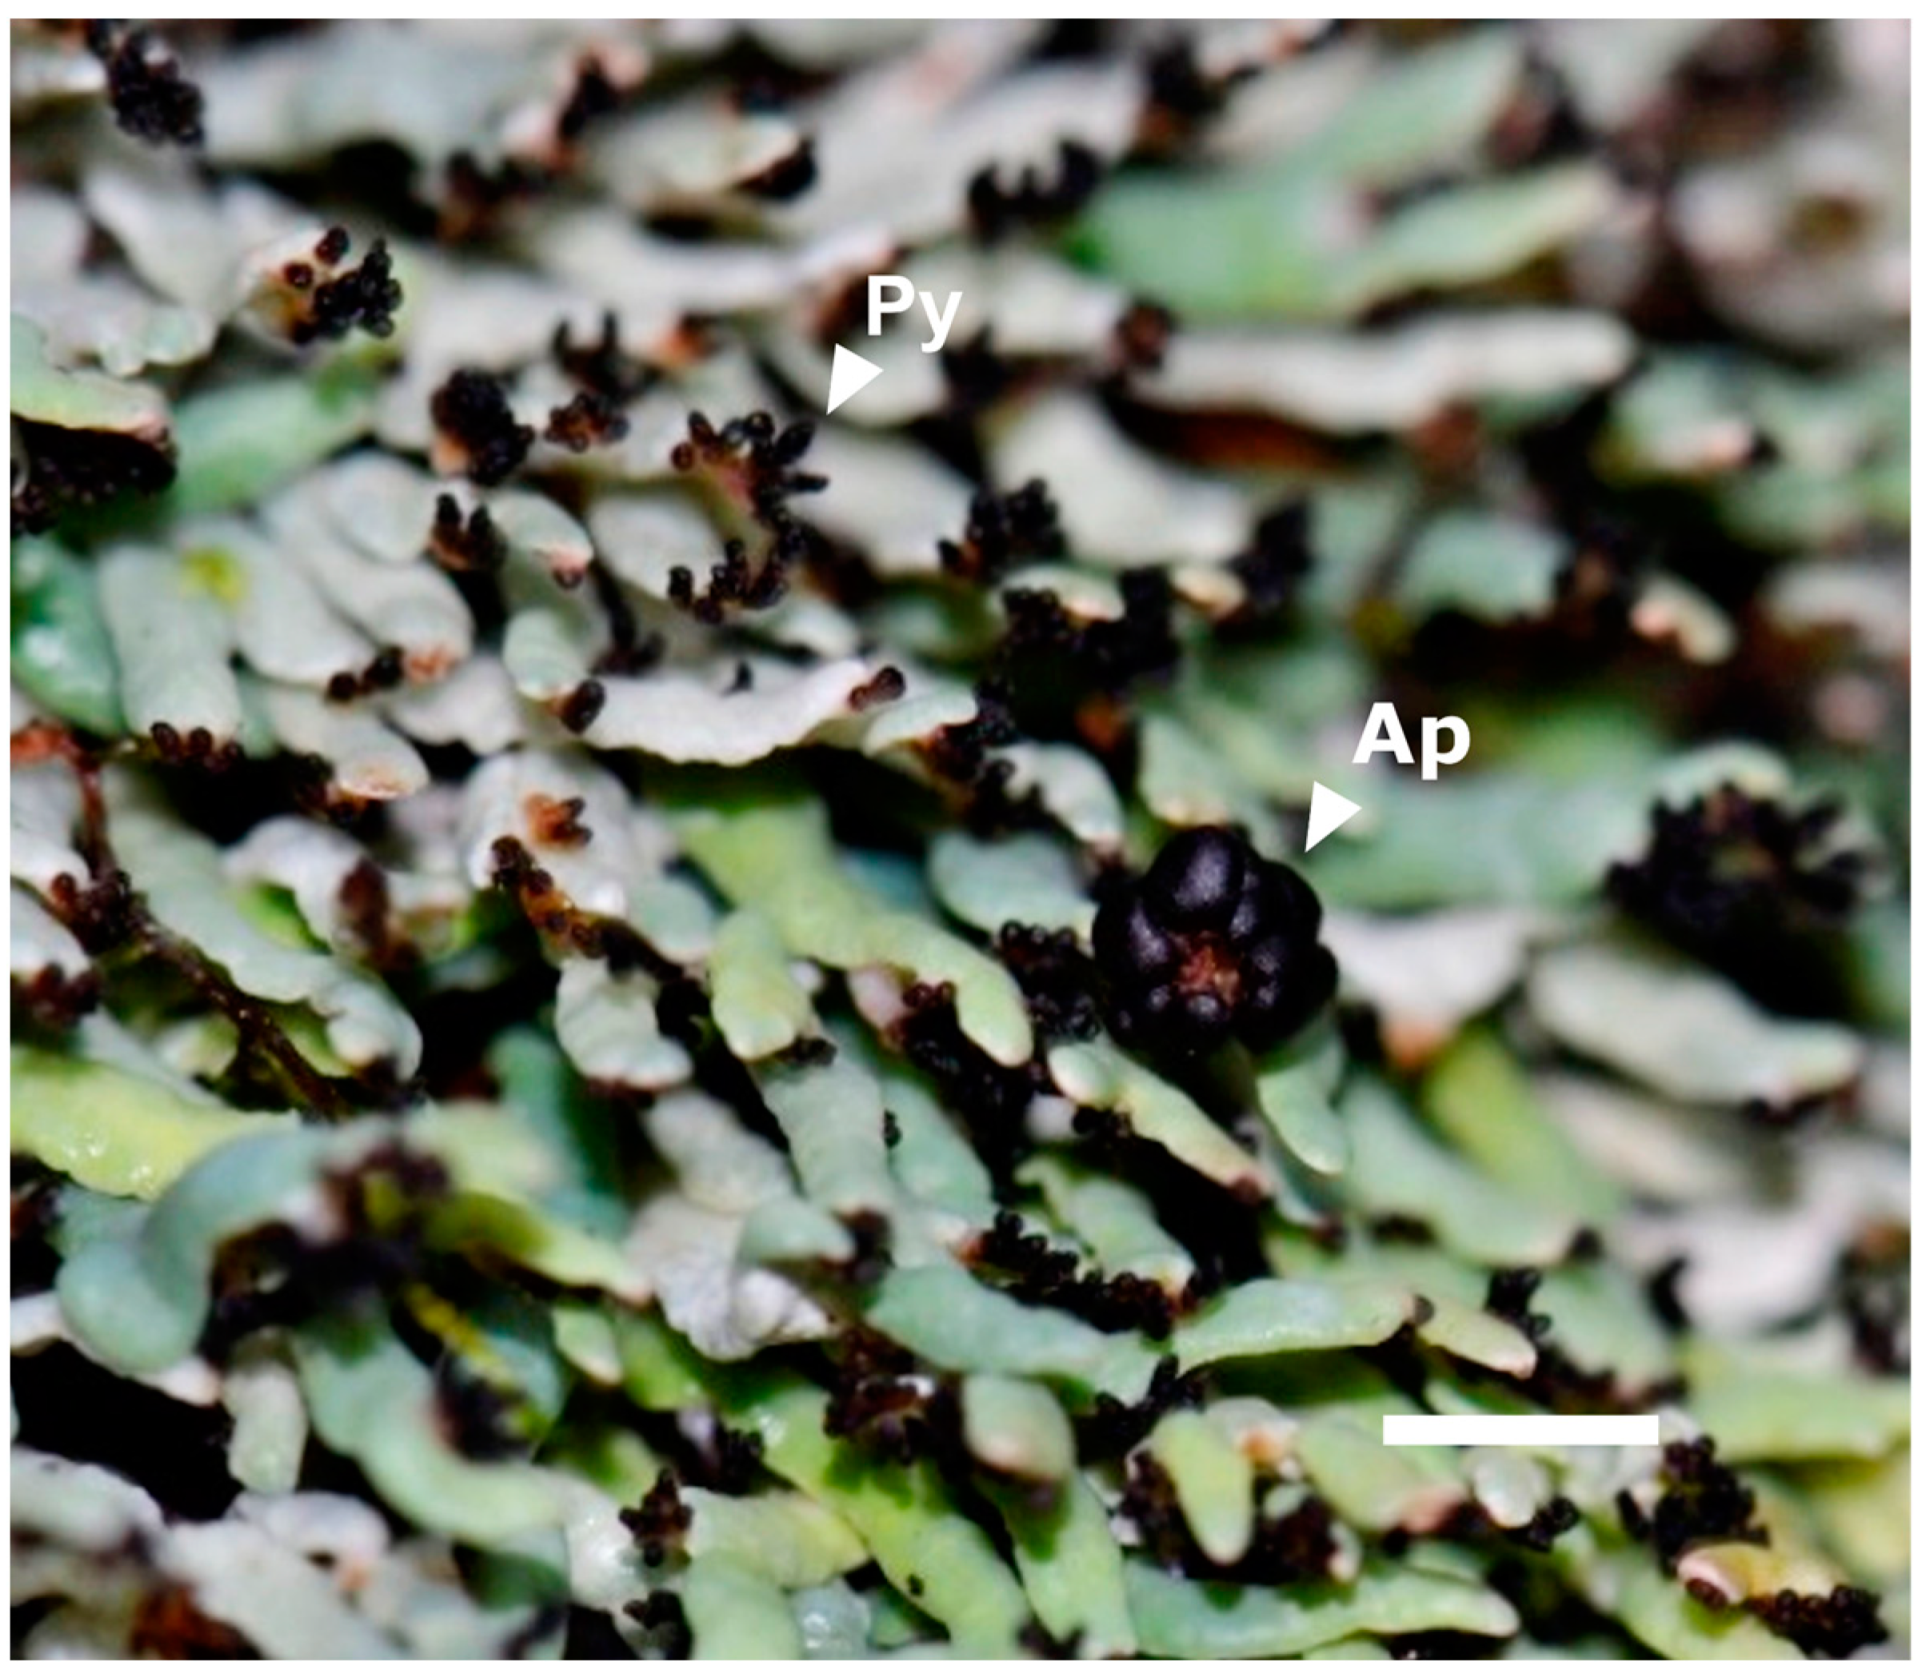
Figure 1. Cetradonia linearis overall habit showing the squamules comprising the main body of the lichen (green and white), sexual reproductive structures called apothecia (Ap), and asexual reproductive structures called pycnidia (Py). The scale bar in the bottom right corner is 3 mm long.
Diversity 16 00178 g001
Figure 2. Global distribution of Cetradonia linearis, showing sampled sites (white circles) and all known occurrences for the species (black circles). The majority of sites from which C. linearis has been documented are in North Carolina in the United States of America.
Diversity 16 00178 g002
Figure 3. Relative abundances of bacterial phyla with >0.1% mean abundance per sample and samples organized according to mountain range. All lineages with <0.1% relative abundances were removed from the dataset.
Diversity 16 00178 g003
Figure 4. Relative abundance of Cyanobacterial orders in sampled individuals. Abundances range from zero (dark purple) to 0.214 (bright yellow).
Diversity 16 00178 g004
Figure 5. Prevalence of the core constituents of the microbiome of Cetradonia linearis, defined as any bacterial ASV that was present at any abundance in at least 90% of the samples. Taxonomic assignments were deduced according to the Silva classifier and are shown on the left. Prevalences ranged from 0.0 (blue) to 1.0 (red) and refers to the proportion of samples that contained an ASV at a given detection threshold, indicated by the X-axis.
Diversity 16 00178 g005
Figure 6. Habitat strongly shapes bacterial diversity and community structure. (A) Bacterial communities in cliff-dwelling individuals were more diverse than those in streams (cliff n = 18, stream n = 10, Kruskal-Wallis, p-value = 0.049). (B) Bacterial communities in each habitat type were significantly different from each other (PERMANOVA, p-value = 0.001).
Diversity 16 00178 g006
Table 1. Relative abundance of the core microbiome in each sample according to mountain range and quartile position. The core microbiome was defined as any ASV present at any abundance in at least 50, 75, or 90 percent of samples. Core microbiome and abundance in each sample were calculated using the R Microbiome package [62]. Cells in the table are colored by the quartile position of each sample. Green indicates the fourth quartile, light green indicates the third quartile, yellow indicates the second quartile, and red indicates the first quartile.
Mountain RangeSample Name50 (%)50 Quartile75 (%)75 Quartile90 (%)90 Quartile
Roan HighlandsROAN.20.44640.32740.1864
ROAN.10.36930.25130.1523
BalsamsB224.10.48340.35340.2614
LG.20.45340.27640.2004
B224.20.44840.343540.3014
LG.30.34530.23930.1153
LG.10.28720.18420.0781
BlacksMG.10.33630.24130.1173
AC.10.32720.27140.1724
MG.20.30420.24630.1112
AC.20.15810.08610.0411
NantahalasSI.20.51940.40640.2474
PV.10.37140.15910.0982
WS.20.35130.23830.1273
T30.33830.21920.1253
WS.10.32620.224220.0992
SI.10.31920.23330.1062
PV.20.31620.13810.08732
PV.30.24710.12310.07151
T10.22010.18820.1062
T20.14810.10510.04651
SmokiesSC20.53240.35340.2274
FC10.35630.21420.1112
RP20.2520.16020.1203
CD.20.24710.17520.0791
SC.10.20310.11910.0661
FC20.15910.11310.0601
Table 2. PERMANOVA results to investigate differences in beta diversity between stream and cliff habitats, among the sampling locations, and among different mountain ranges. The statistical tests were conducted in QIIME 2. Bolded values indicate significant results.
CategoryBeta Diversity MetricPseudo Fp-Value
Habitat (stream vs. cliff)Bray-Curtis2.0380.001
Jaccard1.5340.002
Unweighted unifrac1.6590.006
Weighted unifrac1.1890.267
LocationBray-Curtis2.0150.001
Jaccard1.5810.001
Unweighted unifrac1.5600.001
Weighted unifrac2.1020.001
Mountain RangeBray-Curtis1.4310.004
Jaccard1.2880.001
Unweighted unifrac1.2450.006
Weighted unifrac1.7260.023
Table 3. The results of the Kruskal-Wallis tests to investigate differences in alpha diversity between stream and cliff habitats, among the sampling locations, and among different mountain ranges. The statistical tests were conducted in QIIME 2. Bolded values indicate significant results.
CategoryAlpha Diversity MetricHp-Value
Habitat (stream vs. cliff)Shannon1.0140.313996
Evenness0.2300.63161
Faith3.8640.049322
LocationShannon11.8740.45582
Evenness15.8030.20043
Faith20.7660.053914
Mountain RangeShannon2.9930.558939
Evenness0.6700.951372
Faith6.4160.17016
Table 4. Results of the Mantel tests investigating the correlation between multiple beta diversity metrics and climatic variables. The Mantel tests were conducted in QIIME 2, and environmental variables were retrieved from the WorldClim dataset [50,51]. Bolded values indicate significant results.
VariableBeta Diversity MetricSpearman Rhop-Value
Bio8Bray-Curtis0.0230.751
Mean temperature of the wettest quarterJaccard0.0300.667
Unweighted unifrac0.0790.269
Weighted unifrac−0.0620.395
Bio10Bray-Curtis0.2140.001
Mean temperature of the warmest quarterJaccard0.2050.004
Unweighted unifrac0.1380.022
Weighted unifrac0.2670.001
Bio12Bray-Curtis−0.0430.463
Annual precipitationJaccard−0.02910.637
Unweighted unifrac−0.0880.115
Weighted unifrac−0.1130.064
Table 5. Results of the Spearman correlation analyses investigating the relationship between three different alpha diversity metrics (Shannon diversity, evenness, and faith phylogenetic diversity) and multiple different environmental variables. Correlation analyses were conducted in QIIME 2, and environmental variables were retrieved from the WorldClim dataset [50,51].
VariableAlpha Diversity MetricSpearman Rhop-Value
Bio8Shannon−0.0490.8061
Mean temperature of the wettest quarterEvenness−0.0460.8158
Faith−0.1530.4357
Bio10Shannon−0.0830.6766
Mean temperature of the warmest quarterEvenness0.2330.2326
Faith−0.3690.0536
Bio12Shannon0.0700.07213
Annual precipitationEvenness−0.1520.4382
Faith0.3300.0862
Disclaimer/Publisher’s Note: The statements, opinions and data contained in all publications are solely those of the individual author(s) and contributor(s) and not of MDPI and/or the editor(s). MDPI and/or the editor(s) disclaim responsibility for any injury to people or property resulting from any ideas, methods, instructions or products referred to in the content.