Article

Characteristics and Influencing Factors of Ecological Stoichiometry of Shrub Fine Roots in the Alpine Region of Northwest China

by
Jian Ma
1,2,*,
Qi Feng
1,
Wei Liu
1,
Bin Chen
2,
Meng Zhu
1,
Chengqi Zhang
1,
Feng Ta
3,
Xiaoping Tian
2,
Yufang Zhan
2 and
Xiaopeng Li
2
1
Northwest Institute of Eco-Environment and Resources, Chinese Academy of Sciences, Lanzhou 730000, China
2
Zhangye Forestry Research Institute, Zhangye 734000, China
3
State Key Laboratory of Herbage Improvement and Grassland Agro-ecosystems, College of Pastoral Agriculture Science and Technology, Lanzhou University, Lanzhou 730000, China
*
Author to whom correspondence should be addressed.
Diversity 2024, 16(12), 748; https://doi.org/10.3390/d16120748
Submission received: 4 November 2024 / Revised: 3 December 2024 / Accepted: 4 December 2024 / Published: 5 December 2024

Abstract

:
Understanding the relationships between nutrient content in plant roots and ecological stoichiometry is crucial for elucidating nutrient utilization strategies and material cycling in alpine plant communities. However, data characterizing the stoichiometric characteristics of plant roots in this region remain limited. In this study, we collected fine-root and soil samples from five common alpine shrub species—Salix gilashanica, Potentilla fruticosa, Caragana jubata, Caragana tangutica, and Berberis diaphana—to investigate the carbon (C), nitrogen (N), and phosphorus (P) stoichiometric characteristics of their fine roots and examine the potential nutrient control strategies based on the soil properties. Our analysis revealed that the mean C (541.38 g kg−1) and P (1.10 g kg−1) contents in the shrub fine roots exceeded the average levels of the plant roots in China. However, the mean N content (8.61 g kg−1) was lower than the global average. Notably, the mean C:N ratio (71.3) in these fine roots was significantly higher than the global average, whereas both the mean C:P ratio (527.61) and N:P ratio (8.11) were considerably lower. The N:P ratios in the fine roots of the five shrub species were below 14, indicating nitrogen limitation for growth in the degraded alpine shrub communities. Our findings indicate that soil available phosphorus (33.2%) and pH (20.5%) are the primary factors influencing the eco-stoichiometric characteristics of shrub fine roots in the Qilian Mountains. These findings provide valuable data and theoretical support for a better understanding of the role of shrub roots in nutrient cycling within alpine ecosystems.

1. Introduction

Plant ecological chemometrics primarily focuses on the stoichiometric characteristics of elemental content in plant organs, as well as their influencing factors and ecosystem functions [1]. Carbon (C), nitrogen (N), and phosphorus (P) are essential nutrients that regulate the balance between plant growth and the soil [2,3], and they play crucial roles in the cycling, transformation, and feedback of mineral nutrients within biogeochemical processes [4]. The C:N and C:P ratios are important indicators of plant growth, indirectly reflecting nutrient utilization efficiency [5], while the N:P ratio is a valuable metric for assessing community structure and function [6]. The N:P ratio can be used as an indicator to judge the nutrient limitation of plants during growth. Understanding these stoichiometric patterns helps elucidate nutrient limitations and plant adaptation strategies in specific environments [7]. Furthermore, the contents and stoichiometry of C, N, and P in plants influence nutrient cycling within plant–soil systems, and their stoichiometric characteristics across various ecosystem components are vital for sustaining ecosystem structure and function [8]. Therefore, it is essential to study the ecological C, N, and P stoichiometry in plants.
Roots are the primary means by which plants acquire nutrients and water. Fine roots, typically ≤2 mm in diameter, act as active interfaces with the environment, contributing significantly to below-ground ecosystem functions and nutrient cycling [9]. As primary agents of carbon fixation in the soil, fine roots exhibit high turnover rates, facilitating the return of carbon and nutrients to the soil through decomposition at levels equal to or exceeding litter contributions [10]. Hence, investigating the concentrations and stoichiometric ratios of C, N, and P in fine roots is essential for understanding the nutrient distribution and utilization strategies in plants. While numerous studies have examined root biomass and its vertical distribution in alpine plants during the growing season [11,12], research on root ecological stoichiometry remains relatively limited.
Situated on the northeastern fringe of the Qinghai–Tibetan Plateau, the Qilian Mountains are vital for water conservation, climate regulation, and biodiversity preservation [13]. In these high-altitude regions, evergreen and alpine deciduous shrubs dominate the landscape, forming the primary vegetation type [14]. These ecosystems are essential for sustaining the ecological integrity of the Hexi Corridor and for preserving biodiversity in China. Although the ecological stoichiometry of trees, such as Qinghai spruce, and grasses, including Potentilla anserina, Stellera chamaejasme, and Leontopodium lentopodioides, has been examined in this area, research on the nutrient content in shrub organs remains limited. Key questions persist on how shrub plants regulate the stoichiometric characteristics of their roots to adapt to high-altitude and arid conditions, as well as the relationship between root stoichiometric characteristics and soil factors. Addressing these questions is essential for advancing our understanding of nutrient cycling processes in shrub-dominated ecosystems.
This study investigated the stoichiometric characteristics and the factors influencing them in the fine roots of alpine shrubs in the Qilian Mountains. Specifically, we aim to address the following questions: (1) What are the stoichiometric characteristics of fine roots in different shrub species? (2) How are fine-root stoichiometric characteristics related to soil factors? (3) Which factors significantly influence the fine-root stoichiometry in shrubs?

2. Materials and Methods
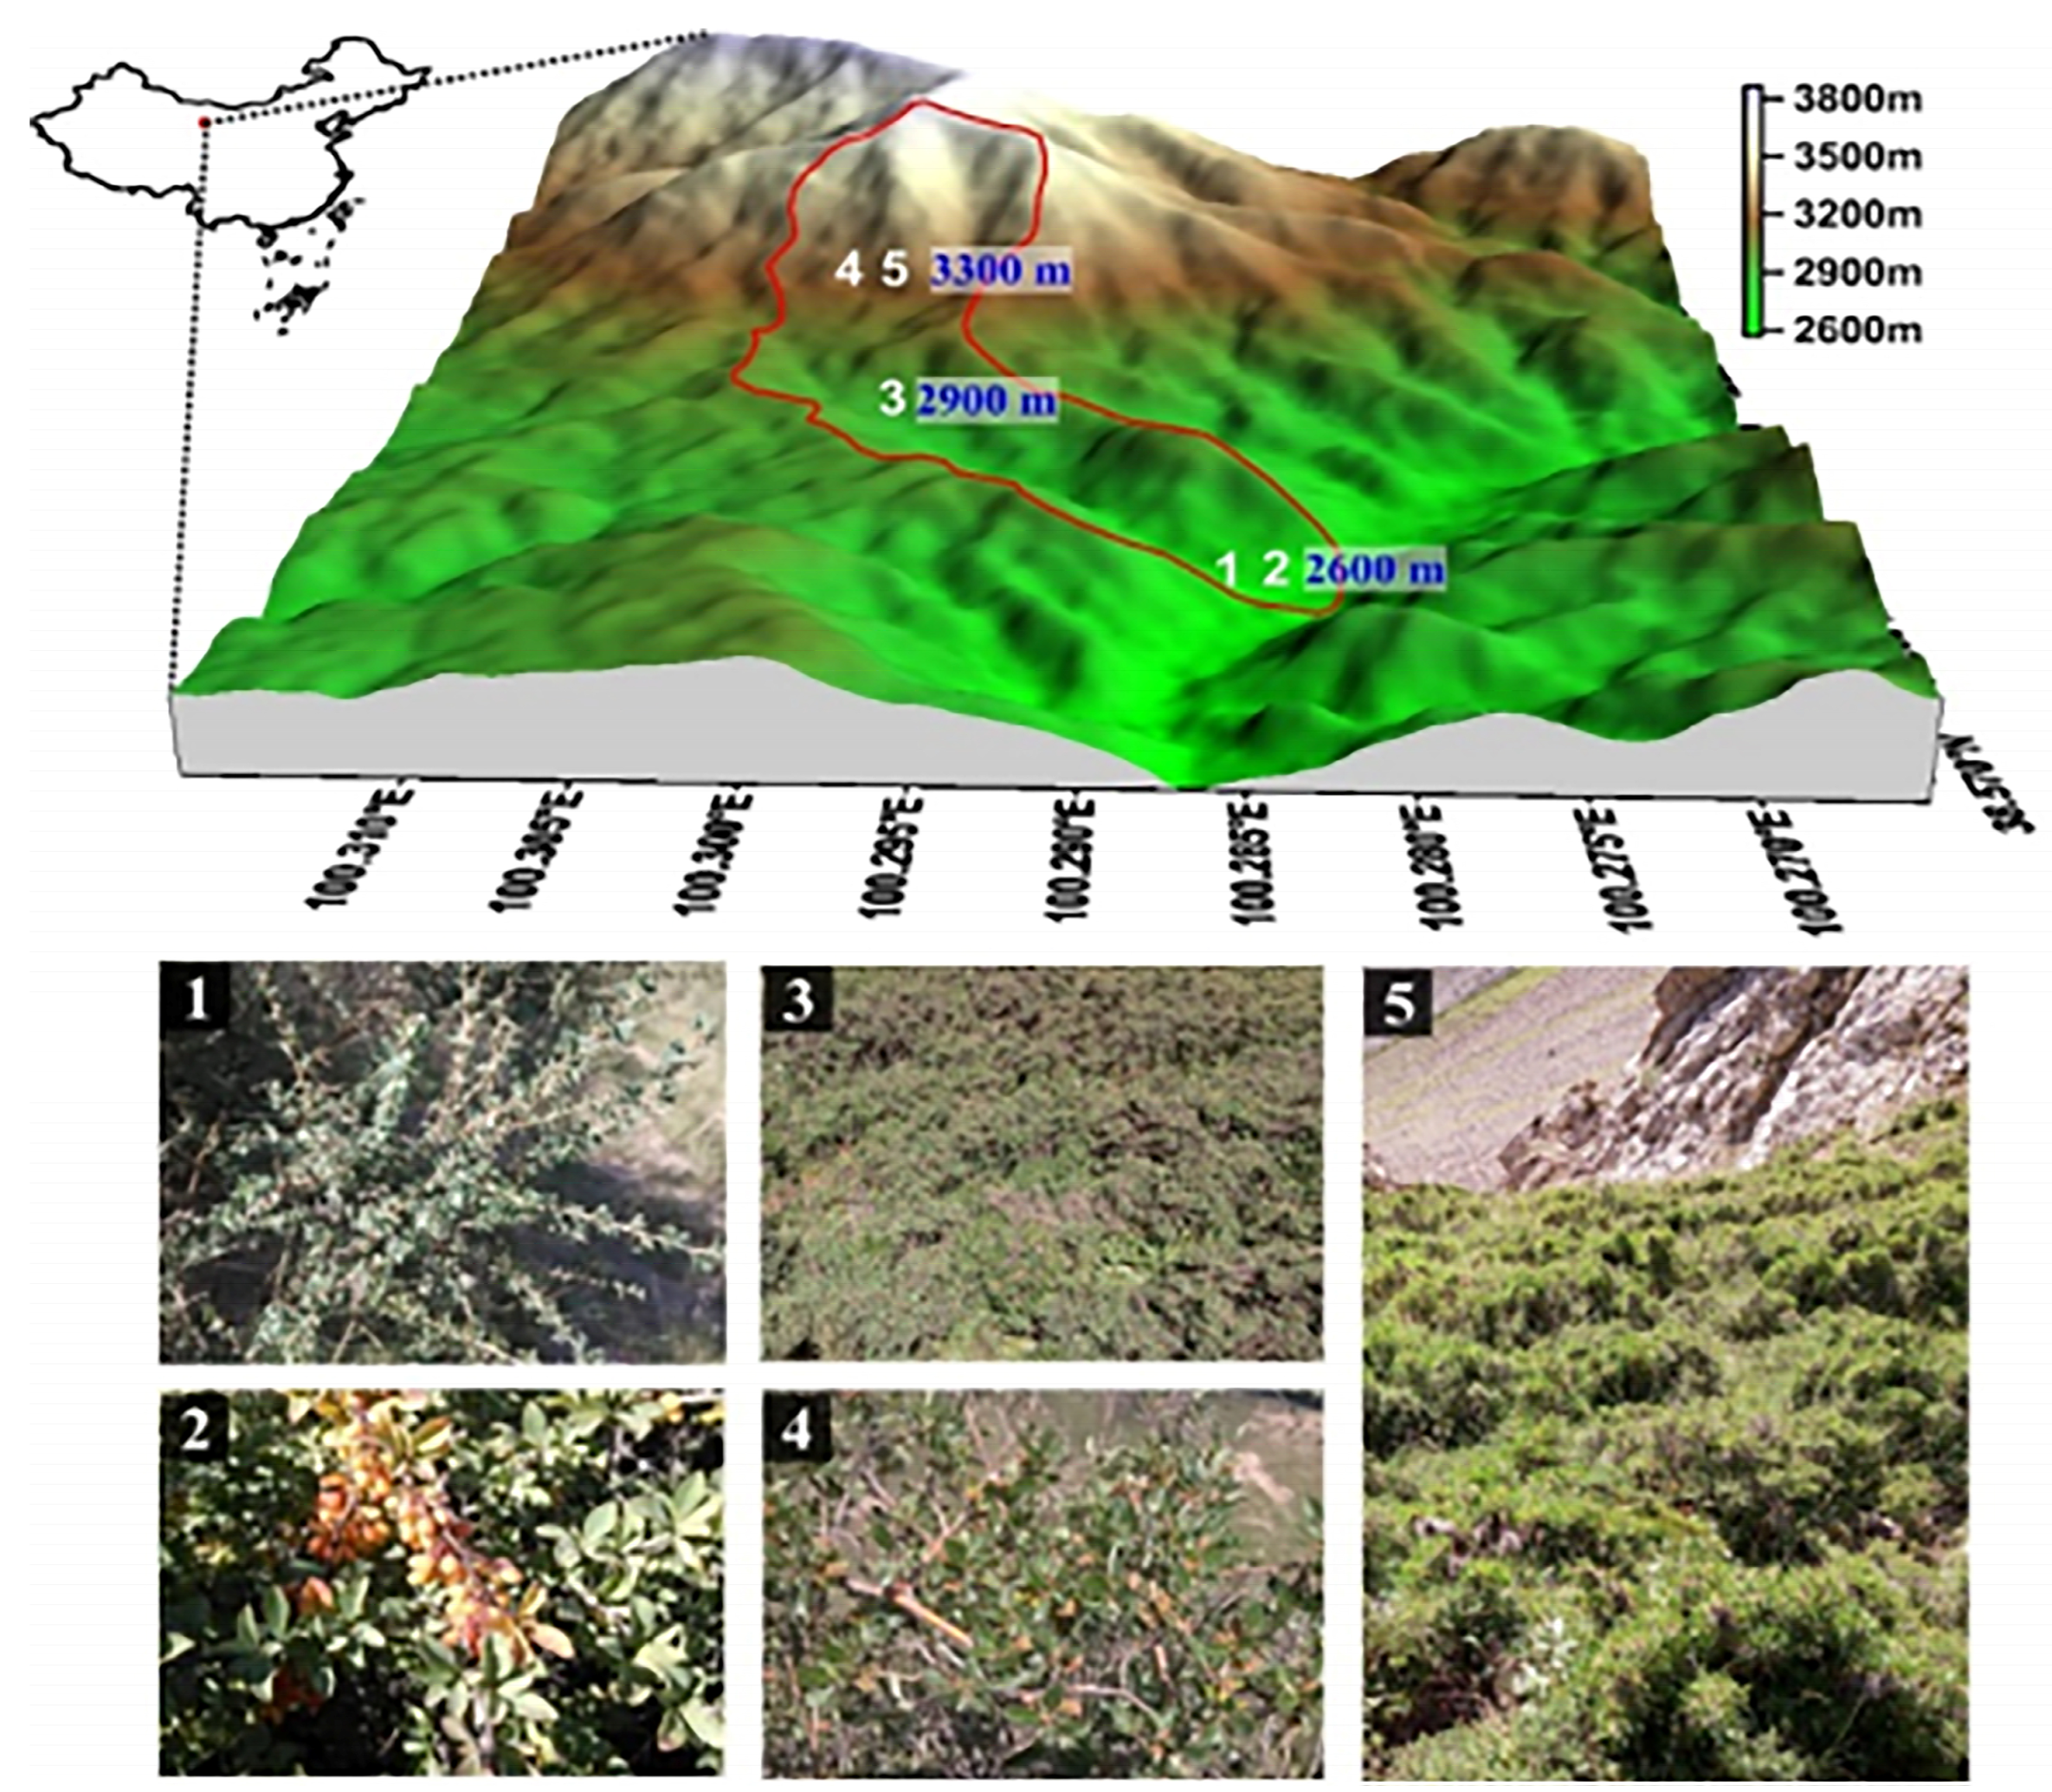
2.1. Sampling Areas

The Dayekou watershed is located in the Qilian Mountains of Gansu Province, northwest China, the central location of which is 100°15′ E and 38°31′ N, with a total area of 73.32 km2 and an altitude of 2590~4645 m (Figure 1). This region experiences a temperate continental climate, with cold, dry winters largely influenced by the Mongolian anticyclone, resulting in minimal precipitation. The annual average temperatures range between −0.6 °C and 2.0 °C, with a mean annual precipitation of 434 mm. Soils are classified according to the FAO classification system as Haplic Kastanozems on sunny and semi-shaded slopes, and Haplic Phaeozems on shaded slopes [15]. The dominant vegetation includes tree species such as Juniperus przewalskii kom and Picea crassifolia kom, along with alpine shrubs, specifically Berberis diaphana Maxin (BD), Caragana tangutica Maxim. ex Kom (CT), Caragana jubata (Pall.) Poir (CJ), Salix gilashanica C. Wang & P. Y. Fu (SG), and Potentilla fruticose (L.) Rydb (PF).

2.2. Sample Collection and Processing

To ensure representativeness, we selected five typical shrub communities, Berberis diaphana (BD), Caragana tangutica (CT), Caragana jubata (CJ), Salix gilashanica (SG), and Potentilla fruticose (PF), within the study area for sample collection and surveys. These communities span the altitude of 2600 to 3300 m, each displaying unique biological traits and growth conditions. Notably, the shrubs display xerophytic leaf morphology, indicating adaptation to arid environments. For each community, three survey plots measuring 20 × 20 m were established. The plot characteristics are presented in Table 1. In August 2021, we collected both plant and soil samples from these plots. Based on the growth patterns of the shrubs, 5 to 10 plants with similar growth conditions were randomly selected per plot. The roots were carefully sampled and promptly transported to the laboratory for analysis.
Meanwhile, we collected soil samples using both soil drilling and soil profile methods in each plot. Due to the nutrient changes in the 10 cm soil layer in the study area being drastic, which had a great impact on the nutrient uptake of the roots, we focused on the 0–10 cm soil layer. A soil profile was dug at the intersection of the two diagonals in each sample plot. We recorded the soil profile color, texture, and other characteristics and subsequently collected soil samples from the 0–10 cm layer using a 200 cm3 ring knife. Additionally, we obtained one mixed soil sample from the 0–10 cm layer using a 2 cm diameter soil drill. After thoroughly mixing the samples, we transported them back to the laboratory.
For plant sampling, the samples were rinsed with running water once or twice, followed by two to three rinses with distilled water. After accurately measuring the straightness of the roots with vernier calipers, according to the diameter range of 0–2 mm, the fine roots are separated. After air drying, the fine roots were dried at 80 °C to constant weight.

2.3. Chemical Properties Analysis

Fine-root and soil organic carbon (SOC) contents were measured using the potassium dichromate–sulfuric acid titration method [16]. The levels of total nitrogen (TN) and available nitrogen (AN) were quantified using the modified Kjeldahl method [17]. Phosphorus concentrations, including total phosphorus (TP) in plants and soil, as well as soil available phosphorus (AP), were determined using the phosphorus vanadium molybdate yellow colorimetric method. Soil pH was measured by the potentiometric method. Soil moisture content, bulk density, and capillary porosity were measured using the drying method, while total soil porosity was calculated from the bulk density using Equation (1) [18].
pt = 93.947 − 32.995 × b
where pt is the total porosity, and b is the bulk density.
Non-capillary porosity was derived using Equation (2):
po = ptpc
where pt is the total porosity, pc is the capillary porosity, and po is the non-capillary porosity, respectively.

2.4. Data Analysis

The contents of C, N, and P in fine roots, along with the C:N, C:P, and N:P ratios, were utilized to characterize their stoichiometric properties. Differences in these stoichiometric characteristics (both contents and ratios) between fine roots and soils were analyzed using the General Linear Model in SAS 9.2, with comparisons conducted using Duncan’s new multiple range test at a significance level of 0.05. Furthermore, redundancy analysis (RDA) was performed with the CANOCO 4.5 software package to explore the relationships between the stoichiometric characteristics of fine roots and various soil factors [19].

3. Results

3.1. Stoichiometric Characteristics of Shrub Fine Roots

The fine roots exhibited C content ranging from 526.66 to 556.38 g kg−1, N content from 4.94 to 12.20 g kg−1, and P content from 0.92 to 1.58 g kg−1. Consequently, the stoichiometric ratios varied as follows: C:N ranged from 43 to 112, C:P ranged from 360 to 603, and N:P ranged from 5 to 13. The fine-root N content showed considerable variation among the shrub species, with a coefficient of variation (CV) of 0.31, while the fine-root C content showed no significant differences among the shrub species, with a CV of 0.02. The N:P ratio exhibited substantial variation (CV = 0.35), whereas the C:P ratio demonstrated moderate variation (CV = 0.17) (Table 2). Among the shrubs, BD had the highest C content, CT had the highest N content, and CJ had the highest P content. Also, SG had the highest C:N ratio, BD had the highest C:P ratio, and CT had the highest N:P ratio (Table 2).

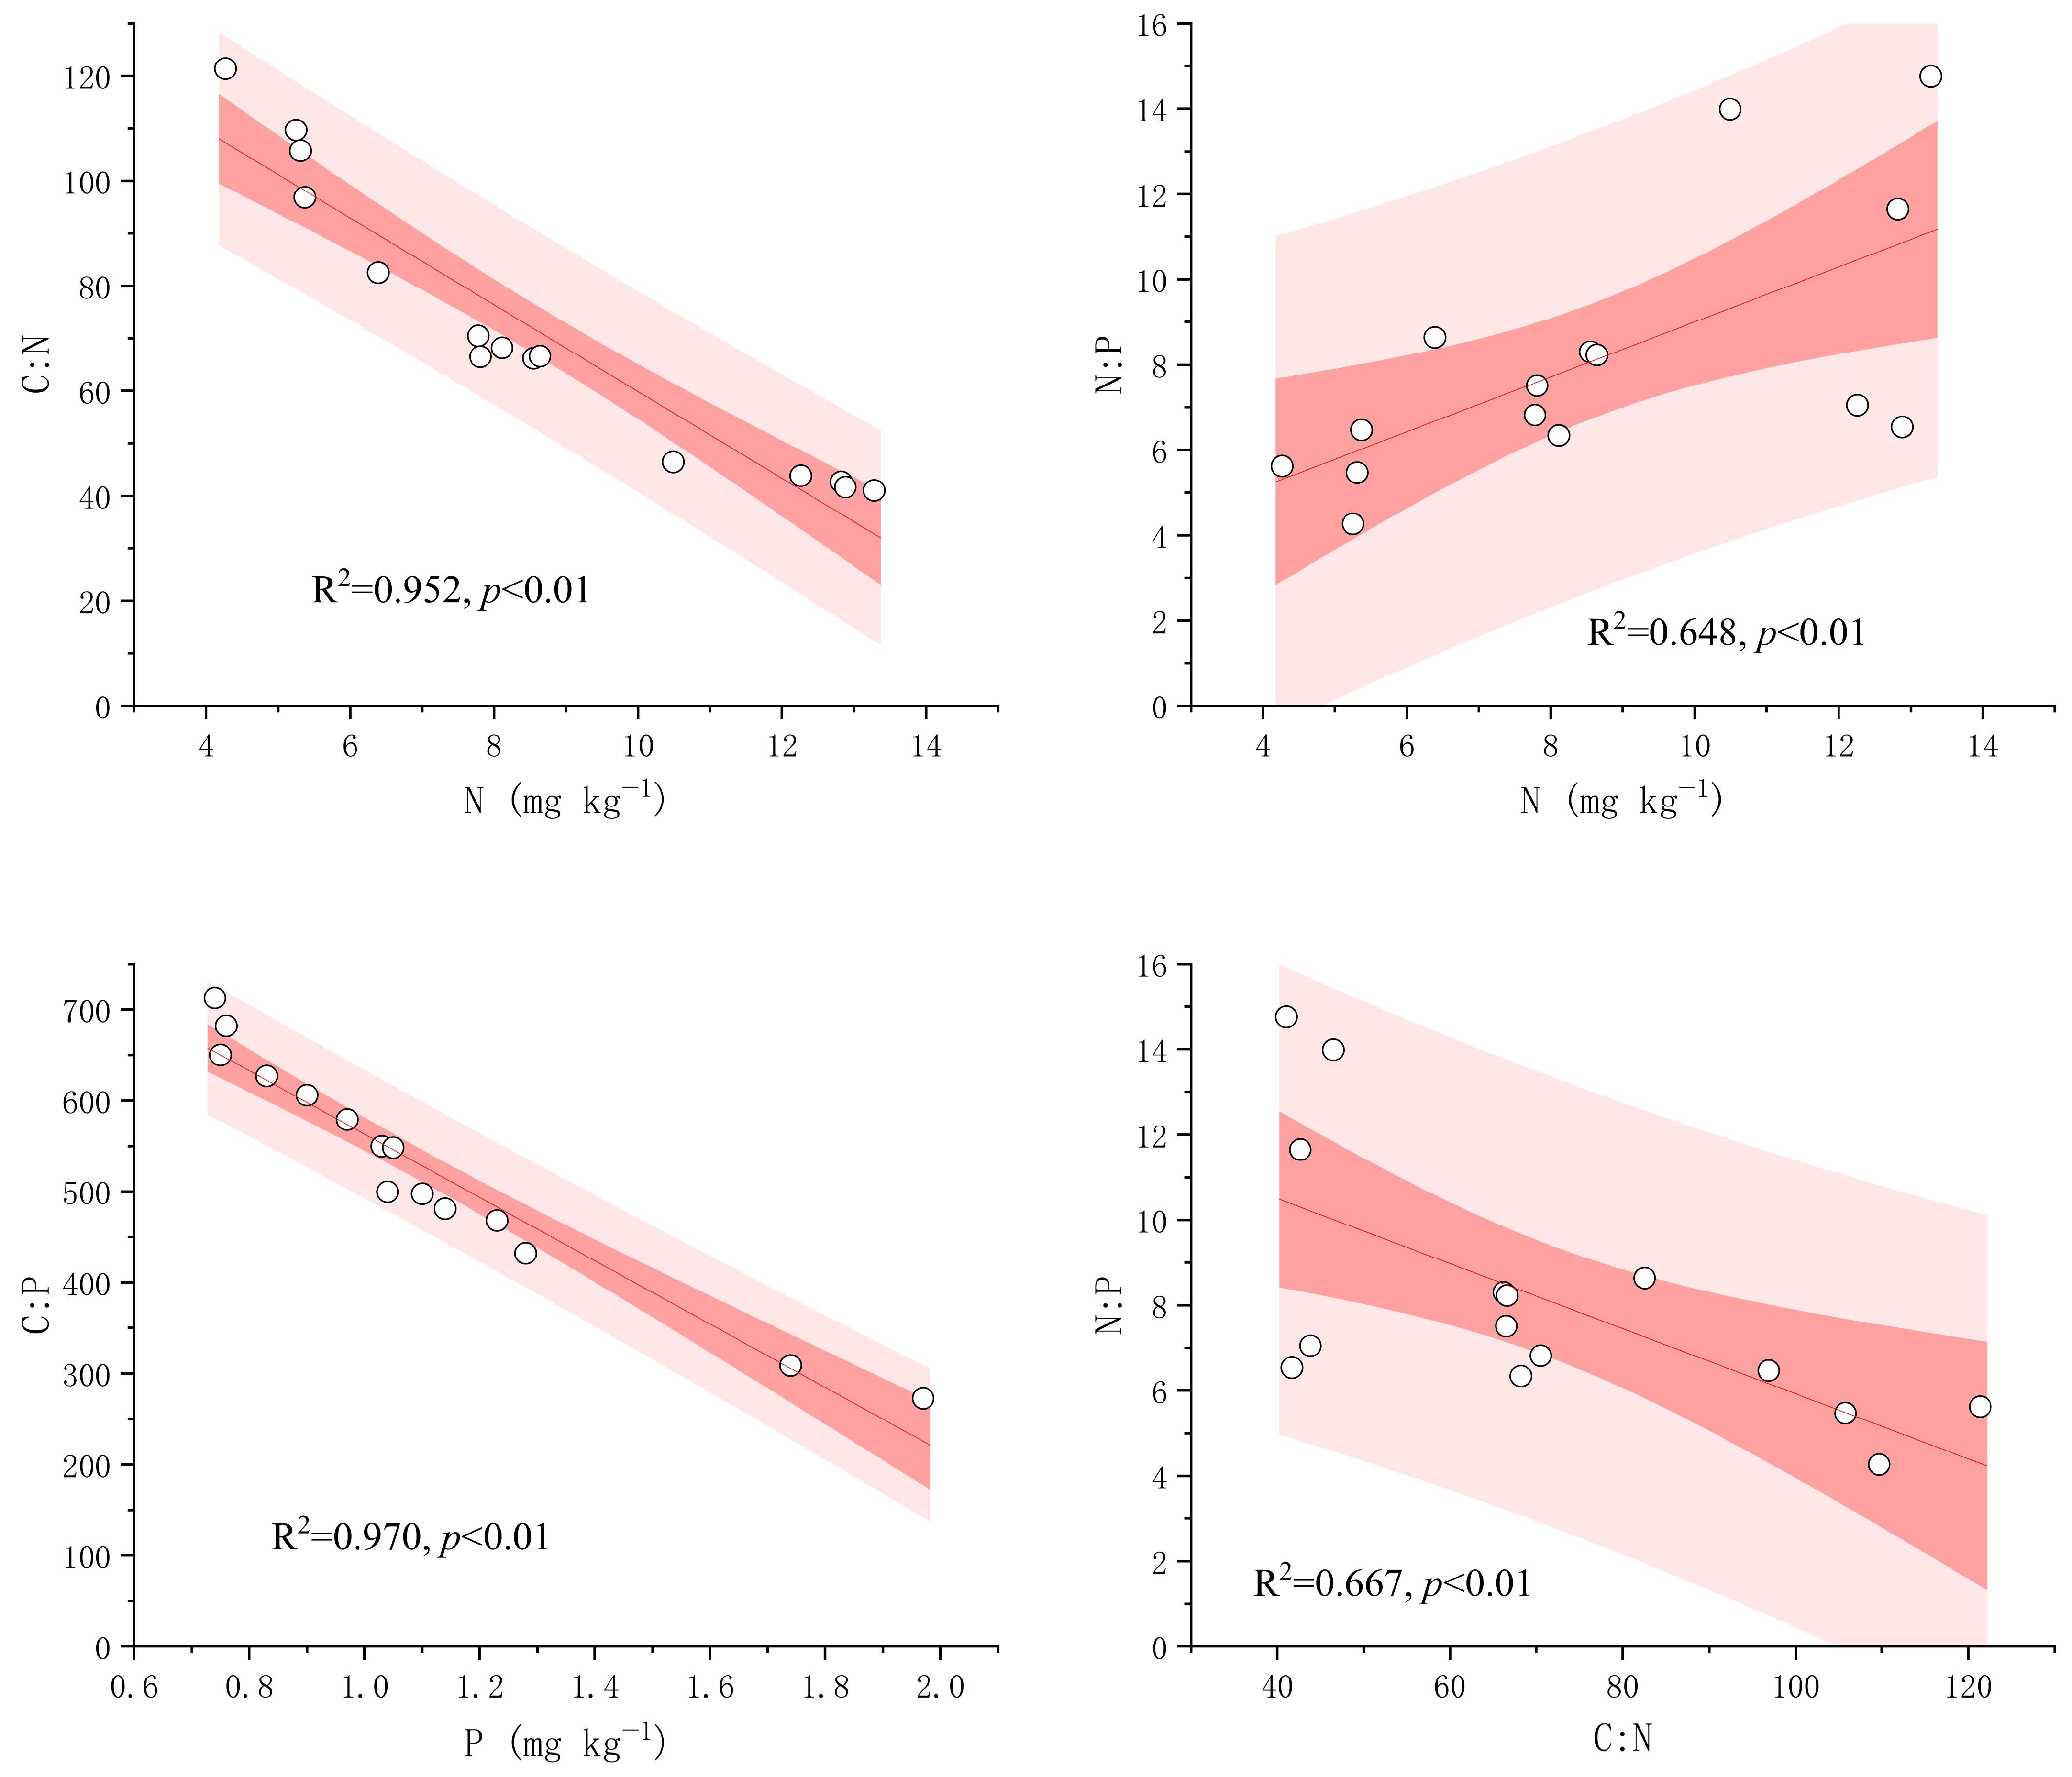
3.2. Correlations Between Fine-Root Stoichiometric Characteristics

The correlations among fine-root stoichiometric characteristics are shown in Figure 2. For all shrub species, the fine-root N content was negatively related to the C:N ratio but positively related to the N:P ratio. The fine-root P content was negatively related to the C:P ratio, whereas the fine-root C:N ratio was negatively related to the N:P ratio. Additionally, the results indicate that there were no significant relationships among other stoichiometric ratios in fine roots.

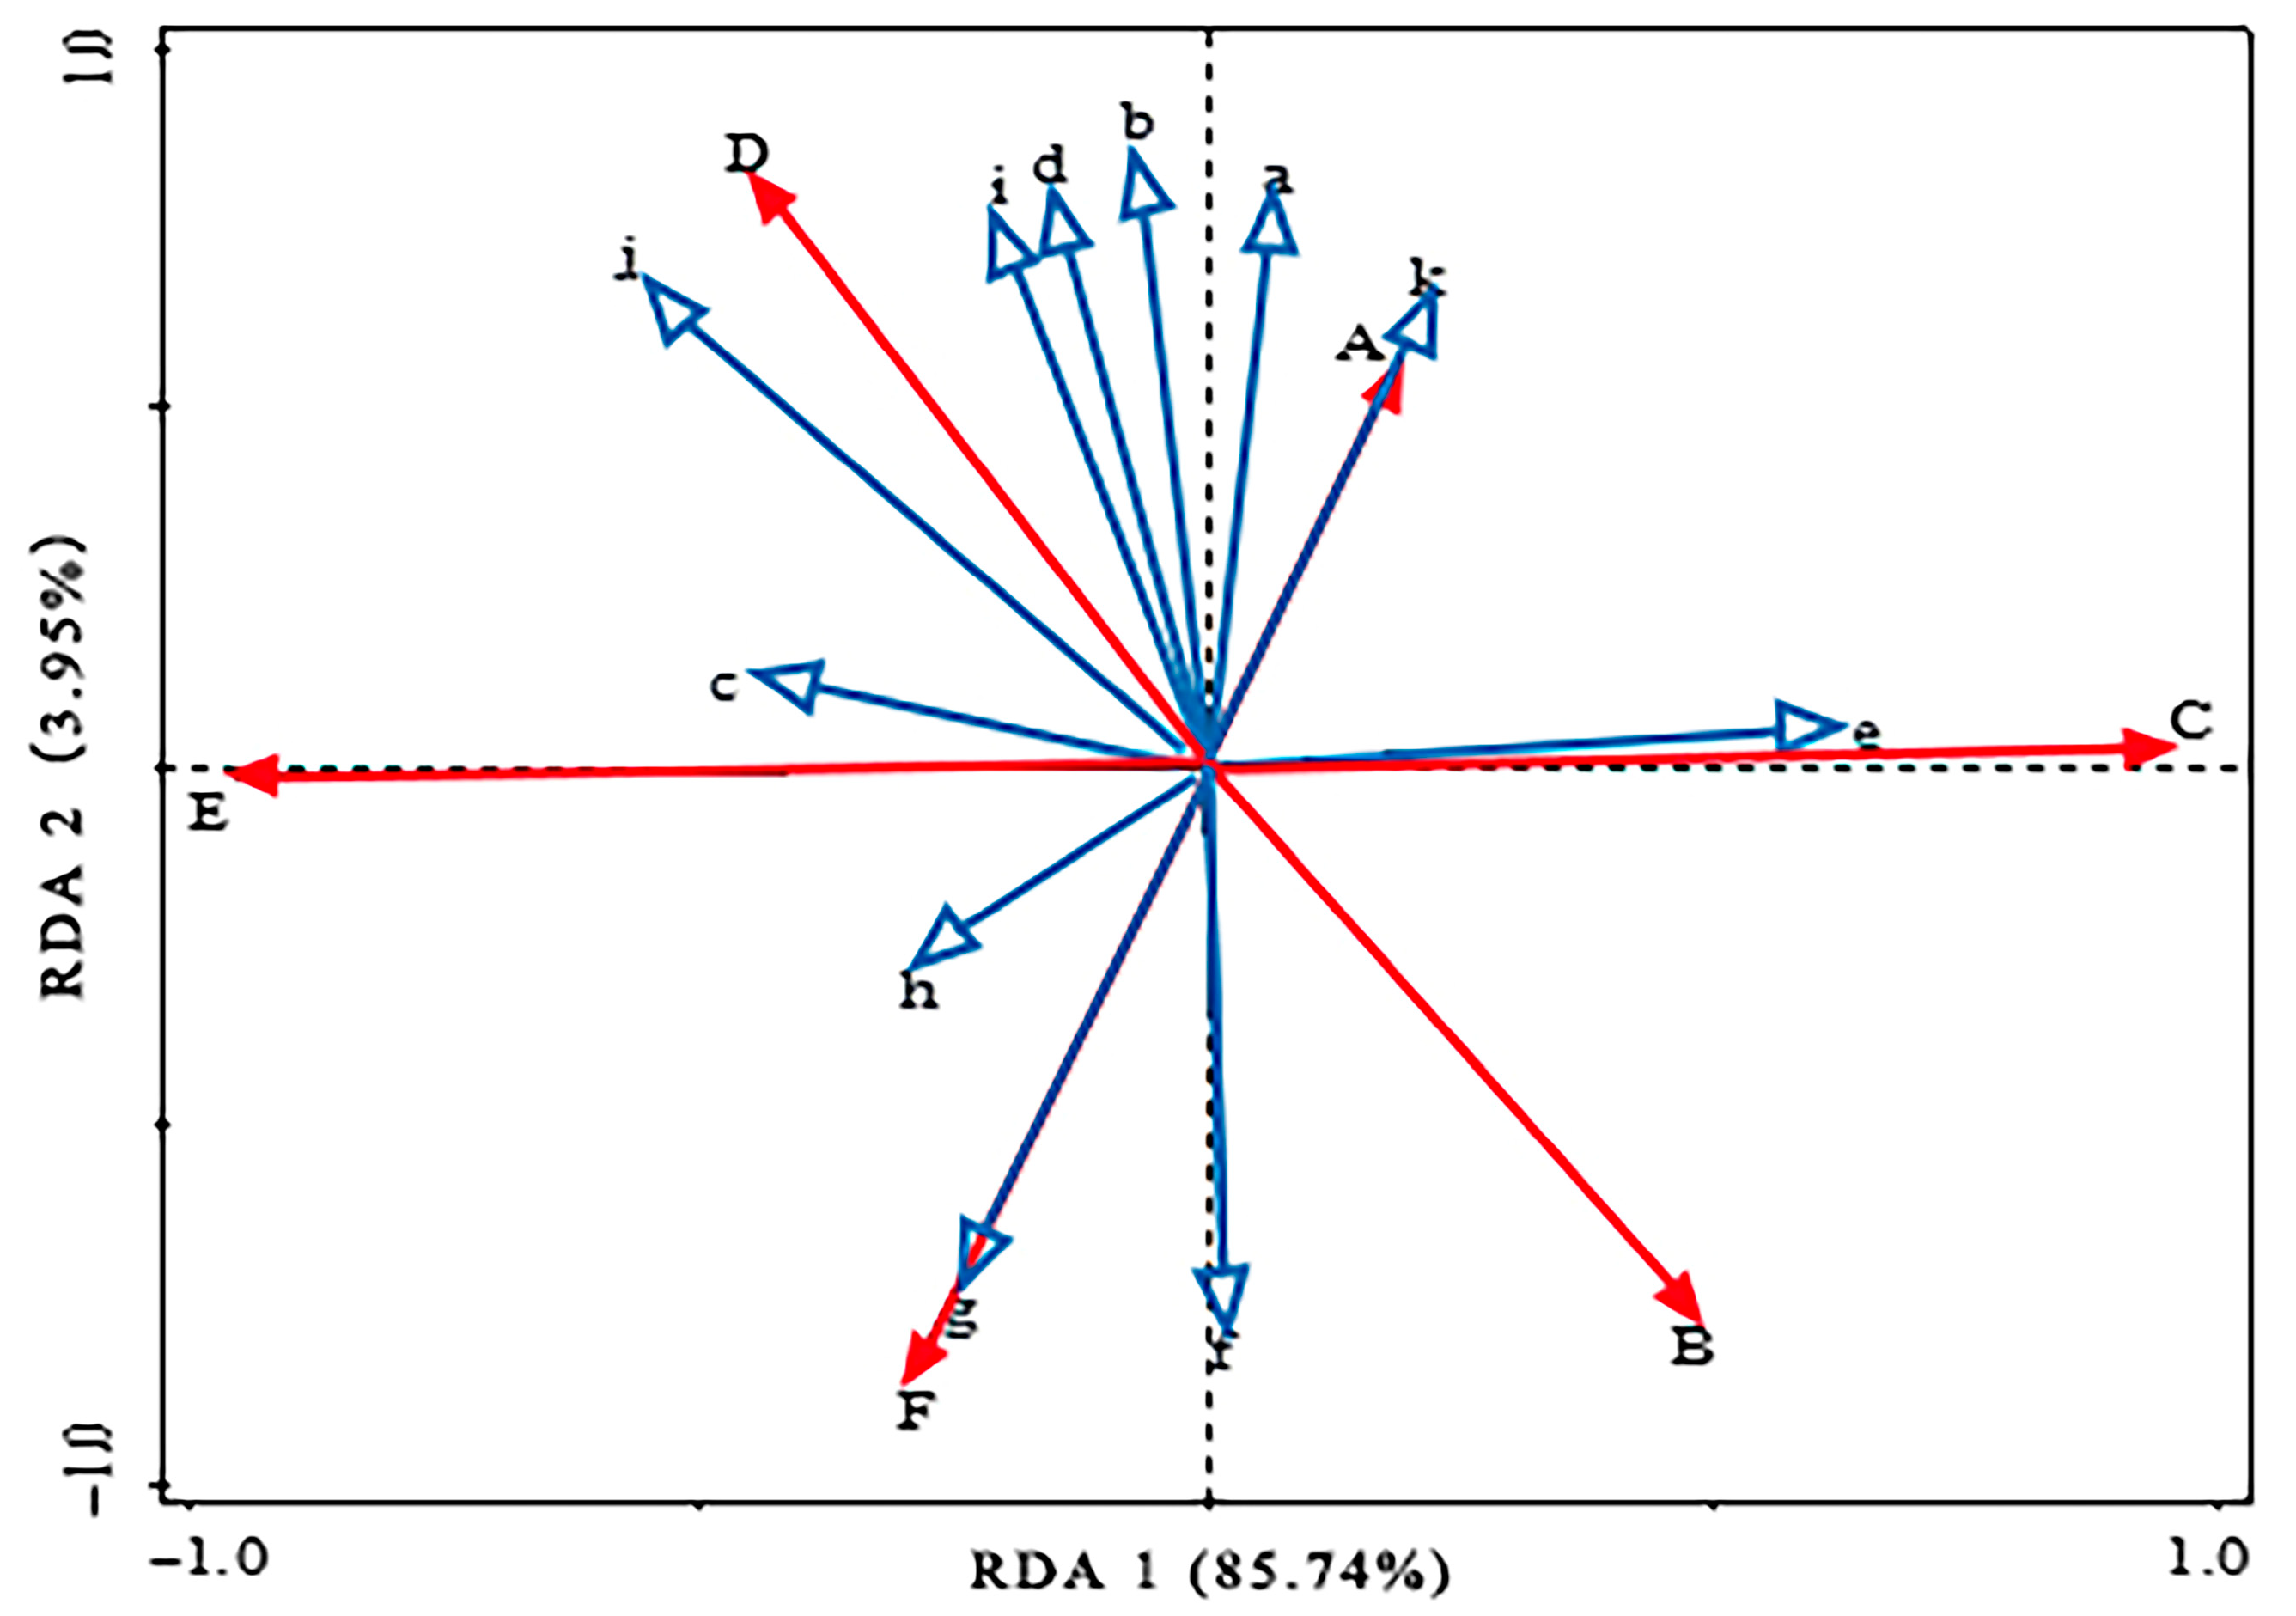
3.3. Relationships Between Fine-Root Stoichiometric Characteristics and Soil Properties

The relationships between fine-root stoichiometric characteristics and various soil physicochemical factors were analyzed using RDA (Table 3). The RDA results, presented in Figure 3, reveal that axis 1 accounted for 85.74% of the total variation and axis 2 accounted for 3.95%, with the first two axes collectively explaining 89.69% of the variation in fine-root stoichiometric characteristics. The cumulative explanation of the relationship between fine-root stoichiometry characteristics and soil physicochemical factors reached 99.90%, indicating that the first two axes effectively capture this relationship, especially axis 1 (Figure 3). Notably, soil AP content and pH significantly contributed to the variation in fine-root stoichiometry characteristics. Soil AP content was positively correlated with fine-root C, N, and P, while exhibiting negative correlations with C:N, C:P, and N:P ratios. Soil pH showed positive correlations with N, C:P, N:P, and C:P, while exhibiting negative correlations with C, P, and C:N. Soil C showed positive correlations with fine-root C, P, and C:N and negatively correlated with N, C:P, and N:P. Soil N showed positive correlations with fine-root C, C:N, and C:P and negative correlations with fine-root N, P, and N:P. Soil P was positively correlated with fine-root C, C:N, C:P, N:P, and N:P, while exhibiting negative correlations with fine-root N and P. The soil physicochemical properties influencing fine-root stoichiometric ratios, in order of decreasing importance, were as follows: available phosphorus (AP), pH, total porosity, bulk density, C, N, non-capillary porosity, P, available nitrogen (AN), capillary porosity, and moisture content (Table 3). Among these, soil AP and pH emerged as the dominant drivers of fine-root stoichiometric ratios.
Furthermore, soil C:N exhibited significant negative correlations with fine-root N:P, while soil C:P and soil N:P were positively correlated with fine-root C:N, and negatively correlated with fine-root N:P. The relationships between soil C:N:P ratios and fine-root C:P were insignificant (Figure 4).

4. Discussion

Over time, plants adapt to environmental stresses through natural selection, enabling them to optimize resource allocation. This results in differences in root nutrient content depending on the environmental conditions [20]. The fine-root N content (8.61 g kg−1) was lower than the global average (11.1 mg g−1) [21] and marginally below the average N content in Chinese plant roots (9.20 g kg−1). Meanwhile, the P content in these fine roots (1.10 g kg−1) surpassed both the global average (0.77 g kg−1) [21] and that of the Chinese plant roots (1.00 g kg−1), which may be attributed to the elevated P levels typical of arid and semi-arid soils in China. Notably, the C content showed the least variation, suggesting its stability, likely due to its primary structural function in plants, which remains largely unaffected by metabolic activities. Carbon, absorbed via photosynthesis, maintains consistent levels in plants across varying conditions. Nitrogen also exhibited similar stability with limited responsiveness to environmental fluctuations [22]. In contrast, P content was more variable, probably due to the wide range of soil P levels that led to inconsistencies in fine-root P content.
The plant C:N or N:P ratio is a direct indicator of the efficiency of plants in utilizing N or P, and they generally show a negative correlation with plant growth rates [23,24]. In our study, the fine-root C:N ratios of the five shrub species were higher than the global average [25], indicating greater nutrient use efficiency. Conversely, the fine-root C:P and N:P ratios were observed to be lower than the global average [25], which could be attributed to the cold regional climate. N and P concentrations, along with the N:P ratio, are commonly used to assess nutrient limitations throughout the plant life cycle [26,27]. Generally, an N:P ratio greater than 16 suggests P limitation, while a ratio below 14 indicates N limitation; values between 14 and 16 suggest the limitation of both N and P [28]. Here, the N:P ratios in the fine roots of all five shrub species were below 14 (Table 2), indicating N limitation, consistent with previous findings [29]. The higher P content in shrub roots may contribute to a lower N:P ratio, further reflecting the N limitation in the study region.
Differences among shrub species resulted in varying nutrient adaptation strategies and resource use efficiencies. In this study, we found that there was no significant difference in fine-root C content between the different shrub species (p > 0.05), highlighting the structural role of C in plants. However, there were significant differences in the fine-root N content between CT, BD, PF, and SG (p < 0.05) and in P content between CJ, BD, and SG (p < 0.05), suggesting selective absorption of nutrients among the shrub species. Additionally, significant differences in the C:N ratio were found between SG and other shrub types (p < 0.05), while there was no notable difference between CT and CJ (p > 0.05). Similarly, the C:P ratio of CJ was significantly different from that of SG, CT, and BD (p < 0.05), and the N:P ratio of CT differed substantially from the other shrubs (p < 0.05). These findings indicate that different shrub species employ varying nutrient utilization strategies, which lead to their varied nutrient use efficiency and environmental adaptability.
In our study, soil N content was positively correlated with fine-root C content, the C:N ratio, and the C:P ratio but negatively correlated with fine-root N, P, and the N:P ratio. These results indicate a close connection between soil N and root N, as well as between root P and overall nutrient status. It appears that the roots in the study area mainly absorb N from the soil and P from decomposing litter [30]. Additionally, soil available P content emerged as the dominant factor influencing fine-root stoichiometry. Since plants primarily absorb P through their roots, soil P availability has a direct impact on root P content. Soil-available P was positively correlated with root P content and negatively correlated with the C:P and N:P ratios, highlighting the critical role of P availability in influencing stoichiometric ratios [31,32]. The RDA further demonstrated that soil properties, particularly soil pH, significantly influenced the fine-root C:N:P stoichiometry. Soil pH, therefore, serves as a key integrative indicator of soil nutrient availability, regulating various nutrient processes [33,34] and explaining much of the observed variation in fine-root stoichiometric characteristics. Then, the phosphorus solubility and in turn the availability for plants is particularly influenced by the soil pH.

5. Conclusions

The average C, N, and P contents in the fine roots of the five typical alpine shrub species in the study area were 541.38, 8.61, and 1.10 g kg−1, respectively. The coefficient of variation was highest for P content and lowest for C content. The average C:N, N:P, and C:P ratios in the fine roots were 71.34, 8.11, and 527.61, respectively. Compared to the average levels in Chinese plant roots, the fine roots in our study exhibited higher C and P contents but lower N content. The N:P ratios of all five shrub species were below 14, suggesting nitrogen as the primary limiting nutrient for root growth in the Qilian Mountains. Soil AP content and pH had significant effects on fine roots, explaining 33.2% and 20.5% of the variation in fine-root stoichiometric characteristics, respectively. This indicates that soil AP content and pH are the key factors influencing the ecological stoichiometry of fine roots.
This study analyzed the effects of soil physicochemical factors on the stoichiometric characteristics of shrub fine roots, which is of great significance for revealing the nutrient adaptation strategies of plants in alpine and semi-arid mountainous areas. However, the effects of soil physicochemical factors on root stoichiometric characteristics are not independent, and there is also a mutual constraint relationship between soil physicochemical factors. Therefore, the dual or multiple effects of soil physicochemical factors on root stoichiometric characteristics should be analyzed in future studies.

Author Contributions

J.M.: formal analysis, writing—original draft; writing—review and editing; Q.F.: conceptualization, supervision; W.L.: conceptualization, supervision; B.C.: funding acquisition; M.Z.: software; C.Z.: methodology; F.T.: methodology, software, investigation; X.T.: methodology, data curation; Y.Z.: methodology, data curation; X.L.: methodology, investigation. All authors have read and agreed to the published version of the manuscript.

Funding

This study is jointly funded by the National Natural Science Foundation of China (Grant No. 42201133; No. 42107494; No. 32060337), Natural Science Foundation of Gansu Province (Grant No. 22JR5RA072), and Longyuan Youth Talent Project of Gansu Province.

Institutional Review Board Statement

Not applicable.

Data Availability Statement

The original contributions presented in this study are included in this article. Further inquiries can be directed to the corresponding authors.

Acknowledgments

The authors would like to thank Wenmao Jing, Weijun Zhao, Jingzhong Zhao, Rongxin Wang, Hui Zhang, and Kehai Zhang for their help in field management.

Conflicts of Interest

The authors declare that the research was conducted in the absence of any commercial or financial relationships that could be construed as a potential conflicts of interest.

References

  1. Hessen, D.O. Stoichiometry in food webs: Lotka revisted. Oikos 1997, 79, 195–200. [Google Scholar] [CrossRef]
  2. Zhang, W.; Liu, W.C.; Xu, M.P.; Deng, J.; Han, X.H.; Yang, G.H.; Feng, Y.Z.; Ren, G.X. Response of forest growth to C:N: P stoichiometry in plants and soils during Robinia pseudoacacia afforestation on the Loess Platesu, China. Geoderma 2019, 337, 280–289. [Google Scholar] [CrossRef]
  3. Qiu, X.C.; Wang, H.B.; Peng, D.L.; Liu, X.; Yang, F.; Li, Z.; Cheng, S. Thinning drives C:N: P stoichiometry and nutrient resorption in Larix principis-rupprechtii plantations in North China. For. Ecol. Manag. 2020, 462, 117984. [Google Scholar] [CrossRef]
  4. Yang, Y.; Liu, B.R.; An, S.S. Ecological stoichiometry in leaves, roots, litters and soil among different plant communities in a desertified region of Northern China. Catena 2018, 166, 328–338. [Google Scholar] [CrossRef]
  5. Elser, J.J.; Fagan, W.F.; Kerkhoff, A.J.; Swenson, N.G.; Enquist, B.J. Biological stoichiometry of plant production: Metabolism, scaling and ecological response to global change. New Phytol. 2010, 186, 593–608. [Google Scholar] [CrossRef]
  6. Vitouseck, P.M. Nutrient cycling and nutrient use efficiency. Am. Nat. 1982, 119, 553–572. [Google Scholar] [CrossRef]
  7. Liu, R.; Wang, D. C: N: P stoichiometric characteristics and seasonal dynamics of leaf-root-litter-soil in plantations on the loess plateau. Ecol. Indic. 2021, 127, 107772. [Google Scholar] [CrossRef]
  8. Liu, Y.; He, J.W.; Yu, H.; Lin, Y.M.; Wang, D.J. Nutrients (C, N, P) contents and stoichiometric ratios of fine root, coarse root and leaf in dominant shrubs in dry-hot valley. Mt. Res. 2020, 38, 29–39. [Google Scholar]
  9. Zhang, H.; Gong, L.; Ding, Z.; Wu, X. Fine-root soil stoichiometry of picea schrenkiana fisch. et Mey. and its correlation with soil environmental factors under different nitrogen input levels in the Tianshan Mountains, Xinjiang. Forests 2023, 14, 426. [Google Scholar] [CrossRef]
  10. Heljä-Sisko, H.; Kirsi, M.; Seppo, K.; Esko, V.; Eino, M. Below and above-ground biomass, production and nitrogen use in Scots pine stands in eastern Finland. For. Ecol. Manag. 2002, 165, 317–326. [Google Scholar]
  11. Wu, J.S.; Shen, Z.X.; Zhang, X.Z.; Shi, P.L. Biomass allocation patterns of alpine grassland species and functional groups along a precipitation gradient on the Northern Tibetan Plateau. J. Mt. Sci. 2013, 10, 1097–1108. [Google Scholar] [CrossRef]
  12. Li, N.; Wang, G.X.; Yang, Y.; Gao, Y.H.; Liu, G.S. Plant production, and carbon and nitrogen source pools, are strongly intensified by experimental warming in alpine ecosystems in the Qinghai-Tibet Plateau. Soil Biol. Biochem. 2011, 43, 942–953. [Google Scholar]
  13. Qian, D.W.; Cao, G.M.; Du, Y.G.; Li, Q.; Guo, X.W. Impacts of climate change and human factors on land cover change in inland mountain protected areas: A case study of the Qilian Mountain National Nature Reserve in China. Environ. Monit. Assess. 2019, 191, 486. [Google Scholar] [CrossRef] [PubMed]
  14. Qi, Y.; Li, S.W.; Ran, Y.H.; Wang, H.W.; Wu, J.C.; Lian, X.H.; Luo, D.L. Mapping frozen ground in the Qilian Mountains in 2004–2019 using Google earth engine cloud computing. Remote Sens. 2021, 13, 149. [Google Scholar] [CrossRef]
  15. IUSS Working Group. World Reference Base for Soil Resources 2014 International Soil Classification System for Naming Soils and Creating Legends for Soil Maps; FAO: Rome, Italy, 2014. [Google Scholar]
  16. Yeomans, J.C.; Bremner, J.M. A rapid and precise method for routine determination of organic carbon in soil. Commun. Soil Sci. Plant Anal. 2008, 19, 1467–1476. [Google Scholar] [CrossRef]
  17. Bremner, J.M. Determination of nitrogen in soil by the Kjeldahl method. J. Agric. Sci. 2001, 55, 11–33. [Google Scholar] [CrossRef]
  18. Ma, X.H. Research Methods of Forest Ecosystem Positioning; China Science and Technology Press: Beijing, China, 1994. (In Chinese) [Google Scholar]
  19. Braak, C.J.F.T.; Smilauer, P. CANOCO Reference Manual and CanoDraw for Windows User’S Guide: Software for Canonical Community Ordination (Version 4.5); Section on Permutation Methods; Microcomputer Power: Ithaca, NY, USA, 2002. [Google Scholar]
  20. Cao, Y.B.; Wang, B.T.; Wei, T.T.; Ma, H.H. Ecological stoiehiometric characteristics and element reserves of three stands in a closed forest on the Chinese loess plateau. Environ. Monit. Assess. 2016, 188, 80. [Google Scholar] [CrossRef]
  21. Kerkhoff, A.J.; Fagan, W.F.; Elser, J.J.; Enquist, B.J. Phylogenetic and growth form variation in the scaling of nitrogen and phosphorus in the seed plants. Am. Nat. 2006, 168, E103–E122. [Google Scholar] [CrossRef]
  22. Yu, Q.; Elser, J.J.; He, N.P.; Wu, H.H.; Chen, Q.S.; Zhang, G.M.; Han, X.G. Stoichiometric homeostasis of vascular plants in the Inner Mongoliagrassland. Oecologia 2011, 66, 1–10. [Google Scholar] [CrossRef]
  23. Ågren, G.I. The C: N: P stoichiometry of autotrophs-theory and observations. Ecol. Lett. 2004, 7, 185–191. [Google Scholar] [CrossRef]
  24. Lasota, J.; Ewa, B. C: N: P stoichiometry as an indicator of Histosol drainage in lowland and mountain forest ecosystems. For. Ecosyst. 2021, 8, 39. [Google Scholar] [CrossRef]
  25. Jackson, R.B.; Mooney, H.A.; Sehulze, E.D. A global budget for fine root biomass, surface area, and nutrient contents. Proc. Natl. Acad. Sci. USA 1997, 94, 7362–7366. [Google Scholar] [CrossRef] [PubMed]
  26. Mayor, J.R.; Sanders, N.J.; Classen, A.T.; Bardgett, R.D.; Clément, J.C.; Fajardo, A.; Lavorel, S.; Sundqvist, M.K.; Bahn, M.; Chisholm, C. Elevation alters ecosystem properties across temperate treelines globally. Nature 2017, 542, 91–95. [Google Scholar] [CrossRef] [PubMed]
  27. Schreeg, L.A.; Santiago, L.S.; Wright, S.J.; Turner, B.L. Stem, root, and older leaf N:P ratios are more responsive indicators of soil nutrient availability than new foliage. Ecology 2016, 95, 2062–2068. [Google Scholar] [CrossRef]
  28. Han, W.; Fang, J.; Guo, D.; Zhang, Y. Leaf nitrogen and phosphorus stoichiometry across 753 terrestrial plant species in China. New Phytol. 2005, 168, 377–385. [Google Scholar] [CrossRef]
  29. He, X.L.; Ma, J.; Jin, M.; Li, Z. Characteristics and controls of ecological stoichiometry of shrub leaf in the alpine region of northwest China. Catena 2023, 224, 107005. [Google Scholar] [CrossRef]
  30. Franklin, O.; Ågren, G.I. Leaf senescence and resorption as mechanisms of maximizing photosynthetic production during canopy development at N limitation. Funct. Ecol. 2002, 16, 727–733. [Google Scholar] [CrossRef]
  31. Huang, D.; Wang, D.; Ren, Y. Using leaf nutrient stoichiometry as an indicator of flood tolerance and eutrophication in the riparian zone of the Lijang River. Ecol. Ind. 2019, 98, 821–829. [Google Scholar] [CrossRef]
  32. Dong, C.; Qiao, Y.; Cao, Y.; Chen, Y.; Wu, X.; Xue, W. Seasonal variations in carbon, nitrogen, and phosphorus stoichiometry of a Robinia pseudoacacia plantation on the Loess Hilly region, China. Forests 2021, 12, 214. [Google Scholar] [CrossRef]
  33. Yang, X.; Chi, X.; Ji, C.; Liu, H.; Ma, W.; Mohhammat, A. Variations of leaf N, P concentrations in shrubland biomes across northern China: Phylogeny, climate and soil. Biogeosciences 2016, 12, 18973–18998. [Google Scholar] [CrossRef]
  34. Hu, Y.F.; Shu, X.Y.; He, J.; Zhang, Y.L.; Xiao, H.H.; Tang, X.Y. Storage of C, N and P affected by afforestation with salix cupularis in an alpine semiarid desert ecosystem. Land Degrad. Dev. 2018, 2, 188–198. [Google Scholar]
Figure 1. Location of study area and sample plot. Note: No. 1 represents Caragana tangutica, No. 2 represents Berberis diaphana, No. 3 represents Potentilla fruticose, No. 4 represents Salix gilashanica, and No. 5 represents Caragana jubata.
Diversity 16 00748 g001
Figure 2. Correlation of fine-root C, N, and P contents and C:N:P ratios.
Diversity 16 00748 g002
Figure 3. Redundancy analysis between fine-root C, N, and P stoichiometry and soil factors. Solid arrows (red) indicate fine-roots’ C, N, and P contents and C:N:P ratios, while hollow arrows (blue) indicate soil factors. Note: A: fine-root C; B: fine-root N; C: fine-root P; D: fine-root C:N; E: fine-root C:P; F: fine-root N:P; a: soil C; b: soil N; c: soil P; d: soil AN; e: soil AP; f: soil pH; g: soil bulk density; h: soil capillary porosity; i: soil noncapillary porosity; j: soil total porosity; k: soil moisture content.
Diversity 16 00748 g003
Figure 4. The Pearson’s correlation heatmap of the soil and fine-root stoichiometric ratio. The color represents the relationships between variables (blue and red colors indicate positive and negative relationships, respectively, whereas light and white colors indicate weak and no relationships, respectively). The numbers on the heatmap represent the correlation coefficient. The asterisks indicate the statistical significance (* p < 0.05; ** p < 0.01; *** p< 0.001).
Diversity 16 00748 g004
Table 1. Characteristics of the survey plots.
ShrubsSoil Depth (cm)Soil TypeSoil pHAltitude (m)Slope Gradient (°)Slope Aspect (°)Basal Diameter (mm)Coverage (%)Average Height (m)
CT60Chestnut soil8.5260022Southwest25501.4
BD60Chestnut soil8.5260030West20701.8
PF60Alpine meadow soil8.4290033East16900.9
CJ60Alpine meadow soil7.7330040Northwest20600.6
SG60Alpine meadow soil6.6330032Northwest26551.4
Table 2. C, N, and P contents and C:N:P ratios in shrub fine roots (n = 15).
ParameterCTBDPFCJSGMeanSDCVF Valuep Value
C (g kg−1)526.66 ± 33.85 a556.38 ± 25.55 a540.61 ± 17.72 a531.30 ± 10.20 a551.93 ± 29.95 a541.3812.800.020.790.56
N (g kg−1)12.20 ± 1.50 a7.86 ± 1.27 b7.09 ± 1.50 b10.98 ± 2.77 a4.94 ± 0.58 b8.612.640.319.27<0.01
P (g kg−1)0.92 ± 0.18 b0.94 ± 0.17 b1.08 ± 0.23 ab1.58 ± 0.48 a0.99 ± 0.24 b1.100.250.222.840.04
C:N43 ± 2.79 c71 ± 9.31 b78 ± 15.94 b50 ± 13.76 c112 ± 8.13 a71.3424.230.3418.22<0.001
C:P584 ± 78.52 a603 ± 94.55 a513 ± 101.33 ab360 ± 121.94 b576 ± 106.96 a527.6188.950.172.870.04
N:P13 ± 1.62 a8 ± 0.22 b6 ± 0.25 cd7 ± 0.49 bc5 ± 0.74 d8.112.880.3544.08<0.001
Note: The different lowercase letters indicate that there are significant differences in carbon, nitrogen, and phosphorus contents and stoichiometric ratios among different shrubs (p < 0.05). Berberis diaphana (BD), Caragana tangutica (CT), Caragana jubata (CJ), Salix gilashanica (SG), and Potentilla fruticose (PF).
Table 3. Redundancy analysis of fine-root ecological stoichiometry and soil properties.
VariablesMCR %F-Ratiop-Value
Soil AP33.26.40.024 *
Soil pH20.57.90.020 *
Soil total porosity17.64.30.080
Soil bulk density6.42.80.130
Soil C4.12.30.152
Soil N4.02.00.164
Soil noncapillary porosity2.00.70.438
Soil P1.50.70.440
Soil AN1.20.60.512
Soil capillary porosity0.70.40.570
Soil moisture content0.2<0.10.840
Note: * Correlation is significant at the 0.05 level (2-tailed); MCR: Monte Carlo Resampling.
Disclaimer/Publisher’s Note: The statements, opinions and data contained in all publications are solely those of the individual author(s) and contributor(s) and not of MDPI and/or the editor(s). MDPI and/or the editor(s) disclaim responsibility for any injury to people or property resulting from any ideas, methods, instructions or products referred to in the content.

