
Diversity of Epiphytic Subaerial Algal Communities in Bangkok, Thailand, and Their Potential Bioindicator with Air Pollution


Abstract
1. Introduction
2. Materials and Methods
2.1. Study Sites
2.2. Sample Collection
2.3. Measurement of Air Pollutants
2.4. Assessment of Diversity of the Subaerial Epiphytic Communities
2.4.1. Merging of Paired-End Reads and Quality Control
2.4.2. Amplicon Sequence Variants (ASVs) Denoising and Taxon Annotation
2.5. Indices of Algal Community Structure
2.6. Potential for Use of the Relationship between Algal Diversity and Abundance and the Air Pollutants
3. Results
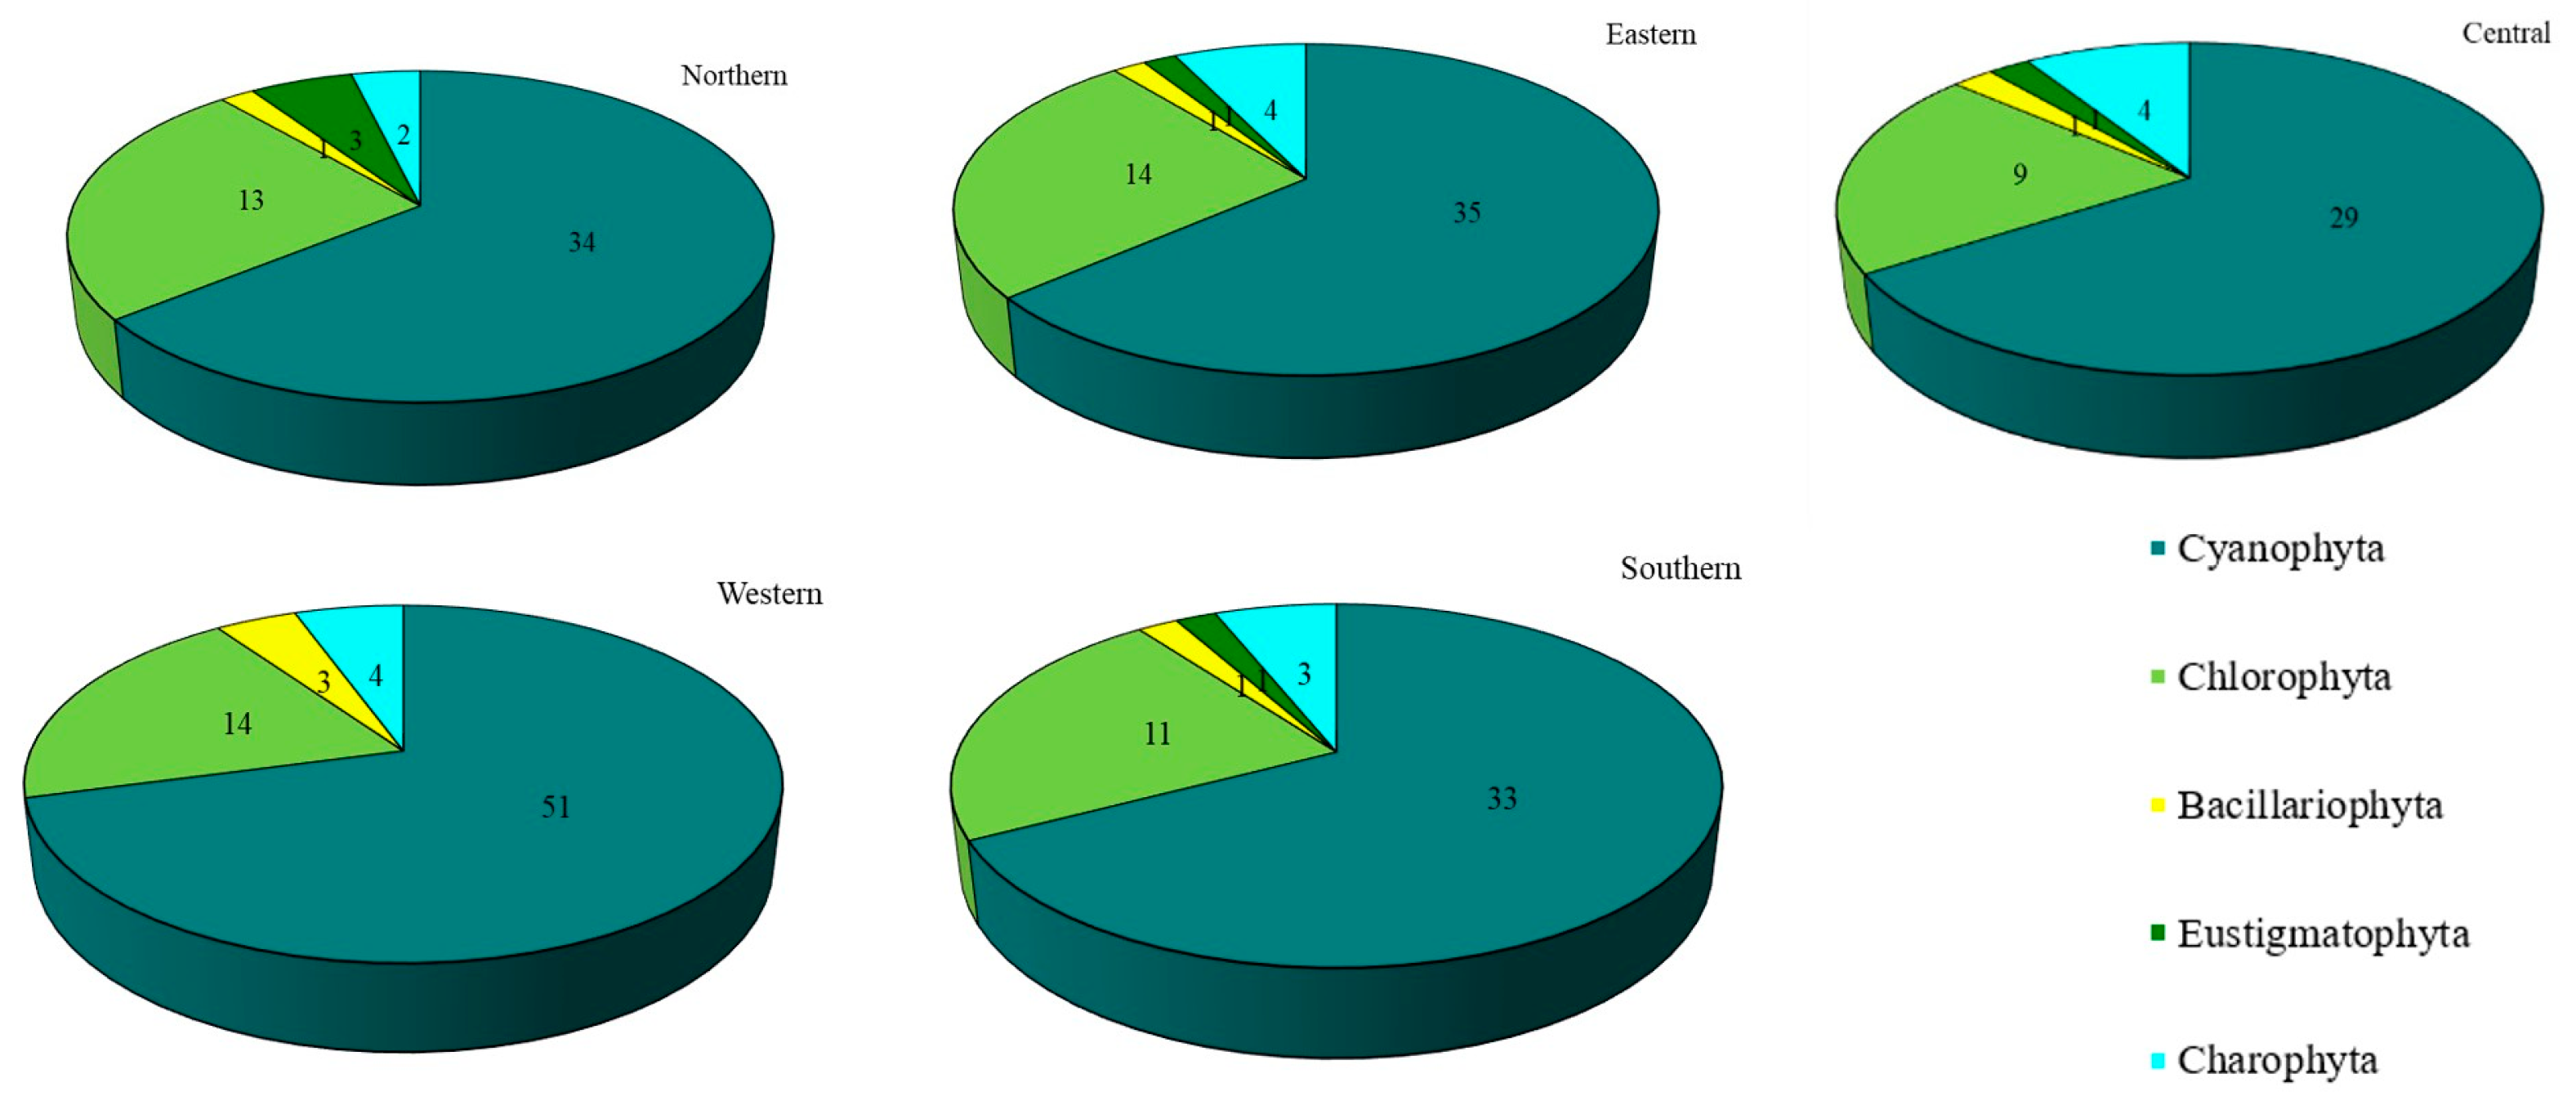
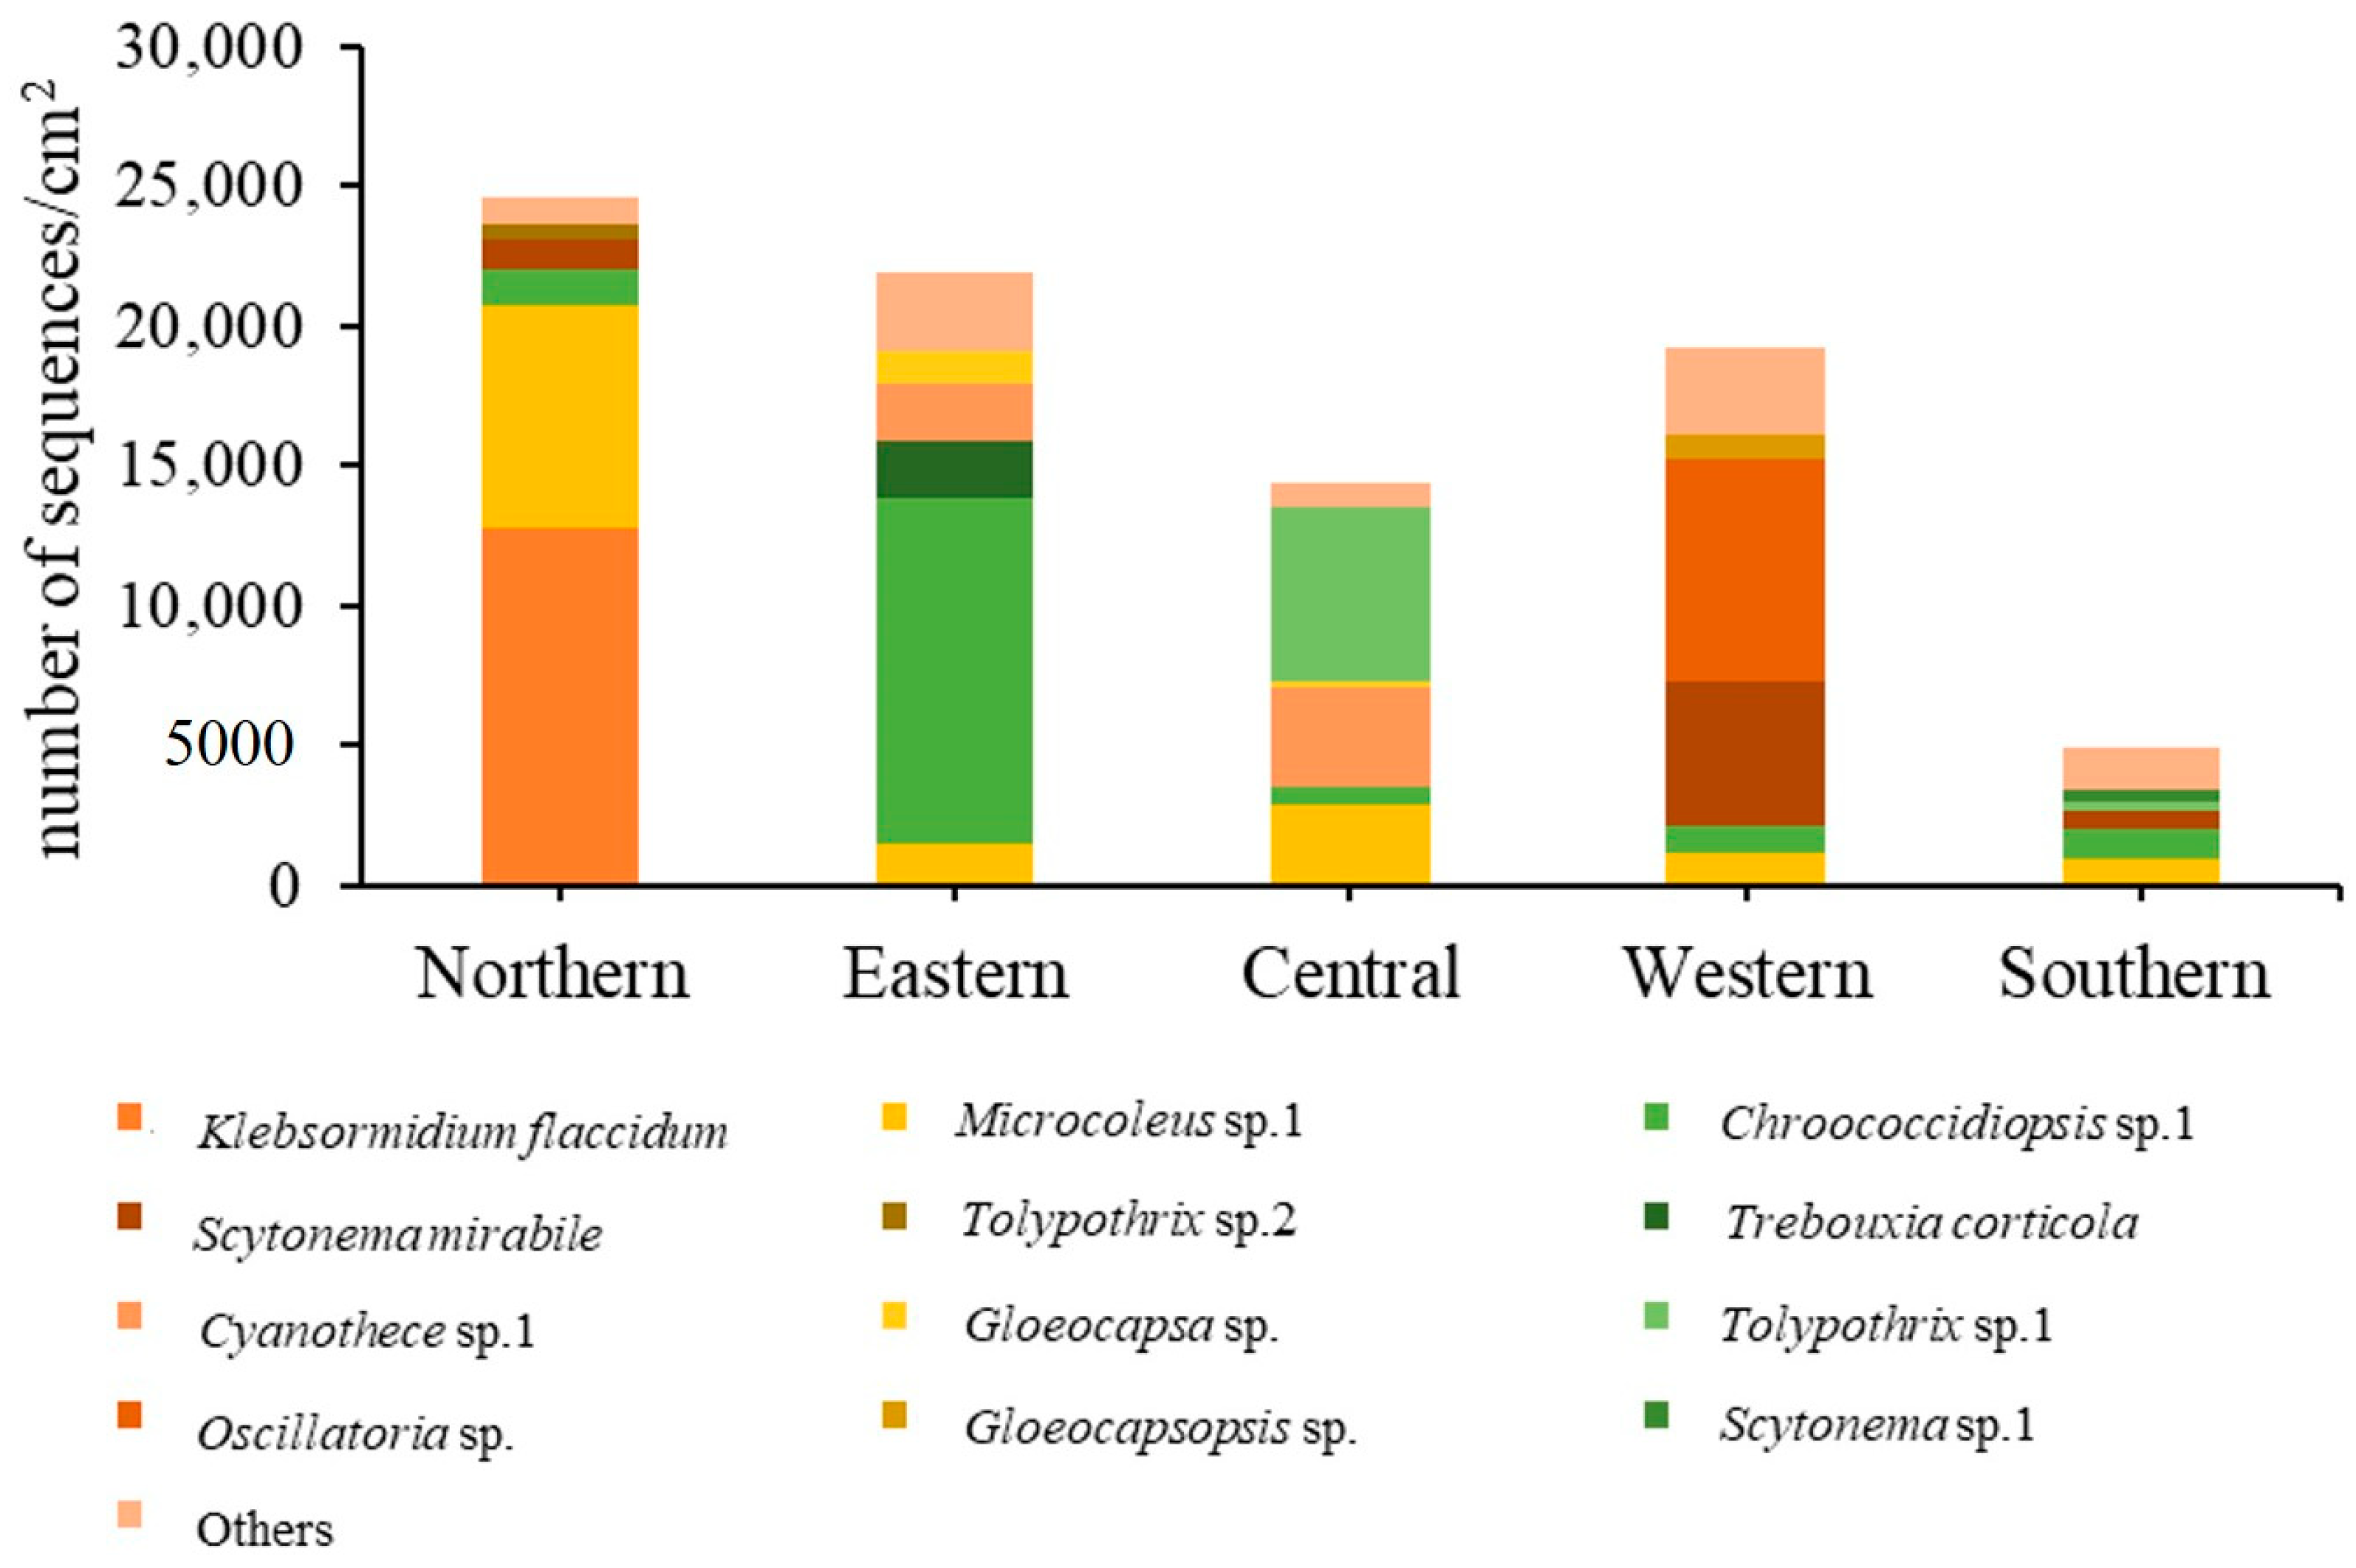
3.1. Diversity and Abundance of Algae
3.2. Types of Air Pollutants
3.3. Index Values for Algal Communities
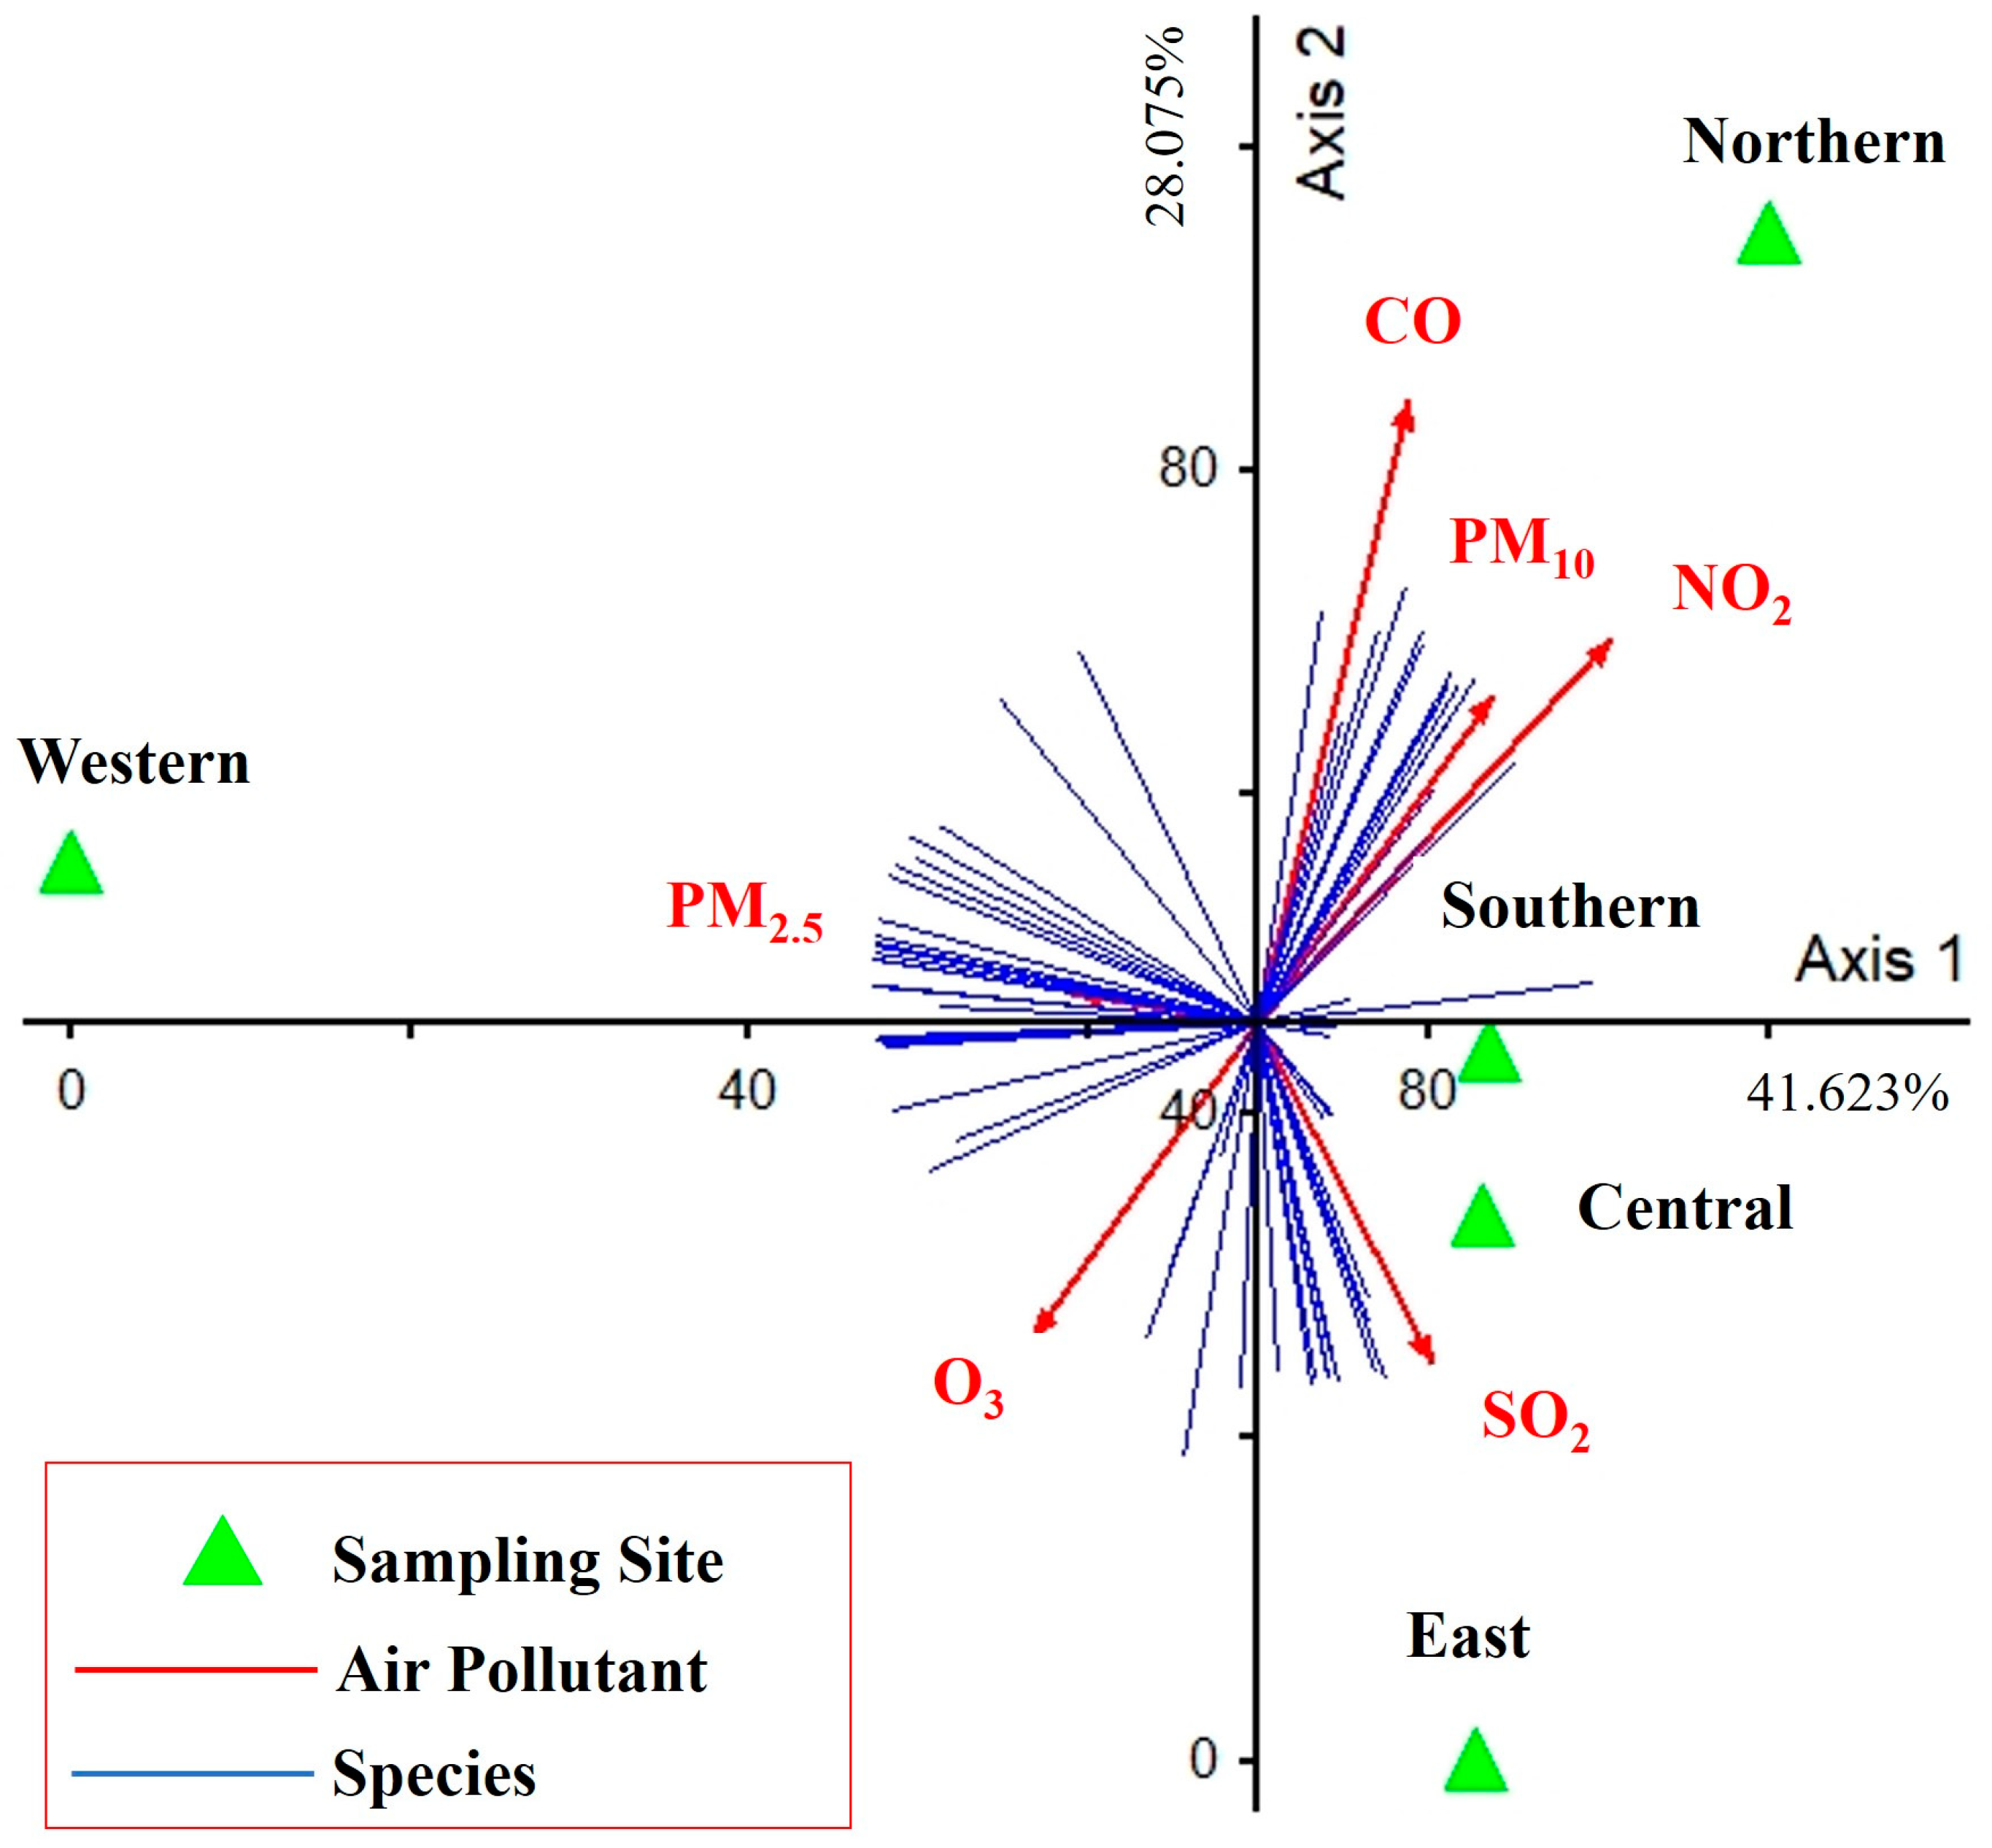
3.4. Relationship between Diversity of Taxa and Air Pollutants
4. Discussion
5. Conclusions
Author Contributions
Funding
Institutional Review Board Statement
Data Availability Statement
Acknowledgments
Conflicts of Interest
Appendix A

| Northern Site | Eastern Site | Central Site | Western Site | Southern Site | |
|---|---|---|---|---|---|
| Oscillatoria sp. | 163 | 9 | 22 | 7911 | 102 |
| Scytonema mirabile | 1106 | 265 | 255 | 5232 | 656 |
| Microcoleus sp. 1 | 7941 | 1454 | 2922 | 1144 | 1004 |
| Chroococcidiopsis sp. 1 | 1302 | 12,391 | 602 | 962 | 1013 |
| Gloeocapsopsis sp. | 7 | 28 | 8 | 900 | 19 |
| Stanieria sp. | 16 | 7 | 18 | 793 | 14 |
| Tolypothrix sp. 1 | 61 | 140 | 6186 | 242 | 301 |
| Microchaete diplosiphon | 0 | 0 | 0 | 199 | 3 |
| Scytonema sp. 1 | 0 | 164 | 22 | 160 | 444 |
| Tolypothrix sp. 2 | 506 | 244 | 140 | 152 | 165 |
| Calothrix sp. 3 | 36 | 0 | 0 | 131 | 1 |
| Pleurocapsa minor | 90 | 22 | 20 | 122 | 32 |
| Cyanothece sp. 1 | 4 | 2057 | 3543 | 92 | 291 |
| Hyella patelloides | 0 | 0 | 0 | 78 | 2 |
| Calothrix sp. 2 | 64 | 6 | 18 | 40 | 156 |
| Nostoc piscinale | 0 | 1 | 1 | 39 | 0 |
| Chondrocystis sp. | 2 | 0 | 0 | 37 | 0 |
| Chroococcidiopsis thermalis | 15 | 98 | 10 | 33 | 52 |
| Brasilonema sp. | 0 | 2 | 0 | 17 | 2 |
| Calothrix sp. 1 | 0 | 396 | 6 | 17 | 6 |
| Cyanothece sp. 3 | 6 | 3 | 0 | 13 | 5 |
| Gloeocapsa sp. | 164 | 1118 | 282 | 13 | 95 |
| Microcoleus sp. 3 | 1 | 3 | 0 | 12 | 0 |
| Lusitaniella coriacea | 0 | 0 | 0 | 12 | 198 |
| Cyanothece sp. 4 | 0 | 3 | 0 | 11 | 0 |
| Nostoc linckia | 1 | 76 | 1 | 11 | 0 |
| Calothrix brevissima | 0 | 2 | 3 | 10 | 0 |
| Cyanothece sp. 5 | 2 | 0 | 0 | 10 | 0 |
| Nostoc sp. 1 | 61 | 1 | 1 | 8 | 0 |
| Scytonema hofmannii | 33 | 0 | 11 | 8 | 12 |
| Oscillatoria nigro-viridis | 28 | 0 | 0 | 8 | 0 |
| Nostoc sp. 2 | 0 | 0 | 0 | 6 | 0 |
| Cylindrospermum stagnale | 0 | 551 | 13 | 6 | 0 |
| Scytonema crispum | 0 | 0 | 7 | 5 | 17 |
| Gloeobacter kilaueensis | 0 | 0 | 0 | 5 | 0 |
| Coleofasciculus chthonoplastes | 1 | 0 | 0 | 5 | 2 |
| Oculatella neakameniensis | 0 | 0 | 0 | 4 | 0 |
| Leptolyngbya sp. 2 | 0 | 0 | 0 | 4 | 1 |
| Leptolyngbya sp. 3 | 0 | 0 | 0 | 4 | 0 |
| Scytonema sp. 2 | 0 | 7 | 0 | 3 | 0 |
| Lyngbya aestuarii | 0 | 0 | 0 | 3 | 0 |
| Calothrix sp. 4 | 0 | 3 | 5 | 3 | 0 |
| Synechococcus lividus | 0 | 0 | 0 | 2 | 4 |
| Oscillatoria acuminata | 0 | 0 | 0 | 2 | 0 |
| Trichormus azollae | 0 | 0 | 0 | 1 | 0 |
| Nodosilinea sp. | 0 | 0 | 0 | 1 | 0 |
| Thermosynechococcus sp. | 0 | 0 | 0 | 1 | 0 |
| Crinalium epipsammum | 0 | 0 | 0 | 1 | 0 |
| Sphaerospermopsis kisseleviana | 0 | 0 | 0 | 1 | 0 |
| Fischerella muscicola | 0 | 19 | 1 | 1 | 0 |
| Pleurocapsa sp. | 1 | 0 | 0 | 1 | 0 |
| Dolichospermum compactum | 2 | 0 | 0 | 0 | 72 |
| Stanieria cyanosphaera | 2 | 0 | 0 | 0 | 23 |
| Cyanothece sp. 2 | 40 | 4 | 0 | 0 | 22 |
| Nostoc punctiforme | 1 | 211 | 2 | 0 | 15 |
| Cylindrospermum muscicola | 0 | 0 | 0 | 0 | 1 |
| Calothrix sp. 6 | 0 | 0 | 0 | 0 | 1 |
| Anabaena sp. 1 | 0 | 0 | 25 | 0 | 1 |
| Calothrix sp. 5 | 0 | 0 | 5 | 0 | 0 |
| Jaaginema litorale | 9 | 0 | 4 | 0 | 0 |
| Cylindrospermum sp. | 75 | 13 | 0 | 0 | 0 |
| Cyanothece sp. 6 | 0 | 6 | 0 | 0 | 0 |
| Camptylonemopsis sp. | 0 | 3 | 0 | 0 | 0 |
| Gloeocapsopsis crepidinum | 0 | 2 | 0 | 0 | 0 |
| Chroococcidiopsis sp. 2 | 0 | 2 | 0 | 0 | 0 |
| Cyanobium gracile | 0 | 1 | 0 | 0 | 0 |
| Leptolyngbya sp. 1 | 5 | 0 | 0 | 0 | 0 |
| Nostoc carneum | 3 | 0 | 0 | 0 | 0 |
| Phormidium tinctorium | 2 | 0 | 0 | 0 | 0 |
| Synechococcus sp. | 2 | 0 | 0 | 0 | 0 |
| Diadesmis sp. | 49 | 3 | 8 | 5 | 5 |
| Nitzschia sp. | 0 | 0 | 0 | 3 | 0 |
| Cylindrotheca closterium | 0 | 0 | 0 | 1 | 0 |
| Watanabea reniformis | 21 | 97 | 17 | 16 | 53 |
| Ignatius tetrasporus | 37 | 20 | 5 | 20 | 27 |
| Nannochloris normandinae | 17 | 135 | 36 | 47 | 13 |
| Scenedesmus | 4 | 104 | 24 | 236 | 13 |
| Trebouxia corticola | 5 | 2090 | 38 | 6 | 5 |
| Trebouxia australis | 0 | 9 | 0 | 14 | 2 |
| Chloromonas perforata | 1 | 0 | 0 | 0 | 2 |
| Pyramimonas disomata | 3 | 13 | 0 | 232 | 2 |
| Xylochloris irregularis | 0 | 1 | 0 | 6 | 1 |
| Lobosphaera incisa | 3 | 13 | 0 | 18 | 1 |
| Edaphochlorella mirabilis | 0 | 4 | 2 | 2 | 1 |
| Dilabifilum sp. | 0 | 0 | 0 | 46 | 0 |
| Heterochlorella | 0 | 0 | 4 | 5 | 0 |
| Friedmannia sp. | 0 | 0 | 0 | 1 | 0 |
| Symbiochloris reticulata | 12 | 7 | 0 | 1 | 0 |
| Acutodesmus sp. | 0 | 2 | 5 | 0 | 0 |
| Parachlorella kessleri | 46 | 6 | 4 | 0 | 0 |
| Trebouxia decolorans | 0 | 1 | 0 | 0 | 0 |
| Symbiochloris irregularis | 20 | 0 | 0 | 0 | 0 |
| Stichococcus sp. | 4 | 0 | 0 | 0 | 0 |
| Chlamydomonas zebra | 2 | 0 | 0 | 0 | 0 |
| Monodopsis sp. 2 | 22 | 16 | 14 | 0 | 28 |
| Nannochloropsis oculata | 29 | 0 | 0 | 0 | 0 |
| Chlorokybus atmophyticus | 0 | 0 | 0 | 1 | 21 |
| Klebsormidium sp. 2 | 12 | 3 | 35 | 11 | 6 |
| Klebsormidium sp. 1 | 0 | 19 | 13 | 83 | 1 |
| Klebsormidium flaccidum | 12,763 | 10 | 91 | 22 | 0 |
| Klebsormidium sp. 3 | 0 | 20 | 23 | 0 | 0 |
| CO | NO2 | O3 | PM2.5 | PM10 | SO2 | |
|---|---|---|---|---|---|---|
| Oscillatoria sp. | −0.236 | −0.509 | 0.400 | 0.498 | −0.358 | −0.547 |
| Scytonema mirabile | −0.097 | −0.378 | 0.274 | 0.549 | −0.239 | −0.580 |
| Microcoleus sp. 1 | 0.939 * | 0.730 | −0.510 | −0.307 | 0.916 * | −0.354 |
| Chroococcidiopsis sp. 1 | −0.327 | −0.276 | 0.294 | −0.026 | 0.046 | 0.784 |
| Gloeocapsopsis sp. | −0.264 | −0.532 | 0.420 | 0.500 | −0.377 | −0.524 |
| Stanieria sp. | −0.247 | −0.521 | 0.413 | 0.487 | −0.370 | −0.551 |
| Tolypothrix sp. 1 | −0.287 | −0.334 | 0.475 | −0.857 | −0.368 | −0.369 |
| Microchaete diplosiphon | −0.254 | −0.521 | 0.409 | 0.499 | −0.375 | −0.538 |
| Scytonema sp. 1 | −0.386 | 0.034 | −0.317 | 0.678 | −0.460 | 0.562 |
| Tolypothrix sp. 2 | 0.925 * | 0.773 | −0.610 | −0.022 | 0.999 ** | −0.048 |
| Calothrix sp. 3 | 0.017 | −0.312 | 0.244 | 0.498 | −0.114 | −0.633 |
| Pleurocapsa minor | 0.399 | 0.061 | −0.081 | 0.505 | 0.258 | −0.648 |
| Cyanothece sp. 1 | −0.499 | −0.495 | 0.638 | −0.866 | −0.371 | 0.082 |
| Hyella patelloides | −0.255 | −0.520 | 0.406 | 0.504 | −0.377 | −0.536 |
| Calothrix sp. 2 | 0.222 | 0.583 | −0.781 | 0.572 | 0.000 | 0.209 |
| Nostoc piscinale | −0.277 | −0.555 | 0.450 | 0.469 | −0.387 | −0.536 |
| Chondrocystis sp. | −0.194 | −0.484 | 0.386 | 0.486 | −0.317 | −0.573 |
| Chroococcidiopsis thermalis | −0.470 | −0.263 | 0.145 | 0.329 | −0.175 | 0.880 * |
| Brasilonema sp. | −0.320 | −0.553 | 0.419 | 0.557 | −0.413 | −0.432 |
| Calothrix sp. 1 | −0.388 | −0.340 | 0.353 | −0.041 | −0.017 | 0.734 |
| Cyanothece sp. 3 | 0.079 | −0.110 | −0.036 | 0.785 | −0.051 | −0.384 |
| Gloeocapsa sp. | −0.332 | −0.279 | 0.347 | −0.262 | 0.042 | 0.713 |
| Microcoleus sp. 3 | −0.262 | −0.555 | 0.459 | 0.502 | −0.305 | −0.427 |
| Lusitaniella coriacea | −0.122 | 0.324 | −0.561 | 0.527 | −0.288 | 0.414 |
| Cyanothece sp. 4 | −0.364 | −0.631 | 0.524 | 0.491 | −0.380 | −0.347 |
| Nostoc linckia | −0.402 | −0.390 | 0.398 | 0.004 | −0.035 | 0.682 |
| Calothrix brevissima | −0.445 | −0.750 | 0.691 | 0.205 | −0.522 | −0.564 |
| Cyanothece sp. 5 | −0.056 | −0.374 | 0.297 | 0.495 | −0.183 | −0.615 |
| Nostoc sp. 1 | 0.975 * | 0.752 | −0.591 | −0.001 | 0.943 * | −0.342 |
| Scytonema hofmannii | 0.964 ** | 0.841 | −0.709 | −0.059 | 0.805 | −0.444 |
| Oscillatoria nigro-viridis | 0.949 * | 0.689 | −0.547 | 0.079 | 0.893 * | −0.427 |
| Nostoc sp. 2 | −0.252 | −0.524 | 0.416 | 0.491 | −0.370 | −0.542 |
| Cylindrospermum stagnale | −0.376 | −0.327 | 0.349 | −0.070 | −0.003 | 0.734 |
| Scytonema crispum | −0.329 | 0.044 | −0.259 | 0.296 | −0.577 | 0.111 |
| Gloeobacter kilaueensis | −0.252 | −0.524 | 0.416 | 0.491 | −0.370 | −0.542 |
| Coleofasciculus chthonoplastes | −0.097 | −0.226 | 0.044 | 0.737 | −0.300 | −0.447 |
| Oculatella neakameniensis | −0.252 | −0.524 | 0.416 | 0.491 | −0.370 | −0.542 |
| Leptolyngbya sp. 2 | −0.287 | −0.451 | 0.280 | 0.634 | −0.450 | −0.446 |
| Leptolyngbya sp. 3 | −0.252 | −0.524 | 0.416 | 0.491 | −0.370 | −0.542 |
| Scytonema sp. 2 | −0.486 | −0.563 | 0.530 | 0.178 | −0.167 | 0.491 |
| Lyngbya aestuarii | −0.252 | −0.524 | 0.416 | 0.491 | −0.370 | −0.542 |
| Calothrix sp. 4 | −0.585 | −0.790 | 0.917 * | −0.705 | −0.503 | 0.281 |
| Synechococcus lividus | −0.226 | 0.103 | −0.384 | 0.728 | −0.441 | 0.185 |
| Oscillatoria acuminata | −0.252 | −0.524 | 0.416 | 0.491 | −0.370 | −0.542 |
| Trichormus azollae | −0.252 | −0.524 | 0.416 | 0.491 | −0.370 | −0.542 |
| Nodosilinea sp. | −0.252 | −0.524 | 0.416 | 0.491 | −0.370 | −0.542 |
| Thermosynechococcus sp. | −0.252 | −0.524 | 0.416 | 0.491 | −0.370 | −0.542 |
| Crinalium epipsammum | −0.252 | −0.524 | 0.416 | 0.491 | −0.370 | −0.542 |
| Sphaerospermopsis kisseleviana | −0.252 | −0.524 | 0.416 | 0.491 | −0.370 | −0.542 |
| Fischerella muscicola | −0.402 | −0.367 | 0.389 | −0.077 | −0.031 | 0.711 |
| Pleurocapsa sp. | 0.600 | 0.231 | −0.184 | 0.356 | 0.485 | −0.662 |
| Dolichospermum compactum | −0.079 | 0.375 | −0.600 | 0.493 | −0.238 | 0.436 |
| Stanieria cyanosphaera | −0.010 | 0.438 | −0.654 | 0.495 | −0.172 | 0.423 |
| Cyanothece sp. 2 | 0.914 * | 0.988 ** | −0.941 ** | 0.210 | 0.842 | 0.045 |
| Nostoc punctiforme | −0.377 | −0.293 | 0.299 | −0.031 | −0.009 | 0.783 |
| Cylindrospermum muscicola | −0.106 | 0.350 | −0.578 | 0.491 | −0.263 | 0.440 |
| Calothrix sp. 6 | −0.106 | 0.350 | −0.578 | 0.491 | −0.263 | 0.440 |
| Anabaena sp. 1 | −0.272 | −0.310 | 0.453 | −0.861 | −0.353 | −0.358 |
| Calothrix sp. 5 | −0.265 | −0.321 | 0.472 | −0.873 | −0.339 | −0.372 |
| Jaaginema litorale | 0.875 | 0.668 | −0.430 | −0.456 | 0.818 | −0.442 |
| Cylindrospermum sp. | 0.949 * | 0.774 | −0.599 | −0.066 | 0.994 ** | −0.139 |
| Cyanothece sp. 6 | −0.364 | −0.312 | 0.331 | −0.055 | 0.008 | 0.743 |
| Camptylonemopsis sp. | −0.364 | −0.312 | 0.331 | −0.055 | 0.008 | 0.743 |
| Gloeocapsopsis crepidinum | −0.364 | −0.312 | 0.331 | −0.055 | 0.008 | 0.743 |
| Chroococcidiopsis sp. 2 | −0.364 | −0.312 | 0.331 | −0.055 | 0.008 | 0.743 |
| Cyanobium gracile | −0.364 | −0.312 | 0.331 | −0.055 | 0.008 | 0.743 |
| Leptolyngbya sp. 1 | 0.986 ** | 0.807 | −0.641 | −0.055 | 0.964 ** | −0.268 |
| Nostoc carneum | 0.986 ** | 0.807 | −0.641 | −0.055 | 0.964 ** | −0.268 |
| Phormidium tinctorium | 0.986 ** | 0.807 | −0.641 | −0.055 | 0.964 ** | −0.268 |
| Synechococcus sp. | 0.986 ** | 0.807 | −0.641 | −0.055 | 0.964 ** | −0.268 |
| Diadesmis sp. | 0.986 ** | 0.802 | −0.627 | −0.107 | 0.940 * | −0.332 |
| Nitzschia sp. | −0.252 | −0.524 | 0.416 | 0.491 | −0.370 | −0.542 |
| Cylindrotheca closterium | −0.252 | −0.524 | 0.416 | 0.491 | −0.370 | −0.542 |
| Watanabea reniformis | −0.371 | −0.112 | 0.035 | 0.164 | −0.063 | 0.957 * |
| Ignatius tetrasporus | 0.774 | 0.801 | −0.835 | 0.589 | 0.761 | 0.142 |
| Nannochloris normandinae | −0.494 | −0.538 | 0.563 | −0.090 | −0.138 | 0.564 |
| Scenedesmus | −0.461 | −0.713 | 0.611 | 0.437 | −0.429 | −0.252 |
| Trebouxia corticola | −0.370 | −0.319 | 0.340 | −0.069 | 0.003 | 0.739 |
| Trebouxia australis | −0.500 | −0.676 | 0.547 | 0.528 | −0.404 | −0.010 |
| Chloromonas perforata | 0.547 | 0.857 | −0.962 ** | 0.424 | 0.386 | 0.236 |
| Pyramimonas disomata | −0.263 | −0.537 | 0.428 | 0.500 | −0.364 | −0.511 |
| Xylochloris irregularis | −0.396 | −0.572 | 0.406 | 0.632 | −0.460 | −0.285 |
| Lobosphaera incisa | −0.369 | −0.605 | 0.524 | 0.469 | −0.230 | −0.021 |
| Edaphochlorella mirabilis | −0.758 | −0.735 | 0.700 | −0.073 | −0.462 | 0.542 |
| Dilabifilum sp. | −0.252 | −0.524 | 0.416 | 0.491 | −0.370 | −0.542 |
| Heterochlorella | −0.406 | −0.701 | 0.693 | −0.086 | −0.566 | −0.750 |
| Friedmannia sp. | −0.252 | −0.524 | 0.416 | 0.491 | −0.370 | −0.542 |
| Symbiochloris reticulata | 0.762 | 0.584 | −0.415 | −0.038 | 0.944 * | 0.106 |
| Acutodesmus sp. | −0.452 | −0.481 | 0.641 | −0.896 * | −0.333 | 0.015 |
| Parachlorella kessleri | 0.957 * | 0.771 | −0.578 | −0.153 | 0.980 ** | −0.211 |
| Trebouxia decolorans | −0.364 | −0.312 | 0.331 | −0.055 | 0.008 | 0.743 |
| Symbiochloris irregularis | 0.986 ** | 0.807 | −0.641 | −0.055 | 0.964 ** | −0.268 |
| Stichococcus sp. | 0.986 ** | 0.807 | −0.641 | −0.055 | 0.964 ** | −0.268 |
| Chlamydomonas zebra | 0.986 ** | 0.807 | −0.641 | −0.055 | 0.964 ** | −0.268 |
| Monodopsis sp. 2 | 0.382 | 0.763 | −0.775 | −0.034 | 0.384 | 0.560 |
| Nannochloropsis oculata | 0.986 ** | 0.807 | −0.641 | −0.055 | 0.964 ** | −0.268 |
| Chlorokybus atmophyticus | −0.119 | 0.329 | −0.564 | 0.520 | −0.284 | 0.419 |
| Klebsormidium sp. 2 | −0.085 | −0.230 | 0.392 | −0.802 | −0.232 | −0.618 |
| Klebsormidium sp. 1 | −0.405 | −0.689 | 0.597 | 0.381 | −0.459 | −0.461 |
| Klebsormidium flaccidum | 0.986 ** | 0.806 | −0.638 | −0.060 | 0.963 ** | −0.272 |
| Klebsormidium sp. 3 | −0.506 | −0.516 | 0.661 | −0.798 | −0.288 | 0.243 |
References
- John, D.M. Phylum Chlorophyta (green algae). In The Freshwater Algal Flora of the British Isles; John, D.M., Whitton, B.A., Brook, A.J., Eds.; Cambridge University Press: Cambridge, UK, 2002; pp. 287–612. [Google Scholar]
- López-Bautista, J.M.; Rindi, F.; Casamatta, D. The systematics of subaerial algae. In Algae and Cyanobacteria in Extreme Environments; Seckbach, J., Ed.; Springer: Dordrecht, The Netherlands, 2007; pp. 599–617. [Google Scholar]
- Rindi, F. Diversity, distribution and ecology of green algae and cyanobacteria in urban habitats. In Algae and Cyanobacteria in Extreme Environments; Seckbach, J., Ed.; Springer: Dordrecht, The Netherlands, 2007; pp. 619–638. [Google Scholar]
- Graham, L.; Graham, J.; Wilcox, L. Algae, 2nd ed.; Benjamin Cummings (Pearson): San Francisco, CA, USA, 2009. [Google Scholar]
- Hallmann, C.; Hoppert, M.; Mudimu, O.; Friedl, T. Biodiversity of green algae covering artificial hard substrate surfaces in a suburban environment: A case study using molecular approaches. J. Phycol. 2016, 52, 732–744. [Google Scholar] [CrossRef]
- Sherwood, A.R.; Dittbenr, M.N.; Johnston, E.T.; Conklin, K.Y. A metabarcoding comparison of windward and leeward airborne algal diversity across the Ko’olau mountain range on the island of O’ahu, Hawai’i. J. Phycol. 2017, 53, 437–455. [Google Scholar] [CrossRef] [PubMed]
- Johnston, E.; Conklin, K.; Fredrick, P.; Sherwood, A. Pyrosequencing and culturing of Hawaiian corticolous biofilms demonstrate high diversity and confirm phylogenetic placement of the green alga Spongiochrysis hawaiiensis in Cladophorales (Ulvophyceae). Phycologia 2018, 57, 572–580. [Google Scholar] [CrossRef] [PubMed]
- Zhu, H.; Li, S.; Hu, Z.; Liu, G. Molecular characterization of eukaryotic algal communities in the tropical phyllosphere based on real-time sequencing of the 18S rDNA gene. BMC Plant Biol. 2018, 18, 365. [Google Scholar] [CrossRef] [PubMed]
- Sherwood, A.R.; Wade, R.M.; Conklin, K.Y. Seasonality of tropical airborne algae: A 16-month study based on high-throughput sequencing in the Hawaiian Islands. Grana 2020, 5, 354–365. [Google Scholar] [CrossRef]
- Rybalka, N.; Blanke, M.; Tzvetkova, A.; Noll, A.; Roos, C.; Boy, J.; Boy, D.; Nimptsch, D.; Godoy, R.; Friedl, T. Unrecognized diversity and distribution of soil algae from Maritime Antarctica (Fildes Peninsula, King George Island). Front. Microbiol. 2023, 14, 1118747. [Google Scholar] [CrossRef] [PubMed]
- Haapala, H.; Goltsova, N.; Seppälä, H.S.; Kouki, J.; Lamppu, J.; Popovichev, B. Ecological condition of forests around the eastern part of the Gulf of Finland. Environ. Pollut. 1996, 91, 253–265. [Google Scholar] [CrossRef]
- Marmor, L.; Degtjarenko, P. Trentepohlia umbrina on Scots pine as bioindicator of alkaline dust pollution. Ecol. Indic. 2014, 45, 717–720. [Google Scholar] [CrossRef]
- Razli, S.A.; Azlam, A.; Ismail, A.; Murnira, O.; Ahmad, M.A.A.; Hafizah, B.N.; Kadaruddin, A.; Talib, L.M. Epiphytic microalgae as biological indicators for carbon monoxide concentrations in different areas of Peninsular Malaysia. Environ. Forensics 2022, 23, 314–323. [Google Scholar] [CrossRef]
- Roy-Ocotla, G.; Carrera, J. Aeroalgae: Response to some aerobiological questions. Grana 1993, 32, 48–56. [Google Scholar] [CrossRef]
- Ra, H.S.Y.; Crang, F.E. Changes in thallus and algal cell components of two lichen species in response to low-level air pollution at Pacific Northeast Forests. Microsc. Microanal. 2002, 8, 1078–1079. [Google Scholar] [CrossRef]
- Ismail, A.; Wahab, N.A.; Latif, M.T.; Said, M.; Ismail, A.; Zulkifli, A.R.; Alwi, I.; Daud, D.; Sulaiman, F.N. Atmospheric air pollution and roughness of bark as possible factors in increasing density of epiphytic terrestrial algae. Asian J. Appl. Sci. 2016, 4, 256–261. [Google Scholar]
- Hemond, H.F.; Fechner-Levy, E.J. Chemical Fate and Transport in The Environment; Academic Press: London, UK, 2000. [Google Scholar]
- Zhang, B.N.; Oanh, N.T. Photochemical smog pollution in the Bangkok Metropolitan Region of Thailand in relation to O3 precursor concentrations and meteorological conditions. Atmos. Environ. 2002, 36, 4211–4222. [Google Scholar] [CrossRef]
- Organization for Economic Cooperation and Development [OECD]. OECD Green Growth Studies: Green Growth in Bangkok, Thailand; OECD: Paris, France, 2015. [Google Scholar]
- Dhakal, S.; Shrestha, A. Bangkok, Thailand. In Cities on A Finite Planet: Towards Transformative Responses to Climate Change; Bartlett, S., Satterthwaite, D., Eds.; Routledge: London, UK, 2016; pp. 63–81. [Google Scholar]
- Klongvessa, P.; Chotpantarat, S. Statistical analysis of rainfall variations in the Bangkok urban area, Thailand. Arab. J. Geosci. 2015, 8, 4207–4219. [Google Scholar] [CrossRef]
- Bangkok Metropolitan Administration and Chulalongkorn University. Executive Summary 20-Year Development Plan for Bangkok Metropolis; Strategy and Evaluation Department Bangkok Metropolitan Administration and Faculty of Political Sciences; Chulalongkorn University: Bangkok, Thailand, 2011. [Google Scholar]
- Schwela, D.; Zali, O. Urban Traffic Pollution; E & FN Spon: London, UK, 1999. [Google Scholar]
- Muttamara, S.; Leong, S.T. Monitoring and assessment of exhaust emission in Bangkok Street air. Environ. Monit. Assess. 2000, 60, 163–180. [Google Scholar] [CrossRef]
- Afroz, R. Review of air pollution and health impacts in Malaysia. Environ. Res. 2003, 92, 71–77. [Google Scholar] [CrossRef] [PubMed]
- Jorge, N.; Díaz-Gamboa, R.E. Chapter: 4. line transect sampling. In Introduction to Ecological Sampling; Manly, B., Navarro, J., Eds.; CRC Press: Boca Raton, FL, USA, 2015; pp. 47–62. [Google Scholar]
- Sherwood, A.R.; Presting, G.G. Universal primers amplify a 23S rDNA plastid marker in eukaryotic algae and Cyanobacteria. J. Phycol. 2007, 43, 605–608. [Google Scholar] [CrossRef]
- Sherwood, A.R.; Chan, Y.L.; Presting, G.G. Application of universally amplifying plastid primers to environmental sampling of a stream periphyton community. Mol. Ecol. Resour. 2008, 8, 1011–1014. [Google Scholar] [CrossRef]
- Haendiges, J.; Timme, R.; Ramachandran, P.; Balkey, M. DNA Quantification Using the Qubit Fluorometer. Available online: https://www.protocols.io/view/dna-quantification-using-the-qubit-fluorometer-81wgbp3x3vpk/v15 (accessed on 1 July 2022).
- Magoč, T.; Salzberg, S.L. FLASH: Fast length adjustment of short reads to improve genome assemblies. Bioinformatics 2011, 27, 2957–2963. [Google Scholar] [CrossRef]
- Haas, B.J.; Gevers, D.; Earl, A.M.; Feldgarden, M.; Ward, D.V.; Giannoukos, G.; Ciulla, D.; Tabbaa, D.; Highlander, S.K.; Sodergren, E.; et al. Chimeric 16S rRNA sequence formation and detection in Sanger and 454-pyrosequenced PCR amplicons. Genome Res. 2011, 21, 494–504. [Google Scholar] [CrossRef]
- Li, M.; Shao, D.; Zhou, J.; Gu, J.; Qin, J.; Chen, W.; Wei, W. Signatures within esophageal microbiota with progression of esophageal squamous cell carcinoma. Chin. J. Cancer Res. 2020, 32, 755–767. [Google Scholar] [CrossRef] [PubMed]
- Berney, C.; Ciuprina, A.; Bender, S.; Brodie, J.; Edgcomb, V.; Kim, E.; Rajan, J.; Parfrey, L.W.; Adl, S.; Audic, S.; et al. UniEuk: Time to speak a common language in protistology! J. Eukaryot. Microbiol. 2017, 64, 407–411. [Google Scholar] [CrossRef]
- McCune, B.; Mefford, M.J. PC-ORD Multivariate Analysis of Ecological Data. Version 6; MjM Software: Gleneden Beach, OR, USA, 2011. [Google Scholar]
- Clarke, K.R.; Warwick, R.M. Change in Marine Communities: An Approach to Statistical Analysis and Interpretation; Plymouth Marine Laboratory: Plymouth, UK, 1994. [Google Scholar]
- McCune, B. Community Structure and Analysis Biology 570/670; Department of Botany and Plant Pathology, Oregon State University: Corvallis, OR, USA, 2007. [Google Scholar]
- Guiry, M.D.; Guiry, G.M. AlgaeBase. Available online: https://www.algaebase.org (accessed on 10 September 2022).
- Yoon, T.; Kang, H.; Kang, C.; Lee, S.H.; Ahn, D.; Park, H.; Kim, H. Development of a cost-effective metabarcoding strategy for analysis of the marine phytoplankton community. PeerJ 2016, 4, e2115. [Google Scholar] [CrossRef] [PubMed]
- Bombin, S.; Wysor, B.; Lopez-Bautista, J.M. Assessment of littoral algal diversity from the northern Gulf of Mexico using environmental DNA metabarcoding. J. Phycol. 2021, 57, 269–278. [Google Scholar] [CrossRef] [PubMed]
- Azevedo, J.; Antunes, J.T.; Machado, A.M.; Vasconcelos, V.; Leão, P.N.; Froufe, E. Monitoring of biofouling communities in a Portuguese port using a combined morphological and metabarcoding approach. Sci. Rep. 2020, 10, 13461. [Google Scholar] [CrossRef]
- Kezlya, E.; Tseplik, N.; Kulikovsky, M. Genetic markers for metabarcoding of freshwater microalgae: Review. Biology 2023, 12, 1038. [Google Scholar] [CrossRef]
- van der Reis, A.L.; Sewell, M.A.; Nelson, W.A. Investigating seed bank potential of crustose coralline algae using DNA metabarcoding. J. Phycol. 2023, 00, 1–8. [Google Scholar] [CrossRef]
- Schulte, N.O.; Craine, J.M.; Leopold, D.R.; Devitt, J.K.; Fierer, N. Diversity of freshwater algal assemblages across the United States as revealed by DNA metabarcoding. Environ. DNA 2023, 00, 1–20. [Google Scholar] [CrossRef]
- Lentendu, G.; Wubet, T.; Chatzinotas, A.; Wilhelm, C.; Buscot, F.; Schlegel, M. Effects of long-term differential fertilization on eukaryotic microbial communities in an arable soil: A multiple barcoding approach. Mol. Ecol. 2014, 23, 3341–3355. [Google Scholar] [CrossRef]
- Sherwood, A.R.; Conklin, K.Y.; Lidddy, Z.J. What’s in the air? Preliminary analyses of Hawaiian airborne algae and land plant spores reveal a diverse and abundant flora. Phycologia 2014, 53, 579–582. [Google Scholar] [CrossRef]
- Wei, L.; Zhao, Q.; Chen, X.; Sun, Q.; Zhang, X.; Chen, Y. Seasonal variation in soil algal community structure in different forest plantations in subtropic China. Front. Plant Sci. 2023, 14, 1181184. [Google Scholar] [CrossRef]
- Neustupa, J.; Škaloud, P. Diversity of subaerial algae and cyanobacteria on tree bark in tropical mountain habitats. Biologia 2008, 63, 806–812. [Google Scholar] [CrossRef]
- Neustupa, J.; Škaloud, P. Diversity of subaerial algae and cyanobacteria growing on bark and wood in the lowland tropical forests of Singapore. Plant Ecol. Evol. 2010, 143, 51–62. [Google Scholar] [CrossRef]
- Škaloud, P.; Rindi, F.; Boedeker, C.; Leliaert, F. Chlorophyta: Ulvophyceae. In Süßwasserflora von Mitteleuropa–Freshwater Flora of Central Europe 13; Büdel, B., Gärtner, G., Krienitz, L., Schagerl, M., Eds.; Springer Spektrum: Berlin, Germany, 2018; pp. 1–289. [Google Scholar]
- Klimešová, M.; Rindi, F.; Skaloud, P. DNA cloning demonstrates high genetic heterogeneity in populations of the subaerial green alga Trentepohlia (Trentepohliales, Chlorophyta). J. Phycol. 2019, 55, 224–235. [Google Scholar] [CrossRef]
- Islam, A.K.M.N. Subaerial algae of Bangladesh. Bangladesh J. Bot. 1972, 1, 13–64. [Google Scholar]
- Ho, K.K.; Tan, K.H.; Wee, Y.C. Growth conditions of Trentepohlia odorata (Chlorophyta, Ulotrichales). Phycologia 1983, 22, 303–308. [Google Scholar] [CrossRef]
- Ong, B.M.; Lim, M.; Wee, Y.C. Effects of desiccation and illumination of photosynthesis and pigmentation of an edaphic population of Trentepohlia odorata (Chlorophyta). J. Phycol. 1992, 28, 768–772. [Google Scholar] [CrossRef]
- Sharma, N.K.; Singh, S.; Rai, A.K. Diversity and seasonal variation of viable algal particles in the atmosphere of a subtropical city in India. Environ. Res. 2006, 102, 252–259. [Google Scholar] [CrossRef] [PubMed]
- Sharma, N.K.; Singh, S. Differential aerosolization of algal and cyanobacterial particles in the atmosphere. Indian J. Microbiol. 2011, 50, 468–473. [Google Scholar] [CrossRef]
- Nienow, J.A. Subaerial communities. In Encyclopedia of Environmental Microbiology; Bitton, G., Ed.; Wiley: New York, NY, USA, 2002; pp. 3055–3065. [Google Scholar]
- Gorbushina, A.A. Life on the rocks. Environ. Microbiol. 2007, 9, 1613–1631. [Google Scholar] [CrossRef]
- Sharma, N.K.; Rai, A.K.; Singh, S.; Brown, J.R.M. Airborne algae: Their present status and relevance. J. Phycol. 2007, 43, 615–627. [Google Scholar] [CrossRef]
- Neustupa, J.; Štifterová, A. Distribution patterns of subaerial corticolous microalgae in two European regions. Plant Ecol. Evol. 2013, 146, 279–289. [Google Scholar] [CrossRef]
- Lam, D.W. Biodiversity and Systematics of Subaerial Algae from the Neotropics and Hawaii. Doctoral Degree, University of Alabama, Tuscaloosa, AL, USA, 2010. [Google Scholar]
- Billi, D.; Wilmotte, A.; McKay, C.P. Desert strains of Chroococcidiopsis: A platform to investigate genetic diversity in extreme environments and explore survival potential beyond Earth. In EPSC Abstracts; European Planetary Science Congress: Rome, Italy, 2010. [Google Scholar]
- Bothe, H. The cyanobacterium Chroococcidiopsis and its potential for life on Mars. J. Astrobiol. Space Sci. Rev. 2019, 2, 398–412. [Google Scholar]
- Hershkovitz, N.; Oren, A.; Cohen, Y. Accumulation of trehalose and sucrose in cyanobacteria exposed to matric water stress. Appl. Environ. Microbiol. 1991, 57, 645–648. [Google Scholar] [CrossRef]
- Harel, Y.; Ohad, I.; Kaplan, A. Activation of photosynthesis and resistance to photoinhibition in cyanobacteria within biological desert crust. Plant Physiol. 2004, 136, 3070–3079. [Google Scholar] [CrossRef]
- Quesada, A.; Vincent, W.F. Strategies of adaptation by Antarctic cyanobacteria to ultraviolet radiation. Eur. J. Phycol. 1997, 32, 335–342. [Google Scholar] [CrossRef]
- Rajeev, L.; da Rocha, U.N.; Klitgord, N.; Luning, E.G.; Fortney, J.; Axen, S.D.; Shih, P.M.; Bouskill, N.J.; Bowen, B.P.; Kerfeld, K.C.; et al. Dynamic cyanobacterial response to hydration and dehydration in a desert biological soil crust. ISME J. 2013, 7, 2178–2191. [Google Scholar] [CrossRef]
- Lokhorst, G.M. Comparative taxonomic studies on the genus Klebsormidium (Charophyceae) in Europe. In Cryptogamic Studies; Gustav Fischer Verlag: Stuttgart, Germany, 1996; Volume 5, pp. 1–132. [Google Scholar]
- Gaysina, L.A.; Purina, E.S.; Safiullina, L.M.; Bakieva, G.R. Resistance of Klebsormidium flaccidum (Kützing) Silva, Mattox & Blackwell (Streptophyta) to heavy metals. NBU J. Plant Sci. 2009, 3, 39–42. [Google Scholar]
- Gaysina, L.A.; Bohunická, M.; Hazuková, V.; Johansen, J.R. Biodiversity of terrestrial cyanobacteria of the South Ural Region. Cryptogam. Algol. 2018, 39, 167–198. [Google Scholar] [CrossRef]
- Škaloud, P.; Rindi, F. Ecological differentiation of cryptic species within an asexual protist morphospecies: A case study of filamentous green alga Klebsormidium (Streptophyta). J. Eukaryot. Microbiol. 2013, 60, 350–362. [Google Scholar] [CrossRef]
- Škaloud, P.; Lukešova, A.; Malavasi, V.; Ryšánek, D.; Hrčková, K.; Rindi, F. Molecular evidence for the polyphyletic origin of low pH adaptation in the genus Klebsormidium (Klebsormidiophyceae, Streptophyta). Plant Ecol. Evol. 2014, 147, 333–345. [Google Scholar] [CrossRef]
- Samolov, E.; Mikhailyuk, Y.; Lukešová, A.; Glaser, K.; Büdel, B.; Karsten, U. Usual alga from unusual habitats: Biodiversity of Klebsormidium (Klebsormidiophyceae, Streptophyta) from the phylogenetic superclade G isolated from biological soil crusts. Mol. Phylogenet. Evol. 2019, 133, 236–255. [Google Scholar] [CrossRef]
- Pierangelini, M.; Glaser, K.; Mikhailyuk, T.; Karsten, U.; Holzinger, A. Light and dehydration but not temperature drive photosynthetic adaptations of basal Streptophytes (Hormidiella, Streptosarcina and Streptofilum) living in terrestrial habitats. Environ. Microbiol. 2019, 77, 380–393. [Google Scholar] [CrossRef]
- Karsten, U.; Rindi, F. Ecophysiological performance of an urban strain of the aeroterrestrial green alga Klebsormidium sp. (Klebsormidiales, Klebsormidiophyceae). Eur. J. Phycol. 2010, 45, 426–435. [Google Scholar] [CrossRef]
- Kowalska, M.; Ośródka, L.; Klejnowski, K.; Zejda, J.; Krajny, E.; Wojtylak, M. Air quality index and its significance in environmental health risk communication. Arch. Environ. Prot. 2009, 35, 13–21. [Google Scholar]
- Environment Bureau Bangkok. AQI Information. Available online: https://bangkokairquality.com/bma/aqi?lang=en (accessed on 4 October 2022).
- Hossain, I.; Rahman, S.; Sattar, S.; Haque, M.; Mullick, A.; Siraj, S.; Sultana, N.; Uz-zaman, M.A.; Samima, I.; Haidar, A.; et al. Environmental overview of air quality index (AQI) in Bangladesh: Characteristics and challenges in present era. Int. J. Res. Eng. Technol. 2021, 4, 110–115. [Google Scholar]
- Reddy, K.J.; Haskell, J.B.; Sherman, D.M.; Sherman, L.A. Unicellular, aerobic nitrogen-fixing cyanobacteria of the genus Cyanothece. J. Bacteriol. 1993, 175, 1284–1292. [Google Scholar] [CrossRef] [PubMed]
- Gao, F.; Zhang, C.T. Origins of replication in Cyanothece 51142. Proc. Natl. Acad. Sci. USA 2008, 105, 125. [Google Scholar] [CrossRef]
- Welsh, E.A.; Liberton, M.; Stockel, J.; Loh, T.; Elvitigala, T.; Wang, C.; Wollam, A.; Fulton, R.S.; Clifton, S.W.; Jacobs, J.M.; et al. The genome of Cyanothece 51142, a unicellular diazotrophic cyanobacterium important in the marine nitrogen cycle. Proc. Natl. Acad. Sci. USA 2008, 105, 15094–15099. [Google Scholar] [CrossRef] [PubMed]
- Mareš, J.; Johansen, J.R.; Hauer, T.; Zima, J., Jr.; Ventura, S.; Cuzman, O.; Tiribilli, B.; Kaštovský, J. Taxonomic resolution of the genus Cyanothece (Chroococcales, Cyanobacteria), with a treatment on Gloeothece and three new genera, Crocosphaera, Rippkaea, and Zehria. J. Phycol. 2019, 55, 578–610. [Google Scholar] [CrossRef]
- Komarek, J.; Cepak, V. Cytomorphological characters supporting the taxonomic validity of Cyanothece (Cyanoprokaryota). Plant Syst. Evol. 1998, 210, 25–39. [Google Scholar] [CrossRef]
- Porta, D.; Rippka, R.; Hernandez-Marine, M. Unusual ultrastructural features in three strains of Cyanothece (cyanobacteria). Arch. Microbiol. 2000, 173, 154–163. [Google Scholar] [CrossRef] [PubMed]
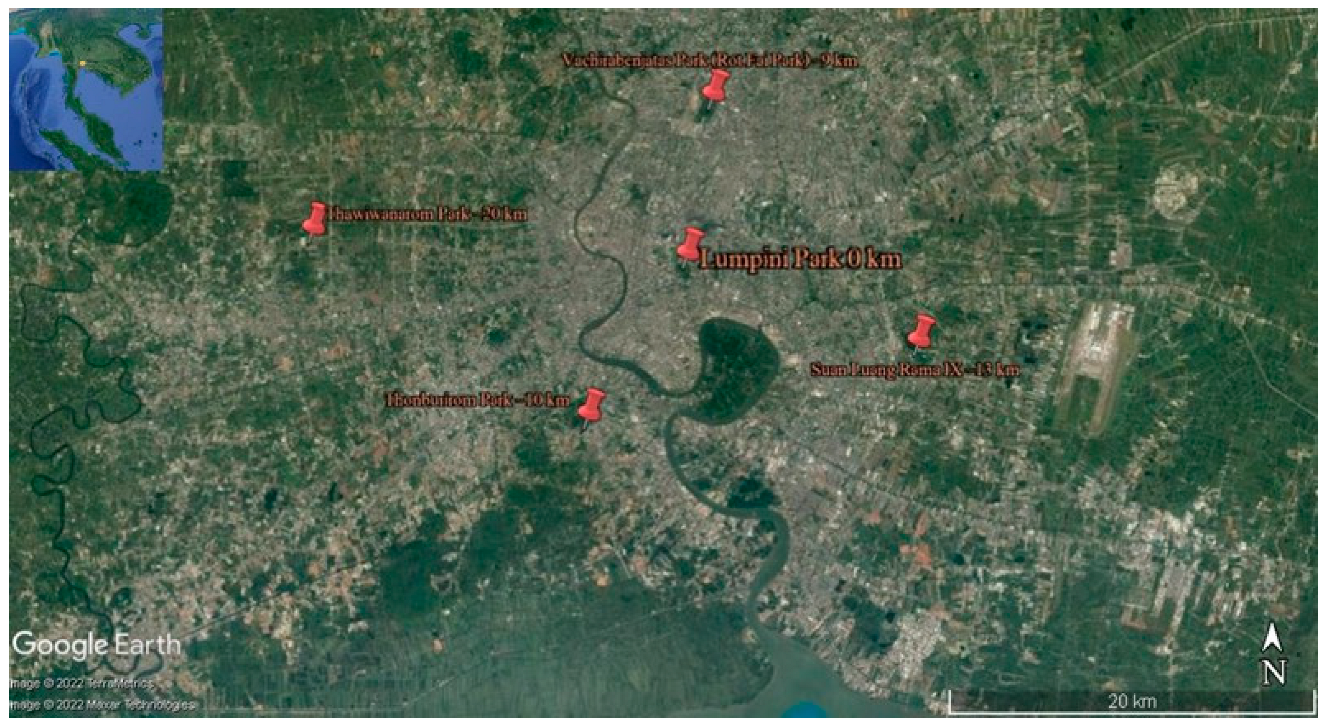


| Sampling Sites | Location | Approximate GPS Coordinates | Altitude (m) | Date of Collection |
|---|---|---|---|---|
| Northern Urban Site (Vachirabenjatas Park) | Bangkok | 13°48.605′ N, 100°33.265′ E | 2–7 | 14 May 2022 |
| Eastern Urban Site (Suan Luang Rama IX) | Bangkok | 13°41.288′ N, 100°39.488′ E | 2–7 | 15 May 2022 |
| Central Urban Site (Lumpini Park) | Bangkok | 13°43.884′ N, 100°32.486′ E | 4–6 | 14 May 2022 |
| Western Urban Site (Thawi Wanarom Park) | Bangkok | 13°44.645′ N, 100°21.139′ E | 3–6 | 13 May 2022 |
| Southern Urban Site (Thonburirom Park) | Bangkok | 13°39.121′ N, 100°29.484′ E | 4–5 | 13 May 2022 |
| Division | Order | Family | (n) Taxa |
|---|---|---|---|
| Cyanophyta | Spirulinales | Lusitaniellaceae | (1) Lusitaniella coriacea |
| Synechococcales | Leptolyngbyaceae | (5) Leptolyngbya sp. 1, Leptolyngbya sp. 2, Oculatella neakameniensis, Leptolyngbya sp. 3, Nodosilinea sp. | |
| Pseudanabaenaceae | (1) Jaaginema littorale | ||
| Synechococcaceae | (4) Synechococcus lividus, Synechococcus sp. Cyanobium gracile, Thermosynechococcus sp. | ||
| Pleurocapsales | Dermocarpellaceae | (2) Stanieria sp.*, Stanieria cyanosphaera | |
| Hyellaceae | (3) Pleurocapsa minor *, Hyella patelloides, Pleurocapsa sp. | ||
| Oscillatoriales | Coleofasciculaceae | (1) Coleofasciculus chthonoplastes | |
| Cyanothecaceae | (6) Cyanothece sp. 1 *, Cyanothece sp. 2, Cyanothece sp. 3, Cyanothece sp. 4, Cyanothece sp. 5, Cyanothece sp. 6 | ||
| Gomontiellaceae | (1) Crinalium epipsammum | ||
| Microcoleaceae | (2) Microcoleus sp. 1 *, Microcoleus sp. 3 | ||
| Oscillatoriaceae | (5) Oscillatoria nigro-viridis, Lyngbya aestuarii, Phormidium tinctorium, Oscillatoria acuminata, Oscillatoria sp. * | ||
| Nostocales | Aphanizomenonaceae | (2) Dolichospermum compactum, Sphaerospermopsis kisseleviana | |
| Hapalosiphonaceae | (1) Fischerella muscicola | ||
| Nostocaceae | (12) Cylindrospermum stagnale, Nostoc punctiforme, Nostoc linckia, Cylindrospermum sp., Nostoc sp. 1, Nostoc piscinale, Anabaena sp. 1, Nostoc sp. 2, Camptylonemopsis sp., Nostoc carneum, Trichormus azollae, Cylindrospermum muscicola | ||
| Rivulariaceae | (8) Calothrix sp. 1, Calothrix sp. 2 *, Microchaete diplosiphon, Calothrix sp. 3, Calothrix brevissima, Calothrix sp. 4, Calothrix sp. 5, Calothrix sp. 6 | ||
| Scytonemataceae | (6) Scytonema mirabile *, Scytonema sp. 1, Scytonema hofmannii, Scytonema crispum, Brasilonema sp., Scytonema sp. 2 | ||
| Tolypothrichaceae | (2) Tolypothrix sp. 1 *, Tolypothrix sp. 2 * | ||
| Gloeobacterales | Gloeobacteraceae | (1) Gloeobacter kilaueensis | |
| Chroococcidiopsidales | Chroococcidiopsidaceae | (3) Chroococcidiopsis sp. 1 *, Chroococcidiopsis thermalis*, Chroococcidiopsis sp. 2 | |
| Chroococcales | Chroococcaceae | (4) Gloeocapsa sp. *, Gloeocapsopsis sp. *, Chondrocystis sp., Gloeocapsopsis crepidinum | |
| Bacillariophyta | Bacillariales | Bacillariaceae | (2) Nitzschia sp., Cylindrotheca closterium |
| Diadesmidaceae | (1) Diadesmis sp. * | ||
| Chlorophyta | Chaetophorales | Chaetophoraceae | (1) Dilabifilum sp. |
| Chlamydomonadales | Chlamydomonadaceae | (2) Chloromonas perforata, Chlamydomonas zebra | |
| Sphaeropleales | Scenedesmaceae | (2) Scenedesmus sp. *, Acutodesmus sp. | |
| Trebouxiales | Trebouxiaceae | (8) Trebouxia corticola *, Friedmannia sp., Heterochlorella, Xylochloris irregularis, Symbiochloris irregularis, Symbiochloris reticulata, Trebouxia australis, Trebouxia decolorans | |
| Chlorellales | Chlorellaceae | (3) Nannochloris normandinae *, Lobosphaera incisa, Parachlorella kessleri | |
| Prasiolales | Prasiolaceae | (1) Edaphochlorella mirabilis | |
| Stichococcaceae | (1) Stichococcus sp. | ||
| Watanabeales | Watanabeaceae | (1) Watanabea reniformis * | |
| Ignatiales | Ignatiaceae | (1) Ignatius tetrasporus * | |
| Pyramimonadales | Pyramimonadaceae | (1) Pyramimonas disomata | |
| Eustigmatophyta | Eustigmatales | Monodopsidaceae | (2) Monodopsis sp. 2, Nannochloropsis oculata |
| Charophyta | Chlorokybales | Chlorokybaceae | (1) Chlorokybus atmophyticus |
| Klebsormidiales | Klebsormidiaceae | (4) Klebsormidium flaccidum, Klebsormidium sp. 1, Klebsormidium sp. 2 *, Klebsormidium sp. 3 |
| Diversity Index (H’) | Richness Index | Equitability Index (J’) | |
|---|---|---|---|
| Northern Site | 1.37 | 4.43 | 0.30 |
| Eastern Site | 1.71 | 4.65 | 0.37 |
| Central Site | 1.58 | 3.84 | 0.34 |
| Western Site | 1.95 | 6.19 | 0.42 |
| Southern Site | 2.51 | 4.75 | 0.54 |
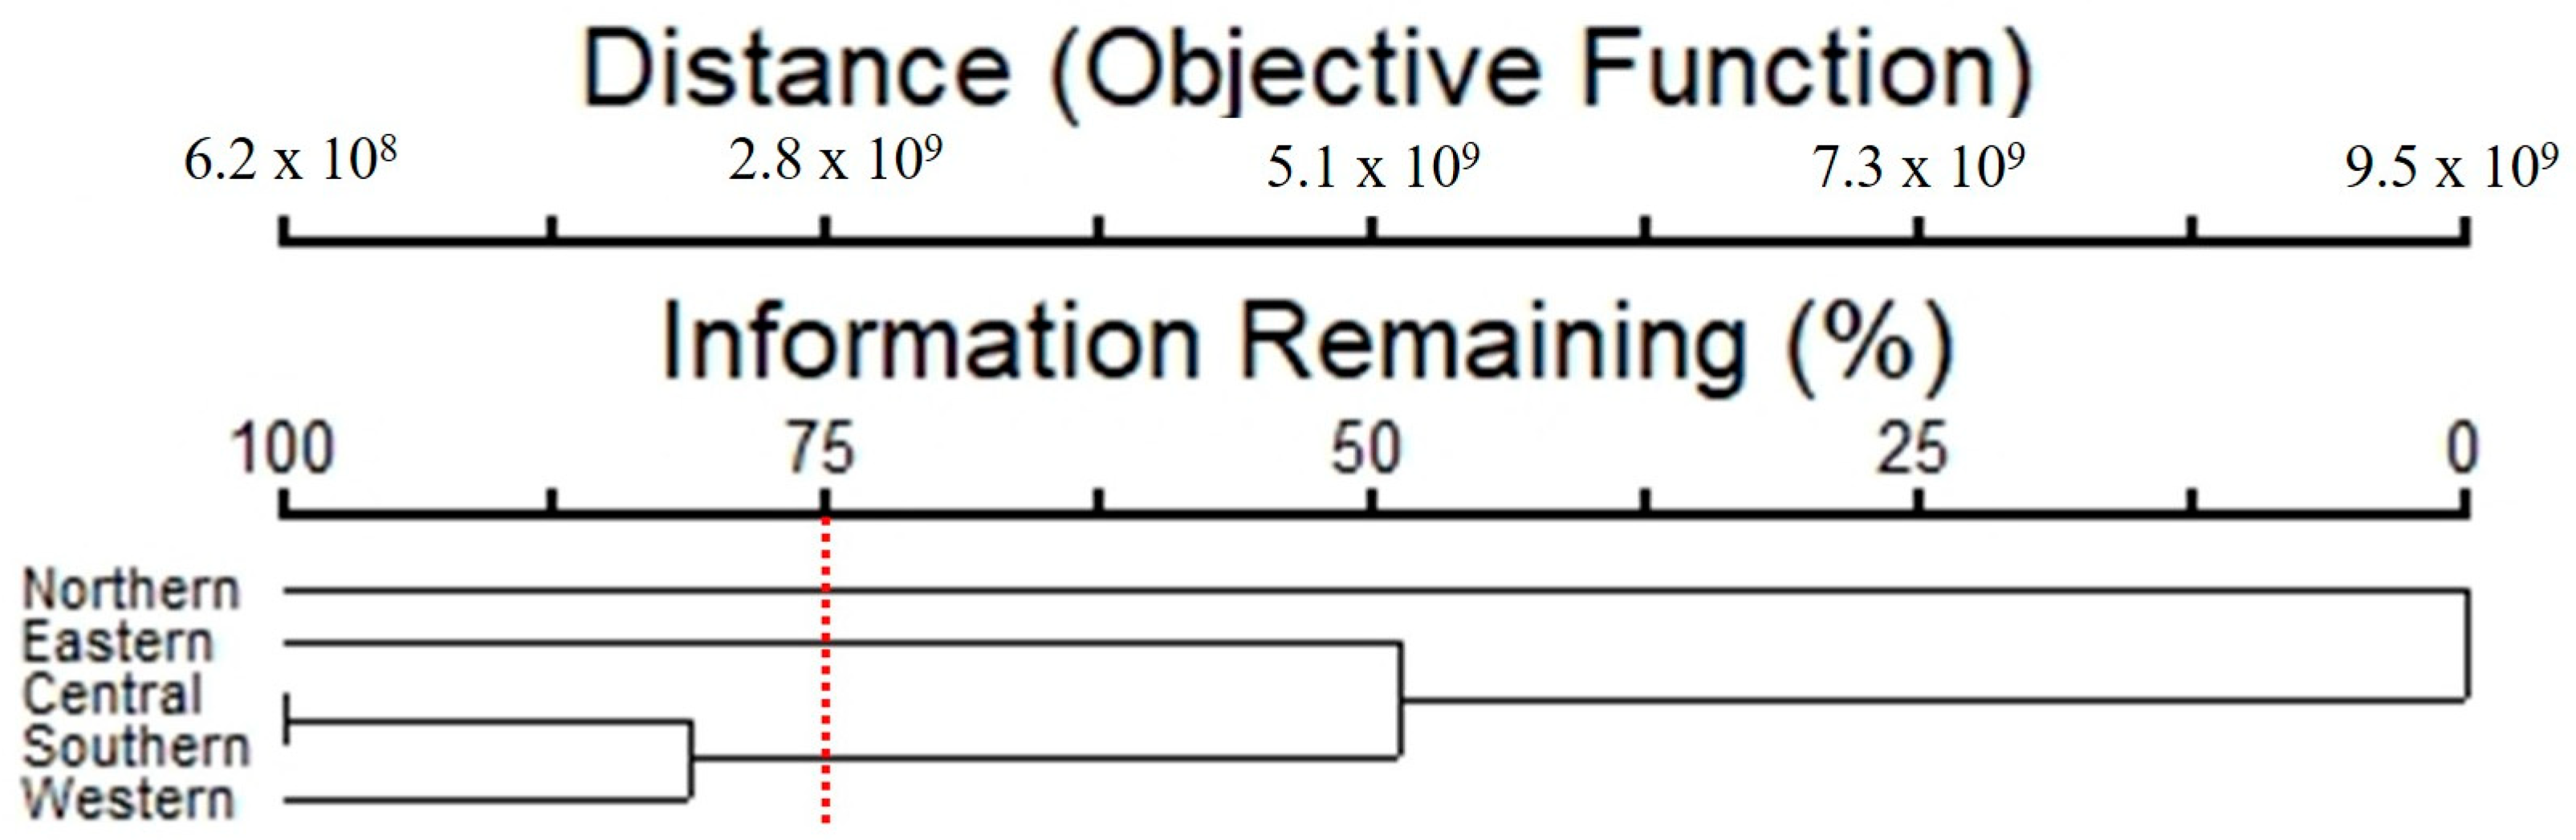
| Northern Site | Eastern Site | Central Site | Western Site | Southern Site | |
|---|---|---|---|---|---|
| Northern Site | – | 8.00 | 22.99 | 15.19 | 27.22 |
| Eastern Site | – | – | 31.92 | 24.29 | 41.04 |
| Central Site | – | – | – | 41.00 | 64.82 |
| Western Site | – | – | – | – | 54.26 |
| Southern Site | – | – | – | – | – |
Disclaimer/Publisher’s Note: The statements, opinions and data contained in all publications are solely those of the individual author(s) and contributor(s) and not of MDPI and/or the editor(s). MDPI and/or the editor(s) disclaim responsibility for any injury to people or property resulting from any ideas, methods, instructions or products referred to in the content. |
© 2024 by the authors. Licensee MDPI, Basel, Switzerland. This article is an open access article distributed under the terms and conditions of the Creative Commons Attribution (CC BY) license (https://creativecommons.org/licenses/by/4.0/).
Share and Cite
Saraphol, S.; Rindi, F.; Sanevas, N. Diversity of Epiphytic Subaerial Algal Communities in Bangkok, Thailand, and Their Potential Bioindicator with Air Pollution. Diversity 2024, 16, 55. https://doi.org/10.3390/d16010055
Saraphol S, Rindi F, Sanevas N. Diversity of Epiphytic Subaerial Algal Communities in Bangkok, Thailand, and Their Potential Bioindicator with Air Pollution. Diversity. 2024; 16(1):55. https://doi.org/10.3390/d16010055
Chicago/Turabian StyleSaraphol, Santi, Fabio Rindi, and Nuttha Sanevas. 2024. "Diversity of Epiphytic Subaerial Algal Communities in Bangkok, Thailand, and Their Potential Bioindicator with Air Pollution" Diversity 16, no. 1: 55. https://doi.org/10.3390/d16010055
APA StyleSaraphol, S., Rindi, F., & Sanevas, N. (2024). Diversity of Epiphytic Subaerial Algal Communities in Bangkok, Thailand, and Their Potential Bioindicator with Air Pollution. Diversity, 16(1), 55. https://doi.org/10.3390/d16010055