
Thermal Threats to Freshwater Mussels: An Empirical Stream Assessment


Abstract
1. Introduction
2. Methods
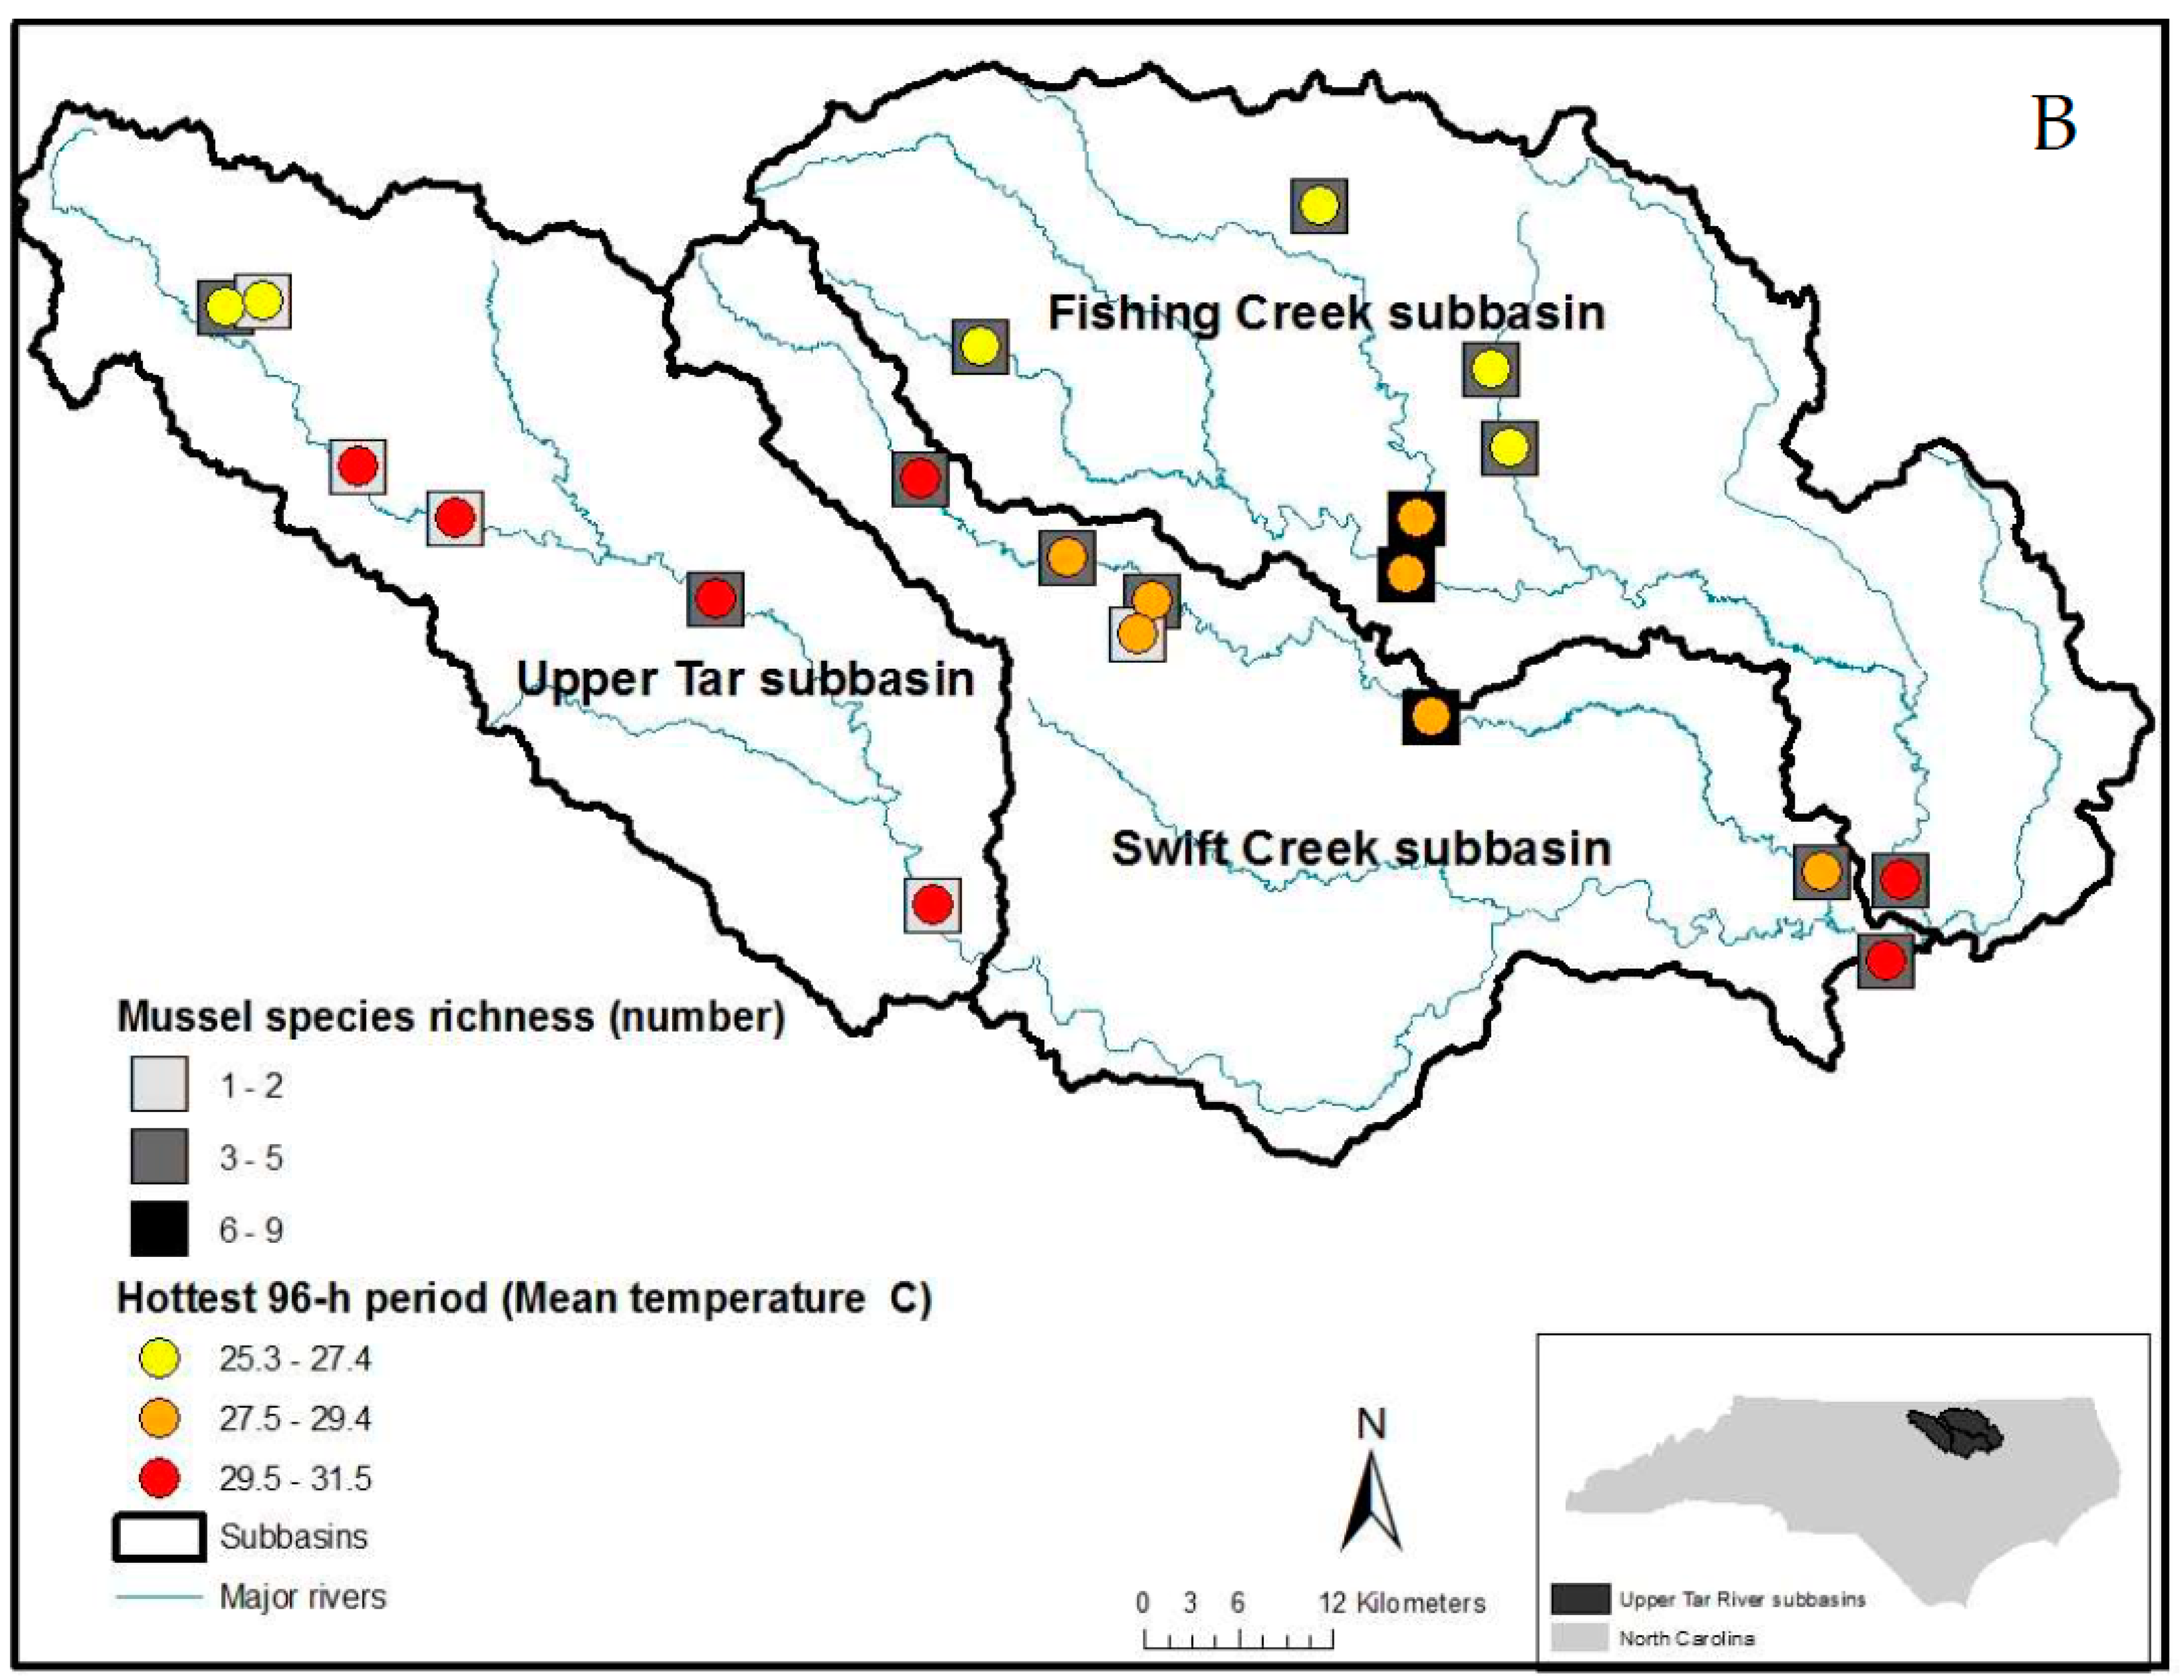
2.1. Site Selection
2.2. Freshwater Mussel and Fish Surveys
2.3. Temperature Logger Unit Design and Deployment
2.4. Data Analysis
3. Results
4. Discussion
Author Contributions
Funding
Institutional Review Board Statement
Data Availability Statement
Acknowledgments
Conflicts of Interest
References
- Lake, P.S.; Palmer, M.A.; Biro, P.; Cole, J.; Covich, A.P.; Dahm, C.; Gibert, J.; Goedkoop, W.; Martens, K.; Verhoeven, J. Global change and the biodiversity of freshwater ecosystems: Impacts on linkages between above-sediment and sediment biota. BioScience 2000, 50, 1099–1107. [Google Scholar] [CrossRef]
- Parmesan, C.; Yohe, G. A globally coherent fingerprint of climate change impacts across natural systems. Nature 2003, 421, 37–42. [Google Scholar] [CrossRef] [PubMed]
- IPCC (Intergovernmental Panel on Climate Change). Climate Change 2014: Synthesis Report. Contribution of Working Groups I, II and III to the Fifth Assessment Report of the Intergovernmental Panel on Climate Change; Core Writing Team, Pachauri, R.K., Meyer, L.A., Eds.; IPCC: Geneva, Switzerland, 2014; 151p. [Google Scholar]
- Allan, J.D. Landscapes and riverscapes: The influence of land use on stream ecosystems. Annu. Rev. Ecol. Evol. Syst. 2004, 35, 257–284. [Google Scholar] [CrossRef]
- Mulholland, P.J.; Best, G.R.; Coutant, C.C.; Hornberger, G.M.; Meyer, J.L.; Robinson, P.J.; Stenberg, J.R.; Turner, R.E.; Vera-Herrera, F.; Wetzel, R.G. Effects of climate change on freshwater ecosystems of the south-eastern United States and the Gulf Coast of Mexico. Hydrol. Process. 1997, 11, 949–970. [Google Scholar] [CrossRef]
- Ficke, A.D.; Myrick, C.A.; Hansen, L.J. Potential impacts of global climate change on freshwater fisheries. Rev. Fish Biol. Fish. 2007, 17, 581–613. [Google Scholar] [CrossRef]
- Kaushal, S.S.; Likens, G.E.; Jaworski, N.A.; Pace, M.L.; Sides, A.M.; Seekell, D.; Belt, K.T.; Secor, D.H.; Wingate, R.L. Rising stream and river temperatures in the United States. Front. Ecol. Environ. 2010, 8, 461–466. [Google Scholar] [CrossRef]
- Visser, M.E.; Both, C. Shifts in phenology due to global climate change: The need for a yardstick. Proc. R. Soc. B 2005, 272, 2561–2569. [Google Scholar] [CrossRef]
- Spooner, D.E.; Vaughn, C.C. A trait-based approach to species’ roles in stream ecosystems: Climate change, community structure, and material cycling. Oecologia 2008, 158, 307–317. [Google Scholar] [CrossRef]
- Walther, G. Community and ecosystem responses to recent climate change. Philos. Trans. R. Soc. B 2010, 365, 2019–2024. [Google Scholar] [CrossRef]
- Spooner, D.E.; Vaughn, C.C. Species richness and temperature influence mussel biomass: A partitioning approach applied to natural communities. Ecology 2009, 90, 781–790. [Google Scholar] [CrossRef]
- van Ee, B.C.; Johnson, P.D.; Atkinson, C.L. Thermal sensitivity modulates temporal patterns of ecosystem functioning by freshwater mussels. Freshw. Biol. 2022, 67, 2064–2077. [Google Scholar] [CrossRef]
- Gutiérrez, J.L.; Jones, C.G.; Strayer, D.L.; Iribarne, O.O. Mollusks as ecosystem engineers: The role of shell production in aquatic habitats. Oikos 2003, 101, 79–90. [Google Scholar] [CrossRef]
- Howard, J.K.; Cuffey, K.M. The functional role of native freshwater mussels in the fluvial benthic environment. Freshw. Biol. 2006, 51, 460–474. [Google Scholar] [CrossRef]
- Vaughn, C.C.; Spooner, D.E. Unionid mussels influence macroinvertebrate assemblage structure in streams. J. N. Am. Benthol. Soc. 2006, 25, 691–700. [Google Scholar] [CrossRef]
- Vaughn, C.C.; Nichols, S.J.; Spooner, D.E. Community and food web ecology of freshwater mussels. J. N. Am. Benthol. Soc. 2008, 27, 409–423. [Google Scholar] [CrossRef]
- Strayer, D.L. What are freshwater mussels worth? Freshw. Mollusk Biol. Conserv. 2017, 20, 103–113. [Google Scholar] [CrossRef]
- Haag, W.R.; Williams, J.D. Biodiversity on the brink: An assessment of conservation strategies for North American freshwater mussels. Hydrobiologia 2014, 735, 45–60. [Google Scholar] [CrossRef]
- Watters, G.T. A brief look at freshwater mussel (Unionacea) biology. In Freshwater Bivalve Ecotoxicology; Farris, J.L., Van Hassel, J.H., Eds.; CRC: Boca Raton, FL, USA; SETAC Press: Pensacola, FL, USA, 2007; pp. 51–64. [Google Scholar]
- Pandolfo, T.J.; Kwak, T.J.; Cope, W.G. Thermal tolerances of freshwater mussels and their host fishes: Species interactions in a changing climate. Walkerana J. Freshw. Mollusk Biol. Conserv. 2012, 15, 69–82. [Google Scholar] [CrossRef]
- Hastie, L.C.; Cosgrove, P.J.; Ellis, N.; Gaywood, M.J. The threat of climate change to freshwater pearl mussel populations. Ambio 2003, 32, 40–46. [Google Scholar] [CrossRef]
- Cahill, A.E.; Aiello-Lammens, M.E.; Fisher-Reid, M.C.; Hua, X.; Karanewsky, C.J.; Ryu, H.Y.; Sbeglia, G.C.; Spagnola, F.; Waldron, J.B.; Warsi, O.; et al. How does climate change cause extinction? Proc. R. Soc. B 2013, 280, 20121890. [Google Scholar] [CrossRef]
- Strayer, D.L.; Downing, J.A.; Haag, W.R.; King, T.L.; Layzer, J.B.; Newton, T.J.; Nichols, S.J. Changing perspectives on pearly mussels, North America’s most imperiled animals. BioScience 2004, 54, 429–439. [Google Scholar] [CrossRef]
- Cope, W.G.; Bringolf, R.B.; Buchwalter, D.B.; Newton, T.J.; Ingersoll, C.G.; Wang, N.; Augspurger, T.; Dwyer, F.J.; Barnhart, M.C.; Neves, R.J.; et al. Differential exposure, duration, and sensitivity of unionoidean bivalve life stages to environmental contaminants. J. N. Am. Benthol. Soc. 2008, 27, 451–462. [Google Scholar] [CrossRef]
- Pandolfo, T.J.; Cope, W.G.; Arellano, C.; Bringolf, R.B.; Barnhart, M.C.; Hammer, E. Upper thermal tolerances of early life stages of freshwater mussels. J. N. Am. Benthol. Soc. 2010, 29, 959–969. [Google Scholar] [CrossRef]
- Spooner, D.E.; Xenopoulos, M.A.; Schneider, C.; Woolnough, D.A. Coextirpation of host-affiliate relationships in rivers: The role of climate change, water withdrawal, and host-specificity. Glob. Chang. Biol. 2011, 17, 1720–1732. [Google Scholar] [CrossRef]
- Galbraith, H.S.; Spooner, D.E.; Vaughn, C.C. Synergistic effects of regional climate patterns and local water management on freshwater mussel communities. Biol. Conserv. 2010, 143, 1175–1183. [Google Scholar] [CrossRef]
- Archambault, J.M.; Cope, W.G.; Kwak, T.J. Burrowing, byssus, and biomarkers: Behavioral and physiological indicators of sublethal thermal stress in freshwater mussels (Unionidae). Mar. Freshw. Behav. Physiol. 2013, 46, 229–250. [Google Scholar] [CrossRef]
- Ganser, A.M.; Newton, T.J.; Haro, R.J. The effects of elevated water temperature on native juvenile mussels: Implications for climate change. Freshw. Sci. 2013, 32, 1168–1177. [Google Scholar] [CrossRef]
- Archambault, J.M.; Cope, W.G.; Kwak, T.J. Influence of sediment presence on freshwater mussel thermal tolerance. Freshw. Sci. 2014, 33, 56–65. [Google Scholar] [CrossRef]
- Khan, J.M.; Hart, M.; Dudding, J.; Robertson, C.R.; Lopez, R.; Randklev, C.R. Evaluating the upper thermal limits of glochidia for selected freshwater mussel species (Bivalvia: Unionidae) in central and east Texas, and the implications for their conservation. Aquat. Conserv. Mar. Freshw. Ecosyst. 2019, 29, 1202–1215. [Google Scholar] [CrossRef]
- Goldsmith, A.; Khan, J.M.; Robertson, C.R.; Lopez, R.; Randklev, C.R. Using upper thermal limits of Lampsilis bracteata (Texas fatmucket) from the North Llano and San Saba rivers, Texas to inform water management practices in the Edwards Plateau. Aquat. Conserv. Mar. Freshw. Ecosyst. 2022, 32, 85–97. [Google Scholar] [CrossRef]
- Fogelman, K.J.; Archambault, J.M.; Irwin, E.; Walsh, M.; Brewer, S.; Stoeckel, J.A. A review of lethal thermal tolerance among freshwater mussels (Bivalvia:Unionida) within the North American faunal region. Environ. Rev. 2023, 31, 278–297. [Google Scholar] [CrossRef]
- Haag, W.R.; Warren, M.L., Jr. Effects of severe drought on freshwater mussel assemblages. Trans. Am. Fish. Soc. 2008, 137, 1165–1178. [Google Scholar] [CrossRef]
- Galbraith, H.S.; Blakeslee, C.J.; Lellis, W.A. Recent thermal history influences thermal tolerance in freshwater mussel species (Bivalvia:Unionoida). Freshw. Sci. 2012, 31, 83–92. [Google Scholar] [CrossRef]
- Newton, T.; Sauer, J.; Karns, B. Water and sediment temperatures at mussel beds in the upper Mississippi River basin. Walkerana J. Freshw. Mollusk Biol. Conserv. 2013, 16, 53–62. [Google Scholar] [CrossRef]
- Rangaswami, X.L.; Goldsmith, A.M.; Khan, J.M.; Robertson, C.R.; Lopez, R.R.; Randklev, C.R. Thermal tolerances of Popenaias popeii (Texas hornshell) and its host fish from the Rio Grande Basin, Texas. Sci. Rep. 2023, 13, 4603. [Google Scholar] [CrossRef] [PubMed]
- Pandolfo, T.J.; Kwak, T.J.; Cope, W.G.; Heise, R.J.; Nichols, R.B.; Pacifici, K. Species traits and catchment-scale habitat factors influence the occurrence of freshwater mussel populations and assemblages. Freshw. Biol. 2016, 61, 1671–1684. [Google Scholar] [CrossRef]
- NCDENR (North Carolina Department of Environment and Natural Resources). Standard Operating Procedure: Biological Monitoring; Stream Fish Community Assessment Program, NCDENR, Division of Water Quality: Raleigh, NC, USA, 2006. [Google Scholar]
- Kwak, T.J.; Freeman, M.C. Assessment and management of ecological integrity. In Inland Fisheries Management in North America, 3rd ed.; Hubert, W.A., Quist, M.C., Eds.; American Fisheries Society: Bethesda, MD, USA, 2010; pp. 353–394. [Google Scholar]
- Jobling, M. Temperature tolerance and the final preferendum—Rapid methods for the assessment of optimum growth temperatures. J. Fish Biol. 1981, 19, 439–455. [Google Scholar] [CrossRef]
- Bogan, A.E. Workbook and Key to the Freshwater Bivalves of North Carolina; North Carolina Museum of Natural Sciences: Raleigh, NC, USA, 2002. [Google Scholar]
- Dimock, R.V.; Wright, A.H. Sensitivity of juvenile freshwater mussels to hypoxic, thermal, and acid stress. J. Elisha Mitchell Sci. Soc. 1993, 109, 183–192. [Google Scholar]
- ASTM (American Society of Testing and Materials). Standard Guide for Conducting Laboratory Toxicity Tests with Freshwater Mussels; E2455-06; ASTM International: West Conshohocken, PA, USA, 2006. [Google Scholar]
- Pandolfo, T.J.; Cope, W.G.; Arellano, C. Heart rate as a sublethal indicator of thermal stress in juvenile freshwater mussels. Comp. Biochem. Physiol. Part A 2009, 154, 347–352. [Google Scholar] [CrossRef]
- Landis, A.M.G.; Mosley, T.L.; Haag, W.R.; Stoeckel, J.A. Effects of temperature and photoperiod on lure display and glochidial release in a freshwater mussel. Freshw. Sci. 2012, 31, 775–786. [Google Scholar] [CrossRef]
- Block, J.E.; Gerald, G.W.; Levine, T.D. Temperature effects on burrowing behaviors and performance in a freshwater mussel. J. Freshw. Ecol. 2013, 28, 375–384. [Google Scholar] [CrossRef]
- Schwalb, A.N.; Pusch, M.T. Horizontal and vertical movements of unionid mussels in a lowland river. J. N. Am. Benthol. Soc. 2007, 26, 261–272. [Google Scholar] [CrossRef]
- Amyot, J.; Downing, J.A. Seasonal variation in vertical and horizontal movement of the freshwater bivalve Elliptio complanata (Mollusca:Unionidae). Freshw. Biol. 1997, 37, 345–354. [Google Scholar] [CrossRef]
- Watters, G.T.; O’Dee, S.H.; Chordas, S., III. Patterns of vertical migration in freshwater mussels (Bivalvia:Unionoida). J. Freshw. Ecol. 2001, 16, 541–549. [Google Scholar] [CrossRef]
- Eads, C.B.; Levine, J.F. Vertical migration and reproductive patterns of a long-term brooding freshwater mussel, Villosa constricta (Bivalvia: Unionidae) in a small piedmont stream. Walkerana J. Freshw. Mollusk Biol. Conserv. 2013, 16, 29–41. [Google Scholar] [CrossRef]
- Warren, R.J., II; Bradford, M.A. Mutualism fails when climate response differs between interacting species. Glob. Chang. Biol. 2014, 20, 466–474. [Google Scholar] [CrossRef]
- Wismer, D.A.; Christie, A.E. Temperature Relationships of Great Lakes Fishes: A Data Compilation; Special Publication 87-3; Great Lakes Fishery Commission: Ann Arbor, MI, USA, 1987. [Google Scholar]
- Eaton, J.G.; Scheller, R.M. Effects of climate warming on fish thermal habitat in streams of the United States. Limnol. Oceanogr. 1996, 41, 1109–1115. [Google Scholar] [CrossRef]
- Mohseni, O.; Stefan, H.G.; Eaton, J.G. Global warming and potential changes in fish habitat in U.S. streams. Clim. Chang. 2003, 59, 389–409. [Google Scholar] [CrossRef]
- Daraio, J.A.; Bales, J.D.; Pandolfo, T.J. Forecasting the effects of land-use and climate change on stream temperature II: Hourly simulations and exceedance duration. J. Am. Water Resour. Assoc. 2014, 50, 1177–1190. [Google Scholar] [CrossRef]
- Roberts, A.D.; Barnhart, M.C. Effects of temperature, pH, and CO2 on transformation of the glochidia of Anodonta suborbiculata on fish hosts and in vitro. J. N. Am. Benthol. Soc. 1999, 18, 477–487. [Google Scholar] [CrossRef]
- Taeubert, J.; El-Nobi, G.; Geist, J. Effects of water temperature on the larval parasitic stage of the thick-shelled river mussel (Unio crassus). Aquat. Conserv. Mar. Freshw. Ecosyst. 2014, 24, 231–237. [Google Scholar] [CrossRef]
- Philippart, C.J.M.; van Aken, H.M.; Beukema, J.J.; Bos, O.G.; Cadée, G.C.; Dekker, R. Climate-related changes in recruitment of the bivalve Macoma balthica. Limnol. Oceanogr. 2003, 48, 2171–2185. [Google Scholar] [CrossRef]


| Site | ||||||||||||||||||||
|---|---|---|---|---|---|---|---|---|---|---|---|---|---|---|---|---|---|---|---|---|
| Species | SheC | NFTR | TR1 | TR2 | TR3 | TR4 | SaC1 | SaC2 | SaC3 | RBC | SwC1 | SwC2 | ShoC | LFC1 | RS1 | RS2 | LFC2 | LFC3 | FC | TR5 |
| Acantharchus pomotis | – | – | – | 1 | – | – | – | 1 | – | – | – | – | 3 | – | 1 | – | – | – | – | – |
| Ambloplites cavifrons * | – | – | 1 | 30 | – | 1 | 1 | – | – | – | 1 | – | – | – | – | – | 1 | 2 | – | – |
| Ameiurus natalis | – | – | – | – | – | – | 3 | – | – | 2 | – | 1 | – | – | 1 | – | – | – | – | – |
| Anguilla rostrata * | – | – | – | – | – | – | 6 | 14 | 17 | 5 | 53 | 47 | 11 | – | 1 | 11 | 12 | 67 | 82 | 191 |
| Aphredoderus sayanus * | 11 | 6 | 1 | – | 1 | 6 | 6 | 2 | – | – | 5 | 12 | 16 | 169 | 2 | 2 | 3 | 14 | 15 | 1 |
| Centrarchus macropterus | – | – | – | – | – | – | – | 2 | 1 | 2 | – | – | 6 | 1 | – | – | – | – | – | – |
| Clinostomus funduloides * | – | – | – | – | – | – | – | – | – | – | – | – | – | 4 | – | – | – | – | – | – |
| Cyprinella analostana * | – | – | 2 | 48 | 171 | 35 | 10 | 7 | 5 | – | 28 | 120 | – | 1 | – | – | – | 5 | 58 | 594 |
| Enneacanthus gloriosus | – | – | – | – | – | – | 9 | 4 | 3 | – | – | 4 | 35 | 9 | 23 | 34 | – | 1 | 2 | – |
| Erimyzon oblongus | 19 | 5 | – | 6 | 3 | – | 7 | 3 | – | 1 | – | – | 3 | – | 4 | – | – | 1 | – | – |
| Esox americanus * | – | – | – | – | – | – | 1 | 2 | 1 | 3 | – | – | 3 | – | 3 | – | – | – | – | – |
| Esox niger | – | 9 | – | – | – | – | – | – | – | – | – | 1 | – | – | – | – | – | – | – | – |
| Etheostoma nigrum/olmstedi * | 22 | 26 | 14 | 17 | 63 | 35 | 14 | 28 | 32 | 3 | 65 | 26 | 24 | 25 | 4 | – | 59 | 25 | 73 | 32 |
| Etheostoma vitreum * | – | – | 3 | 3 | 54 | – | – | 1 | 5 | – | 3 | – | – | – | – | – | – | 2 | 1 | 6 |
| Gambusia holbrooki * | 13 | 5 | – | 7 | 37 | 37 | 3 | 10 | 6 | 2 | 19 | 159 | 49 | 13 | 7 | 62 | 39 | 94 | 248 | 25 |
| Hybognathus regius | – | – | – | – | – | – | – | – | – | – | 1 | 6 | – | – | – | – | – | – | – | 17 |
| Hypentelium nigricans | – | – | – | 10 | – | – | 1 | 1 | – | – | – | – | – | – | – | – | – | – | – | – |
| Ictalurus punctatus * | – | – | – | – | 1 | 1 | – | – | – | – | – | – | – | – | – | – | – | – | – | 6 |
| Lampetra aepyptera | – | – | – | – | – | – | – | 1 | – | – | – | – | – | – | – | – | – | – | – | – |
| Lepisosteus osseus * | – | – | – | – | – | – | – | – | – | – | – | 5 | – | – | – | – | – | – | 1 | – |
| Lepomis auratus * | 12 | 2 | 22 | 43 | 50 | 30 | 42 | 28 | 24 | 14 | 54 | 141 | 17 | 5 | 31 | 6 | 19 | 33 | 255 | 34 |
| Lepomis cyanellus * | 12 | 12 | 14 | 51 | – | – | – | – | – | – | – | – | – | – | – | – | – | 8 | – | – |
| Lepomis gibbosus * | – | – | – | – | – | – | – | – | 1 | – | 1 | – | – | 1 | – | – | – | – | – | – |
| Lepomis gulosus * | – | 6 | 2 | – | – | – | – | 1 | 1 | 2 | 3 | – | 1 | – | 12 | 13 | – | – | – | – |
| Lepomis macrochirus * | 20 | 8 | 8 | 4 | 4 | 10 | 1 | 4 | – | 8 | 23 | 26 | – | – | 11 | 6 | – | – | 3 | 7 |
| Lepomis microlophus * | 3 | 2 | – | – | – | – | 2 | – | – | – | 1 | 3 | 6 | – | 8 | 2 | – | – | 1 | – |
| Luxilus albeolus * | 22 | – | – | 151 | 47 | – | 10 | 24 | 2 | 5 | 16 | 1 | – | 30 | – | – | 7 | 29 | – | – |
| Lythrurus matutinus * | 4 | 1 | – | 36 | 12 | – | 1 | 45 | 13 | – | 5 | – | – | 1 | – | – | 2 | 6 | 4 | – |
| Micropterus salmoides* | – | 2 | 1 | 18 | 6 | 1 | – | – | – | 2 | 1 | 3 | – | – | 1 | 1 | – | – | 1 | 1 |
| Moxostoma collapsum * | – | – | 1 | – | 12 | – | – | 5 | 1 | – | 6 | – | – | – | – | – | 1 | 1 | 1 | – |
| Moxostoma macrolepidotum * | – | – | – | – | 1 | – | – | – | – | – | 4 | – | – | – | – | – | – | – | 1 | – |
| Moxostoma pappillosum | – | – | – | 2 | 4 | – | – | – | – | – | – | – | – | – | – | – | – | – | – | – |
| Nocomis leptocephalus * | 69 | – | – | 52 | 5 | – | 1 | 4 | – | – | 5 | 4 | 1 | 36 | – | – | – | 2 | – | – |
| Nocomis raneyi * | – | – | – | 85 | 15 | – | – | – | 1 | – | 10 | – | – | – | – | – | – | – | – | – |
| Notemigonus crysoleucas * | – | – | – | – | – | – | 1 | – | – | 1 | – | – | – | – | 4 | – | – | – | – | – |
| Notropis altipinnis * | – | – | – | – | – | – | – | – | – | – | – | – | 16 | 3 | – | 6 | – | – | – | – |
| Notropis amoenus | – | – | – | 5 | 20 | 18 | – | 1 | – | – | 4 | 10 | – | – | – | – | – | – | – | 1 |
| Notropis hudsonius * | – | – | – | – | – | – | – | – | – | – | – | – | – | – | – | – | – | – | – | 4 |
| Notropis procne * | 16 | 4 | 4 | 45 | 176 | 20 | 8 | 4 | 6 | – | 122 | 95 | – | – | – | – | 5 | 13 | 72 | 1078 |
| Notropis volucellus * | – | – | – | 128 | – | – | – | – | – | – | 40 | – | – | – | – | – | – | – | – | – |
| Noturus furiosus | – | – | – | – | 8 | – | – | – | – | – | 4 | – | – | – | – | – | – | – | – | – |
| Noturus insignis * | 5 | 2 | 2 | 91 | 26 | – | 9 | 1 | 12 | – | 1 | 1 | 3 | 6 | 2 | – | 2 | 15 | – | – |
| Percina nevisense * | – | – | 2 | 22 | 20 | 7 | 2 | 7 | 2 | – | 26 | 25 | 1 | – | – | – | 5 | 4 | – | 1 |
| Percina roanoka * | 4 | – | 2 | 86 | 14 | – | 1 | 1 | 8 | – | 31 | 4 | – | 4 | – | – | 11 | 20 | 1 | 1 |
| Petromyzon marinus * | – | – | – | – | – | – | – | – | – | – | – | 2 | 1 | – | – | – | – | – | – | – |
| Pomoxis nigromaculatus * | – | – | – | – | – | – | – | – | – | – | – | – | – | – | – | – | – | – | 2 | 3 |
| Scartomyzon cervinus | – | – | – | 47 | 18 | – | – | – | 1 | – | 11 | – | – | – | – | – | 1 | 2 | – | – |
| Semotilus atromaculatus * | – | – | – | – | – | – | – | – | – | – | – | – | – | 7 | – | – | – | – | – | – |
| Umbra pygmaea | – | – | – | – | – | – | – | – | – | – | – | – | – | – | 1 | – | 1 | 1 | 5 | – |
| Site | Watershed | Temperature | |||||
|---|---|---|---|---|---|---|---|
| Area (km2) | N | Mean | Min | Max | SD | ||
| Tar River subbasin | |||||||
| NFTR | North Fork Tar River | 40.1 | 23,638 | 22.9 | 16.2 | 28.7 | 1.6 |
| SheC | Shelton Creek | 58.5 | 19,834 | 23.6 | 17.7 | 33.7 | 1.4 |
| TR1 | Tar River 1 | 359.0 | 12,048 | 27.6 | 23.7 | 34.2 | 1.5 |
| TR2 | Tar River 2 | 557.1 | 22,392 | 26.3 | 19.6 | 33.2 | 2.0 |
| TR3 | Tar River 3 | 948.0 | 21,648 | 26.3 | 19.1 | 32.6 | 1.9 |
| TR4 | Tar River 4 | 1428.7 | 21,648 | 27.4 | 21.7 | 32.6 | 1.6 |
| Swift Creek subbasin | |||||||
| RBC | Red Bud Creek | 36.2 | 16,488 | 24.9 | 18.2 | 31.7 | 1.9 |
| SaC1 | Sandy Creek 1 | 138.9 | 7200 | 27.2 | 22.6 | 33.1 | 1.6 |
| SaC2 | Sandy Creek 2 | 252.1 | 20,736 | 24.5 | 18.1 | 30.2 | 1.8 |
| SaC3 | Sandy Creek 3 | 287.4 | 18,072 | 25.0 | 19.7 | 30.7 | 1.6 |
| SwC1 | Swift Creek 1 | 471.6 | 15,456 | 24.5 | 19.2 | 30.7 | 1.9 |
| SwC2 | Swift Creek 2 | 693.5 | 14,688 | 26.3 | 20.6 | 31.1 | 1.7 |
| TR5 | Tar River 5 | 3364.1 | 11,112 | 27.0 | 18.6 | 34.7 | 2.7 |
| Fishing Creek subbasin | |||||||
| RS1 | Rocky Swamp 1 | 27.1 | 11,376 | 23.3 | 20.2 | 29.7 | 1.5 |
| RS2 | Rocky Swamp 2 | 51.1 | 22,176 | 23.4 | 17.1 | 29.1 | 1.6 |
| ShoC | Shocco Creek | 62.9 | 20,664 | 23.1 | 17.1 | 29.1 | 1.8 |
| LFC1 | Little Fishing Creek 1 | 73.6 | 17,616 | 22.1 | 19.0 | 26.6 | 1.3 |
| LFC2 | Little Fishing Creek 2 | 460.7 | 18,984 | 24.6 | 19.7 | 28.7 | 1.4 |
| LFC3 | Little Fishing Creek 3 | 485.7 | 19,896 | 24.5 | 18.6 | 30.7 | 1.8 |
| FC | Fishing Creek | 2035.5 | 2064 | 28.5 | 25.7 | 31.7 | 1.3 |
| Site | Logger A | Logger B | Logger C | ||||||||||||
|---|---|---|---|---|---|---|---|---|---|---|---|---|---|---|---|
| N | Mean | Min | Max | SD | N | Mean | Min | Max | SD | N | Mean | Min | Max | SD | |
| Tar River subbasin | |||||||||||||||
| NFTR | 9095 | 23.3 | 16.2 | 28.7 | 1.8 | 7512 | 22.6 | 17.2 | 25.7 | 1.6 | 7031 | 22.6 | 19.6 | 25.2 | 1.2 |
| SheC | 7913 | 23.9 | 17.7 | 33.7 | 1.5 | 6312 | 23.4 | 20.2 | 33.7 | 1.3 | 5609 | 23.2 | 18.6 | 26.2 | 1.2 |
| TR1 | 4752 | 28.0 | 23.7 | 34.2 | 1.8 | 4752 | 27.4 | 23.7 | 31.2 | 1.3 | 2544 | 27.2 | 24.7 | 29.6 | 1.1 |
| TR2 | 9000 | 26.8 | 19.6 | 33.2 | 2.1 | 9000 | 26.2 | 20.7 | 31.2 | 1.7 | 4392 | 25.4 | 20.6 | 28.6 | 1.6 |
| TR3 | 7416 | 26.6 | 19.1 | 32.6 | 2.1 | 6816 | 26.7 | 22.2 | 32.2 | 1.7 | 7416 | 25.7 | 19.7 | 29.2 | 1.7 |
| TR4 | 7704 | 27.6 | 21.7 | 32.6 | 1.8 | 6240 | 27.5 | 22.2 | 31.7 | 1.6 | 7704 | 27.0 | 22.2 | 30.2 | 1.4 |
| Swift Creek subbasin | |||||||||||||||
| RBC | 5496 | 24.8 | 18.2 | 31.7 | 2.1 | 5496 | 24.9 | 19.2 | 29.7 | 1.9 | 5496 | 24.9 | 19.7 | 28.7 | 1.8 |
| SaC1 | 2400 | 27.3 | 22.6 | 32.6 | 1.8 | 2400 | 27.3 | 23.2 | 32.7 | 1.6 | 2400 | 27.1 | 23.7 | 33.1 | 1.5 |
| SaC2 | 6912 | 24.8 | 18.1 | 30.2 | 2.0 | 6912 | 24.6 | 19.1 | 29.2 | 1.8 | 6912 | 24.2 | 19.2 | 28.2 | 1.7 |
| SaC3 | 6024 | 25.7 | 19.7 | 30.7 | 1.7 | 6024 | 24.9 | 20.2 | 28.7 | 1.4 | 6024 | 24.3 | 19.7 | 27.2 | 1.3 |
| SwC1 | 5136 | 25.8 | 19.6 | 30.7 | 1.8 | 5160 | 24.3 | 20.0 | 28.1 | 1.5 | 5160 | 23.3 | 19.2 | 26.7 | 1.5 |
| SwC2 | 3552 | 26.3 | 20.7 | 31.1 | 2.0 | 5736 | 26.2 | 20.6 | 30.7 | 1.7 | 5400 | 26.4 | 21.1 | 29.6 | 1.5 |
| TR5 | 4320 | 28.1 | 21.7 | 34.7 | 2.4 | 2472 | 27.3 | 21.2 | 32.1 | 2.4 | 4320 | 25.7 | 18.6 | 30.6 | 2.6 |
| Fishing Creek subbasin | |||||||||||||||
| RS1 | 3792 | 24.0 | 20.2 | 29.7 | 1.6 | 3792 | 23.1 | 20.2 | 27.6 | 1.4 | 3792 | 23.0 | 20.6 | 26.7 | 1.3 |
| RS2 | 7392 | 23.8 | 17.1 | 29.1 | 1.8 | 7392 | 23.3 | 18.6 | 27.6 | 1.5 | 7392 | 23.1 | 19.2 | 26.7 | 1.4 |
| ShoC | 6888 | 23.8 | 17.1 | 29.1 | 2.0 | 6888 | 23.1 | 18.1 | 27.2 | 1.7 | 6888 | 22.5 | 18.2 | 25.7 | 1.5 |
| LFC1 | 6864 | 22.5 | 19.1 | 26.6 | 1.3 | 4656 | 22.4 | 19.0 | 25.6 | 1.2 | 6096 | 21.4 | 19.2 | 23.7 | 0.9 |
| LFC2 | 6888 | 24.7 | 19.7 | 28.7 | 1.6 | 6888 | 24.7 | 20.2 | 28.2 | 1.4 | 5208 | 24.5 | 21.7 | 27.2 | 1.2 |
| LFC3 | 7368 | 25.2 | 18.6 | 30.7 | 2.0 | 5160 | 24.4 | 19.1 | 27.7 | 1.7 | 7368 | 23.9 | 19.6 | 27.1 | 1.5 |
| FC | 696 | 28.6 | 25.7 | 31.7 | 1.4 | 696 | 28.8 | 26.1 | 31.6 | 1.3 | 672 | 28.2 | 26.1 | 30.1 | 1.0 |
| Temperature Relationship | N | R2 | F | p-Value |
|---|---|---|---|---|
| Water column and upper substrate (5 cm) | ||||
| Logger B = 2.231 + 0.894(Logger A) | 108,096 | 0.8879 | 856,000 | <0.001 |
| Water column and lower substrate (15 cm) | ||||
| Logger C = 4.624 + 0.780(Logger A) | 105,729 | 0.7312 | 287,600 | <0.001 |
| Site | Maximum Exceedance Duration (h) | ||||||||
|---|---|---|---|---|---|---|---|---|---|
| 28 °C | 30 °C | 33 °C | |||||||
| A | B | C | A | B | C | A | B | C | |
| Tar River subbasin | |||||||||
| NFTR | 5 | 0 | 0 | 0 | 0 | 0 | 0 | 0 | 0 |
| SheC | 9 | 9 | 0 | 6 | 6 | 0 | 2 | 2 | 0 |
| TR1 | 179 | 156 | 156 | 68 | 16 | 0 | 6 | 0 | 0 |
| TR2 | 140 | 104 | 16 | 17 | 13 | 1 | 4 | 0 | 0 |
| TR3 | 71 | 127 | 64 | 14 | 12 | 0 | 0 | 0 | 0 |
| TR4 | 164 | 308 | 266 | 66 | 67 | 15 | 0 | 0 | 0 |
| Swift Creek subbasin | |||||||||
| RBC | 17 | 18 | 17 | 7 | 0 | 0 | 0 | 0 | 0 |
| SaC1 | 108 | 111 | 112 | 15 | 16 | 17 | 0 | 0 | 2 |
| SaC2 | 66 | 65 | 19 | 2 | 0 | 0 | 0 | 0 | 0 |
| SaC3 | 116 | 15 | 0 | 12 | 0 | 0 | 0 | 0 | 0 |
| SwC1 | 70 | 7 | 1 | 11 | 0 | 1 | 0 | 0 | 0 |
| SwC2 | 89 | 91 | 111 | 13 | 10 | 0 | 0 | 0 | 0 |
| TR5 | 511 | 513 | 469 | 88 | 88 | 43 | 8 | 0 | 0 |
| Fishing Creek subbasin | |||||||||
| RS1 | 10 | 0 | 0 | 0 | 0 | 0 | 0 | 0 | 0 |
| RS2 | 8 | 0 | 0 | 0 | 0 | 0 | 0 | 0 | 0 |
| ShoC | 7 | 0 | 0 | 0 | 0 | 0 | 0 | 0 | 0 |
| LFC1 | 0 | 0 | 0 | 0 | 0 | 0 | 0 | 0 | 0 |
| LFC2 | 12 | 7 | 0 | 0 | 0 | 0 | 0 | 0 | 0 |
| LFC3 | 19 | 0 | 0 | 6 | 0 | 0 | 0 | 0 | 0 |
| FC | 165 | 380 | 328 | 16 | 19 | 10 | 0 | 0 | 0 |
Disclaimer/Publisher’s Note: The statements, opinions and data contained in all publications are solely those of the individual author(s) and contributor(s) and not of MDPI and/or the editor(s). MDPI and/or the editor(s) disclaim responsibility for any injury to people or property resulting from any ideas, methods, instructions or products referred to in the content. |
© 2024 by the authors. Licensee MDPI, Basel, Switzerland. This article is an open access article distributed under the terms and conditions of the Creative Commons Attribution (CC BY) license (https://creativecommons.org/licenses/by/4.0/).
Share and Cite
Pandolfo, T.J.; Cope, W.G.; Weaver, D.M.; Kwak, T.J. Thermal Threats to Freshwater Mussels: An Empirical Stream Assessment. Diversity 2024, 16, 37. https://doi.org/10.3390/d16010037
Pandolfo TJ, Cope WG, Weaver DM, Kwak TJ. Thermal Threats to Freshwater Mussels: An Empirical Stream Assessment. Diversity. 2024; 16(1):37. https://doi.org/10.3390/d16010037
Chicago/Turabian StylePandolfo, Tamara J., W. Gregory Cope, Daniel M. Weaver, and Thomas J. Kwak. 2024. "Thermal Threats to Freshwater Mussels: An Empirical Stream Assessment" Diversity 16, no. 1: 37. https://doi.org/10.3390/d16010037
APA StylePandolfo, T. J., Cope, W. G., Weaver, D. M., & Kwak, T. J. (2024). Thermal Threats to Freshwater Mussels: An Empirical Stream Assessment. Diversity, 16(1), 37. https://doi.org/10.3390/d16010037