Abstract
Greece is a European hotspot for Orthoptera (378 species), yet it has been scarcely explored. We investigated the diversity patterns of Orthoptera and the ecological mechanisms shaping them by sampling 15 sites (30 plots of 1ha) across five habitats in Mount Mitsikeli, a Natura 2000 site. The mountain is deemed rich (0.4 species/km2), hosting 34 species, including a species of European interest (Paracaloptenus caloptenoides). The grassy openings in the beech–fir forest and rural mosaics were found to be important habitats for Orthoptera, while the mountain grasslands were poorer but hosted a greater abundance of grasshoppers. The three main environmental factors shaping diversity patterns (with an explained variance of 51.34%) were grass height, the cover of woody vegetation and the cover of bare ground. Beta diversity was high (with a Bray–Curtis of index 0.45 among habitats). Species turnover prevailed among all sites and within agricultural land, beech–fir forest and Mediterranean scrub, while nested patterns prevailed within mountain grasslands and mixed thermophilous forest. Conservation actions should target sites in ecosystems driven by species turnover, but primarily the most species-rich sites are driven by nestedness. Such actions should include the implementation of biodiversity-inclusive grazing schemes to hamper forest encroachment and the restoration of mountain grassland quality from cattle overgrazing.
1. Introduction
Orthoptera are key organisms in grassland ecosystems [1,2,3]. They play a central role in food webs [4], functioning both as a food source for vertebrates [5,6] and arthropod predators [7]. They are related to the naturalness of ecosystems [8,9], are sensitive to environmental changes, including vegetation succession and grazing pressure [10,11,12,13], and reflect microclimatic conditions [14]. For these reasons, Orthoptera have been used as bioindicators for conservation management [15,16] and its efficiency evaluation [17,18,19,20,21]. Greece is a hotspot for European Orthoptera fauna [22,23], hosting over one-third of all European species (35%: 378 species), with a pronounced degree of endemism (37%) and a number of red-listed species under the IUCN criteria (37%) [24,25]. However, the ecological knowledge base for Orthoptera communities is poor in Greece and is restricted to a few case studies (e.g., [15,26,27,28]).
We employed Orthoptera as a target group to explore their diversity patterns and identify the ecological mechanisms that shape those patterns and drive community variation [29]. Diversity assessment can be categorized into alpha diversity, associated with the local species richness of a sample unit (site or habitat), gamma diversity, associated with regional species richness as the total species richness of all sample units within a studied region, and beta diversity [30]. Beta diversity refers to the variation within species communities among sample units and can be partitioned into two components [31,32,33]. The first component is balanced variation in abundance (βbal) and reflects species turnover, namely the replacement of individuals of some species by the same number of individuals of different species and, subsequently, the loss of a species followed by a gain of another. The second component is abundance gradient (βgra) and indicates nestedness, namely the property of a species community to be a subset of a larger community, which is caused by a non-random process of species loss and is usually accompanied by alterations in species richness [31]. In such cases, if an individual is lost, the overall abundance is expected to decrease, gradually resulting in the ordered loss of species along ecological gradients [34,35].
Estimating the contribution of these components to beta diversity can help to pinpoint the processes affecting community structure and identify areas with high species turnover or nestedness to justify the implementation of suitable conservation actions [36]. If species turnover emerges as a key mechanism in beta diversity, it signifies that conservation efforts should focus on safeguarding multiple sites. On the other hand, if nestedness emerges as a key mechanism in species diversity within a studied community, conservation actions should target the richest sites. As each component involves different processes to predict community composition, it becomes challenging to disentangle these processes when both small and large scales are involved. To meet this challenge, we investigated habitat-specific variables that could influence beta diversity and its components, aiming to contribute valuable insights for potential inclusion in conservation strategies [37]. Furthermore, we examined the hypothesis that differences in species composition are influenced by geographic distance (the distance decay of similarity hypothesis [38], i.e., similarity diminishes as the distance between similar habitats within a study area increases, potentially due to dispersal limitations or habitat type, possibly owing to habitat filters or environmental variations [3,39]).
We focused on Mount Mitsikeli, a protected site in the European network Natura 2000, which has been largely unexplored in terms of its invertebrate diversity. Our knowledge is restricted to species inventories delivered by broad-scale atlas studies for butterflies [40,41] and Orthoptera [25]. We aimed to assess the conservation value of Mt Mitsikeli and its habitats for Orthoptera communities. We also explored the environmental factors that regulate the composition of the Orthoptera community on Mt Mitsikeli, as microhabitat characteristics strongly affect the structure and diversity of this taxon [42]. With Orthoptera as our focal taxon, we aimed to answer whether neutral or ecological mechanisms are more prominent in shaping species communities at different spatial scales [43]. In the first case, we found that species turnover drives community variation in terms of species composition and abundance (βbal > βgra), whereas in the second case, abundance gradients were more prominent (βgra > βbal). We concluded by interpreting our findings from a conservation perspective.
2. Materials and Methods
2.1. Study Area and Site Selection
The study area was in northwestern Greece, in the region of Epirus (longitude 39°43′ and latitude 20°54′) (Figure 1). It covers 84.36 km2 and is a site in the Natura 2000 European network of protected areas (GR2130008), with an altitude varying between 600 m and 1816 m. The wider area is characterized by a terrestrial Mediterranean climate, with hot and dry summers and mild winters [44]. The annual rainfall is 1486 mm (the average from 2019–2022). The annual temperature ranges between 0.9 °C and 23.7 °C (the average from 2019–2022) [45]. The mountain’s eastern side has a higher percentage of precipitation and cooler conditions, mainly during summer [44,46], which favors forest growth, while the western side is mainly dominated by Mediterranean heathlands and scrub [47]. The prevailing rock formations on Mt Mitsikeli comprise several types of limestone, belonging to the Adriatic–Ionian zone [48].
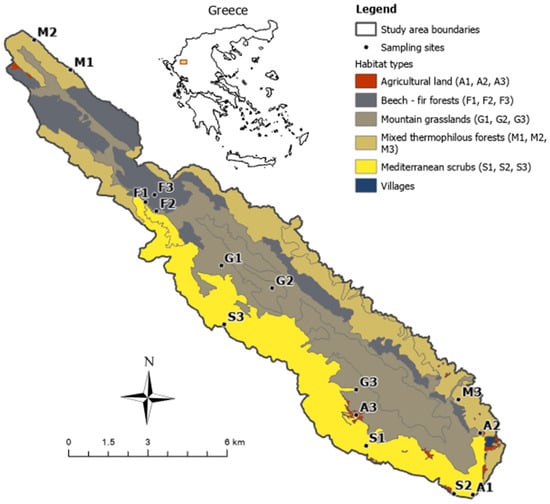
Figure 1.
Sampling sites across the five main habitat types of Mt Mitsikeli in NW Greece. Three sites were sampled per habitat type (15 sites in total).
We considered the typology of the European Habitats Directive (92/43/E.C.) and the national habitat database of the Natura 2000 network [49] to identify five main habitat types (Figure 1, Table A1): (1) mountain grasslands, including habitats 4090, referring to subalpine grasslands with heaths (dominant species: Astragalus angustifolius and Daphne oleoides), and 5210, i.e., grasslands with sparse juniper matorral (dominant species: Juniperus oxycedrus) lying above 1200 m and covering one-third of the mountain area (35%); (2) mediterranean scrub, refering to pseudomaquis dominated by Quercus coccifera and Juniperus oxycedrus (habitat 5330) and covering the more arid southern part of the mountain (25%); (3) mixed thermophilous forest, including oak forest (habitat 9280: Quercus frainetto and 91M0: Quercus cerris), as well as mixed deciduous forest (habitat 925A: Carpinus orientalis and Ostrya carpinifolia), accounting for 23% of the mountain area; (4) beech–fir forest, including pure beech forest (habitat 9150: Fagus sylvatica) and mixed forest (habitat 9270: beech forest with Abies borisii-regis), covering a smaller part of the mountain (16%) on its western side; (5) agricultural land, including agricultural fields that have been either cultivated or abandoned (additional habitats 1050, 1051, 1056, 1057 and 1062, according to the supplemental national habitat typology), covering a small proportion of Mt Mitsikeli (<1%). Mitsikeli holds populations of ungulates, such as Balkan chamois and roe deer, as well as large carnivores, such as grey wolf and brown bear, but human disturbance is pronounced [50]. Mountain grasslands are used as pastures during summer for sheep and goats and, recently, cattle grazing, so they show signs of grassland quality degradation [44]. We sampled three sites of 1 ha in each of the five main habitat types, keeping a minimum distance of 500 m between each site (Figure 1).
2.2. Orthoptera Sampling
We randomly located two plots of a standard area of 100 m2 in each sampling site (1 ha), totaling 30 plots, where we recorded Orthoptera species and their abundance at the peak of adult activity (August 2019 and 2020). We complemented the species inventory of the study area with presence-only records during the spring (May–June 2020). We used a sweep net to catch Orthoptera and identified them in situ using identification keys [25,51], a portable microscope and macro-photography (Nikon 105 mm macro). In a few cases, species identification was confirmed using sound production [25]. All individuals were released after identification and no specimens were collected or killed.
2.3. Environmental Factors
We recorded 10 environmental parameters (August 2019). We estimated woody vegetation cover (Ws) at site level as the total proportion of tree cover (T) (>2 m), the cover of tall shrubs (Hs) (0.5–2 m) and the cover of short shrubs (Ls) (<0.5 m). We recorded nine microhabitat parameters at the plot level, namely the percentage of tree cover (W), grass (G), rocks and stones (St) and bare ground (S), as well as altitude (A), mean grass height (Gh), the number of flower units (F) and soil humidity (H) (ordinal scale: dry, medium or humid). Given the absence of grazing intensity data (livestock units/ha), we qualitatively estimated grazing intensity (I) (ordinal scale: none, mild or intense) based on in situ livestock observations and their droppings, as well as the presence of tolerant plants indicating intensive grazing (e.g., Verbascum sp.) [52].
2.4. Data Analysis
2.4.1. Sampling Efficiency and Alpha Diversity
To assess sampling efficiency, we computed the overall estimated number of species using the non-parametric Chao 1 species estimator (with 1000 permutations) [53]. We calculated species richness (S), the Shannon index (H) and Pielou’s evenness index (J) for each plot, considering the maximum number of individuals (N) recorded for each species in the plots over the two sampling years. Calculations were performed in PAST [54].
2.4.2. Community Composition and Structure
To identify the environmental factors that influenced community composition, we conducted a redundancy analysis (RDA) with the interactive forward selection method using CANOCO 5 software (version 5) [55]. The position of a species in the RDA diagram indicates its degree of dependence on the closest environmental parameters (arrows). The diagram only shows species that were sufficiently influenced by the parameters (fit > 25%) and significant environmental variables (p < 0.05) and did not suffer from collinearity (based on 1000 iterations of the Monte Carlo test).
2.4.3. Beta Diversity and Its Partitions
We calculated the pairwise abundance-based beta diversity among the sites (15 sites) and habitats (5 habitats), as well as within habitats (3 sites in each habitat type). We used Balsega’s index [56], which partitions the abundance-based Bray–Curtis dissimilarity index (β) into its two components: balanced abundance variation (βbal) and abundance gradient (βgra), corresponding to species replacement and nestedness, respectively. The Bray–Curtis dissimilarity index (β) ranges from 0 to 1 and is the sum of the two components (β = βbal + βgra). We used the beta.pair.abund function from betapart [32], a package used for testing hypotheses on ecological and evolutionary processes shaping biodiversity patterns at different spatial scales [57]. We tested the differences in beta diversity and its components using the non-parametric Kruskal–Wallis statistic and Dunn’s test, with the Bonferroni correction for p-values as a post-hoc test [58].
To improve our understanding of the impact of the environmental parameters on beta diversity and its partitions, we conducted distance-based permutational multivariate analyses of variance (PERMANOVA) using the adonis2 function in the vegan package [59], incorporating 1000 permutations. Two distinct models were constructed: one aimed at assessing large-scale effects at the site level (100 × 100 m) and the other was designed to evaluate fine-scale effects at the plot level (10 × 10 m). The response variable for all cases consisted of a distance matrix of beta diversity and its associated components.
We created Euclidean distance matrices using the dist function in R [60]. These matrices were based on the geographical coordinates (latitude and longitude) of the habitat centroids and sites of each sample unit. Next, we applied a generalized linear model (GLM) with the decay.model function [61], using total abundance-based beta diversity (β) and its components (βbal and βgra) as response variables. Spatial distance was included as a predictor variable, with a log link function and Gaussian error distribution [62]. To assess the goodness of fit for the decay models, we computed a pseudo-r² value, calculated as one minus the ratio of the model deviance to the null deviance. After subjecting the spatial distances to 1000 permutations, we determined the statistical significance of the models by estimating the percentage of times the model deviance was lower than the deviance obtained from randomized models.
3. Results
3.1. Species Richness
We recorded a total of 34 Orthoptera species (2477 individuals) out of the 50 species encountered on Mt Mitsikeli (Table S1) in 30 plots ranging from 830 m to 1366 m and covering different microhabitats, with a mean grass height from 15 to 70 cm. Half of them showed signs of grazing (Table A2).
We found that Mt Mitsikeli hosted 0.4 species per km2. Our research added six new records to the mountain inventory [25] (Table 1). The predicted species richness according to the Chao 1 index was 38.5 species, indicating adequate sampling efficiency (88%). All species belonged to 3 of the 12 Orthoptera families found in Greece, namely Acrididae (Caelifera), Tettigoniidae and Gryllidae (Ensifera). The most common species was Chorthippus dichrous (807 individuals recorded in 83.3% of the plots). We also recorded Paracaloptenus caloptenoides, a species included in the Habitats Directive (92/43/E.C., Annex II).

Table 1.
Inventory of the Orthoptera species (34) sampled on Mt Mitsikeli (2019–2020).
The average number of Orthoptera species per plot was 6.33 ± 1.84 and the abundance per plot ranged between 1 and 200 individuals. Mixed beech–fir forest was the most species-rich habitat, with 18 Orthoptera species and the highest number of bush crickets (Tettigoniidae), followed by agricultural land and mixed thermophilous forest (15 species). Mountain grasslands were poor in terms of species richness but had the greatest abundance of Orthoptera. No statistically significant differences were found among habitats in terms of species richness (Kruskal–Wallis: χ2 = 2.88, p > 0.05) (Table 2).
Table 2.
Average values of environmental parameters at the site (1 ha) and plot levels (100 m2) and diversity indices for the five habitat types sampled. Site level: T, tree cover (%); Hs, cover of tall shrubs (0.5–2 m); Ls, cover of short shrubs (<0.5 m); Ws, total woody vegetation cover. Plot level: A, altitude (m); H, humidity (1: dry, 2: medium, 3: humid); W, tree cover (%); St, rocky substrate cover (%); G, grass cover (%); So, bare ground cover (%); Gh, mean grass height (cm); F, number of flower units. I, grazing intensity (0: none, 1: mild, 2: intensive). Diversity indices: S, species richness; Smean, mean species richness of plot; E, ensifera species richness; H, Shannon index; Hmean, mean Shannon index of plot; J, Pielou’s evenness index; N, sum of individuals.
3.2. Environmental Factors Shaping Community Composition
Three environmental factors significantly shaped Orthoptera communities on Mt Mitsikeli, namely woody vegetation cover (Ws), bare ground cover (So) and mean grass height (Gh) (with a total explained variance of 51.34%). Most species, particularly Chorthippus mollis, Euchorthippus declivus and Chorthippus dichrous, avoided habitats with pronounced woody vegetation and bare ground cover, except for Platycleis albopunctata and Platycleis intermedia (Figure 2). Several species favored either higher grass heights, such as Rhacocleis germanica, Stenobothrus fischeri and Tylopsis lilifolia, or lower grass heights, such as Poecilimon jonicus.
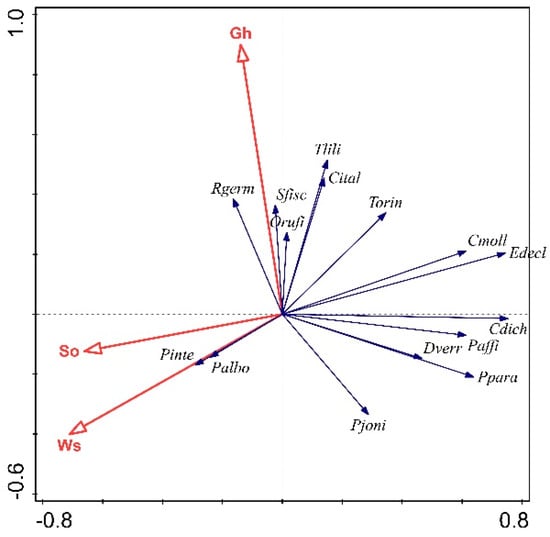
Figure 2.
Biplot for the axes of the redundancy analysis (RDA). Woody vegetation cover (Ws), bare ground cover (So) and mean grass height (Gh) were the environmental factors (red arrows), which significantly regulated (p < 0.05) the presence of Orthoptera species (blue arrows). The abbreviations of the species names are given in Table A2.
3.3. Beta Diversity and Its Partitions
The average Bray–Curtis dissimilarity index (β) was 0.7 among the sites and 0.45 among the habitats (Figure 3), showing that the species assemblages were quite distinctive on Mt Mitsikeli at both spatial scales. Balanced variation in abundance (βbal) accounted for 74% of beta diversity among the study area sites, while the nestedness component (βgra) accounted for the remaining 26%. However, the two components equally contributed to beta diversity among the habitats within the study area (Figure 3). Therefore, species replacement was three times greater than the nestedness component at the site level, but not at the habitat level. Within sites, βbal was the main component of beta diversity in agricultural land, beech–fir forest and Mediterranean scrub, while βgra was the main component in mountain grasslands and mixed thermophilous forest (Figure 4).
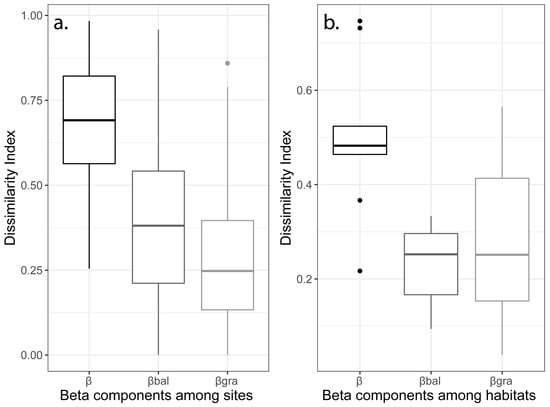
Figure 3.
Boxplots of the Bray–Curtis dissimilarity index (β) for the abundance-based data and its partitions: balanced variation in abundance (βbal) and abundance gradient (βgra), considering two spatial scales of compositional dissimilarity among (a) 15 sites and (b) 5 habitats on Mt Mitsikeli.
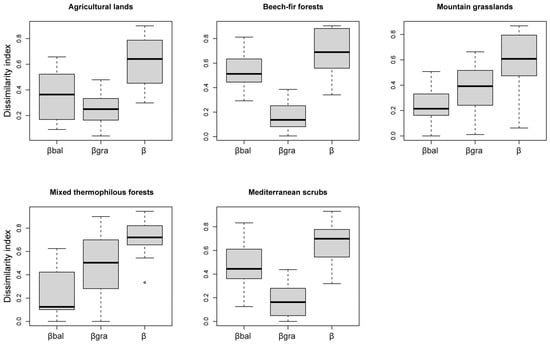
Figure 4.
Boxplots of the Bray–Curtis dissimilarity index (β) for the abundance-based data and its partitions: balanced variation in abundance (βbal) and abundance gradient (βgra), considering composition dissimilarity within each of the sampled habitat types on Mt Mitsikeli.
The highest values of balanced variation in abundance within habitats was observed in beech–fir forest and Mediterranean scrub, while the highest values for abundance gradient were found in mountain grasslands and mixed thermophilous forest. The non-parametric statistical Kruskal–Wallis test revealed an important difference in beta diversity and its components between sites (χ2 β = 59.12, d.f. = 14, p < 0.001; χ2 βgra = 44.43, d.f. = 14, p < 0.001; χ2 βbal = 63.21, d.f. = 14, p < 0.001). We found no differences in beta dissimilarity or its partitions between habitats or within each habitat type (p > 0.05).
Concerning the impact of the environmental parameters on beta diversity and its partitions, tree cover was the most important driver of compositional dissimilarity and abundance gradient, while it was only marginally significant for balanced variation in abundance, considering the large-scale effect model (Table A3). According to the fine-scale effect model, grass cover and elevation were important characteristics of compositional dissimilarity and the balanced variation in abundance component. Woody vegetation cover also influenced abundance gradient in the fine-scale effect model (Table A3).
Geographical distance did not increase dissimilarity among sites when partitioning beta diversity into its components (β: R2 = 0.009, p = 0.45; βbal: R2 = 0.002, p = 0.65; βgra: R2 = 0.01, p = 0.24). On the contrary, within the same habitat, our analysis revealed a positive relationship between dissimilarity index and geographical distance within agricultural land (β: R2 = 0.64, p = 0.05; βbal: R2 = 0.68, p = 0.04), mountain grasslands (β: R2 = 0.57, p = 0.02; βbal: R2 = 0.46, p < 0.01) and beech–fir forest (β: R2 = 0.42, p = 0.01; βbal: R2 = 0.42, p = 0.02). In the absence of modeling the distance decay of similarity, there could be a misinterpretation, where the observed dissimilarity within these habitat types might be incorrectly attributed solely to species turnover and habitat filtering effects.
4. Discussion
4.1. Species Richness and Conservation Value of Mt Mitsikeli
Our results showed that Mt Mitsikeli is deemed rich in terms of Orthoptera diversity, hosting 0.4 species/km2, compared to other vicinal Mediterranean mountains, such as Mt Grammos (0.16 species/km2) [27]. We also recorded for the first time Paracaloptenus caloptenoides, a species annexed in the Habitats Directive 92/43/E.C., which has an unfavorable conservation status in Greece [49], classified as Near-Threatened on the European Red List of Grasshoppers [23]. However, no endemic or narrowly distributed and red-listed Orthoptera species were recorded on Mt Mitsikeli, in contrast to other higher altitude Greek mountains [25].
Our results also indicated that mixed beech–fir forest openings were richer habitats for Orthoptera than mountain grasslands. The grassy forest openings were in good condition, with substantial bush cover that favored bush crickets, and showed no signs of degradation from cattle overgrazing, as was the case in the mountain grasslands (Table 2 and Table A2). Agricultural land was also species-rich, despite its restricted cover (only 0.72 km2 of the study area). It hosted the highest number of species per km2 and consisted of abandoned agricultural fields at the edge of forest, with hedges and tree lines, which were used in some cases for livestock grazing. Given that habitat heterogeneity is known to enhance species richness [62], such rural mosaics seem to offer many microhabitats that can maintain high Orthoptera diversity [15,27], as well as the diversity of other insects [63].
4.2. Environmental Factors Shaping Community Composition
We found that woody vegetation cover, bare ground cover and mean grass height were significant factors shaping the compositions of Orthoptera communities (Figure 2). The avoidance pattern of Orthoptera toward shade that we found on Mt Mitsikeli is a well-known pattern in Mediterranean communities (e.g., [15]). Higher levels of woody vegetation cover generate lower temperatures and higher soil humidity conditions [13], which this ectotherm group does not prefer. We also found that most Orthoptera species avoided bare ground (Figure 2), which was consistent with the findings of other studies [27,64]. Although bare soil patches are a distinct habitat favored by xerothermophilic species [15], increased bare soil corresponds to decreased vegetation cover, reducing food and shelter resources [65,66]. Grass height exerted both positive and negative influences on the Orthoptera communities on Mt Mitsikeli as some species preferred higher grass heights while others did not (Figure 2). Vegetation height has an important influence on the abundance [67], richness [68] and occurrence of grasshoppers [69]. Dense and high grass vegetation may hamper the activity and development of nymphs [70], particularly among thermophilous species [71], whereas low grass heights may restrict Caelifera species from thermoregulating [72].
4.3. Beta Diversity and the Role of Environmental Variables
The formation of Orthoptera communities on Mt Mitsikeli was influenced by species turnover and nestedness (Figure 3b). We found that species turnover prevailed between the sites (Figure 3a) and in the plots of the following habitat types: agricultural land, beech–fir forest and Mediterranean scrub (Figure 4). We attributed this pattern to the environmental heterogeneity hypothesis, stating that more diverse regions provide numerous niches, fostering greater varieties of species [73]. The combination of the several habitat types on Mt Mitsikeli and the concomitant variety of microhabitats allowed for differentiation between the functional identities of species, promoting species turnover in the studied system. Most Orthoptera are relatively small organisms that live within vegetation and typically consume plant tissues [74,75]. They are known to occupy small microhabitats [76] and are tightly related to fine-scale habitat features [19]. Even within the same habitat type, fine-scale factors, such as grass cover and woody vegetation cover (Table A2), can vary and alter microclimatic conditions, causing species to replace one another. Other habitat characteristics, such as flower heads, can play a similar role [27]. High species replacement allows for higher richness as the variety of micro-niche features is a selective force that promotes unique species combinations within systems.
We also attributed the species turnover prevalence to the low dispersal ability of many Orthoptera species [19]. Mobile species, like butterflies, tend to exhibit high similarity within local communities, thereby reducing species turnover. In contrast, increased species aggregation across different localities of the same habitat type is expected for groups with lower dispersal ability. This aggregation justifies the elevated species turnover that is linked with higher alpha (α) diversity [77].
On the other hand, we found that nested patterns prevailed within mountain grasslands and mixed forest (Figure 4). The nested distributions suggested that particular factors resulting from habitat- and species-specific characteristics [78] could lead to the species composition of one sampling site being a subset of a larger species pool found in another sampling site.
We attribute the nested pattern in mountain grasslands to grazing disturbance, which can directly impact various vegetation structure components [79], including grass cover, which was also found to drive beta diversity (Table A3). From this perspective, the lower grazing level recorded in one of the mountain grasslands (site G2) and the consequent greater grass cover (see Table A2) could explain its higher species richness and its role as a species pool enriching vicinal grasslands. Given that vegetation cover largely explains plant species richness [80] and plant diversity is related to greater Orthoptera diversity [81,82], mountain grasslands with greater grass cover and milder grazing levels could act as species pools for vicinal grasslands. Therefore, intensive livestock grazing could hinder the distribution of most Orthoptera species [10,82] given that this mostly herbivorous group contends with ungulates for the same grazing grounds [83].
Furthermore, we can explain the nested pattern found in thermophilous mixed forest by the filtering role of tree and woody vegetation cover in Orthoptera distributions (Table A3). Most thermophilous forest in the study area (e.g., sites M1 and M2) was characterized by high numbers of trees and bushes. A more closed canopy signifies a higher homogeneity in vegetation structure [19] and limited direct radiation [84], which does not favor ectothermic organisms, such as Orthoptera. One site (M3) comprised abandoned agricultural land in an advanced stage of succession and fringe forest vegetation and could act as a species pool to vicinal sites. This forest site was more species rich due to increased vegetation structures that favor arthropods [85,86] and Orthoptera [10,81].
4.4. Spatial Dynamics of Beta Diversity
Although the decay of similarity with distance was not an issue across sites, it provided interesting insights into the mechanisms underlying beta diversity and its components within mountain grasslands and beech–fir forest. It also mapped a significant change in beta diversity with distance within agricultural land. Such geographic distance dependence suggests that uneven species distributions between locations with the same vegetation characteristics are further related to large-scale processes, such as climatic gradient, or processes induced by topography. For example, the eastern slopes of Mt Mitsikeli receive increased precipitation compared to the western slopes, while the latter have undergone greater human intervention [44]. This and the different vegetation structures on the two sides of the mountain (i.e., more open areas in the east and more closed or forested areas in the west) could have allowed species turnover to increase with distance.
Other causes explaining the distance decay, according to [78,87], are niche- and dispersal-based processes. In niche-based processes, spatial patterns in species composition are constrained by the local environments and unique traits of the species, similar to what promotes nestedness. Orthopteran communities in mountain grasslands are possibly hampered by natural causes (e.g., climate) and human activity (e.g., livestock grazing), justifying why niche-based processes are attributed to this type of habitat. However, there is no systematic management of livestock farming that takes place across mountain grasslands that can determine or control its intensity, spatial distribution or temporal use. Snow cover and other severe weather events, including prolonged dry periods, also cannot be ruled out. This implies that the spatial arrangement we documented in this study could potentially have been impacted by forthcoming alterations in climate or environmental conditions.
On the other hand, dispersal-based processes regulate spatial patterns in species composition through neutral processes as the ability of a species to disperse is often not affected by environmental differentiation [88]. The low dispersal capacity of the species found only in beech–fir forest (Leptofyes punctatissima, P. caloptenoides and Vichetia oblongicollis) or agricultural land (Eupholidoptera schmidti and Saga hellenica) could support the negative relationship between distance and similarity index in species composition to some extent. Accordingly, concerning the more abundant species that present narrow niches, such as Sepiana sepium and R. germanica, we suggest that their aggregated distributions within beech–fir forest and agricultural land justify their role as the engineers of the spatial structures in these environments.
4.5. Conservation Implications
According to our findings, the inventory of species of European interest should be updated for Mt Mitsikeli [89], a protected site of the Natura 2000 network, by adding P. caloptenoides. Given the unfavorable conservation status of the species and the great species richness of Orthoptera on the mountain, we suggest conservation-oriented actions for orthoptera communities.
We suggest hampering forest encroachment and maintaining grassy openings within forest and scrub zones, as well as maintaining rural mosaics given their restricted extent on Mt Mitsikeli. As forest encroachment has been documented to negatively affect invertebrate diversity [90,91], we suggest introducing mild goat grazing or enhancing the populations of wild herbivores to prevent forest encroachment, maintain microhabitat heterogeneity and benefit Orthoptera and other organisms [26,92,93]. We strongly recommend the introduction and implementation of grazing management plans to account for biodiversity maintenance on Mt Mitsikeli. These should primarily target mountain grasslands given their degradation, overgrazing and low Orthoptera species richness.
Our results showed that both species turnover and nestedness should be considered as mechanisms in conservation planning. Conservation efforts should target agricultural land, beech–fir forest and Mediterranean scrub as species turnover was the main mechanism found to act in these habitats. On the other hand, they should first target the maintenance of the richest sites among the mountain grasslands and mixed forest as nestedness was the main mechanism acting in these habitats.
Supplementary Materials
The following supporting information can be downloaded at https://www.mdpi.com/article/10.3390/d16010011/s1, Figure S1: Photos of the five main habitats that were sampled on Mt Mitsikeli: (a) Mediterranean scrub; (b) mixed thermophilus forest; (c) beech–fir forest; (d) agricultural land; (e) mountain grasslands; Table S1: The Orthoptera fauna of Mt Mitsikeli, according to the Greek Orthoptera atlas [25] and the current research.
Author Contributions
Conceptualization, V.K.; methodology, V.K. and K.Z.; formal analysis, A.S., K.Z., O.T. and V.K.; investigation, A.S.; resources, V.K.; writing—original draft preparation, A.S., K.Z. and V.K.; writing—review and editing, A.S., K.Z., O.T. and V.K.; visualization, A.S., K.Z. and V.K.; supervision, V.K.; funding acquisition, A.S. and V.K. All authors have read and agreed to the published version of the manuscript.
Funding
This research was supported by an Orthopterists’ Society studentship grant to A.S. through the Theodore J. Cohn Research Fund.
Institutional Review Board Statement
All research was conducted under the appropriate annual research permits issued by the Department of Forest Management of the Directorate General of Forests and Forest Environment of the Ministry of Environment and Energy of Greece (Protocol code Ψ8ΛΥ4653Π8-ΖH6).
Data Availability Statement
Data are contained within the article.
Acknowledgments
We would like to thank Luc Willemse for his valuable support and help in our fieldwork and specimen identification. We would also like to express our gratitude to the Management Unit of Epirus Protected Areas (NECCA) and Maria Petridou for their fieldwork support. Finally, we would like to thank Raquel Ribeiro and Eva Pitta for sharing their scripts in R.
Conflicts of Interest
The authors declare no conflicts of interest.
Appendix A
Table A1.
Descriptions of the five habitat types sampled in the study area. For each habitat type, the habitat names and codes are listed according to the European Directive (92/43/E.C.), as well as their coverage (%) on Mount Mitsikeli.
Table A1.
Descriptions of the five habitat types sampled in the study area. For each habitat type, the habitat names and codes are listed according to the European Directive (92/43/E.C.), as well as their coverage (%) on Mount Mitsikeli.
| Habitat Type | Habitat Code | Habitat Name | Cover (%) |
|---|---|---|---|
| Mountain grasslands | 4090 | Endemic oro-Mediterranean heath with gorse | 35 |
| 5210 | Arborescent matorral with Juniperus spp. | ||
| Mediterranean scrub | 5330 | Thermo-Mediterranean and pre-desert scrub | 25 |
| Mixed thermophilous forest | 9280 | Quercus frainetto woods | 23 |
| 91M0 | Pannonian balkanic turkey oak–sessile oak forest | ||
| 9250 | Forest of Carpinus orientalis and Ostrya carpinifolia and mixed thermophilous forest | ||
| Beech–fir forest | 9150 | Medio-European limestone beech forest of the Cephalanthero-Fagion | 16 |
| 9270 | Hellenic beech forest with Abies borisii-regis | ||
| Agricultural land | 1050 | Pure non-irrigated arable land | 1 |
| 1051 | Mixed non-irrigable arable land | ||
| 1056 | Pure permanently irrigated land | ||
| 1057 | Mixed permanently irrigated land |
Appendix B
Table A2.
Descriptions of the environmental variables recorded in the 30 plots (10 m × 10 m). A, altitude (m); H, humidity (1: dry, 2: medium, 3: humid); W, tree cover (%); St, rocky substrate cover (%); G, grass cover (%); So, bare ground cover (%); Gh, mean grass height (cm); F, number of flower units; I, grazing intensity (1: none, 2: mild, 3: intense).
| Plot | Habitat Type | Ground Coverage (%) | Vegetation | Grazing | ||||||
|---|---|---|---|---|---|---|---|---|---|---|
| A (m) | H | W | St | G | So | Gh (cm) | F | I | ||
| A1a | Agricultural land (A) | 973 | 1 | 0 | 15 | 75 | 10 | 70 | 40 | 2 |
| A1b | 984 | 1 | 0 | 25 | 60 | 15 | 40 | 0 | 2 | |
| A2a | 1039 | 2 | 15 | 0 | 85 | 0 | 35 | 0 | 1 | |
| A2b | 1059 | 2 | 10 | 0 | 90 | 0 | 45 | 0 | 2 | |
| A3a | 1180 | 1 | 30 | 25 | 20 | 20 | 45 | 5 | 2 | |
| A3b | 1175 | 1 | 0 | 20 | 60 | 20 | 15 | 0 | 3 | |
| F1a | Beech–fir forest (F) | 1327 | 1 | 5 | 20 | 65 | 10 | 55 | 0 | 1 |
| F1b | 1324 | 1 | 0 | 10 | 90 | 0 | 50 | 0 | 1 | |
| F2a | 1314 | 1 | 15 | 20 | 50 | 15 | 35 | 0 | 1 | |
| F2b | 1307 | 2 | 50 | 25 | 15 | 10 | 30 | 0 | 1 | |
| F3a | 1139 | 2 | 0 | 0 | 90 | 10 | 15 | 0 | 2 | |
| F3b | 1146 | 2 | 5 | 5 | 85 | 5 | 25 | 25 | 2 | |
| G1a | Mountain grasslands (G) | 1272 | 1 | 20 | 10 | 70 | 0 | 15 | 0 | 2 |
| G1b | 1273 | 1 | 0 | 15 | 85 | 0 | 20 | 0 | 2 | |
| G2a | 1380 | 1 | 0 | 0 | 90 | 10 | 30 | 0 | 1 | |
| G2b | 1366 | 1 | 0 | 0 | 90 | 10 | 30 | 0 | 1 | |
| G3a | 1344 | 1 | 25 | 5 | 50 | 20 | 10 | 0 | 3 | |
| G3b | 1330 | 2 | 0 | 5 | 85 | 10 | 30 | 0 | 2 | |
| M1a | Mixed thermophilous forest (M) | 1071 | 2 | 45 | 15 | 40 | 0 | 30 | 20 | 1 |
| M1b | 1070 | 2 | 20 | 10 | 55 | 15 | 30 | 0 | 1 | |
| M2a | 1000 | 3 | 15 | 0 | 85 | 0 | 60 | 150 | 1 | |
| M2b | 1007 | 3 | 20 | 5 | 65 | 10 | 25 | 300 | 1 | |
| M3a | 1035 | 1 | 20 | 10 | 70 | 0 | 45 | 0 | 1 | |
| M3b | 1057 | 1 | 30 | 0 | 65 | 5 | 40 | 0 | 1 | |
| S1a | Mediterranean scrub (S) | 1178 | 1 | 20 | 30 | 40 | 10 | 30 | 0 | 2 |
| S1b | 1170 | 1 | 0 | 40 | 45 | 15 | 15 | 25 | 2 | |
| S2a | 934 | 1 | 15 | 40 | 25 | 20 | 30 | 0 | 2 | |
| S2b | 932 | 1 | 0 | 40 | 40 | 20 | 20 | 0 | 2 | |
| S3a | 896 | 2 | 0 | 10 | 75 | 15 | 20 | 15 | 1 | |
| S3b | 830 | 2 | 15 | 40 | 30 | 15 | 15 | 0 | 1 | |
Appendix C
Table A3.
Effects of environmental factors on the beta diversity (β) and its components (βgra and βbal) of Orthoptera communities on Mt Mitsikeli at the site (10,000 m2) and plot scales (100 m2).
Table A3.
Effects of environmental factors on the beta diversity (β) and its components (βgra and βbal) of Orthoptera communities on Mt Mitsikeli at the site (10,000 m2) and plot scales (100 m2).
| Site level (100 × 100 m) | |||||
| Bray–Curtis dissimilarity index (βbc) | df | S.S. | R2 | F | p |
| Tree cover (>2 m) | 1 | 1.01 | 0.13 | 4.31 | 0.002 |
| Woody vegetation cover | 1 | 0.23 | 0.03 | 0.98 | 0.477 |
| High shrub cover (0.5–2 m) | 1 | 0.34 | 0.04 | 1.44 | 0.158 |
| Low shrub cover (<0.5 m) | 1 | 0.28 | 0.04 | 1.07 | 0.366 |
| Abundance gradient (βbc.gra) | |||||
| Tree cover (>2 m) | 1 | 0.39 | 0.21 | 8.06 | 0.007 |
| Woody vegetation cover | 1 | 0.07 | 0.04 | 1.51 | 0.302 |
| Cover of tall shrubs (0.5–2 m) | 1 | 0.12 | 0.07 | 2.55 | 0.127 |
| Cover of short shrubs (<0.5 m) | 1 | 0.12 | 0.07 | 1.99 | 0.224 |
| Balanced variation in abundance (βbc.bal) | |||||
| Tree cover (>2 m) | 1 | 0.31 | 0.09 | 2.64 | 0.064 |
| Woody vegetation cover | 1 | −0.03 | −0.01 | −0.27 | 0.951 |
| High shrub cover (0.5–2 m) | 1 | 0.12 | 0.03 | 1.00 | 0.443 |
| Low shrub cover (<0.5 m) | 1 | 0.10 | 0.03 | 0.82 | 0.545 |
| Plot level (10 × 10 m) | |||||
| Bray–Curtis dissimilarity index (βbc) | df | S.S. | R2 | F | p |
| Woody vegetation cover | 1 | 0.39 | 0.05 | 1.75 | 0.083 |
| Rockiness | 1 | 0.34 | 0.04 | 1.54 | 0.130 |
| Grass/herb cover | 1 | 0.63 | 0.08 | 2.84 | 0.004 |
| Bare ground | 1 | 0.26 | 0.03 | 1.17 | 0.310 |
| Grass/herb height | 1 | 0.30 | 0.04 | 1.36 | 0.216 |
| Flower heads | 1 | 0.26 | 0.03 | 1.15 | 0.321 |
| Elevation | 1 | 0.56 | 0.07 | 2.49 | 0.013 |
| Abundance gradient (βbc.gra) | |||||
| Woody vegetation cover | 1 | 0.23 | 0.13 | 4.09 | 0.047 |
| Rockiness | 1 | −0.05 | −0.03 | −0.85 | 0.958 |
| Grass/herb cover | 1 | 0.06 | 0.03 | 1.06 | 0.366 |
| Bare ground | 1 | 0.20 | 0.11 | 3.56 | 0.075 |
| Grass/herb height | 1 | 0.08 | 0.05 | 1.50 | 0.295 |
| Flower heads | 1 | 0.09 | 0.05 | 1.53 | 0.269 |
| Elevation | 1 | −0.01 | −0.01 | −0.18 | 0.834 |
| Balanced variation in abundance (βbc.bal) | |||||
| Woody vegetation cover | 1 | 0.10 | 0.03 | 1.14 | 0.387 |
| Rockiness | 1 | 0.25 | 0.07 | 2.72 | 0.056 |
| Grass/herb cover | 1 | 0.31 | 0.09 | 3.38 | 0.037 |
| Bare ground | 1 | −0.02 | −0.01 | −0.27 | 0.958 |
| Grass/herb height | 1 | 0.07 | 0.02 | 0.73 | 0.567 |
| Flower heads | 1 | 0.09 | 0.03 | 1.01 | 0.394 |
| Elevation | 1 | 0.65 | 0.19 | 7.17 | 0.001 |
Df, degree of freedom; S.S., sum of squares; R2, value for each term; F, test statistic; p, statistical significance assessed via a permutation test.
References
- Fartmann, T.; Krämer, B.; Stelzner, F.; Poniatowski, D. Orthoptera as ecological indicators for succession in steppe grassland. Ecol. Indic. 2012, 20, 337–344. [Google Scholar] [CrossRef]
- Gandar, M. The dynamics and trophic ecology of grasshoppers (Acridoidea) in a South African savanna. Trophic ecology of grasshoppers in South African savanna. Oecologia 1982, 54, 370–378. [Google Scholar] [CrossRef] [PubMed]
- Ryszkowski, L.; Karg, J.; Margarit, G.; Paoletti, M.; Zlotin, R. Above-ground insect biomass in agricultural landscapes of Europe. Landsc. Ecol. Agroecosystems 1993, 71–82. [Google Scholar]
- Samways, M. Conservation biology of Orthoptera. Bionomics of Grasshoppers, Katydids, and Their Kin; CABI: Oxford, UK, 1997; pp. 481–496. [Google Scholar]
- Belovsky, G.E.; Slade, J. The role of vertebrate and invertebrate predators in a grasshopper community. Oikos 1993, 68, 193–201. [Google Scholar] [CrossRef]
- Parr, S.J.; Naveso, M.Á.; Yarar, M. Habitat and potential prey surrounding lesser kestrel Falco naumanni colonies in central Turkey. Biol. Conserv. 1997, 79, 309–312. [Google Scholar] [CrossRef]
- Curry, J.P. Grassland Invertebrates: Ecology, Influence on Soil Fertility and Effects on Plant Growth; Springer Science & Business Media: Cham, Switzerland, 1993; p. 446. [Google Scholar]
- Aleksanov, V.V.; Karmazina, I.O.; Ruchin, A.B.; Esin, M.N.; Lukiyanov, S.V.; Lobachev, E.A.; Artaev, O.N.; Ryzhov, M.K. Diversity and Biology of Terrestrial Orthopteroids (Insecta) in the Republic of Mordovia (Russia). Diversity 2023, 15, 803. [Google Scholar] [CrossRef]
- Báldi, A.; Kisbenedek, T. Orthopteran assemblages as indicators of grassland naturalness in Hungary. Agric. Ecosyst. Environ. 1997, 66, 121–129. [Google Scholar] [CrossRef]
- Kruess, A.; Tscharntke, T. Grazing intensity and the diversity of grasshoppers, butterflies, and trap-nesting bees and wasps. Conserv. Biol. 2002, 16, 1570–1580. [Google Scholar] [CrossRef]
- Marini, L.; Bommarco, R.; Fontana, P.; Battisti, A. Disentangling effects of habitat diversity and area on orthopteran species with contrasting mobility. Biol. Conserv. 2010, 143, 2164–2171. [Google Scholar] [CrossRef]
- Marini, L.; Fontana, P.; Battisti, A.; Gaston, K.J. Response of orthopteran diversity to abandonment of semi-natural meadows. Agric. Ecosyst. Environ. 2009, 132, 232–236. [Google Scholar] [CrossRef]
- Schirmel, J.; Mantilla-Contreras, J.; Blindow, I.; Fartmann, T. Impacts of succession and grass encroachment on heathland Orthoptera. J. Insect Conserv. 2011, 15, 633–642. [Google Scholar] [CrossRef]
- Gardiner, T.; Dover, J. Is microclimate important for Orthoptera in open landscapes? J. Insect Conserv. 2008, 12, 705–709. [Google Scholar] [CrossRef]
- Kati, V.; Dufrêne, M.; Legakis, A.; Grill, A.; Lebrun, P. Conservation management for Orthoptera in the Dadia reserve, Greece. Biol. Conserv. 2004, 115, 33–44. [Google Scholar] [CrossRef]
- Theuerkauf, J.; Rouys, S. Do Orthoptera need human land use in Central Europe? The role of habitat patch size and linear corridors in the Białowieża Forest, Poland. Biodivers. Conserv. 2006, 15, 1497–1508. [Google Scholar] [CrossRef]
- Bazelet, C.S.; Samways, M.J. Grasshopper assemblage response to conservation ecological networks in a timber plantation matrix. Agric. Ecosyst. Environ. 2011, 144, 124–129. [Google Scholar] [CrossRef]
- Bazelet, C.S.; Samways, M.J. Identifying grasshopper bioindicators for habitat quality assessment of ecological networks. Ecol. Indic. 2011, 11, 1259–1269. [Google Scholar] [CrossRef]
- Kovács-Hostyánszki, A.; Kőrösi, Á.; Orci, K.M.; Batáry, P.; Báldi, A. Set-aside promotes insect and plant diversity in a Central European country. Agric. Ecosyst. Environ. 2011, 141, 296–301. [Google Scholar] [CrossRef]
- Marini, L.; Fontana, P.; Scotton, M.; Klimek, S. Vascular plant and Orthoptera diversity in relation to grassland management and landscape composition in the European Alps. J. Appl. Ecol. 2008, 45, 361–370. [Google Scholar] [CrossRef]
- Steck, C.E.; Bürgi, M.; Bolliger, J.; Kienast, F.; Lehmann, A.; Gonseth, Y. Conservation of grasshopper diversity in a changing environment. Biol. Conserv. 2007, 138, 360–370. [Google Scholar] [CrossRef]
- Kenyeres, Z.; Rácz, I.A.; Varga, Z. Endemism hot spots, core areas and disjunctions in European Orthoptera. Acta Zoologica Cracoviensia-Series B: Invertebrata. 2009, 52, 189–211. [Google Scholar] [CrossRef]
- Hochkirch, A.; Nieto, A.; Criado, M. European Red List of Grasshoppers, Crickets and Bush-Crickets; Publications Office of the European Union: Luxembourg, 2016; p. 95. [Google Scholar]
- Kati, V.; Willemse, L. Database of Endemic and/or Threatened Orthoptera Species in the Natura 2000 Sites of Greece; V1; Mendeley Data: Amsterdam, The Netherlands, 2020. [Google Scholar] [CrossRef]
- Willemse, L.; Kleukers, R.; Odé, B. The Grasshoppers of Greece; EIS Kenniscentrum Insecten: Leiden, The Netherlands, 2018; p. 440. [Google Scholar]
- Kati, V.; Zografou, K.; Tzirkalli, E.; Chitos, T.; Willemse, L. Butterfly and grasshopper diversity patterns in humid Mediterranean grasslands: The roles of disturbance and environmental factors. J. Insect Conserv. 2012, 16, 807–818. [Google Scholar] [CrossRef]
- Zografou, K.; Sfenthourakis, S.; Pullin, A.; Kati, V. On the surrogate value of red-listed butterflies for butterflies and grasshoppers: A case study in Grammos site of Natura 2000, Greece. J. Insect Conserv. 2009, 13, 505–514. [Google Scholar] [CrossRef]
- Zografou, K.; Wilson, R.J.; Halley, J.M.; Tzirkalli, E.; Kati, V. How are arthopod communities structured and why are they so diverse? Answers from Mediterranean mountains using hierarchical additive partitioning. Biodivers. Conserv. 2017, 26, 1333–1351. [Google Scholar] [CrossRef]
- Legendre, P.; Borcard, D.; Peres-Neto, P.R. Analyzing beta diversity: Partitioning the spatial variation of community composition data. Ecol. Monogr. 2005, 75, 435–450. [Google Scholar] [CrossRef]
- Legendre, P.; De Cáceres, M. Beta diversity as the variance of community data: Dissimilarity coefficients and partitioning. Ecol. Lett. 2013, 16, 951–963. [Google Scholar] [CrossRef] [PubMed]
- Baselga, A. Partitioning the turnover and nestedness components of beta diversity. Glob. Ecol. Biogeogr. 2010, 19, 134–143. [Google Scholar] [CrossRef]
- Baselga, A. Partitioning abundance-based multiple-site dissimilarity into components: Balanced variation in abundance and abundance gradients. Methods Ecol. Evol. 2017, 8, 799–808. [Google Scholar] [CrossRef]
- Podani, J.; Schmera, D. A new conceptual and methodological framework for exploring and explaining pattern in presence—Absence data. Oikos 2011, 120, 1625–1638. [Google Scholar] [CrossRef]
- Baselga, A. The relationship between species replacement, dissimilarity derived from nestedness, and nestedness. Glob. Ecol. Biogeogr. 2012, 21, 1223–1232. [Google Scholar] [CrossRef]
- Pärtel, M.; Bennett, J.A.; Zobel, M. Macroecology of biodiversity: Disentangling local and regional effects. New Phytol. 2016, 211, 404–410. [Google Scholar] [CrossRef]
- Moreno, C.E.; Calderón-Patrón, J.M.; Arroyo-Rodríguez, V.; Barragán, F.; Escobar, F.; Gómez-Ortiz, Y.; Martín-Regalado, N.; Martínez-Falcón, A.P.; Martínez-Morales, M.Á.; Mendoza, E.; et al. Measuring biodiversity in the Anthropocene: A simple guide to helpful methods. Biodivers. Conserv. 2017, 26, 2993–2998. [Google Scholar] [CrossRef]
- Pitta, E.; Zografou, K.; Poursanidis, D.; Chatzaki, M. Effects of climate on spider beta diversity across different Mediterranean habitat types. Biodivers. Conserv. 2019, 28, 3971–3988. [Google Scholar] [CrossRef]
- Nekola, J.C.; White, P.S. The distance decay of similarity in biogeography and ecology. J. Biogeogr. 1999, 26, 867–878. [Google Scholar] [CrossRef]
- Grzywacz, B.; Heller, K.-G.; Chobanov, D.P.; Warchałowska-Śliwa, E. Conventional and molecular chromosome study in the European genus Parnassiana Zeuner, 1941 (Orthoptera, Tettigoniinae, Platycleidini). Folia Biol. 2017, 65, 1–8. [Google Scholar] [CrossRef]
- Pamperis, L.N. The Butterflies of Greece; Editions Pamperis; Hellenic Society for the Protection of Nature: Athens, Greece, 2009; p. 766. [Google Scholar]
- Pamperis, L. The Butterflies of Greece; An update of distribution maps, plates and diagrams 3.3, in Map 3.4, in Chart 4.15, and in Chart 4.16. Editions Pamperis; Hellenic Society for the Protection of Nature: Athens, Greece, 2022. [Google Scholar]
- Guido, M.; Gianelle, D. Distribution patterns of four Orthoptera species in relation to microhabitat heterogeneity in an ecotonal area. Acta Oecologica 2001, 22, 175–185. [Google Scholar] [CrossRef]
- Malfatti, E.; Ferreira, P.M.A.; Utz, L.R.P. Eukaryotic Communities in Bromeliad Phytotelmata: How Do They Respond to Altitudinal Differences? Diversity 2020, 12, 326. [Google Scholar] [CrossRef]
- Gerasimidis, A.; Korakis, G. Contribution to the study of the flora of Mount Mitsikeli, NW Greece. Fl Medit 2009, 19, 161–184. [Google Scholar]
- NOA. National Observatory of Athens. Available online: https://www.meteo.gr/index.cfm (accessed on 20 November 2023).
- Soulis, N. The Climate of Ipiros (In Greek). Ioannina. Greece. 1994, 216. [Google Scholar]
- Sarika, M.; Christopoulou, A.; Zikos, A.; Kazanis, D.; Bazos, I. Plant communities and habitat types in the protected area of Lake Pamvotis (Epirus, Northwestern Greece). Mediterr. Bot. 2020, 41, 129–148. [Google Scholar] [CrossRef]
- Mountrakis, D. The Geology of Greece; University Press Studio: Thessaloniki, Greece, 1985; p. 208. (In Greek) [Google Scholar]
- EIONET. Report on Progress and Implementation (Article 17-Habitats Directive). 2019. Available online: https://cdr.eionet.europa.eu/gr/eu/art17/envxrm90g/ (accessed on 20 November 2023).
- Petridou, M.; Benson, J.F.; Gimenez, O.; Kati, V. Spatiotemporal Patterns of Wolves, and Sympatric Predators and Prey Relative to Human Disturbance in Northwestern Greece. Diversity 2023, 15, 184. [Google Scholar] [CrossRef]
- Willemse, F. Fauna Graeciae Ⅰ: Catalogue of the Orthoptera of Greece. Hellenic Zoological Society. 1984, 275. [Google Scholar]
- Turker, A.U.; Gurel, E. Common mullein (Verbascum thapsus L.): Recent advances in research. Phytother. Res. 2005, 19, 733–739. [Google Scholar] [CrossRef] [PubMed]
- Magurran, A.E. Measuring Biological Diversity; Wiley: Hoboken, NJ, USA, 2013. [Google Scholar]
- Hammer, Ø.; Harper, D.A.; Ryan, P.D. PAST: Paleontological statistics software package for education and data analysis. Palaeontol. Electron. 2001, 4, 9. [Google Scholar]
- Ter Braak, C.; Šmilauer, P. Canoco 5: Software for Multivariate Data Exploration, Testing and Summarization; (Version 5.0); Microcomputer Power: Ithaca, NY, USA, 2012. [Google Scholar]
- Baselga, A. Separating the two components of abundance-based dissimilarity: Balanced changes in abundance vs. abundance gradients. Methods Ecol. Evol. 2013, 4, 552–557. [Google Scholar] [CrossRef]
- Keil, P.; Schweiger, O.; Kühn, I.; Kunin, W.E.; Kuussaari, M.; Settele, J.; Henle, K.; Brotons, L.; Pe’er, G.; Lengyel, S. Patterns of beta diversity in Europe: The role of climate, land cover and distance across scales. J. Biogeogr. 2012, 39, 1473–1486. [Google Scholar] [CrossRef]
- Dinno, A. dunn.test: Dunn’s Test of Multiple Comparisons Using Rank Sums. R Package Version 1.3.5. 2017. Available online: https://CRAN.R-project.org/package=dunn.test (accessed on 15 March 2022).
- Oksanen, J.; Simpson, G.; Blanchet, F.; Kindt, R.; Legendre, P.; Minchin, P.; O’Hara, R.; Solymos, P.; Stevens, M.; Szoecs, E.; et al. Vegan: Community Ecology Package, R Package Version 2.6-4. 2022. Available online: https://CRAN.R-project.org/package=vegan (accessed on 15 March 2022).
- Borg, I.; Groenen, P. Modern Multidimensional Scaling. Theory and Applications; Springer: Cham, Switzerland, 1997. [Google Scholar]
- Gómez-Rodríguez, C.; Baselga, A. Variation among European beetle taxa in patterns of distance decay of similarity suggests a major role of dispersal processes. Ecography 2018, 41, 1825–1834. [Google Scholar] [CrossRef]
- Kati, V.; Poirazidis, K.; Dufrêne, M.; Halley, J.M.; Korakis, G.; Schindler, S.; Dimopoulos, P. Towards the use of ecological heterogeneity to design reserve networks: A case study from Dadia National Park, Greece. Biodivers. Conserv. 2010, 19, 1585–1597. [Google Scholar] [CrossRef]
- Tzirkalli, E.; Kadis, C.; Halley, J.M.; Vogiatzakis, I.; Wilson, R.J.; Zografou, K.; Antoniou, A.; Tsintides, T.; Makris, C.; Kati, V. Conservation ecology of butterflies on Cyprus in the context of Natura 2000. Biodivers. Conserv. 2019, 28, 1759–1782. [Google Scholar] [CrossRef]
- Neilly, H.; Jones, H.; Schwarzkopf, L. Ants drive invertebrate community response to cattle grazing. Agric. Ecosyst. Environ. 2020, 290, 106742. [Google Scholar] [CrossRef]
- Schaffers, A.P.; Raemakers, I.P.; Sýkora, K.V.; ter Braak, C.J.F. Arthropod Assemblages are Best Predicted by Plant Species Composition. Ecology 2008, 89, 782–794. [Google Scholar] [CrossRef] [PubMed]
- Willemse, L.; Tilmans, J.; Kotitsa, N.; Trichas, A.; Heller, K.G.; Chobanov, D.; Odé, B. A review of Eupholidoptera (Orthoptera, Tettigoniidae) from Crete, Gavdos, Gavdopoula, and Andikithira. ZooKeys 2023, 1151, 67–158. [Google Scholar] [CrossRef] [PubMed]
- Gardiner, T.; Pye, M.; Field, R.; Hill, J. The Influence of Sward Height and Vegetation Composition in Determining the Habitat Preferences of Three Chorthippus Species (Orthoptera: Acrididae) in Chelmsford, Essex, UK. J. Orthoptera Res. 2002, 11, 207–213. [Google Scholar] [CrossRef]
- Theron, K.J.; Pryke, J.S.; Samways, M.J. Identifying managerial legacies within conservation corridors using remote sensing and grasshoppers as bioindicators. Ecol. Appl. 2022, 32, e02496. [Google Scholar] [CrossRef] [PubMed]
- Clark, E.J. Studies in the Ecology of British Grasshoppers. Trans. R. Entomol. Soc. Lond. 1948, 99, 173–222. [Google Scholar] [CrossRef]
- Wingerden, W.v.; Kreveld, A.v.; Bongers, W. Analysis of species composition and abundance of grasshoppers (Orth., Acrididae) in natural and fertilized grasslands. J. Appl. Entomol. 1992, 113, 138–152. [Google Scholar] [CrossRef]
- Humbert, J.-Y.; Delley, S.; Arlettaz, R. Grassland intensification dramatically impacts grasshoppers: Experimental evidence for direct and indirect effects of fertilisation and irrigation. Agric. Ecosyst. Environ. 2021, 314, 107412. [Google Scholar] [CrossRef]
- Gardiner, T.; Hassall, M. Does microclimate affect grasshopper populations after cutting of hay in improved grassland? J. Insect Conserv. 2009, 13, 97–102. [Google Scholar] [CrossRef]
- Palmer, M.W. Species-area curves and the geometry of nature. In Scaling Biodiversity, Ecological Reviews; Cambridge University Press: Cambridge, UK, 2007; pp. 15–31. [Google Scholar] [CrossRef]
- Ibanez, S.; Bison, M.; Lavorel, S.; Moretti, M. Herbivore species identity mediates interspecific competition between plants. Community Ecol. 2013, 14, 41–47. [Google Scholar] [CrossRef]
- Ritchie, J.M. Biology of grasshoppers. In Bulletin of Entomological Research; Chapman, R.F., Joern, A., Eds.; Cambridge University Press: Cambridge, UK, 1991; Volume 81, pp. 221–222. [Google Scholar] [CrossRef]
- Cardoso, P.; Barton, P.S.; Birkhofer, K.; Chichorro, F.; Deacon, C.; Fartmann, T.; Fukushima, C.S.; Gaigher, R.; Habel, J.C.; Hallmann, C.A.; et al. Scientists’ warning to humanity on insect extinctions. Biol. Conserv. 2020, 242, 108426. [Google Scholar] [CrossRef]
- Chase, J.M.; Leibold, M.A. Ecological Niches: Linking Classical and Contemporary Approaches; University of Chicago Press: Chicago, Ilinois, USA, 2009. [Google Scholar]
- Cottenie, K. Integrating environmental and spatial processes in ecological community dynamics. Ecol. Lett. 2005, 8, 1175–1182. [Google Scholar] [CrossRef] [PubMed]
- Gardiner, T. Grazing and Orthoptera: A review. J. Orthoptera Res. 2018, 27, 3–11. [Google Scholar] [CrossRef]
- Bascompte, J.; Rodríguez, M.Á. Habitat patchiness and plant species richness. Ecol. Lett. 2001, 4, 417–420. [Google Scholar] [CrossRef]
- Fartmann, T.; Behrens, M.; Loritz, H. Orthopteran communities in the conifer-broadleaved woodland zone of the Russian Far East. Eur. J. Entomol. 2008, 105, 673–680. [Google Scholar] [CrossRef]
- Jauregui, B.M.; Rosa-Garcia, R.; Garcia, U.; WallisDeVries, M.F.; Osoro, K.; Celaya, R. Effects of stocking density and breed of goats on vegetation and grasshopper occurrence in heathlands. Agric. Ecosyst. Environ. 2008, 123, 219–224. [Google Scholar] [CrossRef]
- Bazelet, C.S.; Gardiner, T. Orthoptera response to grazing: An introduction to the special issue. J. Orthoptera Res. 2018, 27. [Google Scholar] [CrossRef][Green Version]
- Zografou, K.; Adamidis, G.C.; Grill, A.; Kati, V.; Wilson, R.J.; Halley, J.M. Who flies first?—Habitat-specific phenological shifts of butterflies and orthopterans in the light of climate change: A case study from the south-east Mediterranean. Ecol. Entomol. 2015, 40, 562–574. [Google Scholar] [CrossRef]
- Anthelme, F.; Grossi, J.-L.; Brun, J.-J.; Didier, L. Consequences of green alder expansion on vegetation changes and arthropod communities removal in the northern French Alps. For. Ecol. Manag. 2001, 145, 57–65. [Google Scholar] [CrossRef]
- Dennis, P.; Young, M.; Gordon, I. Distribution and abundance of small insects and arachnids in relation to structural heterogeneity of grazed, indigenous grasslands. Ecol. Entomol. 1998, 23, 253–264. [Google Scholar] [CrossRef]
- Condit, R.; Pitman, N.; Leigh, E.G.; Chave, J.; Terborgh, J.; Foster, R.B.; Núñez, P.; Aguilar, S.; Valencia, R.; Villa, G.; et al. Beta-Diversity in Tropical Forest Trees. Science 2002, 295, 666–669. [Google Scholar] [CrossRef]
- Hubbell, S.P. A Unified Theory of Biodiversity and Biogeography; Princeton University Press: Princeton, NJ, USA, 2001. [Google Scholar]
- SDF. Natura 2000-Standard Data Form. GR2130008 Oros Mitsikeli. Available online: https://natura2000.eea.europa.eu/natura2000/SDF.aspx?site=GR2130008 (accessed on 1 December 2023).
- Slancarova, J.; Bartonova, A.; Zapletal, M.; Kotilinek, M.; Faltynek Fric, Z.; Micevski, N.; Kati, V.; Konvicka, M. Life History Traits Reflect Changes in Mediterranean Butterfly Communities Due to Forest Encroachment. PLoS ONE 2016, 11, e0152026. [Google Scholar] [CrossRef] [PubMed]
- Zakkak, S.; Chatzaki, M.; Karamalis, N.; Kati, V. Spiders in the context of agricultural land abandonment in Greek Mountains: Species responses, community structure and the need to preserve traditional agricultural landscapes. J. Insect Conserv. 2014, 18, 599–611. [Google Scholar] [CrossRef]
- Zakkak, S.; Kakalis, E.; Radović, A.; Halley, J.M.; Kati, V. The impact of forest encroachment after agricultural land abandonment on passerine bird communities: The case of Greece. J. Nat. Conserv. 2014, 22, 157–165. [Google Scholar] [CrossRef]
- Zakkak, S.; Radovic, A.; Panitsa, M.; Vassilev, K.; Shuka, L.; Kuttner, M.; Schindler, S.; Kati, V. Vegetation patterns along agricultural land abandonment in the Balkans. J. Veg. Sci. 2018, 29, 877–886. [Google Scholar] [CrossRef]
Disclaimer/Publisher’s Note: The statements, opinions and data contained in all publications are solely those of the individual author(s) and contributor(s) and not of MDPI and/or the editor(s). MDPI and/or the editor(s) disclaim responsibility for any injury to people or property resulting from any ideas, methods, instructions or products referred to in the content. |
© 2023 by the authors. Licensee MDPI, Basel, Switzerland. This article is an open access article distributed under the terms and conditions of the Creative Commons Attribution (CC BY) license (https://creativecommons.org/licenses/by/4.0/).