Article

Timing of Ice Retreat Determines Summer State of Zooplankton Community in the Ob Estuary (the Kara Sea, Siberian Arctic)

Shirshov Institute of Oceanology, Russian Academy of Sciences, 36, Nakhimovskiy Prospect, Moscow 117887, Russia
*
Author to whom correspondence should be addressed.
Diversity 2023, 15(5), 674; https://doi.org/10.3390/d15050674
Submission received: 13 April 2023 / Revised: 11 May 2023 / Accepted: 13 May 2023 / Published: 16 May 2023
(This article belongs to the Special Issue Estuaries Ecology and Coastal Marine Waters)

Abstract

:
In the estuaries of large Siberian rivers, ice coverage and the timing of ice retreat have varied in recent decades under the ongoing climate change. The seasonal development and functioning of the mesozooplankton community depend to a great extent on the timing of ice retreat. In the Arctic estuaries, the response of zooplankton to the timing of ice melt remains unclear. An earlier ice retreat was suggested to result in an advanced seasonal development of zooplankton, and higher biomass and feeding rates. Zooplankton composition, biomass, demography and grazing (assessed with the gut fluorescent approach) were studied in the Ob Estuary in July 2019 (“typical” ice retreat time). The obtained results were compared with the published data for July 2016 (ice retreat three weeks earlier). Zooplankton biomass in 2019 was considerably lower than in 2016, while species composition was similar; dominant populations were at an earlier stage of development. Herbivorous feeding of the dominant copepod, Limnocalanus macrurus, was also lower in 2019. The consequences of an earlier ice melt and increased temperature on seasonal population dynamics of the dominant brackish-water species are discussed. Our findings demonstrate that zooplankton communities in the Arctic estuaries are highly sensitive to the environmental changes associated with early sea-ice reduction.

1. Introduction

The Arctic Ocean receives ∼11% of global river discharge while accounting for only ∼1% of global ocean volume [1]. As a result, estuarine salinity gradients are a defining feature throughout the Arctic Ocean. The river discharge creates an extremely variable environment for pelagic communities in terms of salinity, temperature, turbidity, and nutrients. An elevated supply of nutrients with the river outflow could increase the resource for primary production in the ice-free season. A spatio-temporally resolved biogeochemical model estimated that river input of carbon and nutrients to the Arctic Ocean fuels 28–51% of the current annual Arctic Ocean net primary production [2]. Intensive transformation and sedimentation of the suspended matter from the riverine runoff occur in estuarine frontal zones described as a marginal filter by [3]. In the processes of transformation, an essential role belongs to mesozooplankton, which passes energy from primary producers to higher trophic levels and modifies sedimentation processes, either enhancing retention in the upper water layer, or increasing sedimentation rates [4,5,6]. Dense local aggregations of zooplankton with an extremely high biomass of 3.1 to 4.3 g wet weight m−3 in the water column and maximum of 20.6 g wet weight m−3 in the near-bottom layer were found in the areas of the most pronounced salinity gradients [4,5]. Such dense aggregations determine the high efficiency of the so-called “pelagic biofilter” [5], where a considerable part of the organic matter discharged by the river is utilized. Zooplankton grazed up to 26% of the phytoplankton biomass within the pelagic biofilter area [6], while in the nearby regions, they consumed only 1 to 7% [7,8]. Pelagic communities inhabiting estuarine zones face a patchwork of environmental conditions which are spatially and temporary variable. Variability of the estuarine environment could be further increased by the ongoing climate change, which is most pronounced in the Arctic [9].
Under the global warming condition, a large reduction of ice cover in the Arctic is an issue of high importance. Earlier ice retreat, delayed freeze up, and warmer air temperatures observed in nearly all Arctic sectors [10] substantially affect local pelagic communities. In the marine ecosystems, the impacts of the early sea-ice retreat were reported for different trophic levels, including the seasonal development and functioning of the mesozooplankton community [11,12,13]. In the Arctic estuaries, however, the response of the zooplankton community to the timing of the ice melt remains unclear because of the scarcity of information on zooplankton at the spring-summer season when the plankton reaction to environmental changes is expected to be most pronounced.
One of the largest river estuaries in the World Ocean is the Gulf of Ob, located in the southern part of the Kara Sea. Its area is about 41,000 km2, and the Ob runoff accounts for about 15% of the total freshwater input to the Arctic Ocean [14] and 1.5% of the total freshwater runoff to the World Ocean [15]. Most of the studies on zooplankton distribution and grazing in the Ob Estuary were performed at the end of the productive season (end of August–September) [4,5,7,16,17], long after ice breakup. To our knowledge, only one study was carried out in July 2016, at the beginning of the productive season in this region [11]. This year was among the warmest in the Arctic in the past forty years and was characterized by rapid seasonal ice retreat [18]. High zooplankton biomass, high herbivorous daily rations of the dominant species, and advanced development of mass populations were then found [11]. What is the impact of the timing of ice retreat on the structure and functioning of the pelagic community in the Ob Estuary? To answer this question, we studied zooplankton species’ composition and distribution, the demography of the dominant species, and feeding and respiration rates along a transect from the inside of the Ob Estuary to the edge of the plume-affected shelf area in July 2019, the year which could be considered as “typical” of the recent thirty years [18] in respect to temperature and ice cover in the Kara Sea [19]. Comparison of the two situations, “typical” and early timing of the ice melt, would enable us to assess the effects of the timing of ice melt on the estuarine zooplankton community. We expect that later ice retreat results in a delay of zooplankton seasonal development, and lower biomass and feeding rates compared with earlier ice reduction.
To address this suggestion, we compared the results obtained on species composition, distribution, demography, and feeding rates of the dominant species in July 2019 with the published data for the same season of 2016.
Bearing in mind the ongoing climate change in the Arctic, knowledge on how the zooplankton community responds to an earlier start of the ice-free period will contribute to meaningful predictions for Arctic ecosystems.

2. Materials and Methods

2.1. Sampling

The material was collected during the cruise #76 of the R/V “Akademik Mstislav Keldysh” to the Kara Sea on 14–18 July 2019. The study region covered the Ob Estuary and the adjacent shelf area, and ten stations were sampled along a quasi-meridional transect from 72° N to 75.2° N (Figure 1). Two of the stations, 6241 and 6242, were sampled twice, with 3–4 days interval, to follow small-scale temporal changes in mesozooplankton abundance. At all stations, temperature, salinity, and turbidity were measured using vertical casts of a CTD probe (Sea-Bird Electronics SBE-32).
Zooplankton was sampled using a Juday closing net (0.1-m2 mouth area, 180-μm mesh size) towed vertically from 3–5 m above the bottom to the surface at the shallow stations without stratification. At the deeper stations where the water column was stratified, the layers below and above the pycnocline, which was determined according to the CTD profiles, were usually sampled. Additionally, the pycnocline layer was separately sampled at stations #6256, 6242, 6242_2 (Table 1).

2.2. Zooplankton Abundance and Biomass

For the determination of zooplankton abundance and biomass, samples were immediately preserved in 4% borax-buffered formalin. Zooplankton were identified and counted in the laboratory. Dominant copepod species were identified to the copepodite stage. Less numerous large specimens (the older stages of Calanus spp., Oikopleura vanhoeffeni, Limacina helicina, Parasagitta elegans) were counted in the whole samples, while more numerous forms were counted in subsamples; not less than 50 specimens were recorded. Large gelatinous organisms medusa and ctenophores were not taken into account. The copepodites of the closely related copepod species Calanus finmarchicus and C. glacialis were distinguished according to prosome lengths [20]. For Calanus spp., all copepodite stages were distinguished; for Pseudocalanus spp. and Drepanopus bungei, copepodite stages CI to CIV were pooled. The wet weight (WW) of each species was calculated using nomograms by [21]. The tables by [21] allow the calculation of the biovolume/wet weight of aquatic organisms on the basis of body shape and length. Dry weight (DW) of crustacean plankton was estimated as 0.16 WW [22]; DW of chaetognaths was calculated according to [23]; larvaceans obtained in tropical regions were calculated according to [24]. Since the length-weight relationship determined for various Oikopleura species was consistent with other relationships in this family in different regions [24], we consider this estimation to be appropriate for the Arctic regions as well.
To assess the development of dominant copepods populations, a mean developmental stage index (DSI) was calculated as abundance weighted average:
D S I = i n i n i
where i is copepodite stage number from 1 to 6, ni is abundance of stage i, and summations are for i from 1 to 6 [25].

2.3. Feeding

Feeding rates of the dominant species (Limnocalanus macrurus, Senecella siberica, Drepanopus bungei, Jaschnovia tolli, Pseudocalanus spp., Calanus glacialis) were assessed with the gut fluorescence method [26]. There is no general agreement as to how pronounced pigment degradation could be during the passage of phytoplankton through the gut, with values ranging from 0 to 95% [27]. However, a direct comparison of different methods (including gut fluorescence) to estimate feeding rates gave similar results [28,29,30]; see also [27]. This suggests that high plant pigment degradation rates are not the rule. Therefore, the gut fluorescence method continues to be a highly valuable tool for studies of zooplankton feeding, e.g., [31,32,33], and is still the only method that provides information on the in situ feeding rates and feeding impact of herbivorous zooplankton on phytoplankton assemblage.
Zooplankton for gut fluorescence analysis was sampled from the layers above and below the pycnocline, as described above. The content of the cod-end was diluted with filtered seawater in a one liter plastic bucket, and zooplankters were immediately anesthetized with carbonated seawater and sorted under a dissecting microscope for subsequent fluorescence analysis on board. To measure gut pigment content, 2 to 25 animals per replicate, depending on size/stage, were picked with forceps and placed in test tubes with 3 mL of 90% acetone. Two to five replicates, if possible, for each species/stage were analyzed. Pigments were extracted for 24 h at 5 °C in the dark. Chlorophyll and phaeopigments were measured by a standard fluorometric procedure [34] with a Turner Design Trilogy fluorometer. Gut content of the animals (G) in units of chlorophyll a equiv. ind−1 was calculated as G = (Chl a + 1.51 × phaeopigment) [35]. The amount of pigment ingested daily (I, ng Chl a ind−1 day−1) was estimated as:
I = G ∗ 24/GPT,
where GPT is the gut passage time (h). We used the gut passage values obtained in our previous studies [36]. All the data on GPT were adjusted to the temperature of the habitat where the animals were collected with the Q10 = 2.2 [37]. To assess ingestion rates of zooplankton in carbon units, we calculated the phytoplankton carbon (C, mg m−3) to Chl a (mg m−3) ratio in the two distinguished zones: 32.8 ± 19.9 (n = 9) in the inner part of the estuary and 25.9 ± 18.9 (n = 12) in the outer part and adjacent shelf. Phytoplankton biomass and Chl a concentration were assessed from the same samples. The data on phytoplankton biomass in carbon units calculated according to [38] were provided by [39]. Irradiance at the surface measured with Li-Cor and Chl a assessed fluorometrically were provided by [40].

2.4. Respiration

To clarify if herbivorous feeding provided for the basic metabolic demands of the dominant zooplankton species, their oxygen consumption rates were measured in onboard respiration experiments. The freshly collected specimens were sorted and kept in the GF/F filtered seawater at the environmental temperature (2 °C and 6 °C) for 24–36 h before the beginning of each trial. During acclimation, copepods were deprived of food to allow for gut clearance. Then 3 to 20 specimens depending on body size were washed with filtered seawater and placed in 24.5 mL glass respirometers with optode sensor spots (SP-PSt3-NAU-D5-YOP; PreSens GmbH, Germany) glued to the inside wall of the vials. Respirometers were filled with water of the same temperature. For every species/stage, 3–4 replicates and 3 controls (vials without animals) were performed. The vials were incubated at the same temperature at which copepods were acclimated in a temperature chamber. Oxygen concentration was measured with a Fiber-optic oxygen transmitter (Fibox 3 PreSens Precision sensing GmbH Regensburg, Germany) at 6 h intervals over a period of 24–28 h. Only the section of the slope with a linear decrease of O2 concentration was included in the estimation of oxygen consumption. We did not allow oxygen to fall below 70% of initial concentration to avoid respiration stress. The respiration rates (R, μL O2 ind−1 d−1) were calculated as:
R = ( B 1 B 2 ) V 24 t N
where B1 and B2—initial and final oxygen concentrations (mL O2 l−1), V—volume of the vial (mL), t—duration of an experiment (h), N—number of animals. Oxygen consumption rate was converted to carbon units assuming respiration quotientof 0.8 [41].
After the trials, experimental animals were blotted free of external seawater with tissue paper and placed into foil cuvettes for determination of the organic carbon content with a Shimadzu NOC-VCPH carbon analyzer.

2.5. Grazing Impact

The grazing impact of each of the dominant species for integrated (0-bottom) Chl a content (EChl, mg Chl a m−2) was estimated using the individual ingestion rates (Ii, ng Chl a ind−1 d−1) and the abundance of the given species (Ni, ind m−2) in each layer:
E C h = i = 1 n I i N i ,
where i is the layer number, n is the total number of layers.

2.6. Statistical Analyses

To reveal similarities among different stations, a multivariate cluster analysis was performed on a data matrix of the most abundant and frequent species, integrated for the whole water column (ind. m−2). The analyses were based on Bray-Curtis similarities of log (x + 1) transformed data using PRIMER v.5 package [42].
Vertical distribution of the dominant zooplankton species was analyzed in relation to temperature, salinity, turbidity and Chl a concentration using Canonical correspondence analysis (CCA). The dependent variable was the abundance of the dominant species in the sampled vertical layers; independent variables were the mean values of salinity, temperature, turbidity and Chl a concentration.
The Mann-Whitney U-test was used for comparison of DSI between the two zones, feeding activity at day and night, and between the different depths.

3. Results

3.1. Study Area: Sea-Ice, Hydrography, Chlorophyll

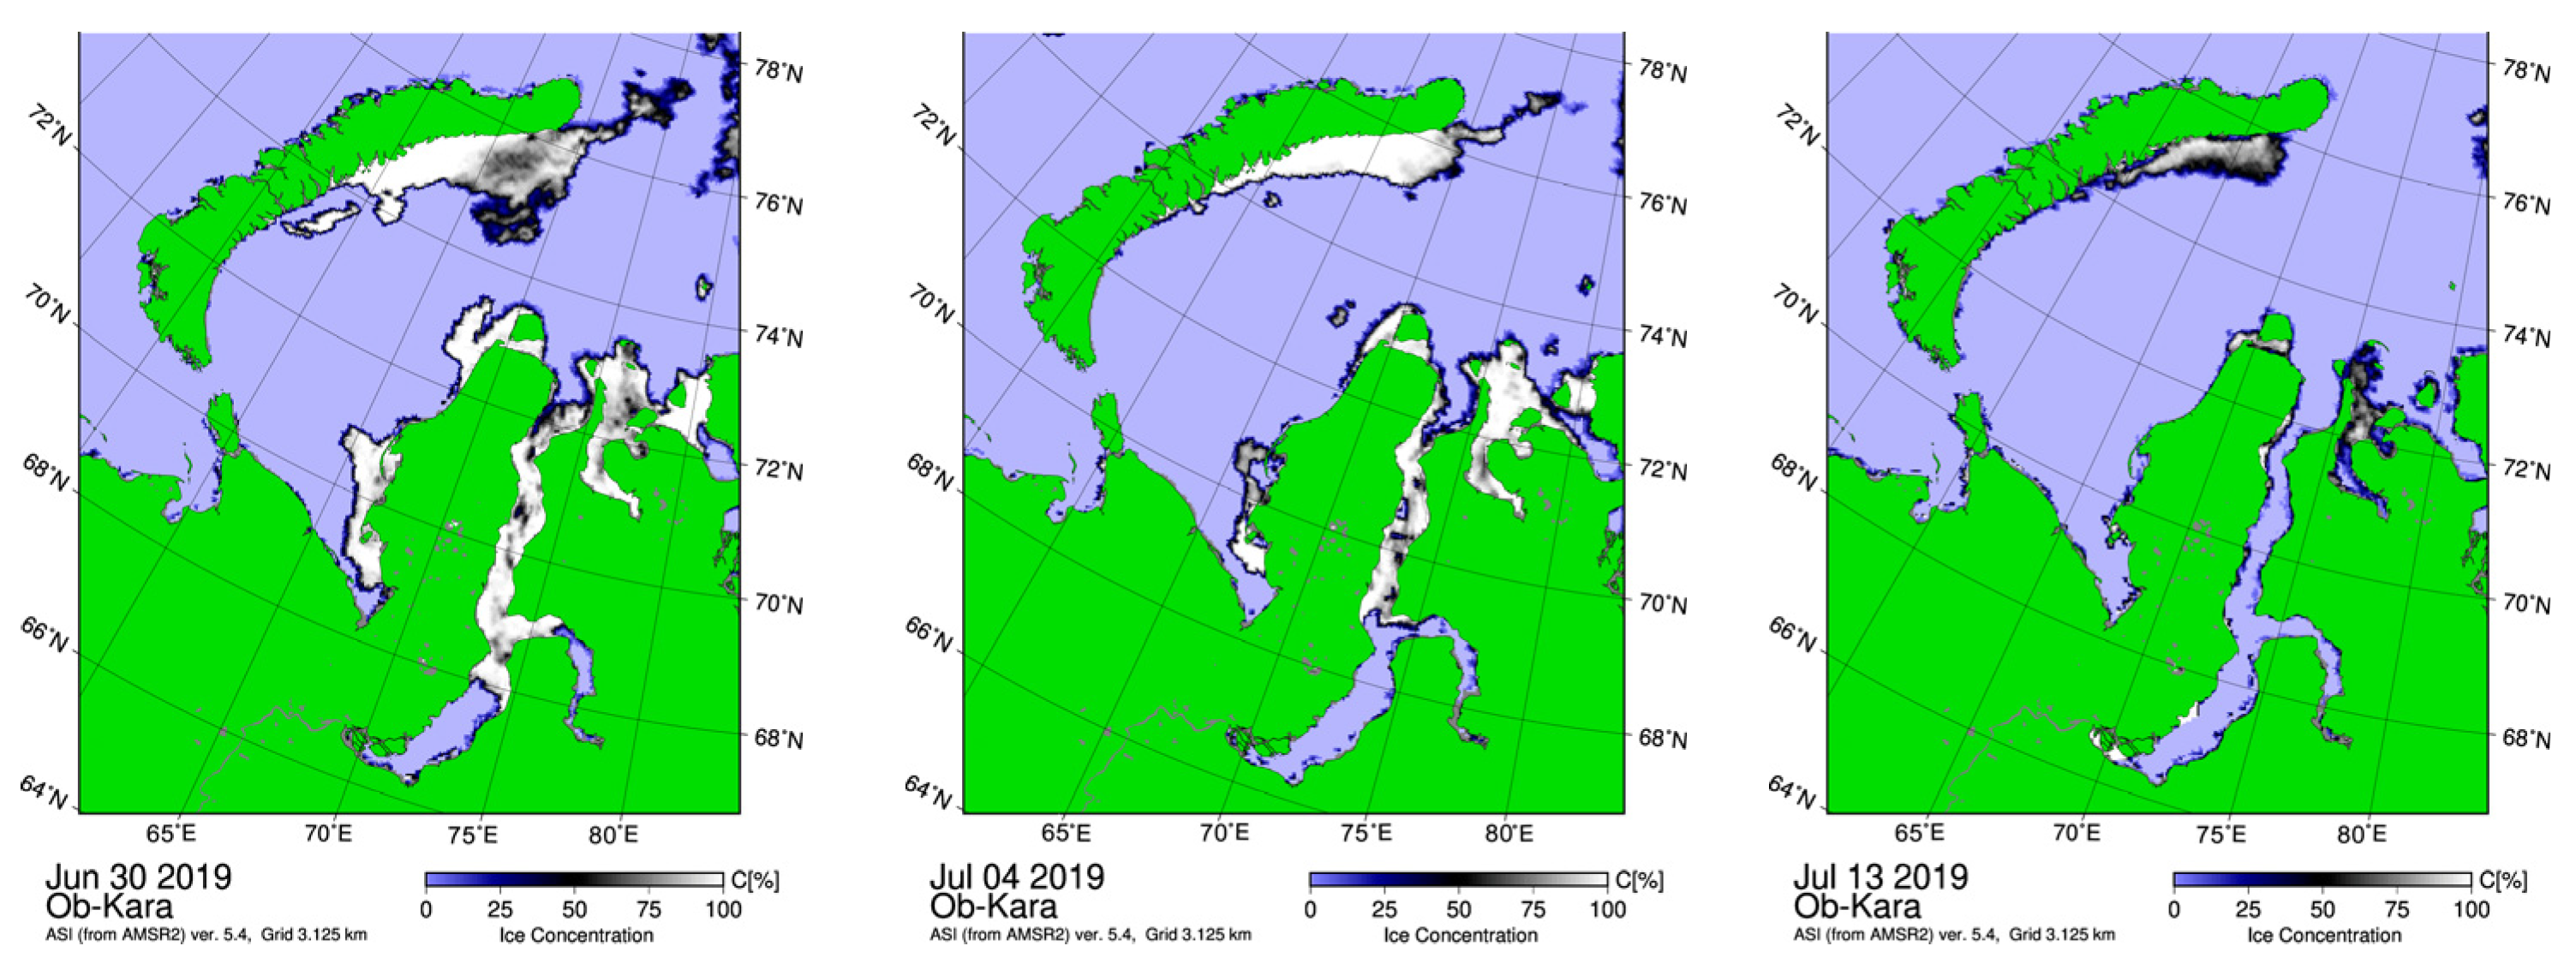
Here, we present the features of the physical environment which are most important for zooplankton. Analysis of satellite data showed that the ice melting in the Ob Estuary started from the northern seaward side in June 2019, and the estuary became completely free of ice by 13 July (Figure 2), only a few days before sampling.
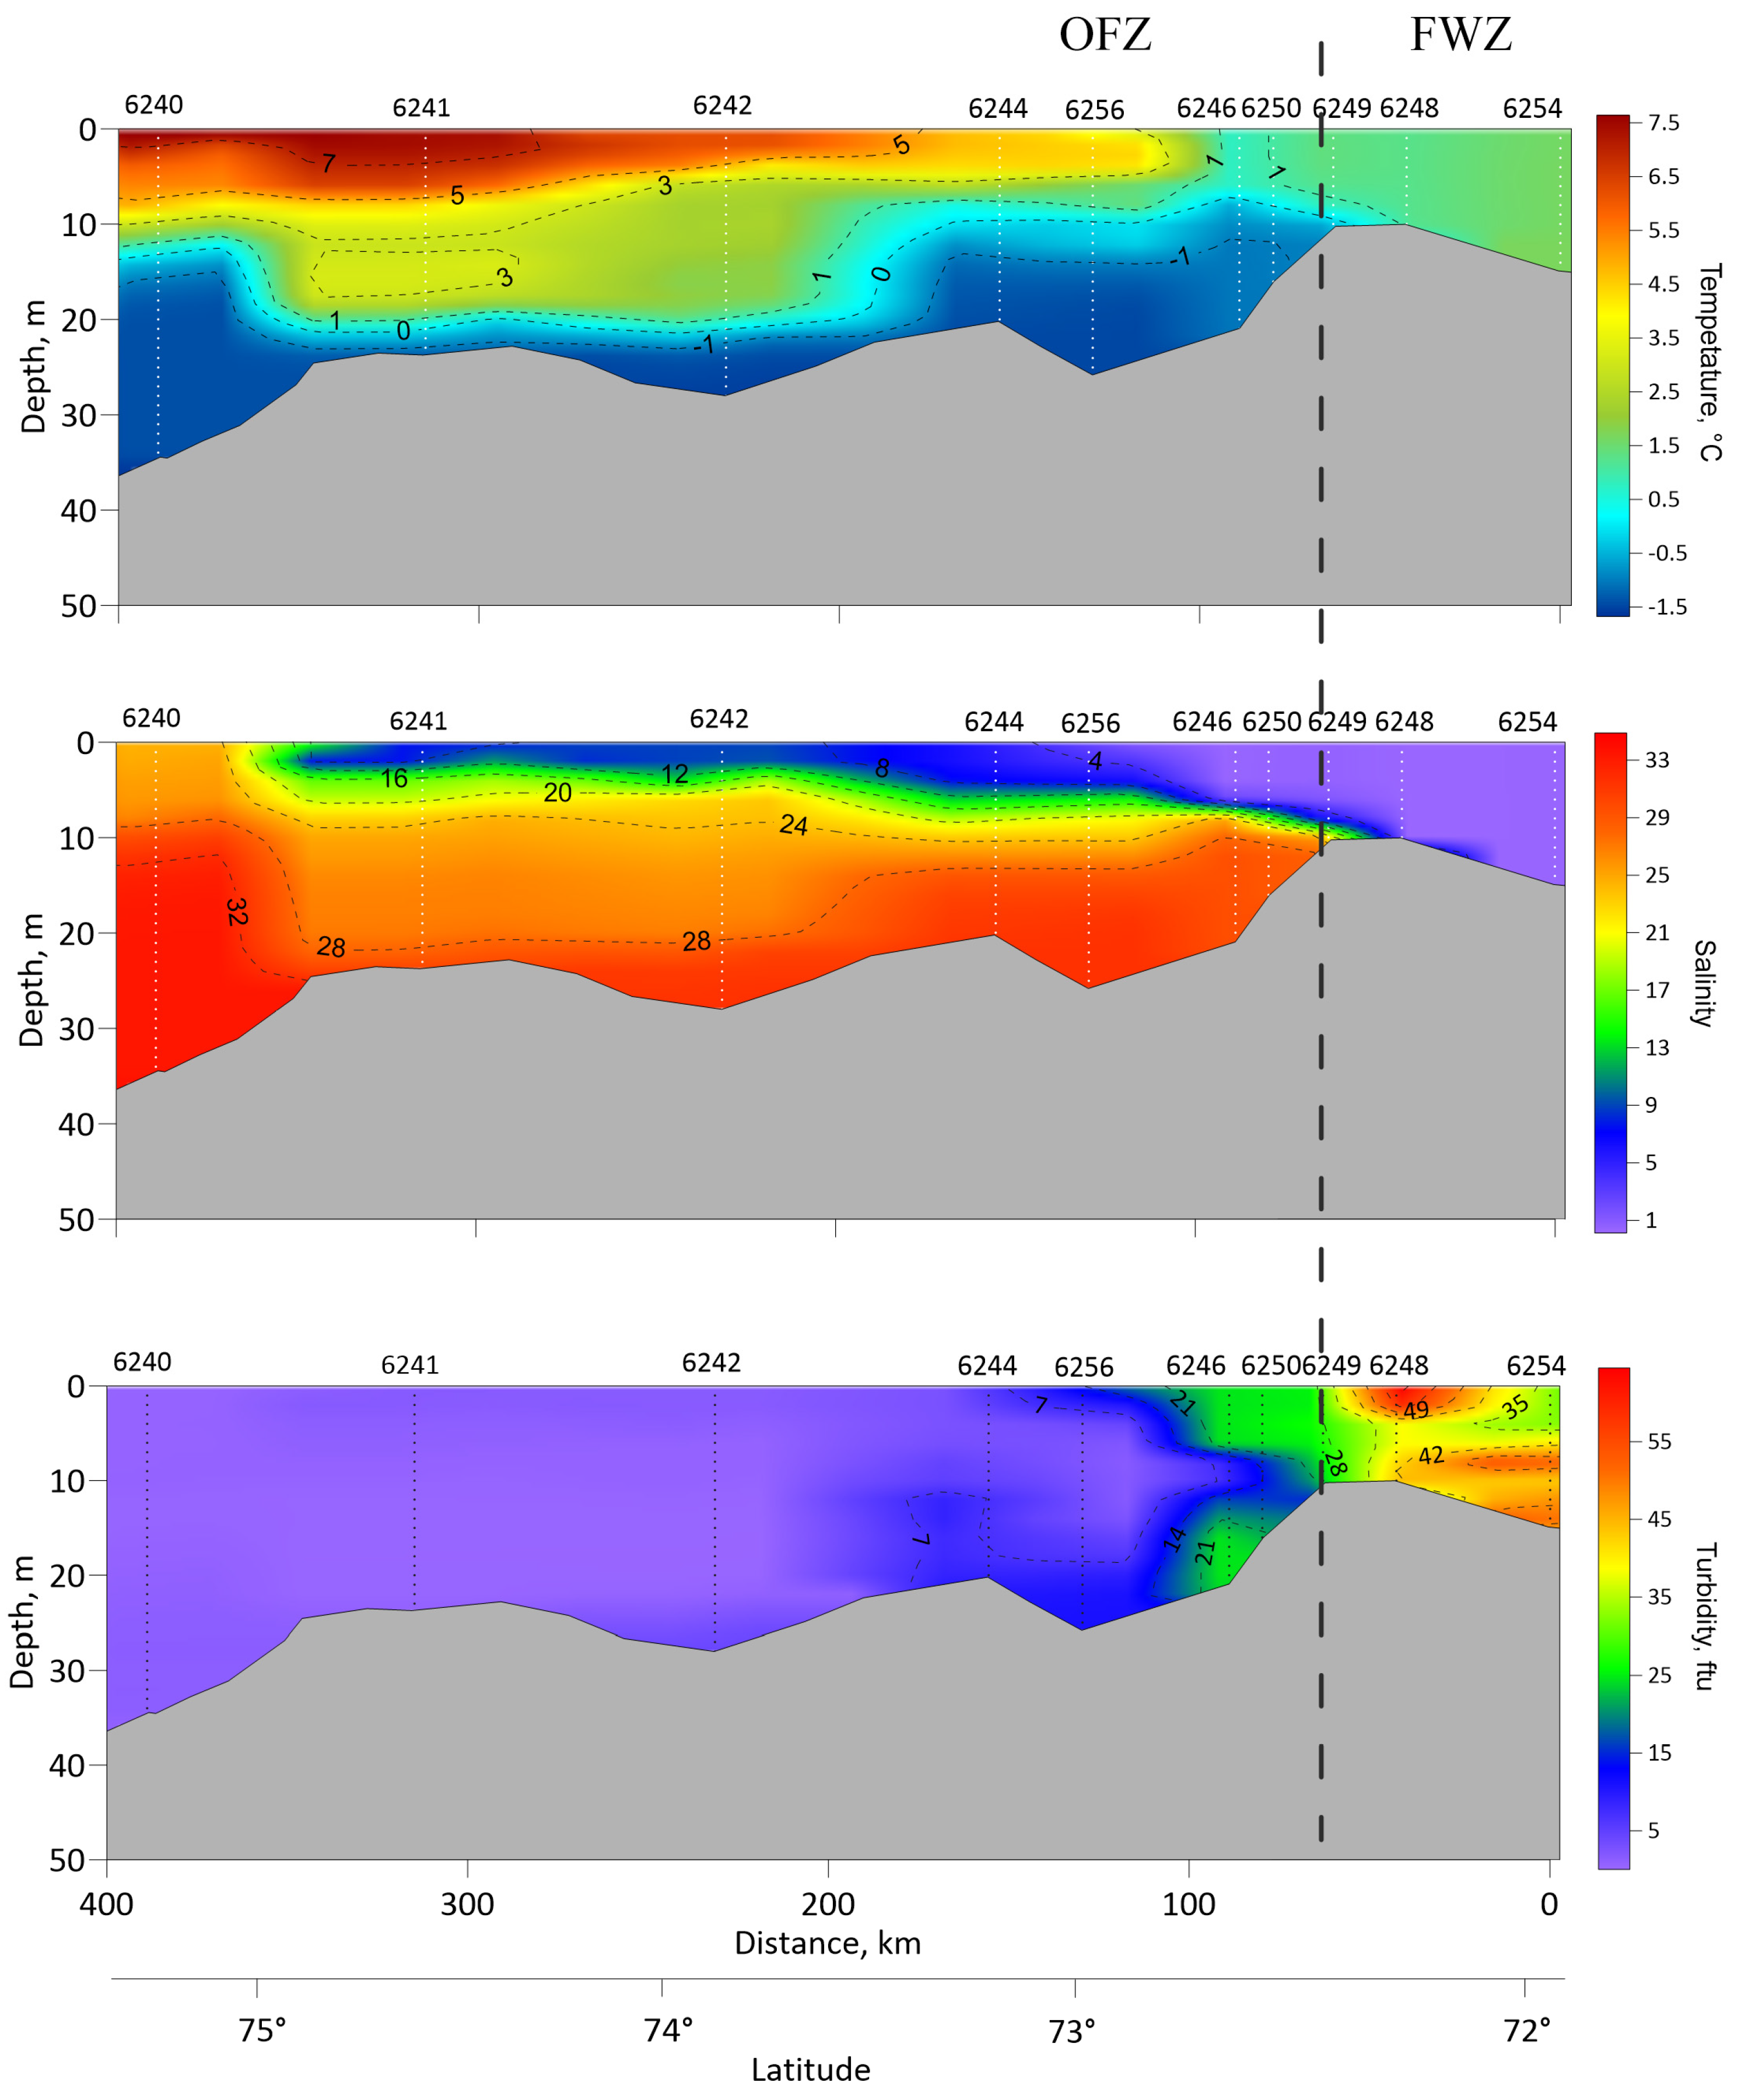
Salinity and temperature of the upper mixed layer along the transect varied from 0.2 and 1.6 °C (inner gulf) at station 6254, to 25 and 6 °C at station 6240 (plume-affected shelf area). According to the changes in hydrographical characteristics, we distinguished two zones: the freshwater zone (FWZ) and the frontal zone of the Ob plume (OFZ). The FWZ occupied the inner Gulf (stations 6249-6254) where there was no stratification, salinity varied from 0.2 to 0.4, and temperature varied from 1.4 to 1.6 °C. In the frontal zone of the Ob plume, the riverine and marine waters most actively interacted, creating strong density gradients. At the southern periphery of the OFZ (stations 6250 and 6246), an intrusion of saline and cold water into the near-bottom layer was observed, while the salinity and temperature in the upper layer remained low (0.2–0.3 and 1.2–1.7 °C, respectively). The northernmost station 6240 with surface salinity of 25 could be considered as the northern periphery of the OFZ. No considerable differences were observed at the repeated stations: temperature of the upper mixed layer increased by only 1 °C, while salinity decreased by about 0.6. Turbidity gradually decreased along the transect from the inner part of the Gulf to the OFZ. Chlorophyll a concentration varied from 1.7 to 2.0 mg m−3 in the FWZ and from 0.4 to 1.8 mg m−3 in the OFZ (Table 1).

3.2. Zooplankton Biomass and Species Composition along the Transect

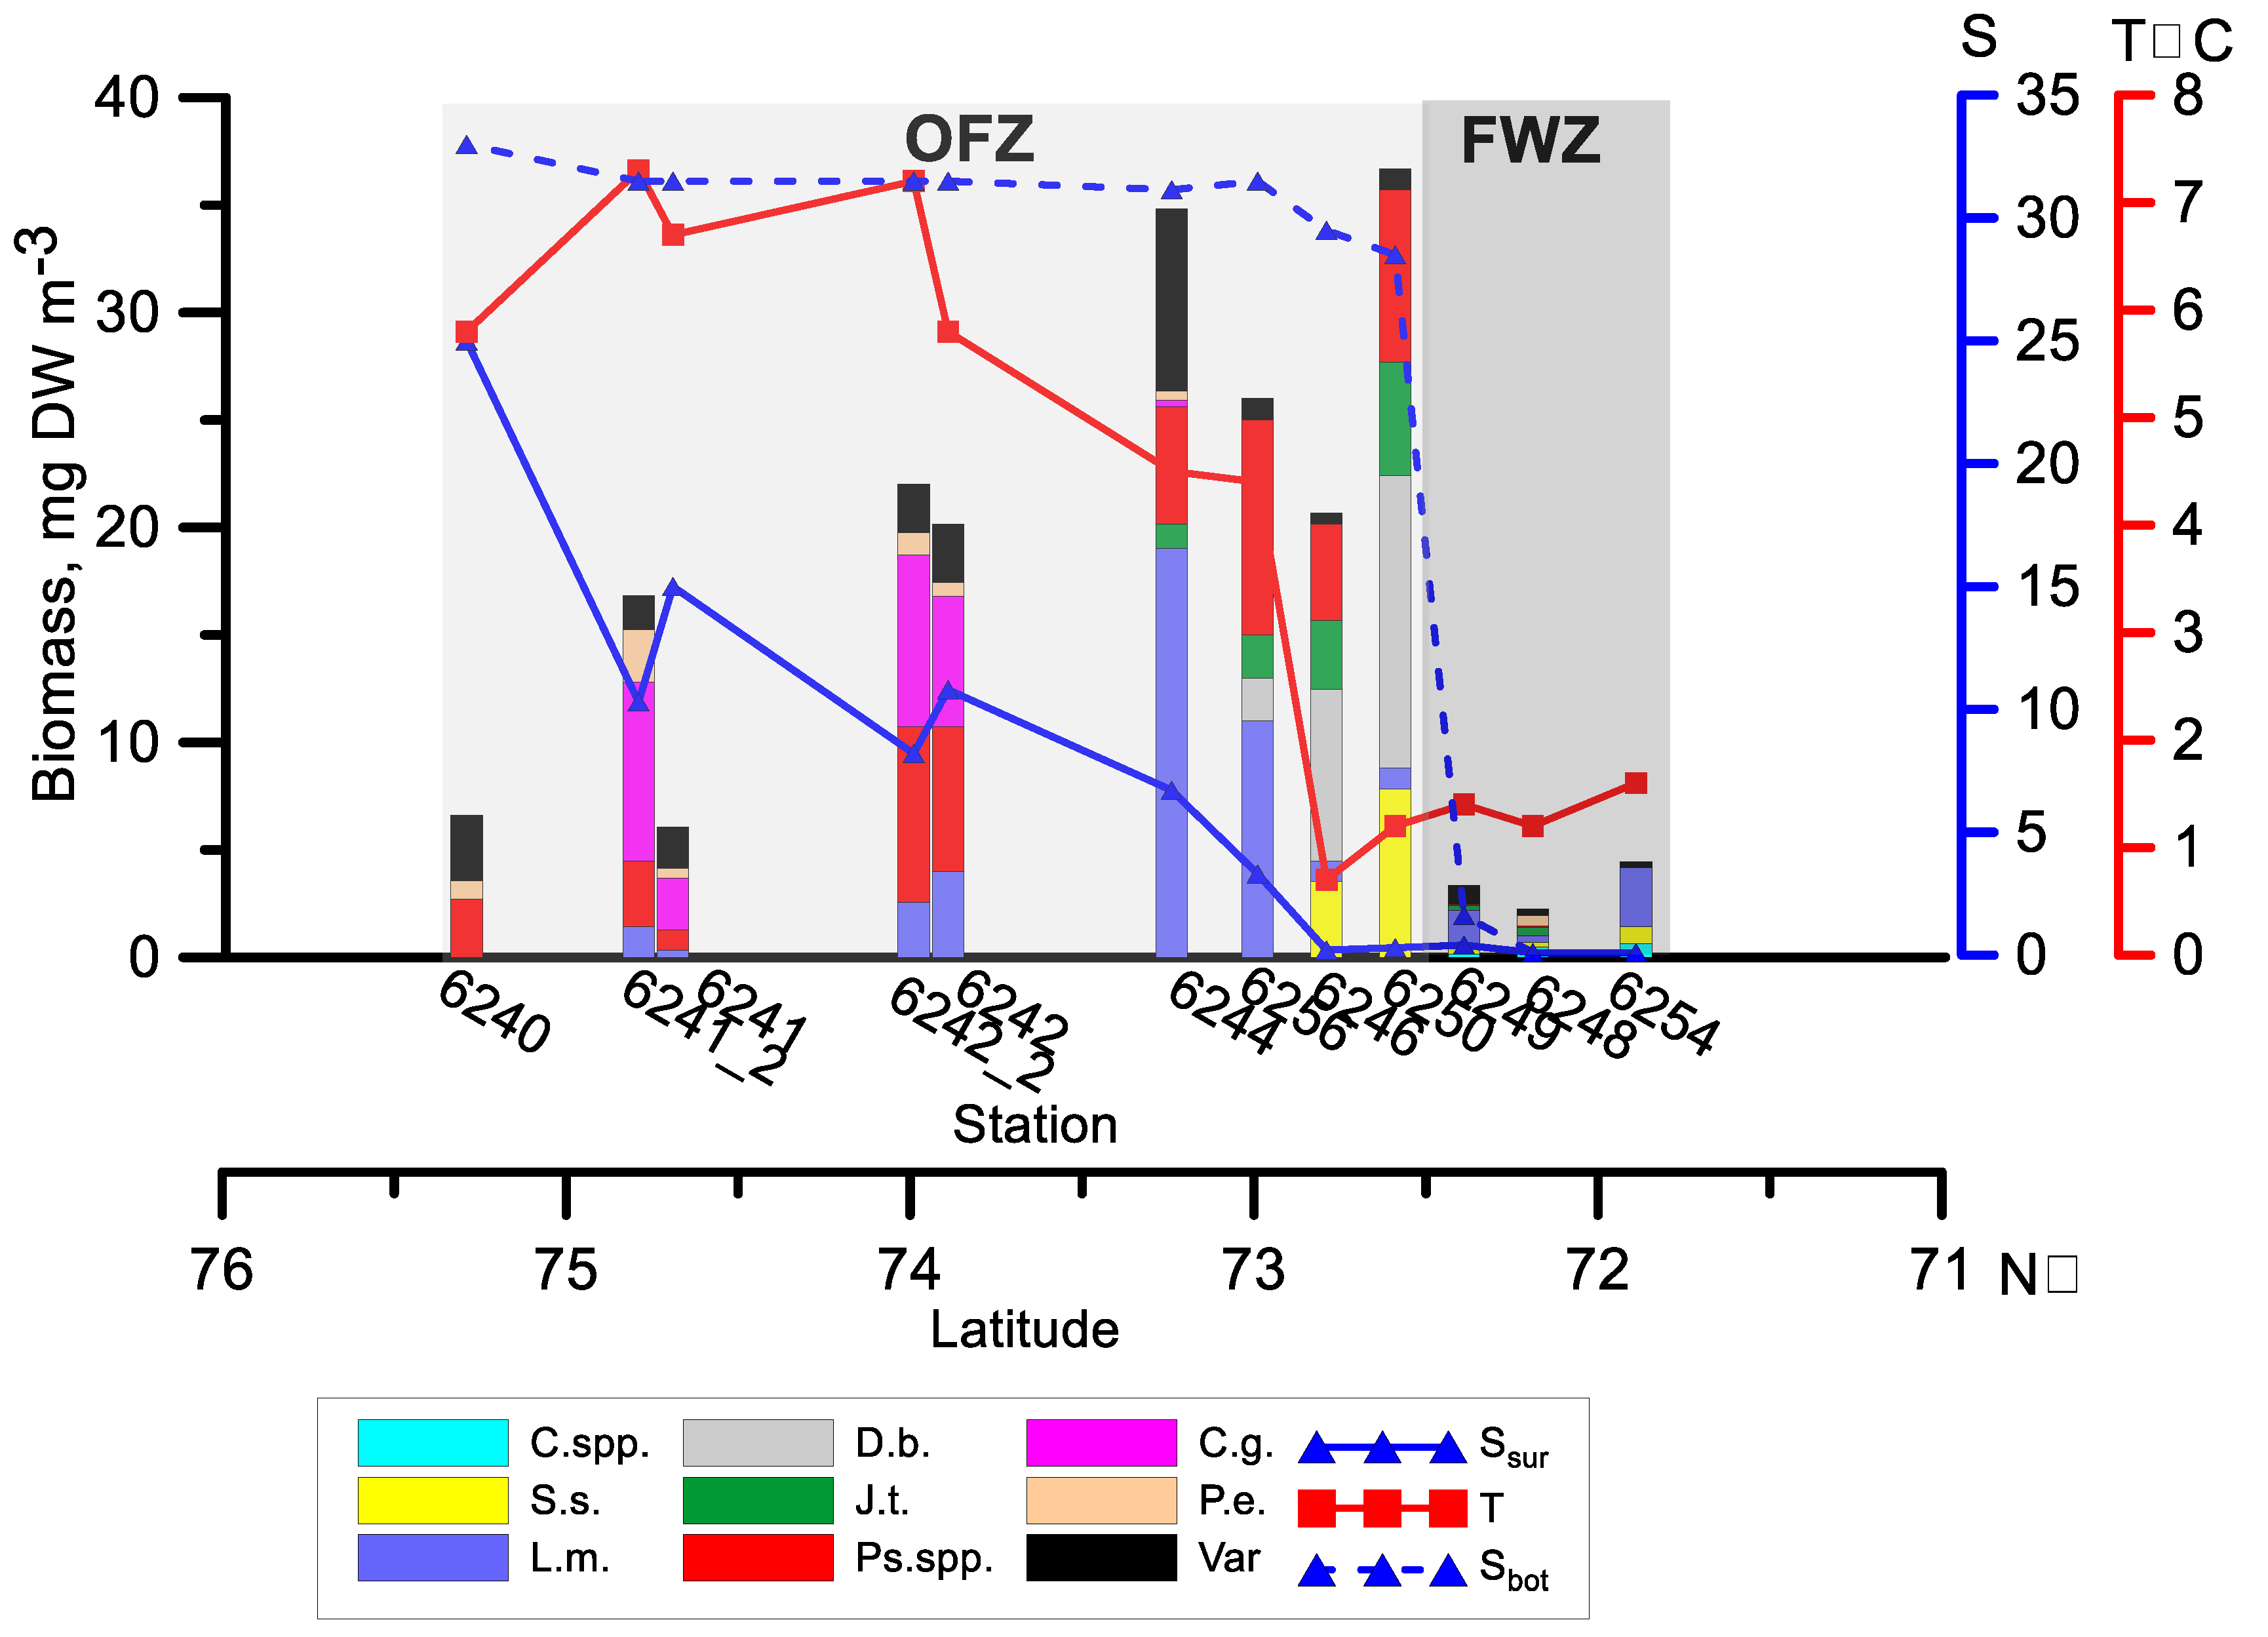
The biomass of mesozooplankton changed from about 2 to 36 mg DW m−3 along the transect and was much lower in the FWZ (mean 3 mg DW m−3) than in the OFZ (mean 21 mg DW m−3, Figure 4, Table S1). Maximum values of the biomass were recorded in the high gradient area in the southern part of the OFZ.
Species composition of zooplankton along the transect changed with the distance from the river mouth. Limnocalanus macrurus (43% of the total biomass) followed by Cyclops spp. (13%) and Senecella siberica (11%) dominated at the innermost stations of the estuary where salinity did not exceed 0.5 (Figure 4).
At the southern periphery of the OFZ, Drepanopus bungei (38%), S. siberica (20%) and Pseudocalanus spp. (20%) dominated. Surprisingly, L. macrurus was not very prominent there. It was again the dominant species at stations 6256 and 6244, where it constituted about 50% of the zooplankton biomass. Moving seaward, the role of L. macrurus gradually decreased, while Calanus glacialis became the dominant zooplankton species, followed by Pseudocalanus spp. (30 and 28% of the biomass, respectively) (Figure 4).
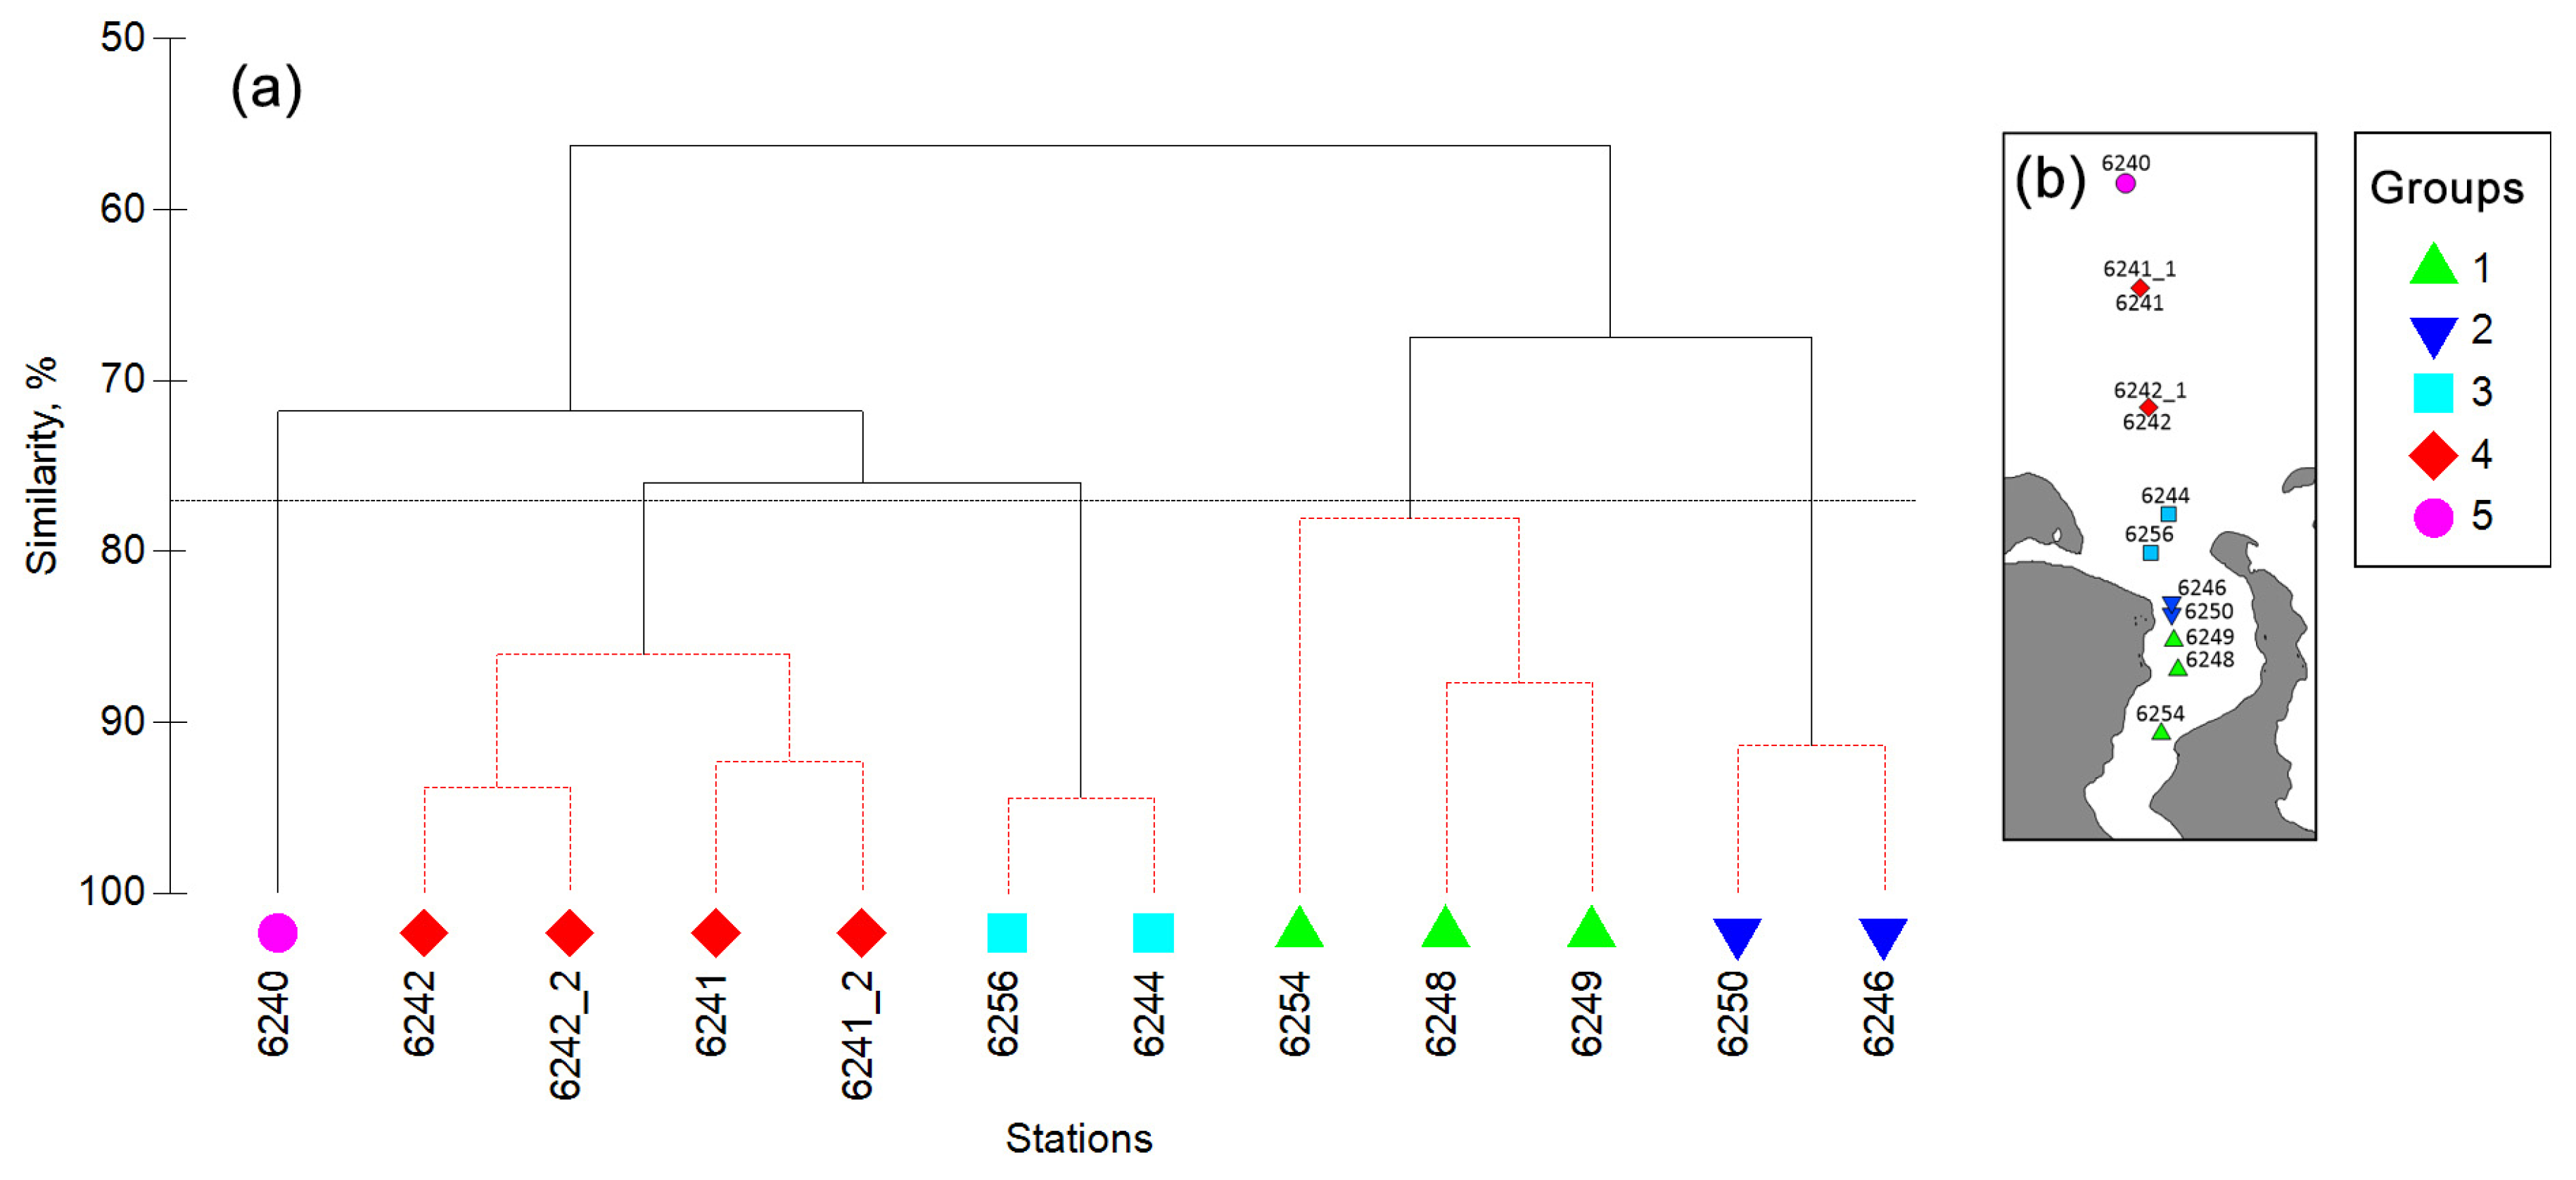
Two main clusters of stations were distinguished: one consisting of estuarine stations (stations 6254–6246, see Figure 1) and the second linking together all stations located in the plume-affected shelf zone (Figure 5). The results of clustering stations into groups can be interpreted in light of the variability of the oceanographic conditions in the area. Within estuary stations, three stations (6254, 6249, 6248) located in the FWZ with low salinity and temperature were separated from the group of two stations (6250 and 6246) in the southern periphery of the OFZ with increasing bottom salinity. Within shelf stations, three groups were distinguished: stations 6244 and 6256 in the area with most pronounced gradients of surface salinity and temperature; stations 6241 and 6242 located in the area where surface temperature increased to 6–7 °C; and, separately, station 6240, located at the northern periphery of the OFZ.

3.3. Vertical Distribution

The vertical distribution of zooplankton in stratified waters varied between stations (Figure 6). At the stations in the southern periphery of the OFZ, the bulk of zooplankton occupied the layer below the pycnocline. At the shelf stations with pronounced salinity and temperature gradients, the biomass in the upper mixed layer was higher than below due to a high abundance of L. macrurus, which inhabited this layer. At station 6242, the values of zooplankton biomass in the upper mixed layer and below pycnocline were similar. The pattern of vertical distribution changed when the station was repeated at night 2 days later: the biomass in the upper layer increased almost by a factor of two, due to an increased abundance of C. glacialis in this layer. Perhaps, this could be explained by the diel vertical migration of this species. However, at the neighboring station 6241, C. glacialis stayed below the pycnocline at night.
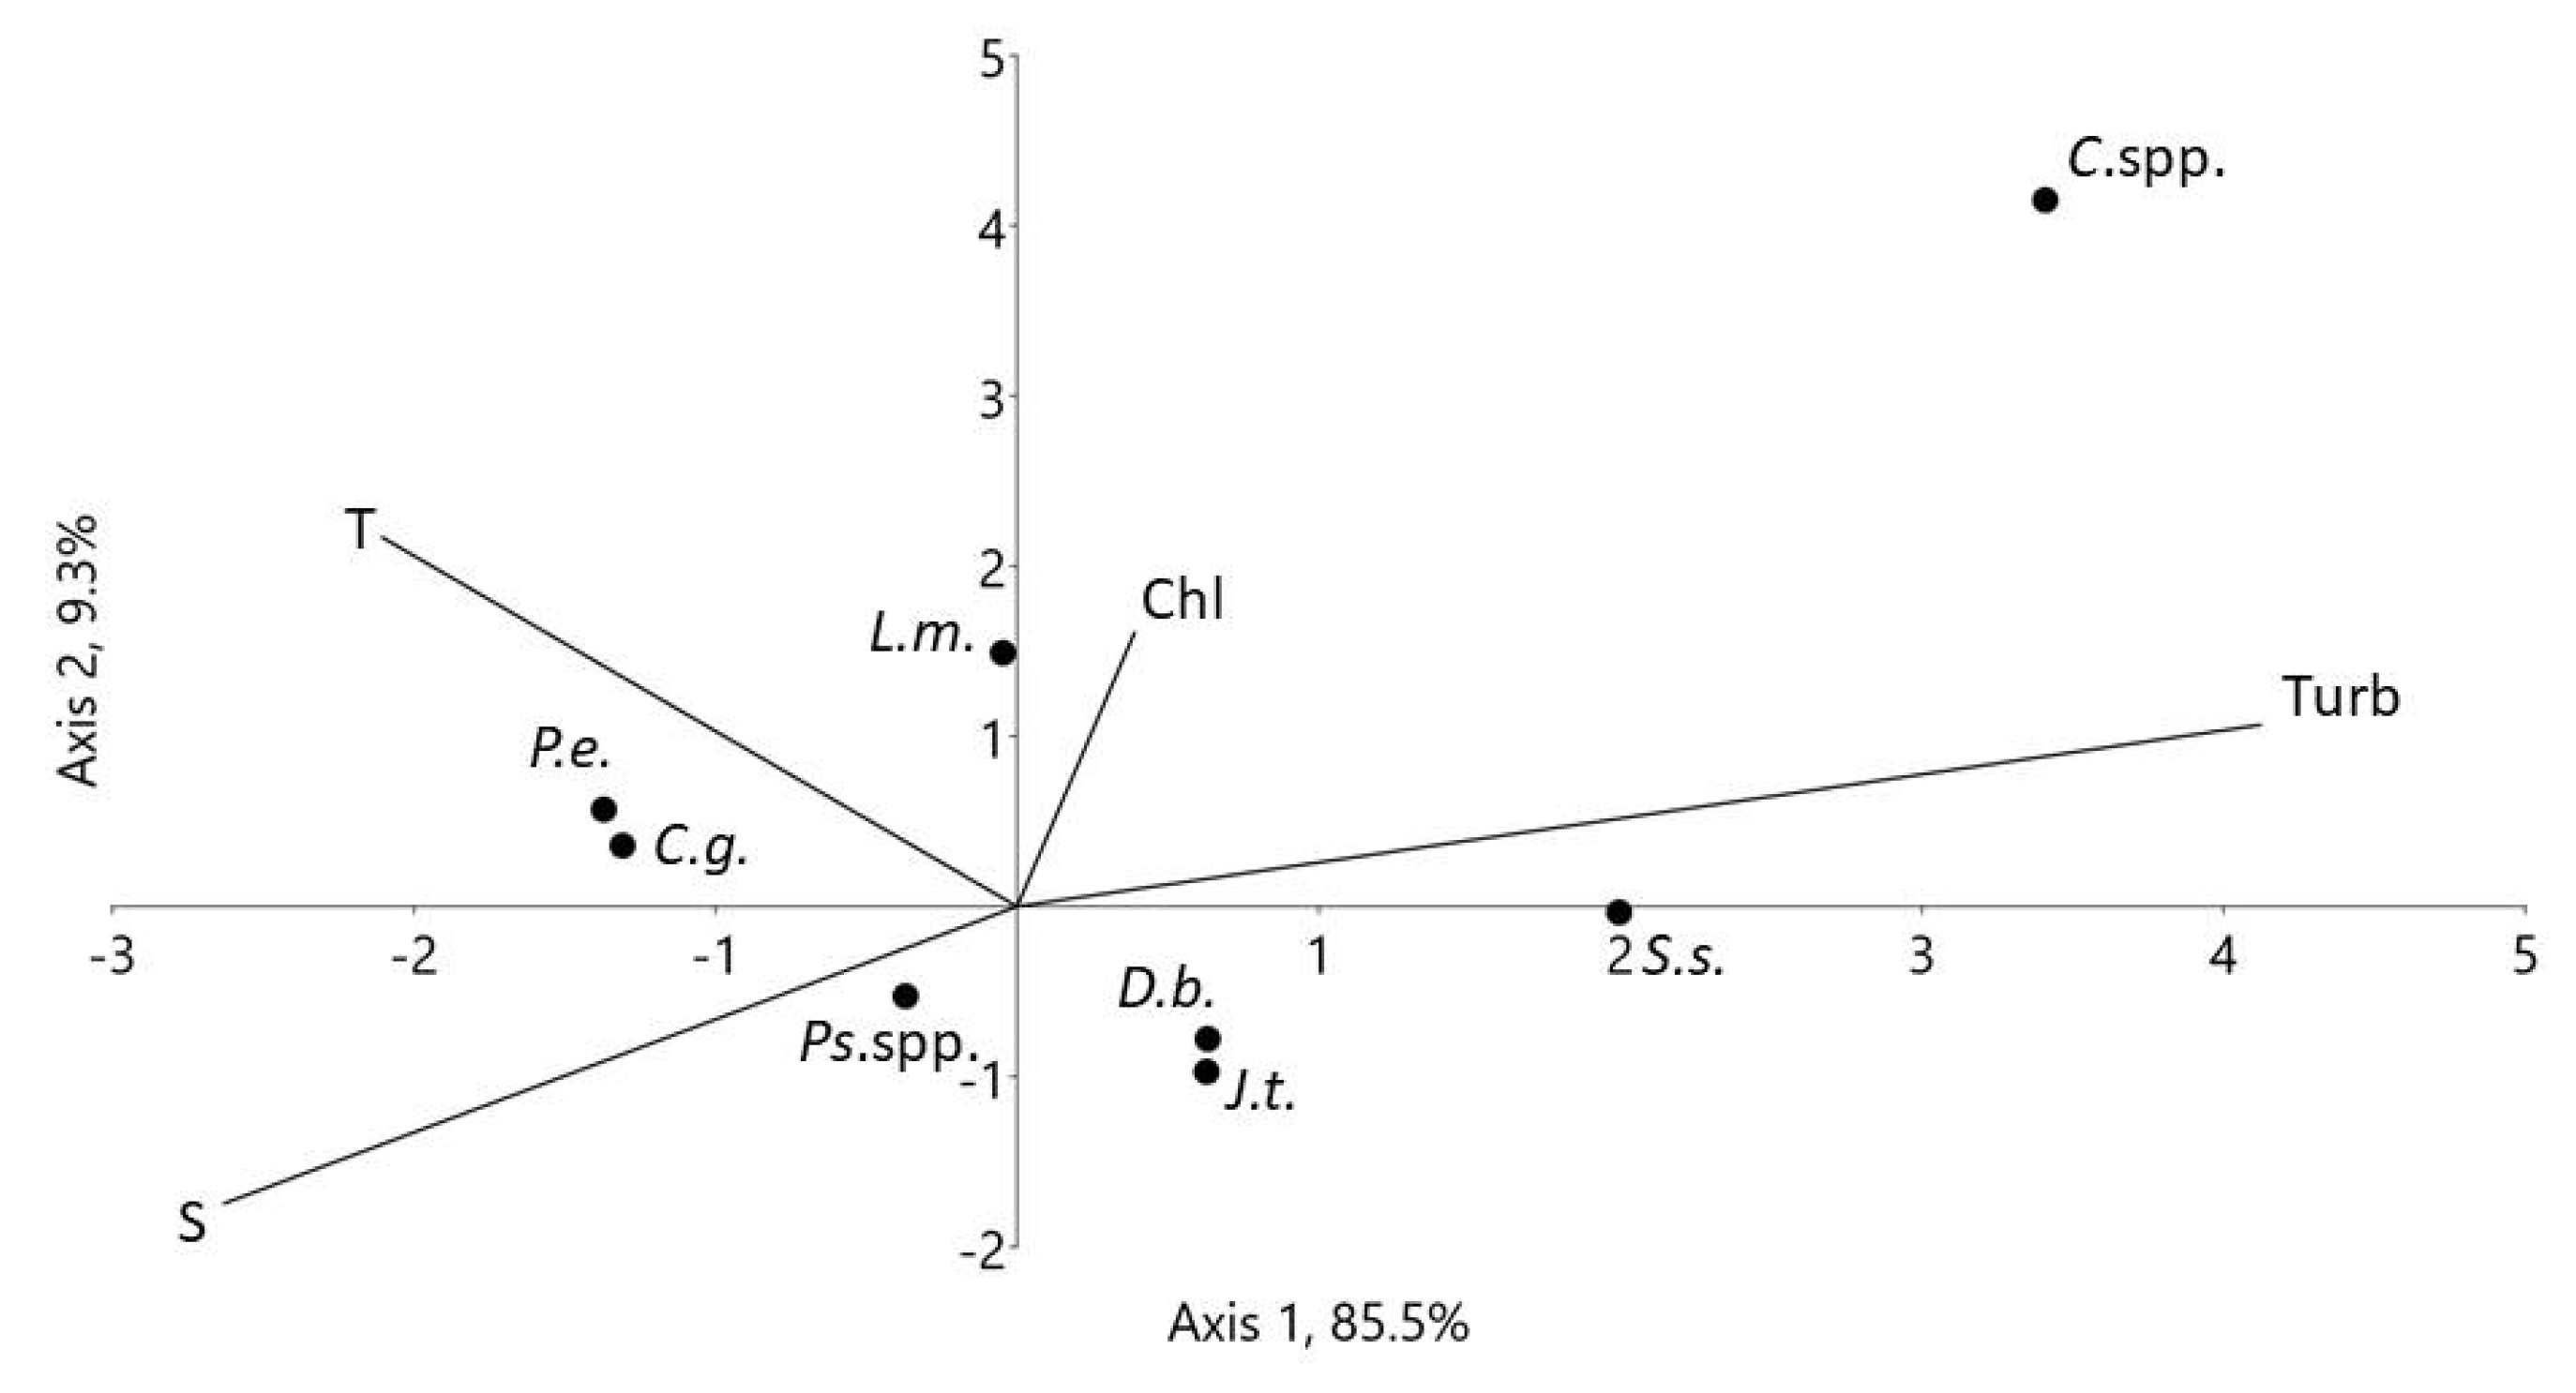
The influence of the environmental factors on the vertical distribution of the dominant zooplankton species, analyzed with Canonical correspondence analysis (CCA), revealed that zooplankton was divided into two groups (Figure 7) along the first canonical axis (explaining 85.5% of total variation), which reflects the influence of salinity, temperature, and turbidity. Cyclops spp., Senecella siberica, Drepanopus bungei, and Jaschnovia tolli comprised a group which preferred layers with lower salinity and higher turbidity. Calanus glacialis, Pseudocalanus spp., and Parasagitta elegans occupied more saline waters. Limnocalanus macrururs occupied layers with intermediate conditions and dominated in the layers with higher chlorophyll concentration. Vertical distribution patterns of various species were therefore controlled either by salinity per se, combined with turbidity, or by chlorophyll concentration.

3.4. Demographic Stracture

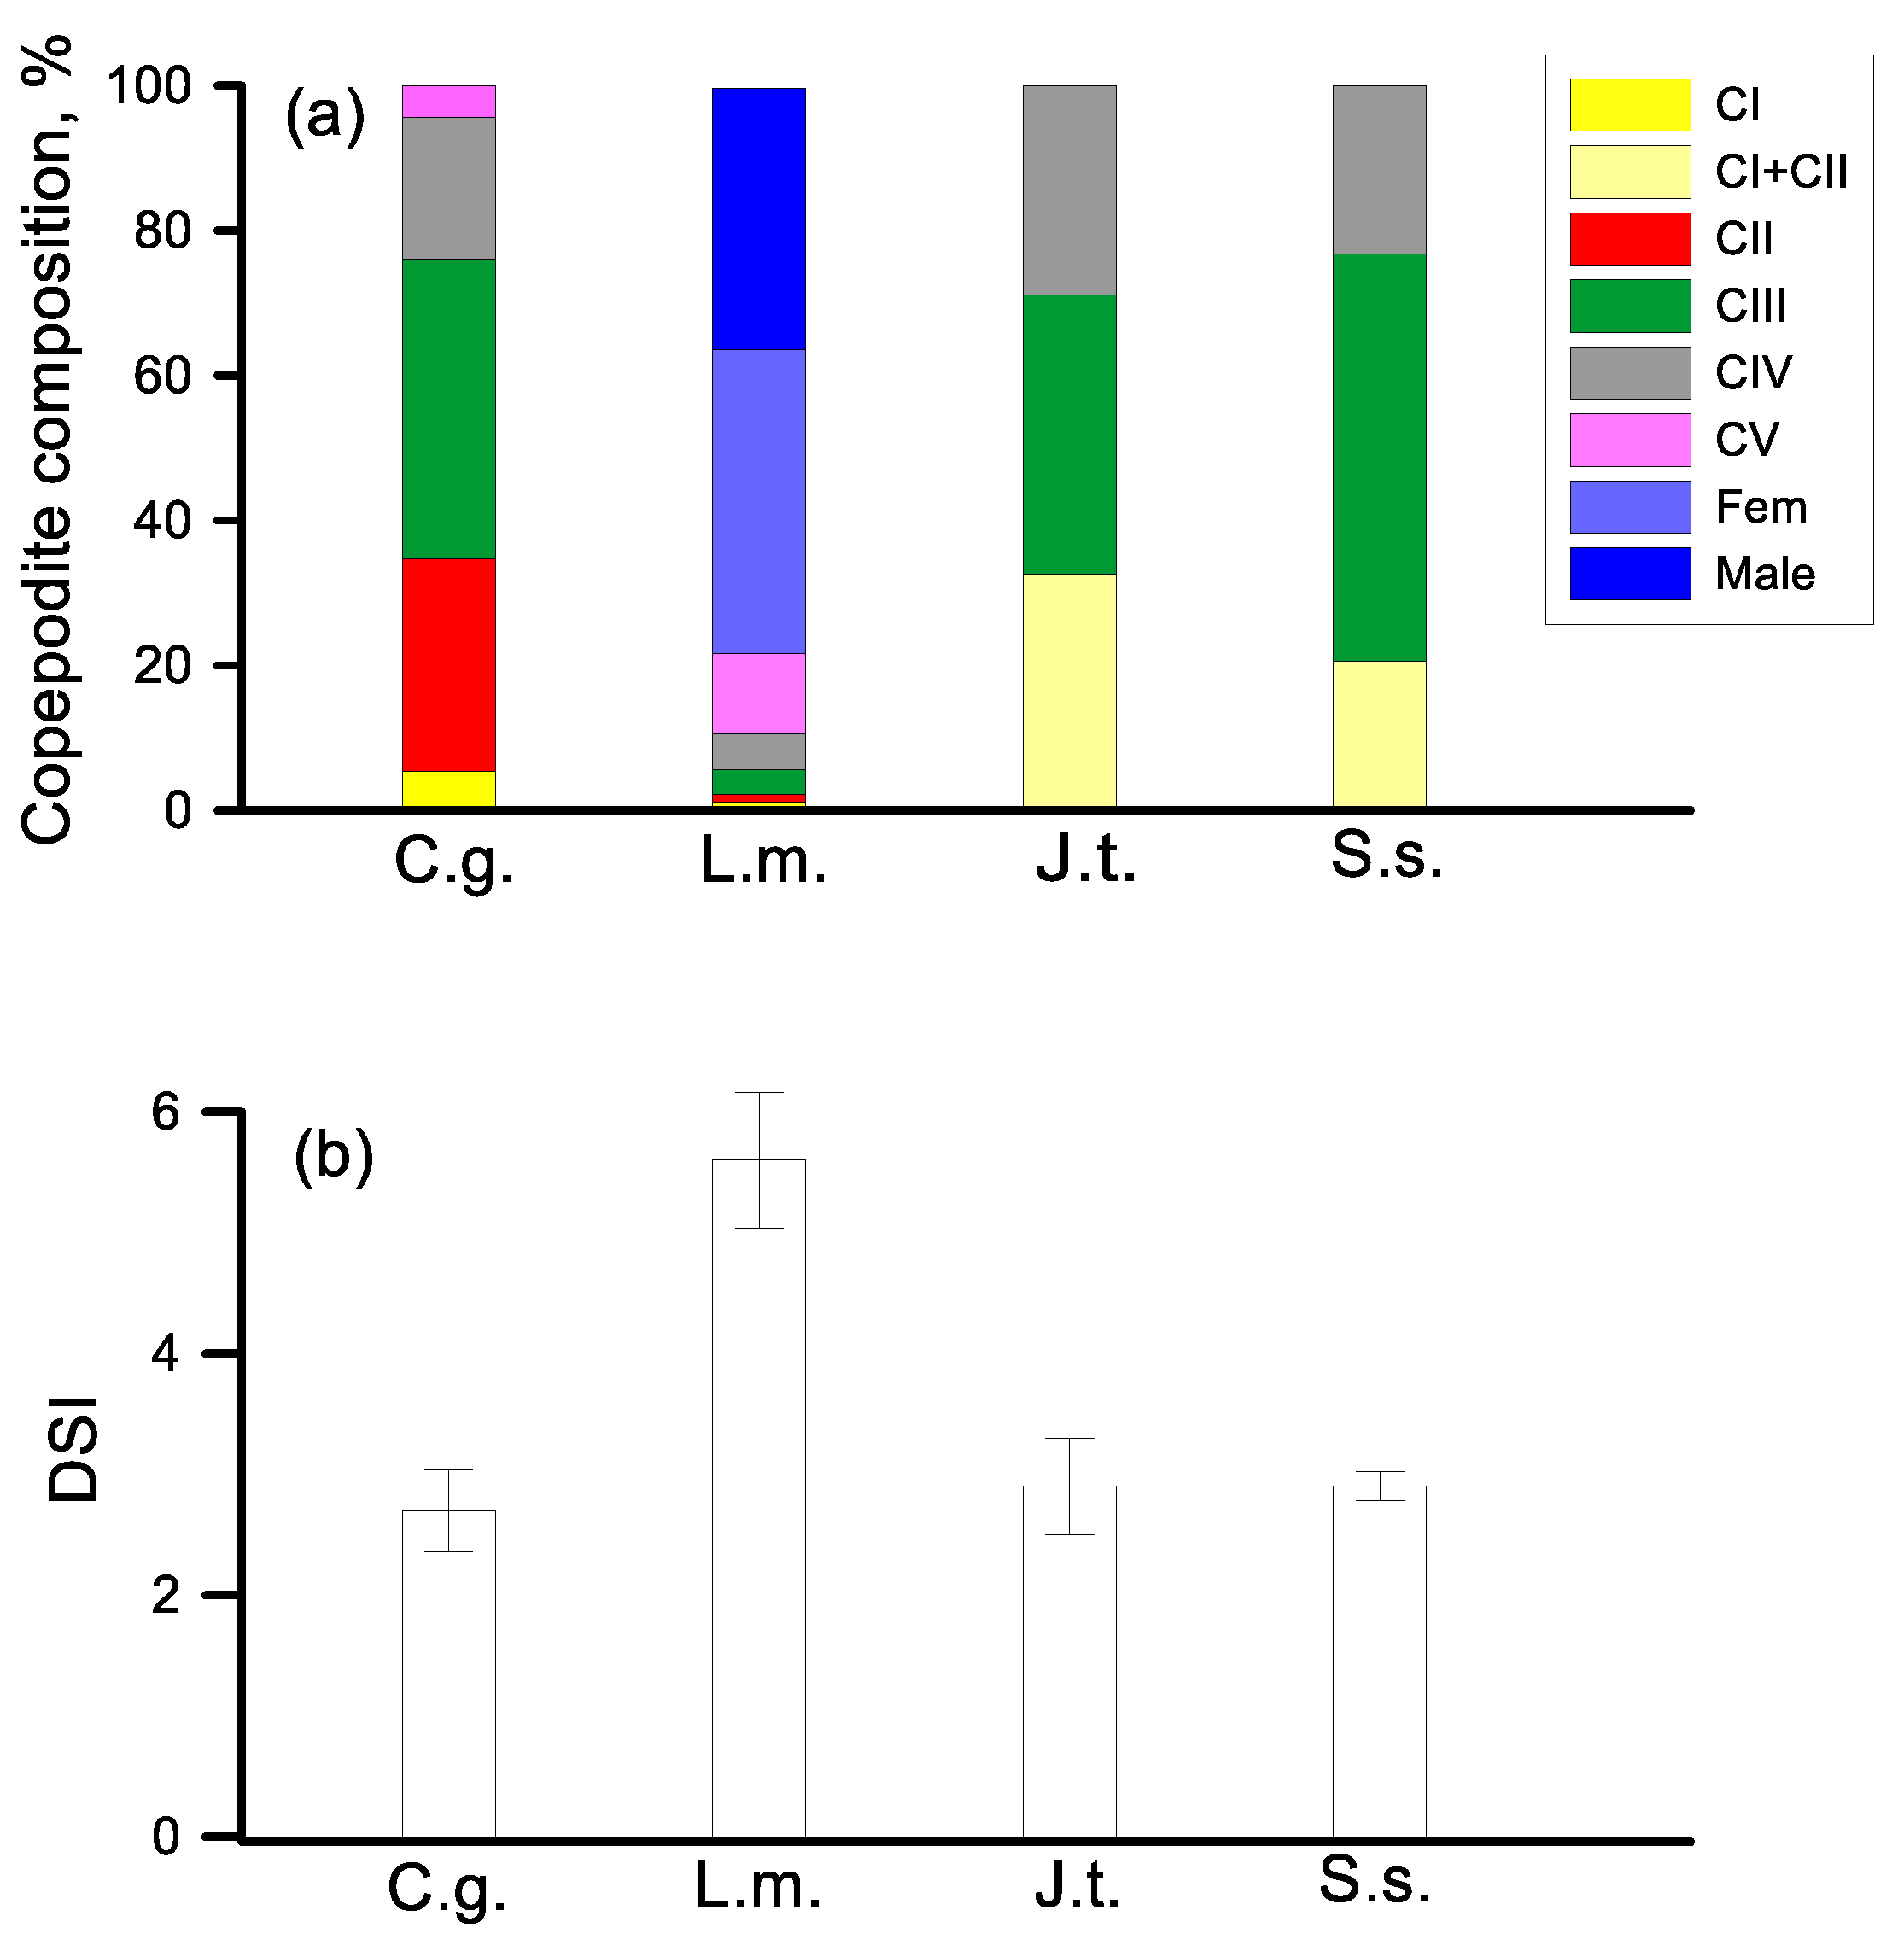
The demographic structure of the dominant population of brackish-water zooplankton in the OFZ differed from those in the FWZ (Figure 8, Table S3). The younger populations were found in the FWZ, where CI and CII comprised more than 70% of the population abundance of Limnocalanus macrurus and Senecella siberica; these stages made up 31% of the Jaschnovia tolli population. Note that in the FWZ, a high abundance of L. macrurus nauplii, up to 1500 ind m−3, was recorded. In the OFZ, the share of the younger stages was less, and specimens of CIII-CV comprised 44–76% of the populations’ abundance. To follow the ageing of the population, we calculated the mean developmental stage index of the dominant populations (Figure 8). The only significant difference in the DSI between the two zones was found in the L. macrurus population (Mann-Whitney U test, p = 0.019).

3.5. Feeding and Respiration

Overall, gut pigment content of dominant zooplankters in both regions was not high, and did not exceed 6 ng Chl ind−1 (Table 2). Higher gut pigment content was recorded in large marine copepods Calanus glacialis and in brackish-water Jaschnovia tolli. No difference was found between day and night gut pigment content of all studied copepods (Mann-Whitney U-test, p > 0.08 in all the cases). Gut pigment content of the copepods inhabiting the upper mixed layer and the layer below pycnocline did not differ either (Mann-Whitney U-test, p > 0.5 in all the cases).
To assess if the energy obtained through herbivory met the metabolic demands of the copepods, we calculated daily ingestion in carbon units of those stages of L. macrurus, J. tolli, C. glacialis for which the respiration rates were measured (Table 3). Specific daily rations of L. macrurus did not cover the metabolic demands. In other species, herbivorous feeding met the metabolic requirements, and in J. tolli CIV and C. glacialis CIV-CV, noticeably exceeded them.

3.6. Grazing Impact

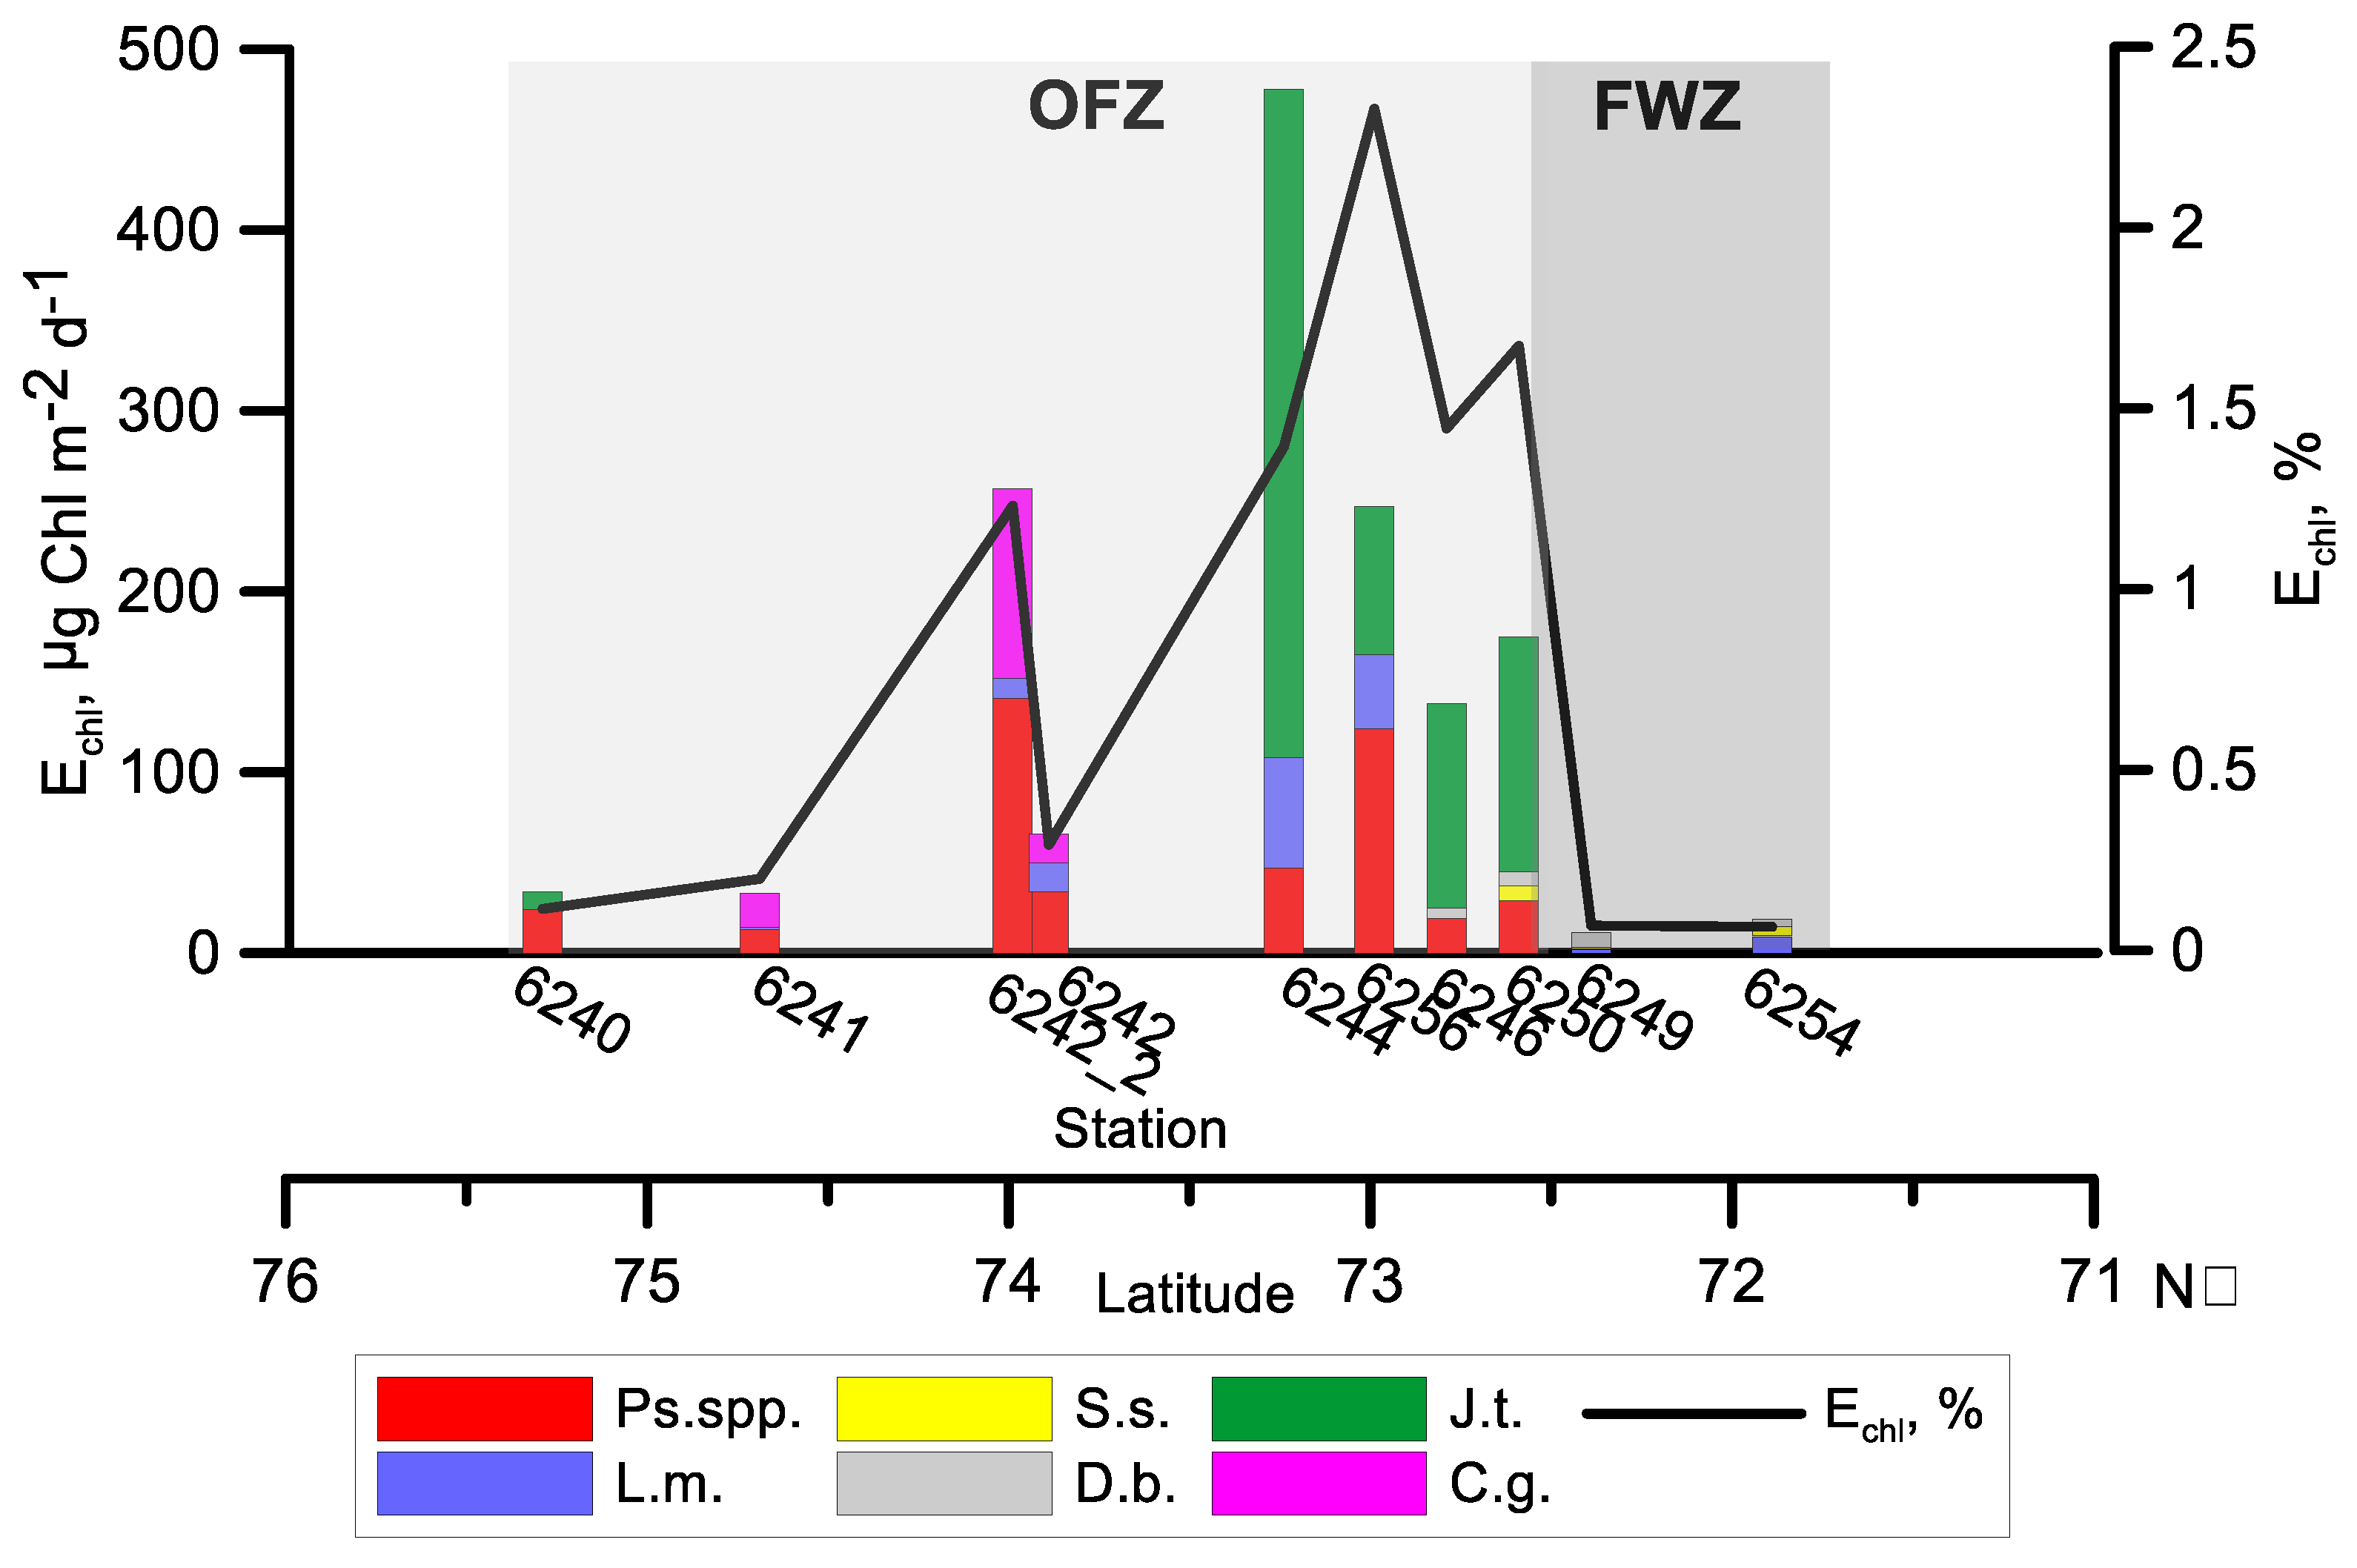
The grazing impact of all studied species on phytoplankton biomass was generally low and varied from <0.1% in the FWZ to 2.3% at the southern periphery of the OFZ (Figure 9). The grazing pressure in the distinguished zones was determined by different consumers. Drepanopus bungei, Limnocalanus macrurus and Senecella siberica were responsible for the grazing impact in the FWZ. At the southern stations of the OFZ, the population of Jaschnovia tolli accounted for most of the grazing impact, while populations of Calanus glacialis and Pseudocalanus spp. accounted for more than 80% of zooplankton grazing further north.

4. Discussion

4.1. Comparison of the Two Contrasting Years

4.1.1. Ice Regime and Environmental Features

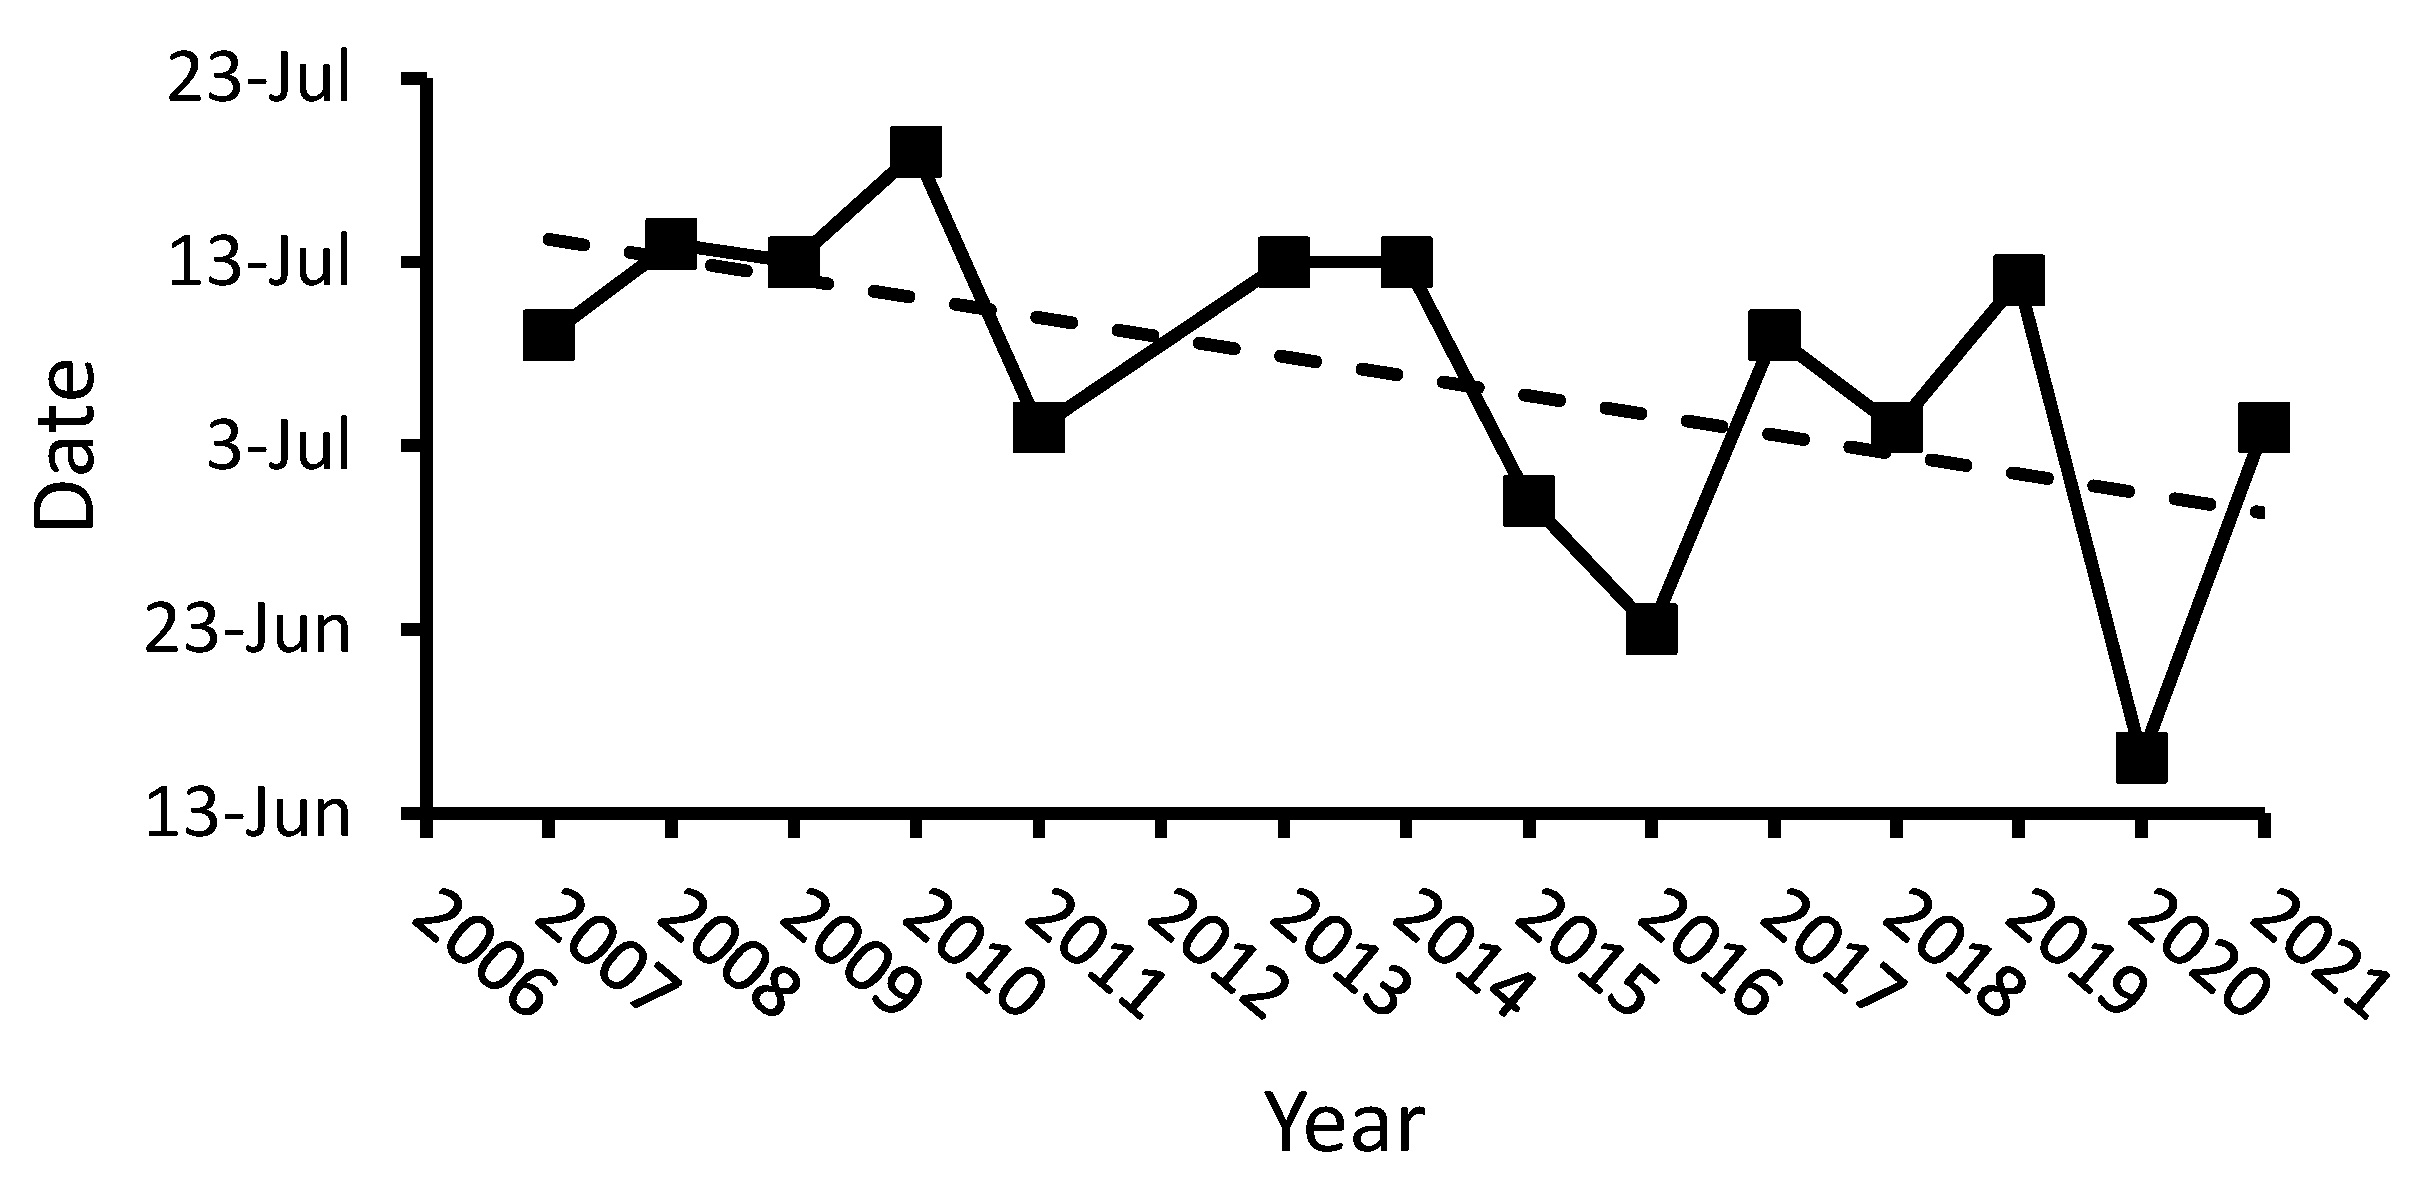
Analysis of satellite data on the ice cover in the Ob Estuary “http://seaice.uni-bremen.de (accessed 22 February 2023)”, from 2007 to 2021 revealed that there was a pronounced inter-annual variability in the timing of ice retreat. We referred to the first day of the season when the estuary was totally free of ice. On average, this happened by the end of the first decade of July, with a tendency to occur earlier in the season (Figure 10). The year of our study, 2019, could be considered as “typical”, while 2016—as the second earliest in respect of the timing of ice retreat. In 2016, the estuary was completely free of ice almost three weeks earlier than in 2019, and hence, these two contrasting years allowed an assessment of zooplankton responses to the timing of ice retreat.
The difference in the timing of ice melt was reflected in the hydrophysical and biological parameters in the Ob Estuary. An earlier ice retreat in 2016 resulted in higher water temperature of the upper mixed layer (9–12 °C, [11], vs. 1.7–4 °C in 2019), and considerably higher chlorophyll concentrations (10–18 mg m−3, [43], vs. 1.7–2 mg m−3 in 2019 [40]. Data on primary production demonstrate similar differences: 260–967 mg C m−2d−1 in 2016 [43] vs. 7–16 mg C m−2d−1 in 2019 [40].

4.1.2. Zooplankton Biomass and Composition

Biomass of zooplankton in our study (3.3 and 23.1 mg DW m−3 in the FWZ and OFZ, respectively) was noticeably lower than the recalculated biomass from [11] values for 2016 (62.1 and 92.8 mg DW m−3 in the FWZ and OFZ). The high values of biomass in July 2016 are very close to those found at the end of August 2014 (69.6 and 102.9 mg DW m−3 in the FWZ and OFZ [6], i.e., 30 calendar days later. The latter year was “typical” in respect to the timing of ice retreat. The higher summer zooplankton biomass found in the Ob Estuary under early ice retreat than under late ice retreat is in agreement with other studies on Arctic zooplankton [13,44].
Species composition was, on the whole, similar in the two compared years, with brackish-water species dominating in the FWZ and southern part of the OFZ, giving way to dominance of Calanus glacialis and Pseudocalanus spp. further north (present study and [11]. However, the share of Limnocalanus macrurus in 2016 was much higher (more than half of the biomass), and that of other brackish-water species, Senecella siberica, Jaschnovia tolli and Drepanopus bungei, much lower than in 2019.
Maximum zooplankton biomass was associated with the high gradient southern periphery of the OFZ in both 2019 (Figure 4) and 2016 [11] (Figure 3). While L. macrurus primarily accounted for the peak in 2016, other brackish-water species considerably supplemented L. macrurus biomass in our study.
Vertical distributions of L. macrurus and Pseudocalanus spp. in the two years could be compared, as only these zooplankters were analyzed in 2016. L. macrurus in our study inhabited the upper mixed layer, while in 2016, its vertical distribution varied depending on the temperature in the upper mixed layer [11]. The authors pointed out that this species avoided the upper layer when water temperature there exceeded 11 °C. Indeed, L. macrurus is a cold-stenothermic copepod, preferring temperatures of less than 11 °C [45], or even 7 °C [46], and is therefore mainly found in cold, deeper waters, below the thermocline [47]. Pseudocalanus spp. in both 2019 and 2016 occupied the layer below the thermocline.

4.1.3. Demographic Structure

Populations of the dominant brackish-water species, Limnocalanus macrurus, Senecella siberica, Jaschnovia tolli, were on the whole younger in the FWZ than in the OFZ, but the difference in the DSI values was significant only in the case of L. macrurus. An earlier development of the populations in the OFZ was probably connected with a higher water temperature there (4.1 °C in the upper layer in the OFZ vs 1.5 °C in the FWZ) rather than phytoplankton availability (chlorophyll concentrations in these areas were comparable). Higher temperatures in the OFZ resulted from an earlier ice retreat in the northern than in the southern part of the Ob Estuary, which is a typical situation according to the multi-annual satellite data “http://seaice.uni-bremen.de (accessed 22 February 2023)”.
The populations of all the species (but J. tolli) in the Ob Estuary were at a less advanced stage of development in the “typical” 2019 (Figure 8) than in the “early-ice-retreat” 2016 (Figure 11). Among the populations of S. siberica and Calanus glacialis, CI-CII dominated (more than 50% of the population) in 2019, and in 2016, CII-CIV dominated (79% and 60%, respectively). No distinct differences between the compared years were observed in the demographic structure of J. tolli: the share of the stages CI+CII, CIII, and CIV was similar (about 30%). The most pronounced differences were found in L. macrurus: in 2019, the younger copepodite stages CI and CII dominated (>50%) the population, with rare (4%) adults; in 2016, on the contrary, adults made up 75%, and CI+CII—4% of the population. The DSI of the L. macrurus population was significantly higher in 2016 (5.6) than in 2019 (2.8) (Mann-Whitney U test, p = 0.002). For other species, the difference was not significant (Mann-Whitney U test, p > 0.3), but the trend was the same. Interspecific differences between L. macrurus and other species could be related to innate faster development rates of the former species. For example, L. macrurus in Parry Sound, Lake Huron, have been shown to develop much faster than co-occurring Senecella calanoides [46].

4.1.4. Feeding

Many authors have indicated that Limnocalanus macrurus is an omnivorous copepod with herbivory dominating under high phytoplankton concentration [48], and carnivory/feeding on microzooplankton in oligotrophic environments [46,47,49,50]. In 2016, when chlorophyll concentration was high, the energy obtained through herbivory by L. macrurus exceeded the metabolic requirements [11]. In 2019, when chlorophyll concentration was considerably lower, herbivorous feeding of L. macrurus did not satisfy the metabolic demands, in contrast to all other studied species. To assess daily rations on all food resources, the carbon to chlorophyll ratio of faecal pellets egested by L. macrurus at older stages (CIV-CVI) of 61 [51] was used for back-calculating this ratio in the ingested food. Assuming assimilation efficiency of 70%, typical of the mixed diet [52], the carbon to chlorophyll ratio of the food was 203, and daily ingestion of L. macrurus CIV to adults increased to 11–22% of body carbon, which considerably exceeded metabolic needs. These results indicate that at least older stages of L. macrurus used carnivory and were well provided with food in both 2016 and 2019.
Low abundance of mesozooplankton and low herbivorous feeding activity of one the dominant species, L. macrurus, resulted in a low total phytoplankton consumption of maximum 0.5 mg Chl a m−2 d−1 (2% of the total biomass) in the Ob Estuary in 2019. In 2016, under higher zooplankton abundance and herbivorous feeding, grazing pressure on phytoplankton increased to 15.6 mg Chl a m−2 d−1, or 5% of the total phytoplankton biomass [11]. High concentrations of Chl a in the Ob Estuary in July 2016 was the main reason of such a weak impact. Along with the seasonal succession, decrease in phytoplankton concentration could lead to an elevated portion of its biomass consumed by the zooplankton community. Indeed, the grazing impact reached 26% of phytoplankton biomass by the end of September 2010 [6].

4.2. Influence of the Timing of Ice Retreat on Populations’ Development

The effect of the timing of ice retreat on the development of populations of the dominant Arctic marine copepods was discussed in a number of studies [13,44,53]. Contrasting effects of the timing of sea-ice melt on the development of the Calanus glacialis population were reported. An early sea-ice retreat resulted in less-developed populations in summer, i.e., those with a higher proportion of young copepodites [13]. This delay in development was related to a mismatch between the appearance of young copepod stages and phytoplankton bloom. The main reason for this mismatch was suggested to be a shorter temporal interval between the ice algal bloom and the phytoplankton bloom [44,53]. On the contrary, other authors found that an earlier ice melt led to a more advanced (i.e., dominated by late copepodite stages) population structure in spring—early summer, owing to increases of both sea-surface temperature and Chl a [54,55].
To our knowledge, there are no data on the influence of the timing of ice retreat on the seasonal development of the Arctic estuarine zooplankton populations. Although our results demonstrated that an early ice retreat resulted in more developed populations of all studied copepods in the Ob Estuary, this effect was most pronounced in Limnocalanus macrurus. Hence, we chose this species to focus on to follow the changes connected with different timings of ice melt. We showed that under an early ice retreat situation, the population of L. macrurus in July comprised almost totally adult females and males. Similar demographic structures with dominance of the adult stages (65–80% of the population) were reported at the end of August 2014 and the beginning of September 2013 (“typical” ice retreat years) [6,8]. This means that under higher temperature and high availability of phytoplankton in 2016, L. macrurus grew faster and reached the terminal phase of seasonal development about a month earlier. The faster development rate of Limnocalanus populations under higher temperature was repeatedly reported for Arctic and temperate lakes [46,56,57].
Limnocalanus macrurus is known to be univoltine in the Arctic [46,47,56,58]. Judging from the presence of females with spermatophores and nauplii NI, the cited authors timed the reproduction period in the Arctic Lakes from October to December, while in the Kara Sea, these stages were found in February [59].
In Parry Sound, when population of L. macrurus was dominated by adults (84%) in July, reproduction started three months later, in September [46]. A similar demographical structure in the Ob Estuary in July 2016 under a comparable temperature regime suggests that reproduction also commenced at the beginning of autumn. In 2019, a retarded population development assumingly resulted in a later reproduction. A delayed reproduction could enhance the predation risk for ovigerous females by visual predators, as L. macrurus is one of the main components of the diet of white fish (Coregonus sardinella and C. muksun) in the estuaries of the large Siberian rivers in winter [60,61]. An earlier reproduction may be thus favorable for the population, reducing the risk for most valuable population members, ovigerous females.
One of the consequences of an earlier ice melt and increased water temperature could be an increased abundance and production of zooplankton [44,55]. Indeed, mean abundance of L. macrurus of 1900 ind m−3 in the Ob Estuary in July 2016 recalculated from [11] was almost 5 times higher than found in 2019 (360 ind m−3). Interestingly, in other “typical” years, mean abundance of this species was similar and lower than in 2016: 500 ind m−3 in August 2014 [6], 480 ind m−3 in September 2013 [8].
Thus, given an advanced population development and higher abundance, L. macrurus seems to be favored by an earlier ice breakup. Could a longer and warmer growing period combined with availability of food resources result in a shift from one to two generations of L. macrurus per year? Despite the fact that a closely related species Limnocalanus grimaldii may have two or three complete generations per year [47], these authors believe that L. macrurus is not able to become multivoltine due to its recent glacial origin. On the other hand, the present climate change can lead to temporal reorganization of the L. macrurus population dynamics and an increase of voltinism. This may be expected if successive years demonstrate similar trends in the extension of the ice-free period (early ice breakup and late ice cover) in the Arctic estuaries. However, this was not the case in the last fourteen years (Figure 9): pronounced inter-annual oscillations in the timing of ice retreat were evident during this period. Probably, the advanced population development and high abundance observed in 2016 was not only the result of the early ice melt per se, but also a repetition of such an event in the successive years 2015 and 2016.

5. Conclusions

A comparison of zooplankton abundance, biomass and community structure in the Ob Estuary in 2016 and 2019—differing by the timing of ice retreat—revealed significant differences. The most pronounced effect imposed by the timing of ice retreat on the summer state of the zooplankton community concerned the abundance and demography of the dominant populations. An early sea-ice retreat in 2016 resulted in a higher zooplankton biomass and more developed populations of all studied species in July. The largest inter-annual differences were found in the dominant brackish-water species, Limnocalanus macrurus. An advanced demographical structure and higher abundance of this species in 2016 compared with 2019 suggests that its population development was favored by an earlier ice breakup. Increases in both temperature and phytoplankton availability are believed to contribute both (although warming seems to be more important, as L. macrurus is omnivorous) to shortening the development time and an earlier reproduction of L. macrurus. In turn, an earlier (at the beginning of autumn instead of winter) reproduction may reduce the risk of predation by white fish (preying predominantly on Limnocalanus in winter) for ovigerous females.
In the Arctic shelf seas, continuing warming and sea-ice loss may disrupt the timing of several key processes, e.g., it may lead to an earlier ice retreat. In fact, over recent decades, a trend of an earlier ice retreat from the Ob Estuary is evident. If such ice conditions persist for several successive years, the temporal reorganization of the L. macrurus seasonal dynamics and an increase of voltinism could be expected.
Taken together, our findings demonstrate that zooplankton community structure, abundance and feeding activity in the Arctic estuaries are highly sensitive to the environmental changes associated with early sea-ice reduction. The challenge remains to collect comprehensive sets of biological, physical and chemical data, which are needed to provide meaningful predictions for Arctic estuarine ecosystems under a changing climate.

Supplementary Materials

The following supporting information can be downloaded at: https://www.mdpi.com/article/10.3390/d15050674/s1, Table S1: Biomass of the dominant mesozooplankton species (mg DW m−3) along the transect in July 2019. Table S2. Abundance of the dominant zooplankton species (ind m−3) along the transect in July 2019. Table S3. Demographic structure (abundance of different copepodite stages, ind m−3) of populations of the dominant zooplankton species along the transect in July 2019.

Author Contributions

A.D. and A.P. equally contributed to the design of the study. A.D., E.A., A.A. and M.F. performed the field data collection and samples treatment. A.P., A.D. and E.A. prepared and analyzed the data. A.P. and A.D. wrote the first draft of the manuscript. All authors have read and agreed to the published version of the manuscript.

Funding

This work was performed according to a State assignment of the Ministry of Science and Higher Education of the Russian Federation FMWE-2021-0007.

Institutional Review Board Statement

Not applicable.

Data Availability Statement

The original data presented in the study are included in the article/Supplementary Materials. Further inquiries can be directed to the corresponding author.

Acknowledgments

We thank the crew of the RV Akademik Mstislav Keldysh for help in the fieldwork. We also express our gratitude to S.A. Shuka for sharing data on hydrophysical parameters, and I.N. Suchanova for providing data on phytoplankton biomass. We are grateful to A. Mishin for help in drawing figures and A.E. Slater for checking the English.

Conflicts of Interest

The authors declare no conflict of interest.

References

  1. McClelland, J.W.; Holmes, R.M.; Dunton, K.H.; Macdonald, R.W. The Arctic Ocean Estuary. Estuaries Coasts 2012, 35, 353–368. [Google Scholar] [CrossRef]
  2. Terhaar, J.; Lauerwald, R.; Regnier, P.; Gruber, N.; Bopp, L. Around one third of current Arctic Ocean primary production sustained by rivers and coastal erosion. Nat. Commun. 2021, 12, 169. [Google Scholar] [CrossRef] [PubMed]
  3. Lisitsin, A.P. The marginal filter of the ocean. Oceanology 1995, 34, 671–682. [Google Scholar]
  4. Vinogradov, M.E.; Shushkina, E.A.; Lebedeva, L.P.; Gagarin, V.I. Mesoplankton of the east Kara Sea and the Ob and Yenisei River estuaries. Oceanology 1995, 34, 646–652. [Google Scholar]
  5. Flint, M.V.; Semenova, T.N.; Arashkevich, E.G.; Sukhanova, I.N.; Gagarin, V.I.; Kremenetskiy, V.V.; Pivovarov, M.A.; Soloviev, K.A. Structure of the zooplankton communities in the region of the Ob River’s estuarine frontal zone. Oceanology 2010, 50, 766–779. [Google Scholar] [CrossRef]
  6. Drits, A.V.; Pasternak, A.F.; Flint, M.V. Distribution and grazing of dominant zooplankton species in the Ob estuary: Influence of the runoff regime. Estuaries Coasts 2017, 40, 1082–1095. [Google Scholar] [CrossRef]
  7. Arashkevich, E.G.; Flint, M.V.; Nikishina, A.B.; Pasternak, A.F.; Timonin, A.G.; Vasilieva, J.V.; Mosharov, S.A.; Soloviev, K.A. The role of zooplankton in transformation of organic matter in the Ob estuary, on the shelf and in the deep regions of the Kara Sea. Oceanology 2010, 50, 780–792. [Google Scholar] [CrossRef]
  8. Drits, A.V.; Nikishina, A.B.; Sergeeva, V.M.; Solovyev, K.A.; Flint, M.V. Spatial distribution and feeding of dominant zooplankton species in the Ob River Estuary. Oceanology 2016, 56, 382–394. [Google Scholar] [CrossRef]
  9. ACIA. Arctic Climate Impact Assessment; Cambridge University Press: Cambridge, MA, USA, 2005. [Google Scholar]
  10. Stroeve, J.C.; Markus, T.; Boisvert, L.; Miller, J.; Barrett, A. Changes in Arctic melt season and implications for sea ice loss. Geophys. Res. Lett. 2014, 41, 1216–1225. [Google Scholar] [CrossRef]
  11. Drits, A.V.; Arashkevich, E.G.; Nedospasov, A.A.; Amelina, A.B.; Flint, M.V. Structural-functional characteristics of zooplankton in the Ob Estuary and adjacent Kara sea shelf in summer. Oceanology 2019, 59, 347–357. [Google Scholar] [CrossRef]
  12. Drits, A.V.; Pasternak, A.F.; Arashkevich, E.G.; Kravchishina, M.D.; Sukhanova, I.N.; Sergeeva, V.M.; Flint, M.V. Influence of riverine discharge and timing of ice retreat on particle sedimentation patterns on the Laptev Sea shelf. J. Geophys. Res. Oceans 2021, 126, e2021JC017462. [Google Scholar] [CrossRef]
  13. Kimura, F.; Matsuno, K.; Abe, Y.; Yamaguchi, A. Effects of early sea-ice reduction on zooplankton and copepod population structure in the northern Bering Sea during the summers of 2017 and 2018. Front. Mar. Sci. 2022, 9, 808910. [Google Scholar] [CrossRef]
  14. Guay, C.K.; Falkner, K.K.; Muench, R.D.; Mensch, M.; Frank, M.; Bayer, R. Wind-driven transport pathways for Eurasian Arctic river discharge. J. Geophys. Res. 2001, 106, 11469–11480. [Google Scholar] [CrossRef]
  15. Oki, T.; Kanae, S. Global hydrological cycles and world water resources. Science 2006, 313, 1068–1072. [Google Scholar] [CrossRef] [PubMed]
  16. Fetzer, I.; Hirche, H.-J.; Kolosova, E.G. The influence of freshwater discharge on the distribution of zooplankton in the southern Kara Sea. Polar Biol. 2002, 25, 404–415. [Google Scholar] [CrossRef]
  17. Drits, A.V.; Pasternak, A.F.; Nikishina, A.B.; Semenova, T.N.; Sergeeva, V.M.; Polukhin, A.A.; Flint, M.V. The dominant copepods Senecella siberica and Limnocalanus macrurus in the Ob Estuary: Ecology in a high-gradient environment. Polar Biol. 2016, 39, 1527–1538. [Google Scholar] [CrossRef]
  18. Flint, M.V.; Anisimov, I.M.; Arashkevich, E.G.; Artemiev, V.F.; Bezzubova, E.M.; Belevich, T.A.; Belyaev, N.A.; Bondarenko, S.A.; Bulokhov, A.V.; Vedenin, A.A.; et al. Ecosystems of the Kara and Laptev Seas; IP Erkhova I.M.: Moscow, Russia, 2021. (In Russian) [Google Scholar]
  19. Fetterer, F.; Knowles, K.; Meier, W.N.; Savoie, M.; Windnagel, A.K. Sea Ice Index, Version 3 [Data Set]; National Snow and Ice Data Center: Boulder, CO, USA, 2017. [Google Scholar] [CrossRef]
  20. Tande, K.S.; Hassel, A.; Slagstad, D. Gonad maturation and possible life cycle strategies in Calanus finmarchicus and Calanus glacialis in the northwestern part of the Barents Sea. In Marine Biology of Polar Regions and Effects of Stress on Marine Organisms; Gray, F.S., Christiansen, M.E., Eds.; Wiley: Chichester, UK, 1985; pp. 141–155. [Google Scholar]
  21. Chislenko, L.L. Nomograms for Determination of Weight of Aquatic Organisms by Size and Body Shape; Nauka: Leningrad, Russia, 1968. (In Russian) [Google Scholar]
  22. Vinogradov, M.E.; Shushkina, E.A. Functioning of the Plankton Communities in Ocean Pelagic; Nauka: Moscow, Russia, 1987. (In Russian) [Google Scholar]
  23. Matthews, J.B.L.; Hestad, L. Ecological studies on the deep-water pelagic community of Korsfjorden, western Norway. Length/weight relationships for some macroplanktonic organisms. Sarsia 1977, 63, 57–63. [Google Scholar] [CrossRef]
  24. Hopcroft, R.R.; Roff, J.C.; Bouman, H.A. Zooplankton growth rates: The larvaceans Appendicularia, Fritillaria and Oikopleura in tropical waters. J. Plank. Res. 1998, 20, 539–555. [Google Scholar] [CrossRef]
  25. Skjoldal, H.R.; Aarflot, J.M.; Bagøien, E.; Skagseth, Ø.; Rønning, J.; Lien, V.S. Seasonal and interannual variability in abundance and population development of Calanus finmarchicus at the western entrance to the Barents Sea, 1995–2019. Prog. Oceanogr. 2021, 195, 102574. [Google Scholar] [CrossRef]
  26. Mackas, D.L.; Bohrer, R.N. Fluorescence analysis of zooplankton gut contents and investigation of diel feeding patterns. J. Exp. Mar. Biol. Ecol. 1976, 25, 77–85. [Google Scholar] [CrossRef]
  27. Pasternak, A.F. Gut fluorescence in herbivorous copepods: An attempt to justify the method. Hydrobiologia 1994, 292/293, 241–248. [Google Scholar] [CrossRef]
  28. Baars, M.A.; Franz, H.G. Grazing pressure of copepods on the phytoplankton stock of the Central North Sea. Neth. J. Sea Res. 1984, 18, 120–142. [Google Scholar] [CrossRef]
  29. Tiselius, P. Effects of diurnal feeding rhythms, species composition and vertical migration on the grazing impact of calanoid copepods in the Skagerrak and Kattegat. Ophelia 1988, 28, 215–230. [Google Scholar] [CrossRef]
  30. Peterson, W.T.; Painting, S.; Barlow, R. Feeding rates of Calanoides carinatus: A comparison of five methods including evaluation of the gut fluorescence method. Mar. Ecol. Prog. Ser. 1990, 63, 85–92. [Google Scholar] [CrossRef]
  31. Saiz, E.; Calbet, A. Copepod feeding in the ocean: Scaling patterns, composition of their diet and the bias of estimates due to microzooplankton grazing during incubations. Hydrobiologia 2011, 666, 181–196. [Google Scholar] [CrossRef]
  32. Valdés, V.; Escribano, R.; Vergara, O. Scaling copepod grazing in a coastal upwelling system: The importance of community size structure for phytoplankton C flux. Lat. Am. J. Aquat. Res. 2017, 45, 41–54. [Google Scholar] [CrossRef]
  33. D’souza, A.; Gauns, M. Temporal variability in copepod gut pigments over the central western continental shelf of India. J. Mar. Biol. Assoc. UK 2018, 98, 149–159. [Google Scholar] [CrossRef]
  34. Holm-Hansen, O.; Lorenzen, C.J.; Holmes, R.W.; Strickland, J.D.H. Fluorometric determination of chlorophyll. J. Conseil 1965, 30, 3–15. [Google Scholar] [CrossRef]
  35. Båmstedt, U.; Gifford, D.J.; Irigoien, A.; Atkinson, A.; Roman, M. Feeding. In ICES Zooplankton Methodology Manual; Harris, R., Wiebe, P., Lenz, J., Skjoldal, H.R., Huntley, M., Eds.; Elsevier: Amsterdam, The Netherlands, 2000; pp. 297–399. [Google Scholar]
  36. Pasternak, A.; Drits, A.; Arashkevich, E.; Flint, M. Differential impact of the Khatanga and Lena (Laptev Sea) runoff on the distribution and grazing of zooplankton. Front. Mar. Sci. 2022, 9, 881383. [Google Scholar] [CrossRef]
  37. Irigoien, X. Gut clearance rate constant, temperature, and initial gut contents: A review. J. Plankton Res. 1998, 20, 997–1003. [Google Scholar] [CrossRef]
  38. Menden-Deuer, S.; Lessard, E.J. Carbon to volume relationships for dinoflagellates, diatoms, and other protist plankton. Limnol. Oceanogr. 2000, 45, 569–579. [Google Scholar] [CrossRef]
  39. Sukhanova, I.N.; (P.P. Shirshov Institute of Oceanology, Moscow, Russia). Personal communication, 2023.
  40. Demidov, A.B.; Sukhanova, I.N.; Belevich, T.A.; Flint, M.V.; Gagarin, V.I.; Sergeeva, V.M.; Eremeeva, E.V.; Fedorov, A.V. Size-fractionated surface phytoplankton in the Kara and Laptev seas: Environmental control and spatial variability. Mar. Ecol. Prog. Ser. 2021, 664, 59–77. [Google Scholar] [CrossRef]
  41. Lampert, W. The measurement of respiration. A manual of the methods for assessment of secondary production in fresh water. In IBP Handbook; Downing, I.A., Rigler, F.H., Eds.; Blackwell: Oxford, UK, 1984; pp. 413–460. [Google Scholar]
  42. Clarke, K. Non-parametric multivariate analyses of changes in community structure. Aust. J. Ecol. 1993, 18, 117–143. [Google Scholar] [CrossRef]
  43. Demidov, A.B.; Gagarin, V.I.; Vorobieva, O.V.; Makkaveev, P.N.; Artemiev, V.A.; Khrapko, A.N.; Grigoriev, A.V.; Sheberstov, S.V. Spatial and vertical variability of primary production in the Kara Sea in July and August 2016: The influence of the river plume and subsurface chlorophyll maxima. Polar Biol. 2018, 41, 563–578. [Google Scholar] [CrossRef]
  44. Leu, E.; Søreide, J.E.; Hessen, D.O.; Falk-Petersen, S.; Berge, J. Consequences of changing sea-ice cover for primary and secondary producers in the European Arctic shelf seas: Timing, quantity, and quality. Prog. Oceanogr. 2011, 90, 18–32. [Google Scholar] [CrossRef]
  45. Hutchinson, G.E. A Treatise on Limnology, Volume 2, Introduction to Lake Biology and the Limnoplankton; John Wiley and Sons: New York, NY, USA, 1967. [Google Scholar]
  46. Carter, J.C.H. Life cycles of Limnocalanus macrurus and Senecella calanoides, and seasonal abundance and vertical distributions of various planktonic copepods, in Parry Sound, Georgian Bay. J. Fish. Res. Bd. Can. 1969, 262, 2543–2560. [Google Scholar] [CrossRef]
  47. Roff, J.C.; Carter, J.H.C. Life cycle and seasonal abundance of the copepod Limnocalanus macrurus Sars in a high arctic lake. Limnol. Oceanogr. 1972, 17, 363–370. [Google Scholar] [CrossRef]
  48. Dahlgren, K.; Olsen, B.R.; Troedsson, C.; Båmstedt, U. Seasonal variation in wax ester concentration and gut content in a Baltic Sea copepod [Limnocalanus macrurus (Sars 1863)]. J. Plank. Res. 2012, 34, 286–297. [Google Scholar] [CrossRef]
  49. Warren, G.J. Predaceous feeding habits of Limnocalanus macrurus. J Plankton Res. 1985, 7, 537–552. [Google Scholar] [CrossRef]
  50. Nero, R.W.; Sprules, W.G. Predation by the three glacial opportunists on natural zooplankton communities. Can. J. Zool. 1986, 64, 57–64. [Google Scholar] [CrossRef]
  51. Drits, A.V.; Belayev, N.A.; Karmanov, V.A.; Flint, M.V. Application of the high-temperature combustion method for measuring organic carbon content in fecal pellets and small-sized (≤1 mm) zooplankton. Oceanology 2023, 63, 141–148. [Google Scholar]
  52. Mauchline, J. The Biology of Calanoid Copepods; Academic Press: San Diego, CA, USA, 1998. [Google Scholar]
  53. Søreide, J.E.; Leu, E.; Berge, J.; Graeve, M.; Falk-Petersen, S. Timing of blooms, algal food quality and Calanus glacialis reproduction and growth in a changing Arctic. Glob. Chang. Biol. 2010, 16, 3154–3163. [Google Scholar] [CrossRef]
  54. Ringuette, M.; Fortier, L.; Fortier, M.A.; Runge, J.; Belanger, S.; Larouche, P.; Weslawski, J.-M.; Kwasniewski, S. Advanced recruitment and accelerated population development in Arctic calanoid copepods of the North Water. Deep-Sea Res. II 2002, 49, 5081–5099. [Google Scholar] [CrossRef]
  55. Matsuno, K.; Yamaguchi, A.; Hirawake, T.; Imai, I. Year-to-year changes of the mesozooplankton community in the Chukchi Sea during summers of 1991, 1992 and 2007, 2008. Polar Biol. 2011, 34, 1349–1360. [Google Scholar] [CrossRef]
  56. Roff, J.C. Aspects of the reproductive biology of the planktonic copepod Limnocalanus macrurus Sars, 1863. Crustaceana 1972, 22, 155–160. Available online: http://www.jstor.org/stable/20101872 (accessed on 25 January 2023). [CrossRef]
  57. Fomina, Y.Y.; Syarkia, M.T. Life cycle of the copepod Limnocalanus macrurus Sars 1863 (Copepoda, Calaniformes, Centropagidae) in Lake Onego. Biol. Bull. 2022, 49, 1261–1270. [Google Scholar] [CrossRef]
  58. Vanderploeg, H.A.; Cavaletto, J.F.; Liebig, J.R.; Gardner, W.S. Limnocalanus macrurus (Copepoda: Calanoida) retains a marine arctic lipid and life cycle strategy in Lake Michigan. J. Plankton Res. 1998, 20, 1581–1597. Available online: http://plankt.oxfordjournals.org/ (accessed on 25 January 2023). [CrossRef]
  59. Kosobokova, K.N.; Hirche, H.-J. A seasonal comparison of zooplankton communities in the Kara Sea—With special emphasis on overwintering traits. Estuar. Coast. Shelf Sci. 2016, 175, 146–156. [Google Scholar] [CrossRef]
  60. Kuklin, A.A. Feeding of Coregonus muksun in Yenisei. Proc. GosNIORKX 1980, 158, 87–90. (In Russian) [Google Scholar]
  61. Stepanova, V.B.; Stepanov, S.I. Importance of relict crustaceans in whitefish nutrition during under the ice period. Vestnik Ekologii Lesovedeniya i Landshaftovedeniya 2006, 6, 142–145. (In Russian) [Google Scholar]
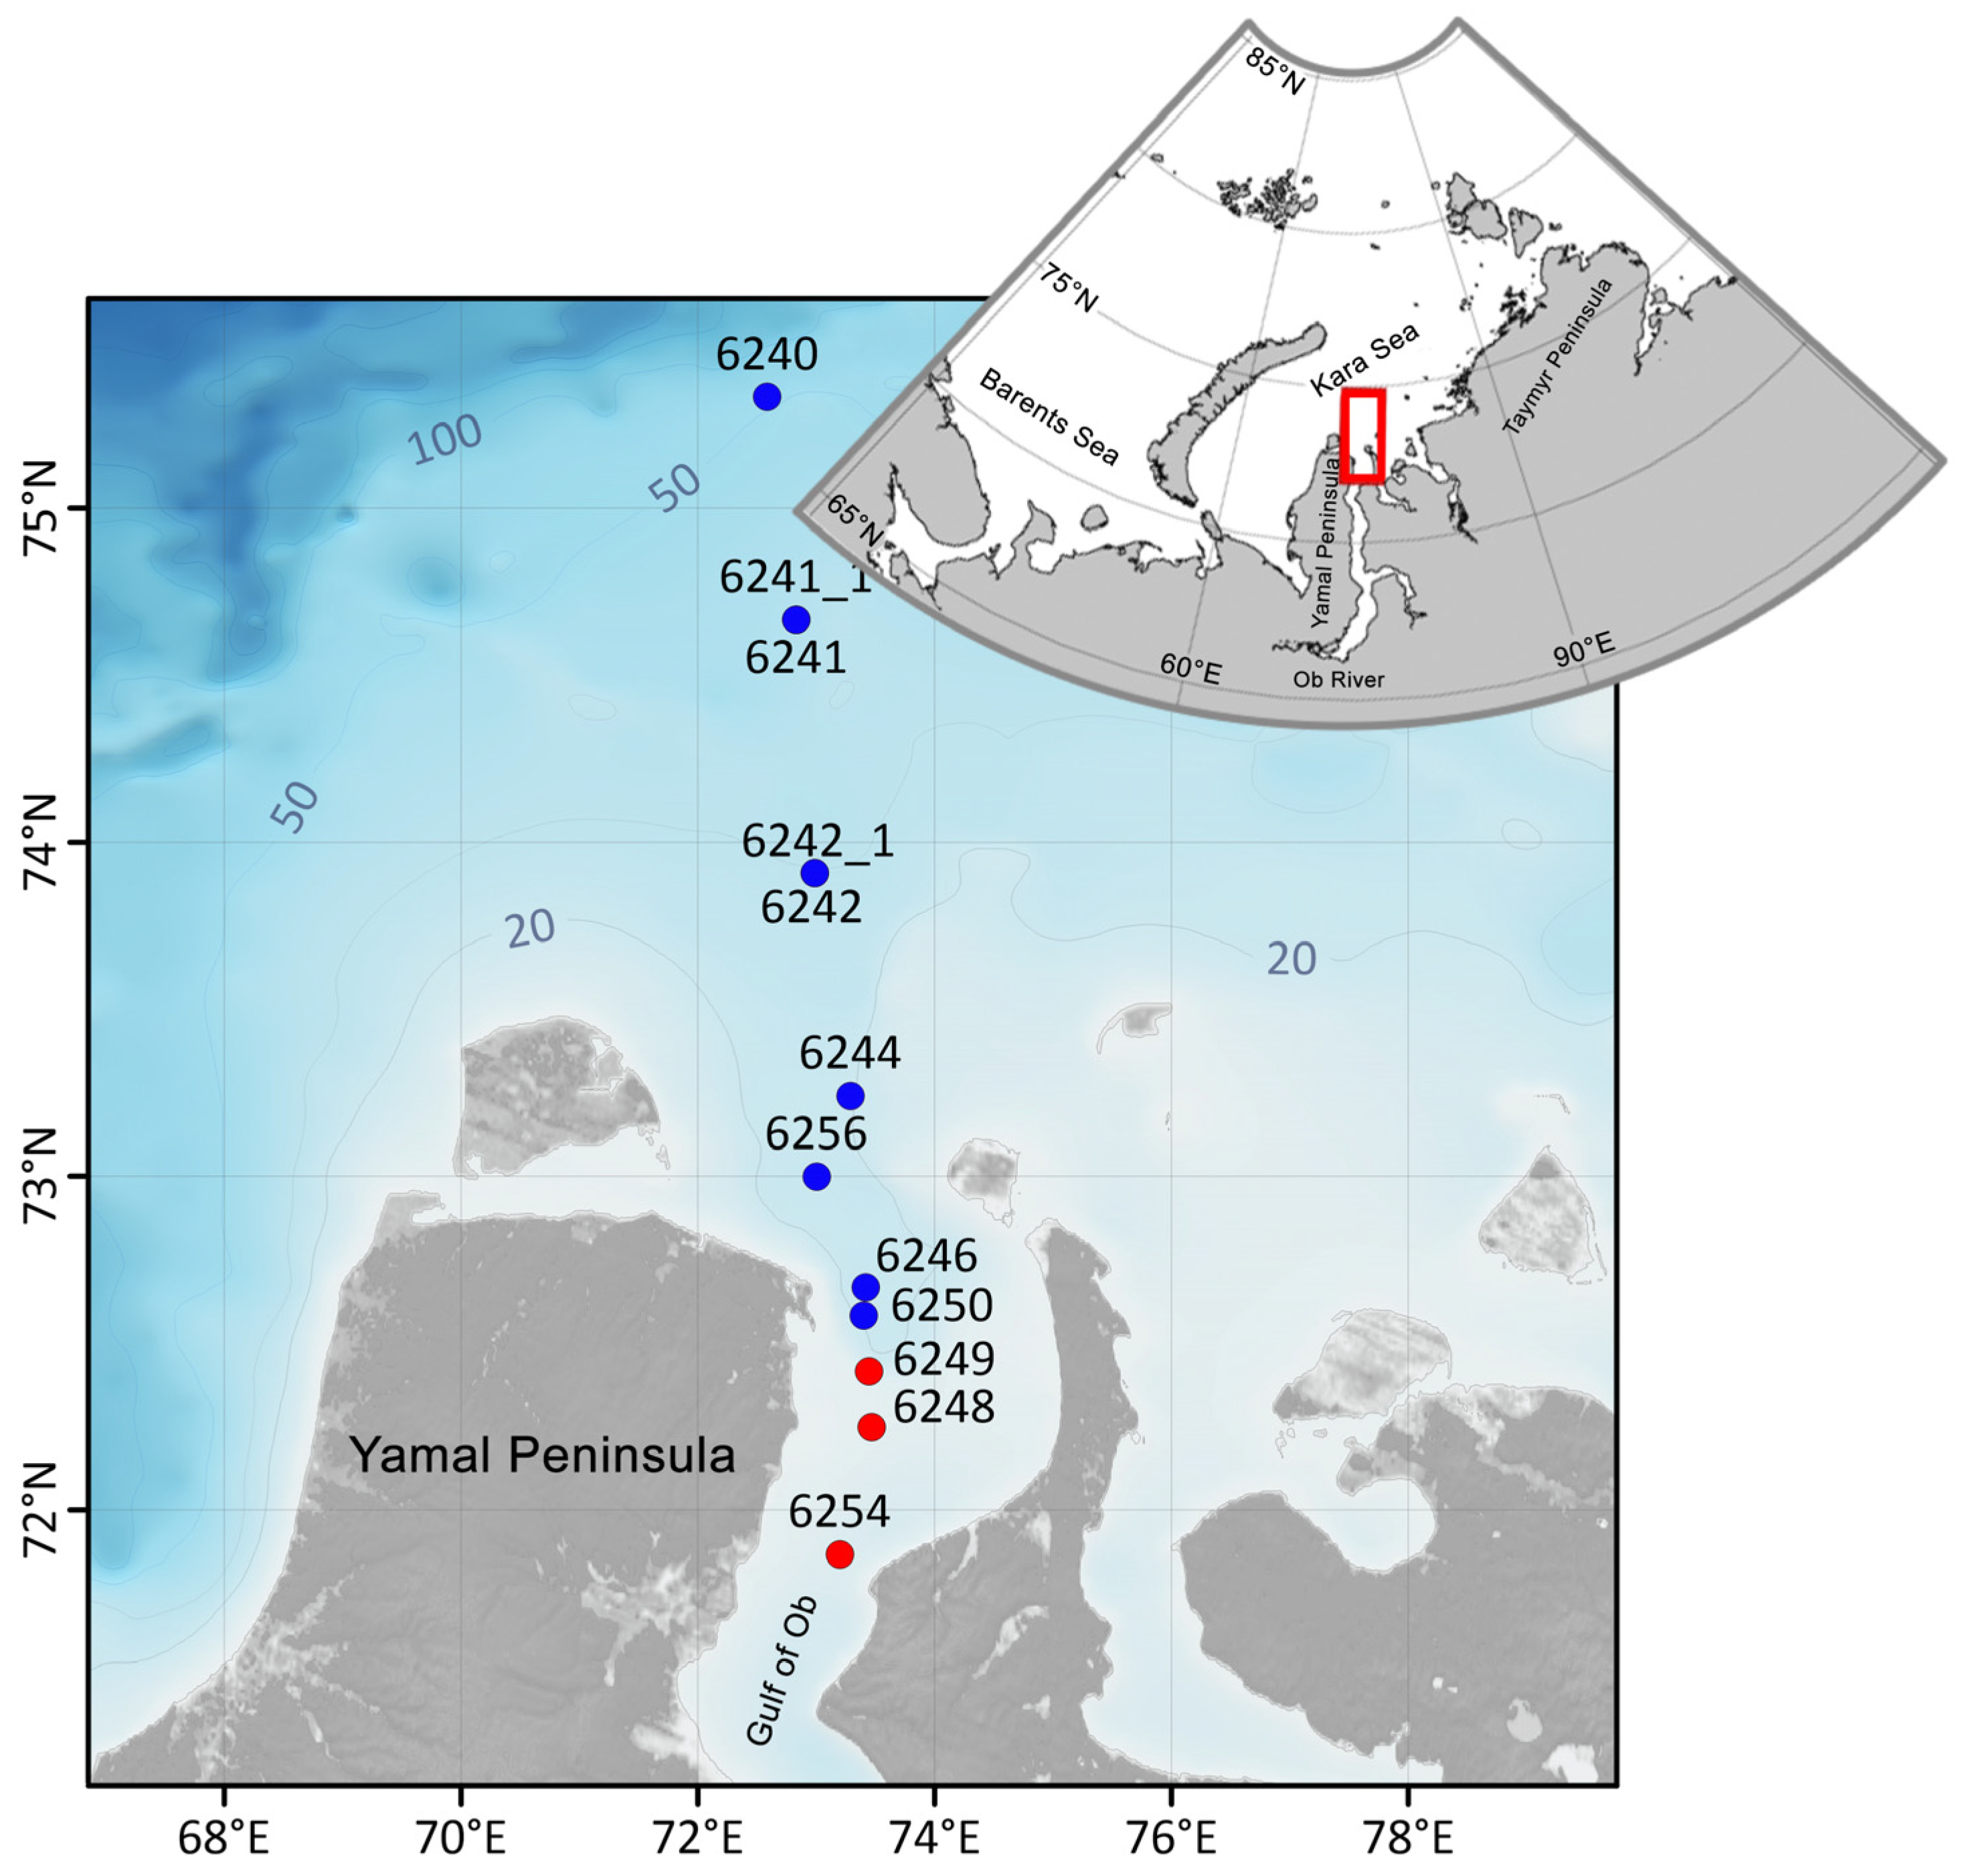
Figure 1. Map of the study area with locations of the stations. Stations in the freshwater zone (FWZ) are marked red; in the Ob frontal zone (OFZ)—blue (see in the text below).
Diversity 15 00674 g001
Figure 2. Ice retreat in the Ob Estuary in 2019 according to the satellite data https://seaice.uni-bremen.de (accessed on 19 February 2023). The hydrography of the studied area was strongly influenced by the river run-off. Changes of surface salinity and temperature along the transect are shown in Figure 3.
Diversity 15 00674 g002
Figure 3. Distribution of salinity, temperature and turbidity along the transect. Dashed line separates the freshwater zone (FWZ) from the Ob frontal zone (OFZ).
Diversity 15 00674 g003
Figure 4. Distribution of zooplankton biomass, surface (Ssur) and bottom (Sbot) salinity and temperature in the upper mixed layer (near-bottom temperature is not presented as it was about 1.5 °C at all stratified stations). Abbreviations: C. spp.—Cyclops spp., S.s.—Senecella siberica, L.m.—Limnocalanus macrurus, D.b.—Drepanopus bungei, J.t.—Jaschnovia tolli, Ps. spp.—Pseudocalanus spp., C.g.—Calanus glacialis, P.e.—Parasagitta elegans, Var—varia, FWZ—freshwater zone, OFZ—Ob frontal zone.
Diversity 15 00674 g004
Figure 5. Cluster analysis based on zooplankton abundance in the Ob Estuary area in July 2019 (a), and distribution of the distinguished groups along the transect (b). Five groups were identified from the Bray–Curtis similarity (78%). Raw data presented in Table S2.
Diversity 15 00674 g005
Figure 6. Vertical distribution of biomass of the dominant species (B, mg DW m−3), temperature (T °C), salinity (S) and Chlorophyll a (Chl, mg m−3). Abbreviations as in Figure 4.
Diversity 15 00674 g006
Figure 7. Species-conditional triplot based on a canonical correspondence analysis of abundance of the dominant zooplankton species with respect to the environmental variables. T–temperature, S–salinity, Chl–chlorophyll a concentration in the water column, other abbreviations as in Figure 4.
Diversity 15 00674 g007
Figure 8. Demographic structure: (a) relative abundance of each copepodite stage as percent of total population abundance; and (b) Development Stage Index (DSI) of the populations of the dominant zooplankton species in the freshwater zone (FWZ) and Ob frontal zone (OFZ). Abbreviations as in Figure 4.
Diversity 15 00674 g008
Figure 9. Grazing of dominant zooplankton species in terms of Chl a (Echl), bars. Lines: daily grazing impact on phytoplankton standing stock (Echl, %). Other abbreviations as in Figure 4.
Diversity 15 00674 g009
Figure 10. Inter-annual variation in the timing of ice retreat from the Ob Estuary based on the analysis of the satellite data “http://seaice.uni-bremen.de (accessed 22 February 2023)”.
Diversity 15 00674 g010
Figure 11. Demographic structure: (a) relative abundance of each copepodite stage as percent of total population abundance; and (b) Development Stage Index (DSI) of the populations of the dominant zooplankton species in the Ob Estuary area in July 2016. Abbreviations as in Figure 4.
Diversity 15 00674 g011
Table 1. Sampling details and environmental characteristics at the studied stations. IR—irradiance at the surface (E m−2 s−1), Chl a−mean concentration of chlorophyll a in the water column. Stations where IR was <0.1 E m−2 s−1 were considered as “night” stations, stations with IR > 0.1 Ein m−2 s−1—as “day” stations.
StationDateTimeIR
(E m−2 s−1)
Depth (m)Layer (m)Chl a (mg m−3)
625416.0723:500.04180–151.97
624816.0708:200.36130–101.74
624916.0710:200.46120–8-
625016.0712:200.51170–5, 5–140.65
624616.0700:300.04230–5; 5–180.41
625617.0713:300.69290–5, 5–10, 10–250.41
624415.0715:200.63220–5, 5–181.80
624215.0706:300.34300–5; 5–10; 10–270.85
6242_217.0721:000.06300–5; 5–10; 10–260.76
624114.0720:050.09270–10, 10–241.67
6241_218.0702:000.13270–23-
624014.0714:100.63370–10, 10–331.79
Table 2. Gut pigment content (ng Chl ind−1) of the dominant zooplankton species in different habitats.
Fresh Water ZoneOb Frontal Zone
Species, Developmental
Stages
Above PycnoclineBelow Pycnocline
Limnocalanus macrurus nauplii0.02 ± 0.004 (3)
L. macrurus CI0.05 ± 0.02 (3)
L. macrurus CII0.31 ± 0.09 (9)0.14 ± 0.16 (6)
L. macrurus CIII0.45 ± 0.14 (7)0.23 ± 0.15 (7)
L. macrurus CIV0.69 ± 0.30 (9)0.40 ± 0.15 (10)
L. macrurus CV1.23 ± 0.39 (6)1.02 ± 0.34 (8)
L. macrurus Fem1.41 ± 0.40 (7)2.57 ± 2.01 (8)
Jashnovia tolli CII1.04 ± 0.53 (20)
J. tolii CIII 2.511.93 ± 1.76 (4)
J. tolii CIV1.79 ± 0.92 (5)4.99 ± 3.25 (8)3.88 ± 3.61 (10)
Drepanopus bungii Fem0.08 ± 0.03 (3) 0.03 ± 0.01 (8)
Senecella siberica CII–CIII0.82
Pseudocalanus major CIV–CV 0.64 ± 0.36 (10)
P. acuspis Fem 0.23 ± 0.20 (15)
P. spp. CI–CIV 0.10 ± 0.09 (6)0.04 ± 0.02 (14)
Calanus glacialis CII 0.60 ± 0.10 (3)0.60 ± 0.10 (3)
C. glacialis CIII 1.96 ± 1.34 (3)1.76 ± 1.37 (8)
C. glacialis CIV 6.12 ± 2.27 (3)3.69 ± 1.97 (5)
C. glacialis CV 20.79
Means ± SD with the number of replicates in parenthesis are given.
Table 3. Carbon content (Wc, µg C ind−1), daily carbon ingestion (Ic, µg C ind−1 d−1), specific daily ration (Ic/Wc, %), respiration rate (R, µg C ind−1 d−1) and specific metabolic expenditures (R/Wc, %) of the dominant zooplankton species in different habitats.
Species, Developmental Stage Fresh Water ZoneOb Frontal Zone
WcIcIc/WcRR/WcIcIc/WcRR/Wc
Limnocalanus macrurus CIII6.05 ± 0.71 (2)0.183.00.34 ± 0.02 (3)5.70.111.90.50 ± 0.06 (3)8.3
L. macrurus CIV12.69 ± 1.25 (3)0.282.20.50 ± 0.06 (4)3.90.191.50.83 ± 0.05 (4)6.5
L. macrurus CV26.92 ± 1.81 (3)0.491.80.88 ± 0.35 (4)3.30.491.81.31 ± 0.20 (4)4.9
L. macrurus Fem43.11 ± 9.14 (3)0.571.31.37 ± 0.04 (4)3.31.232.92.02 ± 0.02 (4)4.7
Jaschnovia tolii CIV28.80 ± 1.44 (3)1.013.50.63 ± 0.05 (4)2.22.538.80.96 ± 0.06 (4)3.3
Calanus glacialis CII9.64 ± 1.34 (3) 0.444.60.3 ± 0.02 (3)3.1
C. glacialis CIII38.18 ± 7.07 (3) 1.313.40.84 ± 0.06 (3)2.2
C. glacialis CIV101.39 ± 22.98 (3) 3.423.41.75 ± 0.04 (4)1.7
Means ± SD with the number of replicates in parenthesis are given.
Disclaimer/Publisher’s Note: The statements, opinions and data contained in all publications are solely those of the individual author(s) and contributor(s) and not of MDPI and/or the editor(s). MDPI and/or the editor(s) disclaim responsibility for any injury to people or property resulting from any ideas, methods, instructions or products referred to in the content.