
Projected Shifts in Bird Distribution in India under Climate Change


Abstract
1. Introduction
2. Materials and Methods
2.1. Species Occurrence Data
- i.
- All duplicates were discarded, that is, records occurring within a 1 × 1 km2 cell already having a given species’ record to match the spatial resolution of climatic data for all the species.
- ii.
- iii.
- iv.
- All bird species with a limited sampling area (n < 10,000, Sq KM) were excluded. This includes species with small range areas, and endemic species occurring in pelagic, coastal, or island ecosystems.
2.2. Climate Data and Climate Scenarios
2.3. Distribution Range Modelling
3. Results
3.1. Model Evaluation
3.2. Variables Contribution and Importance
3.3. Species Range Change
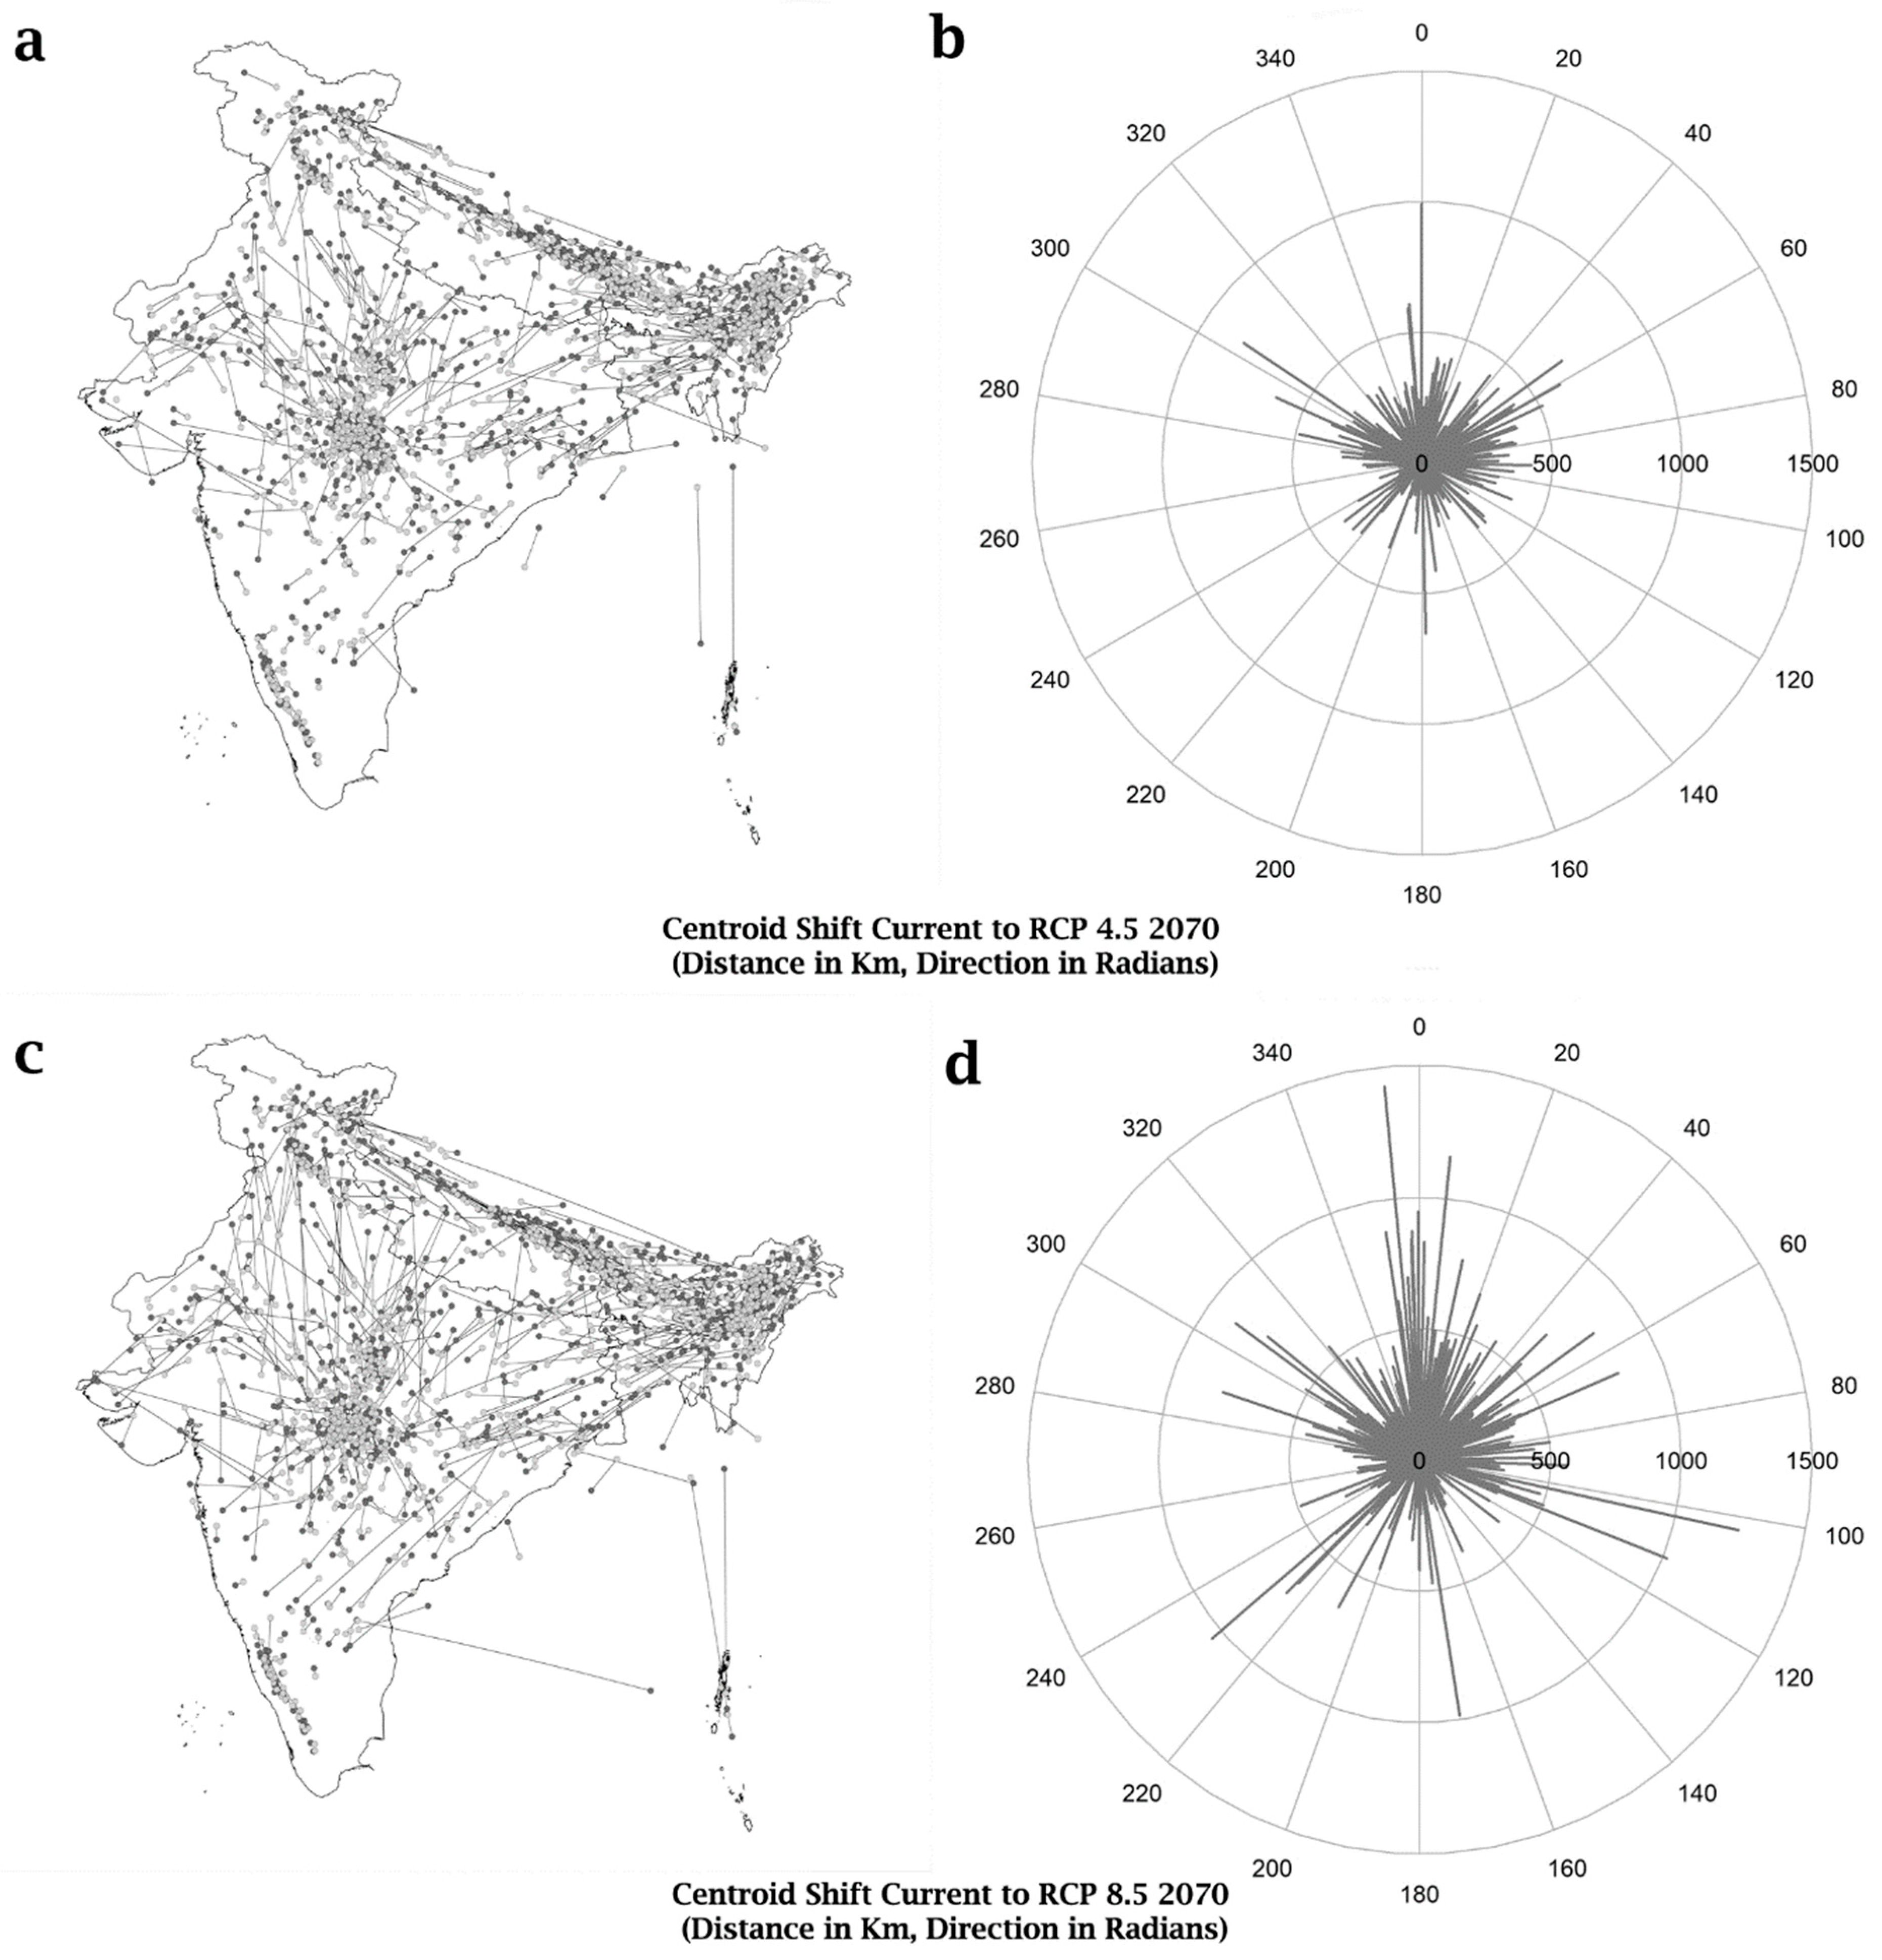
3.4. Species Range Centroid Shift
3.5. Changes in Species Richness Pattern
4. Discussion
5. Potential Limitations and Future Directions
6. Conclusions
Supplementary Materials
Author Contributions
Funding
Institutional Review Board Statement
Data Availability Statement
Acknowledgments
Conflicts of Interest
References
- Bellard, C.; Bertelsmeier, C.; Leadley, P.; Thuiller, W.; Courchamp, F. Impacts of Climate Change on the Future of Biodiversity. Ecol. Lett. 2012, 15, 365–377. [Google Scholar] [CrossRef] [PubMed]
- IPCC. Climate Change 2022: Impacts, Adaptation and Vulnerability. Working Group II Contribution to the IPCC Sixth Assessment Report; Cambridge University Press: Cambridge, UK; New York, NY, USA, 2022. [Google Scholar]
- IPCC. Climate Change 2013: The Physical Science Basis; Cambridge University Press: Cambridge, UK, 2013. [Google Scholar]
- Hu, J.; Jiang, Z.; Chen, J.; Qiao, H. Niche Divergence Accelerates Evolution in Asian Endemic Procapra Gazelles. Sci. Rep. 2015, 5, 10069. [Google Scholar] [CrossRef] [PubMed]
- IPCC. Climate Change 2007: The Physical Science Basis—Contribution of Working Group I to the Fourth Assessment Report of the Intergovernmental Panel on Climate Change; Cambridge University Press: New York, NY, USA, 2007. [Google Scholar]
- Trisos, C.H.; Merow, C.; Pigot, A.L. The Projected Timing of Abrupt Ecological Disruption from Climate Change. Nature 2020, 580, 496–501. [Google Scholar] [CrossRef] [PubMed]
- Anthelme, F.; Cavieres, L.A.; Dangles, O. Facilitation among Plants in Alpine Environments in the Face of Climate Change. Front. Plant Sci. 2014, 5, 387. [Google Scholar] [CrossRef]
- Trautmann, S. Climate Change Impacts on Bird Species. In Bird Species: How They Arise, Modify and Vanish; Tietze, D.T., Ed.; Springer International Publishing: Cham, Switzerland, 2018; pp. 217–234. ISBN 978-3-319-91689-7. [Google Scholar]
- Lameris, T.K.; Scholten, I.; Bauer, S.; Cobben, M.M.P.; Ens, B.J.; Nolet, B.A. Potential for an Arctic-Breeding Migratory Bird to Adjust Spring Migration Phenology to Arctic Amplification. Glob. Change Biol. 2017, 23, 4058–4067. [Google Scholar] [CrossRef]
- Saalfeld, S.T.; Hill, B.L.; Hunter, C.M.; Frost, C.J.; Lanctot, R.B. Warming Arctic Summers Unlikely to Increase Productivity of Shorebirds through Renesting. Sci. Rep. 2021, 11, 15277. [Google Scholar] [CrossRef]
- Bagaria, P.; Thapa, A.; Sharma, L.K.; Joshi, B.D.; Singh, H.; Sharma, C.M.; Sarma, J.; Thakur, M.; Chandra, K. Distribution Modelling and Climate Change Risk Assessment Strategy for Rare Himalayan Galliformes Species Using Archetypal Data Abundant Cohorts for Adaptation Planning. Clim. Risk Manag. 2021, 31, 100264. [Google Scholar] [CrossRef]
- Rakhimberdiev, E.; Duijns, S.; Karagicheva, J.; Camphuysen, C.J.; Dekinga, A.; Dekker, R.; Gavrilov, A.; ten Horn, J.; Jukema, J.; Saveliev, A.; et al. Fuelling Conditions at Staging Sites Can Mitigate Arctic Warming Effects in a Migratory Bird. Nat. Commun. 2018, 9, 4263. [Google Scholar] [CrossRef]
- Rapacciuolo, G.; Maher, S.P.; Schneider, A.C.; Hammond, T.T.; Jabis, M.D.; Walsh, R.E.; Iknayan, K.J.; Walden, G.K.; Oldfather, M.F.; Ackerly, D.D.; et al. Beyond a Warming Fingerprint: Individualistic Biogeographic Responses to Heterogeneous Climate Change in California. Glob. Change Biol. 2014, 20, 2841–2855. [Google Scholar] [CrossRef]
- Walther, G.R. Community and Ecosystem Responses to Recent Climate Change. Philos. Trans. R. Soc. B Biol. Sci. 2010, 365, 2019–2024. [Google Scholar] [CrossRef]
- Zhu, B.R.; Verhoeven, M.A.; Velasco, N.; Sanchez-Aguilar, L.; Zhang, Z.; Piersma, T. Current Breeding Distributions and Predicted Range Shifts under Climate Change in Two Subspecies of Black-Tailed Godwits in Asia. Glob. Change Biol. 2022, 28, 5416–5426. [Google Scholar] [CrossRef]
- Lehikoinen, A.; Virkkala, R. North by North-West: Climate Change and Directions of Density Shifts in Birds. Glob. Change Biol. 2016, 22, 1121–1129. [Google Scholar] [CrossRef]
- Barbet-Massin, M.; Jetz, W. The Effect of Range Changes on the Functional Turnover, Structure and Diversity of Bird Assemblages under Future Climate Scenarios. Glob. Change Biol. 2015, 21, 2917–2928. [Google Scholar] [CrossRef]
- Ramírez-Albores, J.E.; Prieto-Torres, D.A.; Gordillo-Martínez, A.; Sánchez-Ramos, L.E.; Navarro-Sigüenza, A.G. Insights for Protection of High Species Richness Areas for the Conservation of Mesoamerican Endemic Birds. Divers. Distrib. 2021, 27, 18–33. [Google Scholar] [CrossRef]
- Wayman, J.P.; Sadler, J.P.; Pugh, T.A.M.; Martin, T.E.; Tobias, J.A.; Matthews, T.J. Assessing Taxonomic and Functional Change in British Breeding Bird Assemblages over Time. Glob. Ecol. Biogeogr. 2022, 31, 925–939. [Google Scholar] [CrossRef]
- Pautasso, M.; Döring, T.F.; Garbelotto, M.; Pellis, L.; Jeger, M.J. Impacts of Climate Change on Plant Diseases—Opinions and Trends. Eur. J. Plant Pathol. 2012, 133, 295–313. [Google Scholar] [CrossRef]
- Morecroft, M.D.; Crick, H.Q.P.; Duffield, S.J.; Macgregor, N.A. Resilience to Climate Change: Translating Principles into Practice. J. Appl. Ecol. 2012, 49, 547–551. [Google Scholar] [CrossRef]
- Sekercioglu, C.H.; Schneider, S.H.; Fay, J.P.; Loarie, S.R. Climate Change, Elevational Range Shifts, and Bird Extinctions. Conserv. Biol. 2008, 22, 140–150. [Google Scholar] [CrossRef]
- Walther, G.R.; Post, E.; Convey, P.; Menzel, A.; Parmesan, C.; Beebee, T.J.C.; Fromentin, J.M.; Hoegh-Guldberg, O.; Bairlein, F. Ecological Responses to Recent Climate Change. Nature 2002, 416, 389–395. [Google Scholar] [CrossRef]
- Dawson, T.P.; Jackson, S.T.; House, J.I.; Prentice, I.C.; Mace, G.M. Beyond Predictions: Biodiversity Conservation in a Changing Climate. Science 2011, 332, 53–58. [Google Scholar] [CrossRef]
- McMahon, S.M.; Harrison, S.P.; Armbruster, W.S.; Bartlein, P.J.; Beale, C.M.; Edwards, M.E.; Kattge, J.; Midgley, G.; Morin, X.; Prentice, I.C. Improving Assessment and Modelling of Climate Change Impacts on Global Terrestrial Biodiversity. Trends Ecol. Evol. 2011, 26, 249–259. [Google Scholar] [CrossRef] [PubMed]
- Pereira, H.M.; Leadley, P.W.; Proença, V.; Alkemade, R.; Scharlemann, J.P.W.; Fernandez-Manjarrés, J.F.; Araújo, M.B.; Balvanera, P.; Biggs, R.; Cheung, W.W.L.; et al. Scenarios for Global Biodiversity in the 21st Century. Science 2010, 330, 1496–1501. [Google Scholar] [CrossRef] [PubMed]
- Araújo, M.B.; Thuiller, W.; Pearson, R.G. Climate Warming and the Decline of Amphibians and Reptiles in Europe. J. Biogeogr. 2006, 33, 1712–1728. [Google Scholar] [CrossRef]
- Beresford, A.E.; Buchanan, G.M.; Donald, P.F.; Butchart, S.H.M.; Fishpool, L.D.C.; Rondinini, C. Poor Overlap between the Distribution of Protected Areas and Globally Threatened Birds in Africa. Anim. Conserv. 2011, 14, 99–107. [Google Scholar] [CrossRef]
- Coetzee, B.W.T.; Robertson, M.P.; Erasmus, B.F.N.; van Rensburg, B.J.; Thuiller, W. Ensemble Models Predict Important Bird Areas in Southern Africa Will Become Less Effective for Conserving Endemic Birds under Climate Change. Glob. Ecol. Biogeogr. 2009, 18, 701–710. [Google Scholar] [CrossRef]
- Garnett, S.; Franklin, D.C. (Eds.) Climate Change Adaptation Plan for Australian Birds; CSIRO Publishing: Collingwood, VIC, Australia, 2014; ISBN 978-0-643-10802-8. [Google Scholar]
- Gill, J.A.; Alves, J.A.; Gunnarsson, T.G. Mechanisms Driving Phenological and Range Change in Migratory Species. Philos. Trans. R. Soc. B 2019, 374, 20180047. [Google Scholar] [CrossRef]
- Huntley, B.; Collingham, Y.C.; Willis, S.G.; Green, R.E. Potential Impacts of Climatic Change on European Breeding Birds. PLoS ONE 2008, 3, e1439. [Google Scholar] [CrossRef]
- Scott, D.; Lemieux, C. Climate Change and Protected Area Policy and Planning in Canada. For. Chron. 2005, 81, 696–703. [Google Scholar] [CrossRef]
- Sintayehu, D.W. Impact of Climate Change on Biodiversity and Associated Key Ecosystem Services in Africa: A Systematic Review. Ecosyst. Health Sustain. 2018, 4, 225–239. [Google Scholar] [CrossRef]
- Pandve, H. India’s National Action Plan on Climate Change. Indian J. Occup. Environ. Med. 2009, 13, 17. [Google Scholar] [CrossRef]
- Chaturvedi, R.K.; Gopalakrishnan, R.; Jayaraman, M.; Bala, G.; Joshi, N.V.; Sukumar, R.; Ravindranath, N.H. Impact of Climate Change on Indian Forests: A Dynamic Vegetation Modeling Approach. Mitig. Adapt. Strateg. Glob. Change 2011, 16, 119–142. [Google Scholar] [CrossRef]
- Maikhuri, R.K.; Phondani, P.C.; Dhyani, D.; Rawat, L.S.; Jha, N.K.; Kandari, L.S. Assessment of Climate Change Impacts and Its Implications on Medicinal Plants-Based Traditional Healthcare System in Central Himalaya, India. Iran. J. Sci. Technol. Trans. A Sci. 2018, 42, 1827–1835. [Google Scholar] [CrossRef]
- Pandey, R.; Kumar, P.; Archie, K.M.; Gupta, A.K.; Joshi, P.K.; Valente, D.; Petrosillo, I. Climate Change Adaptation in the Western-Himalayas: Household Level Perspectives on Impacts and Barriers. Ecol. Indic. 2018, 84, 27–37. [Google Scholar] [CrossRef]
- Tewari, V.P.; Verma, R.K.; von Gadow, K. Climate Change Effects in the Western Himalayan Ecosystems of India: Evidence and Strategies. For. Ecosyst. 2017, 4, 13. [Google Scholar] [CrossRef]
- Upgupta, S.; Sharma, J.; Jayaraman, M.; Kumar, V.; Ravindranath, N.H. Climate Change Impact and Vulnerability Assessment of Forests in the Indian Western Himalayan Region: A Case Study of Himachal Pradesh, India. Clim. Risk Manag. 2015, 10, 63–76. [Google Scholar] [CrossRef]
- Chhetri, B.; Badola, H.K.; Barat, S. Predicting Climate-Driven Habitat Shifting of the near Threatened Satyr Tragopan (Tragopan satyra; Galliformes) in the Himalayas. Avian Biol. Res. 2018, 11, 221–230. [Google Scholar] [CrossRef]
- Chhetri, B.; Badola, H.K.; Barat, S. Modelling Climate Change Impacts on Distribution of Himalayan Pheasants. Ecol. Indic. 2021, 123, 107368. [Google Scholar] [CrossRef]
- Jha, K.K.; Jha, R. Study of Vulture Habitat Suitability and Impact of Climate Change in Central India Using MaxEnt. J. Resour. Ecol. 2021, 12, 30–42. [Google Scholar] [CrossRef]
- Jose, V.S.; Nameer, P.O. The Expanding Distribution of the Indian Peafowl (Pavo cristatus) as an Indicator of Changing Climate in Kerala, Southern India: A Modelling Study Using MaxEnt. Ecol. Indic. 2020, 110, 105930. [Google Scholar] [CrossRef]
- Menon, S.; Peterson, A.T. Projected Climate Change Effects on Nuthatch Distribution. Raffles Bull. Zool. 2009, 57, 569–575. [Google Scholar]
- Ramesh, V.; Gopalakrishna, T.; Barve, S.; Melnick, D.J. Citizen Science Driven Species Distribution Models Estimate Drastically Smaller Range Sizes and Higher Threat Levels for Western Ghats Endemic Birds. Biol. Conserv. 2017, 210, 205–221. [Google Scholar] [CrossRef]
- Singh, H.; Kumar, N.; Kumar, M.; Singh, R. Modelling Habitat Suitability of Western Tragopan (Tragopan melanocephalus) a Range-Restricted Vulnerable Bird Species of the Himalayan Region, in Response to Climate Change. Clim. Risk Manag. 2020, 29, 100241. [Google Scholar] [CrossRef]
- Sreekumar, E.R.; Nameer, P.O. Impact of Climate Change on Two High-Altitude Restricted and Endemic Flycatchers of The Western Ghats, India. Curr. Sci. 2021, 121, 1335. [Google Scholar] [CrossRef]
- Sreekumar, E.R.; Nameer, P.O. A MaxEnt Modelling Approach to Understand the Climate Change Effects on the Distributional Range of White-Bellied Sholakili Sholicola Albiventris (Blanford, 1868) in the Western Ghats, India. Ecol. Inform. 2022, 70, 101702. [Google Scholar] [CrossRef]
- Sutton, L.J.; McClure, C.J.W.; Kini, S.; Leonardi, G. Climatic Constraints on Laggar Falcon (Falco jugger) Distribution Predicts Multidirectional Range Movements under Future Climate Change Scenarios. J. Raptor Res. 2020, 54, 1–17. [Google Scholar] [CrossRef]
- Yousefi, M.; Ahmadi, M.; Nourani, E.; Rezaei, A.; Kafash, A.; Khani, A.; Sehhatisabet, M.E.; Adibi, M.A.; Goudarzi, F.; Kaboli, M. Habitat Suitability and Impacts of Climate Change on the Distribution of Wintering Population of Asian Houbara Bustard Chlamydotis Macqueenii in Iran. Bird Conserv. Int. 2017, 27, 294–304. [Google Scholar] [CrossRef]
- Chitale, V.S.; Behera, M.D.; Roy, P.S. Future of Endemic Flora of Biodiversity Hotspots in India. PLoS ONE 2014, 9, e115264. [Google Scholar] [CrossRef]
- Ghosh, B.G.; Garai, S.; Rahaman, S.M.; Khatun, M.; Mohammad, N.; Mishra, Y.; Ranjan, A.; Tiwari, S. Assessing Potential Habitat Distribution Range of the Endangered Tree Species Pterocarpus Marsupium Roxb. Under the Climate Change Scenario in India. Trees For. People 2021, 6, 100124. [Google Scholar] [CrossRef]
- Hebbar, K.B.; Abhin, P.S.; Sanjo Jose, V.; Neethu, P.; Santhosh, A.; Shil, S.; Prasad, P.V.V. Predicting the Potential Suitable Climate for Coconut (Cocos nucifera L.) Cultivation in India under Climate Change Scenarios Using the MaxEnt Model. Plants 2022, 11, 731. [Google Scholar] [CrossRef]
- Kailash, B.R.; Charles, B.; Ravikanth, G.; Setty, S.; Kadirvelu, K. Identifying the Potential Global Distribution and Conservation Areas for Terminalia Chebula, an Important Medicinal Tree Species under Changing Climate Scenario. Trop. Ecol. 2022, 63, 584–595. [Google Scholar] [CrossRef]
- Manish, K.; Telwala, Y.; Nautiyal, D.C.; Pandit, M.K. Modelling the Impacts of Future Climate Change on Plant Communities in the Himalaya: A Case Study from Eastern Himalaya, India. Model. Earth Syst. Environ. 2016, 2, 92. [Google Scholar] [CrossRef]
- Priti, H.; Aravind, N.A.; Uma Shaanker, R.; Ravikanth, G. Modeling Impacts of Future Climate on the Distribution of Myristicaceae Species in the Western Ghats, India. Ecol. Eng. 2016, 89, 14–23. [Google Scholar] [CrossRef]
- Chatterjee, P.; Tripathy, B.; Chandra, K.; Saha, G.K.; Mondal, K. Climate Change Alarms the Survival of Near Threatened Species Malayan Giant Squirrel (Ratufa bicolor Sparrman, 1778) in India. JMAM 2020, 45, 289–302. [Google Scholar] [CrossRef]
- Kanagaraj, R.; Araujo, M.B.; Barman, R.; Davidar, P.; De, R.; Digal, D.K.; Gopi, G.V.; Johnsingh, A.J.T.; Kakati, K.; Kramer-Schadt, S.; et al. Predicting Range Shifts of Asian Elephants under Global Change. Divers. Distrib. 2019, 25, 822–838. [Google Scholar] [CrossRef]
- Fraixedas, S.; Lindén, A.; Piha, M.; Cabeza, M.; Gregory, R.; Lehikoinen, A. A State-of-the-Art Review on Birds as Indicators of Biodiversity: Advances, Challenges, and Future Directions. Ecol. Indic. 2020, 118, 106728. [Google Scholar] [CrossRef]
- Rushton, S.P.; Ormerod, S.J.; Kerby, G. New Paradigms for Modelling Species Distributions? J. Appl. Ecol. 2004, 41, 193–200. [Google Scholar] [CrossRef]
- Vogiatzakis, I.N.; Griffiths, G.H.; Mannion, A.M. Environmental Factors and Vegetation Composition, Lefka Ori Massif, Crete, S. Aegean. Glob. Ecol. Biogeogr. 2003, 12, 131–146. [Google Scholar] [CrossRef]
- Abolafya, M.; Onmuş, O.; Şekercioǧlu, Ç.H.; Bilgin, R.; Şekercioğlu, Ç.H.; Bilgin, R. Using Citizen Science Data to Model the Distributions of Common Songbirds of Turkey Under Different Global Climatic Change Scenarios. PLoS ONE 2013, 8, e68037. [Google Scholar] [CrossRef]
- Devictor, V.; Whittaker, R.J.; Beltrame, C. Beyond Scarcity: Citizen Science Programmes as Useful Tools for Conservation Biogeography. Divers. Distrib. 2010, 16, 354–362. [Google Scholar] [CrossRef]
- Fink, D.; Auer, T.; Johnston, A.; Ruiz-Gutierrez, V.; Hochachka, W.M.; Kelling, S. Modeling Avian Full Annual Cycle Distribution and Population Trends with Citizen Science Data. Ecol. Appl. 2020, 30, e02056. [Google Scholar] [CrossRef]
- Kujala, H.; Moilanen, A.; Gordon, A. Spatial Characteristics of Species Distributions as Drivers in Conservation Prioritization. Methods Ecol. Evol. 2018, 9, 1121–1132. [Google Scholar] [CrossRef]
- Moilanen, A.; Lehtinen, P.; Kohonen, I.; Jalkanen, J.; Virtanen, E.A.; Kujala, H. Novel Methods for Spatial Prioritization with Applications in Conservation, Land Use Planning and Ecological Impact Avoidance. Methods Ecol. Evol. 2022, 13, 1062–1072. [Google Scholar] [CrossRef]
- Robinson, O.J.; Ruiz-Gutierrez, V.; Fink, D. Correcting for Bias in Distribution Modelling for Rare Species Using Citizen Science Data. Divers. Distrib. 2018, 24, 460–472. [Google Scholar] [CrossRef]
- Snäll, T.; Kindvall, O.; Nilsson, J.; Pärt, T. Evaluating Citizen-Based Presence Data for Bird Monitoring. Biol. Conserv. 2011, 144, 804–810. [Google Scholar] [CrossRef]
- Wijewardhana, U.A.; Meyer, D.; Jayawardana, M. Statistical Models for the Persistence of Threatened Birds Using Citizen Science Data: A Systematic Review. Glob. Ecol. Conserv. 2020, 21, e00821. [Google Scholar] [CrossRef]
- Coxen, C.L.; Frey, J.K.; Carleton, S.A.; Collins, D.P. Species Distribution Models for a Migratory Bird Based on Citizen Science and Satellite Tracking Data. Glob. Ecol. Conserv. 2017, 11, 298–311. [Google Scholar] [CrossRef]
- Girish, K.S.; Srinivasan, U. Community Science Data Provide Evidence for Upward Elevational Range Shifts by Eastern Himalayan Birds. Biotropica 2022, 54, 1457–1465. [Google Scholar] [CrossRef]
- Hu, R.; Gu, Y.; Luo, M.; Lu, Z.; Wei, M.; Zhong, J. Shifts in Bird Ranges and Conservation Priorities in China under Climate Change. PLoS ONE 2020, 15, e0240225. [Google Scholar] [CrossRef]
- Liang, J.; Xing, W.; Zeng, G.; Li, X.; Peng, Y.; Li, X.; Gao, X.; He, X. Where Will Threatened Migratory Birds Go under Climate Change? Implications for China’s National Nature Reserves. Sci. Total Environ. 2018, 645, 1040–1047. [Google Scholar] [CrossRef]
- Peterson, A.T.; Navarro-Siguenza, A.G.; Martinez-Meyer, E.; Cuervo-Robayo, A.P.; Berlanga, H.; Soberon, J.; Navarro-Sigüenza, A.G.; Martínez-Meyer, E.; Cuervo-Robayo, A.P.; Berlanga, H.; et al. Twentieth Century Turnover of Mexican Endemic Avifaunas: Landscape Change versus Climate Drivers. Sci. Adv. 2015, 1, e1400071. [Google Scholar] [CrossRef]
- GBIF. GBIF Occurrence Download. Available online: http://www.gbif.org/ (accessed on 25 December 2021).
- eBird EBird: An Online Database of Bird Distribution and Abundance [Web Application]. Available online: http://www.ebird.org (accessed on 25 December 2021).
- Jayadevan, P.; Jayapal, R.; Pittie, A. A Checklist of the Birds of India. Indian BIRDS 2016, 11, 113–172. [Google Scholar]
- Sullivan, B.L.; Wood, C.L.; Iliff, M.J.; Bonney, R.E.; Fink, D. EBird: A Citizen-Based Bird Observation Network in the Biological Sciences. Biol. Conserv. 2009, 142, 2282–2292. [Google Scholar] [CrossRef]
- BirdLife International. BirdLife International and Handbook of the Birds of the World Bird Species Distribution Maps of the World Version 2020.1; BirdLife International: Cambridge, UK, 2020. [Google Scholar]
- Isaac, N.J.B.; van Strien, A.J.; August, T.A.; de Zeeuw, M.P.; Roy, D.B. Statistics for Citizen Science: Extracting Signals of Change from Noisy Ecological Data. Methods Ecol. Evol. 2014, 5, 1052–1060. [Google Scholar] [CrossRef]
- Lagoze, C. EBird: Curating Citizen Science Data for Use by Diverse Communities. Int. J. Digit. Curation 2014, 9, 71–82. [Google Scholar] [CrossRef]
- Radosavljevic, A.; Anderson, R.P. Making Better Maxent Models of Species Distributions: Complexity, Overfitting and Evaluation. J. Biogeogr. 2014, 41, 629–643. [Google Scholar] [CrossRef]
- Aiello-Lammens, M.E.; Boria, R.A.; Radosavljevic, A.; Vilela, B.; Anderson, R.P. SpThin: An R Package for Spatial Thinning of Species Occurrence Records for Use in Ecological Niche Models. Ecography 2015, 38, 541–545. [Google Scholar] [CrossRef]
- Van Eupen, C.; Maes, D.; Herremans, M.; Swinnen, K.R.R.; Somers, B.; Luca, S. The Impact of Data Quality Filtering of Opportunistic Citizen Science Data on Species Distribution Model Performance. Ecol. Model. 2021, 444, 109453. [Google Scholar] [CrossRef]
- Wisz, M.S.; Hijmans, R.J.; Li, J.; Peterson, A.T.; Graham, C.H.; Guisan, A.; Elith, J.; Dudík, M.; Ferrier, S.; Huettmann, F.; et al. Effects of Sample Size on the Performance of Species Distribution Models. Divers. Distrib. 2008, 14, 763–773. [Google Scholar] [CrossRef]
- Boria, R.A.; Olson, L.E.; Goodman, S.M.; Anderson, R.P. Spatial Filtering to Reduce Sampling Bias Can Improve the Performance of Ecological Niche Models. Ecol. Model. 2014, 275, 73–77. [Google Scholar] [CrossRef]
- Meyer, C.; Weigelt, P.; Kreft, H. Multidimensional Biases, Gaps and Uncertainties in Global Plant Occurrence Information. Ecol. Lett. 2016, 19, 992–1006. [Google Scholar] [CrossRef]
- Cayuela, L.; Golicher, D.J.; Newton, A.C.; Kolb, M.; de Alburquerque, F.S.; Arets, E.J.M.M.; Alkemade, J.R.M.; Pérez, A.M. Species Distribution Modeling in the Tropics: Problems, Potentialities, and the Role of Biological Data for Effective Species Conservation. Trop. Conserv. Sci. 2009, 2, 319–352. [Google Scholar] [CrossRef]
- Kramer-Schadt, S.; Niedballa, J.; Pilgrim, J.D.; Schröder, B.; Lindenborn, J.; Reinfelder, V.; Stillfried, M.; Heckmann, I.; Scharf, A.K.; Augeri, D.M.; et al. The Importance of Correcting for Sampling Bias in MaxEnt Species Distribution Models. Divers. Distrib. 2013, 19, 1366–1379. [Google Scholar] [CrossRef]
- Rocchini, D.; Hortal, J.; Lengyel, S.; Lobo, J.M.; Jiménez-Valverde, A.; Ricotta, C.; Bacaro, G.; Chiarucci, A. Accounting for Uncertainty When Mapping Species Distributions: The Need for Maps of Ignorance. Prog. Phys. Geogr. Earth Environ. 2011, 35, 211–226. [Google Scholar] [CrossRef]
- Zizka, A.; Antonelli, A.; Silvestro, D. Sampbias, a Method for Quantifying Geographic Sampling Biases in Species Distribution Data. Ecography 2021, 44, 25–32. [Google Scholar] [CrossRef]
- Hijmans, R.J.; Cameron, S.E.; Parra, J.L.; Jones, P.G.; Jarvis, A. Very High Resolution Interpolated Climate Surfaces for Global Land Areas. Int. J. Climatol. 2005, 25, 1965–1978. [Google Scholar] [CrossRef]
- Title, P.O.; Bemmels, J.B. ENVIREM: An expanded set of bioclimatic and topographic variables increases flexibility and improves performance of ecological niche modeling. Ecography 2018, 41, 291–307. [Google Scholar] [CrossRef]
- Feeley, K.J.; Bravo-Avila, C.; Fadrique, B.; Perez, T.M.; Zuleta, D. Climate-Driven Changes in the Composition of New World Plant Communities. Nat. Clim. Change 2020, 10, 965–970. [Google Scholar] [CrossRef]
- Kougioumoutzis, K.; Kokkoris, I.P.; Panitsa, M.; Kallimanis, A.; Strid, A.; Dimopoulos, P. Plant Endemism Centres and Biodiversity Hotspots in Greece. Biology 2021, 10, 72. [Google Scholar] [CrossRef]
- Lembrechts, J.J.; Nijs, I.; Lenoir, J. Incorporating Microclimate into Species Distribution Models. Ecography 2019, 42, 1267–1279. [Google Scholar] [CrossRef]
- Pecchi, M.; Marchi, M.; Burton, V.; Giannetti, F.; Moriondo, M.; Bernetti, I.; Bindi, M.; Chirici, G. Species Distribution Modelling to Support Forest Management. A Literature Review. Ecol. Model. 2019, 411, 108817. [Google Scholar] [CrossRef]
- Urbina-Cardona, N.; Blair, M.E.; Londoño, M.C.; Loyola, R.; Velásquez-Tibatá, J.; Morales-Devia, H. Species Distribution Modeling in Latin America: A 25-Year Retrospective Review. Trop. Conserv. Sci. 2019, 12, 194008291985405. [Google Scholar] [CrossRef]
- Elith, J.; Phillips, S.J.; Hastie, T.; Dudík, M.; Chee, Y.E.; Yates, C.J. A Statistical Explanation of MaxEnt for Ecologists. Divers. Distrib. 2011, 17, 43–57. [Google Scholar] [CrossRef]
- Feng, X.; Park, D.S.; Liang, Y.; Pandey, R.; Papeş, M. Collinearity in Ecological Niche Modeling: Confusions and Challenges. Ecol. Evol. 2019, 9, 10365–10376. [Google Scholar] [CrossRef]
- Harris, R.M.B.; Grose, M.R.; Lee, G.; Bindoff, N.L.; Porfirio, L.L.; Fox-Hughes, P. Climate Projections for Ecologists. Wiley Interdiscip. Rev. Clim. Change 2014, 5, 621–637. [Google Scholar] [CrossRef]
- Sanderson, B.M.; Knutti, R.; Caldwell, P. A Representative Democracy to Reduce Interdependency in a Multimodel Ensemble. J. Clim. 2015, 28, 5171–5194. [Google Scholar] [CrossRef]
- Phillips, S.J.; Anderson, R.P.; Dudík, M.; Schapire, R.E.; Blair, M.E. Opening the Black Box: An Open-Source Release of Maxent. Ecography 2017, 40, 887–893. [Google Scholar] [CrossRef]
- Phillips, S.J.; Dudík, M. Modeling of Species Distributions with Maxent: New Extensions and a Comprehensive Evaluation. Ecography 2008, 31, 161–175. [Google Scholar] [CrossRef]
- Barve, N.; Barve, V.; Jiménez-Valverde, A.; Lira-Noriega, A.; Maher, S.P.; Peterson, A.T.; Soberón, J.; Villalobos, F. The Crucial Role of the Accessible Area in Ecological Niche Modeling and Species Distribution Modeling. Ecol. Model. 2011, 222, 1810–1819. [Google Scholar] [CrossRef]
- Elith, J.; Kearney, M.; Phillips, S. The Art of Modelling Range-Shifting Species. Methods Ecol. Evol. 2010, 1, 330–342. [Google Scholar] [CrossRef]
- Kremen, C.; Cameron, A.; Moilanen, A.; Phillips, S.J.; Thomas, C.D.; Beentje, H.; Dransfield, J.; Fisher, B.L.; Glaw, F.; Good, T.C.; et al. Aligning Conservation Priorities across Taxa in Madagascar with High-Resolution Planning Tools. Science 2008, 320, 222–226. [Google Scholar] [CrossRef]
- Anderson, R.P.; Raza, A. The Effect of the Extent of the Study Region on GIS Models of Species Geographic Distributions and Estimates of Niche Evolution: Preliminary Tests with Montane Rodents (Genus Nephelomys) in Venezuela. J. Biogeogr. 2010, 37, 1378–1393. [Google Scholar] [CrossRef]
- Barber, R.A.; Ball, S.G.; Morris, R.K.A.; Gilbert, F. Target-Group Backgrounds Prove Effective at Correcting Sampling Bias in Maxent Models. Divers. Distrib. 2022, 28, 128–141. [Google Scholar] [CrossRef]
- Botella, C.; Joly, A.; Monestiez, P.; Bonnet, P.; Munoz, F. Bias in Presence-Only Niche Models Related to Sampling Effort and Species Niches: Lessons for Background Point Selection. PLoS ONE 2020, 15, e0232078. [Google Scholar] [CrossRef] [PubMed]
- Barbet-Massin, M.; Jiguet, F.; Albert, C.H.; Thuiller, W. Selecting Pseudo-Absences for Species Distribution Models: How, Where and How Many? Methods Ecol. Evol. 2012, 3, 327–338. [Google Scholar] [CrossRef]
- Inman, R.; Franklin, J.; Esque, T.; Nussear, K. Comparing Sample Bias Correction Methods for Species Distribution Modeling Using Virtual Species. Ecosphere 2021, 12, e03422. [Google Scholar] [CrossRef]
- Phillips, S.J.; Dudík, M.; Elith, J.; Graham, C.H.; Lehmann, A.; Leathwick, J.; Ferrier, S. Sample Selection Bias and Presence-Only Distribution Models: Implications for Background and Pseudo-Absence Data. Ecol. Appl. 2009, 19, 181–197. [Google Scholar] [CrossRef]
- Kass, J.M.; Muscarella, R.; Galante, P.J.; Bohl, C.L.; Pinilla-Buitrago, G.E.; Boria, R.A.; Soley-Guardia, M.; Anderson, R.P. ENMeval 2.0: Redesigned for Customizable and Reproducible Modeling of Species’ Niches and Distributions. Methods Ecol. Evol. 2021, 12, 1602–1608. [Google Scholar] [CrossRef]
- Muscarella, R.; Galante, P.J.; Soley-Guardia, M.; Boria, R.A.; Kass, J.M.; Uriarte, M.; Anderson, R.P. ENMeval: An R Package for Conducting Spatially Independent Evaluations and Estimating Optimal Model Complexity for Maxent Ecological Niche Models. Methods Ecol. Evol. 2014, 5, 1198–1205. [Google Scholar] [CrossRef]
- Kass, J.M.; Anderson, R.P.; Espinosa-Lucas, A.; Juárez-Jaimes, V.; Martínez-Salas, E.; Botello, F.; Tavera, G.; Flores-Martínez, J.J.; Sánchez-Cordero, V. Biotic Predictors with Phenological Information Improve Range Estimates for Migrating Monarch Butterflies in Mexico. Ecography 2020, 43, 341–352. [Google Scholar] [CrossRef]
- Fithian, W.; Elith, J.; Hastie, T.; Keith, D.A. Bias Correction in Species Distribution Models: Pooling Survey and Collection Data for Multiple Species. Methods Ecol. Evol. 2015, 6, 424–438. [Google Scholar] [CrossRef]
- Liu, C.; Berry, P.M.; Dawson, T.P.; Liu, R.G.P.; Berry, C.; Dawson, P.M.; Pearson, T.P.; Liu, C.; Berry, P.M.; Dawson, T.P.; et al. Selecting Thresholds of Occurrence in the Prediction of Species Distributions. Ecography 2005, 28, 385–393. [Google Scholar] [CrossRef]
- Liu, C.; White, M.; Newell, G. Selecting Thresholds for the Prediction of Species Occurrence with Presence-Only Data. J. Biogeogr. 2013, 40, 778–789. [Google Scholar] [CrossRef]
- Anderson, R.P.; Martínez-Meyer, E.; Nakamura, M.; Araújo, M.B.; Peterson, A.T.; Soberón, J.; Pearson, R.G. Ecological Niches and Geographic Distributions (MPB-49); Princeton University Press: Princeton, NJ, USA, 2011; ISBN 978-1-4008-4067-0. [Google Scholar]
- Fielding, A.H.; Bell, J.F. A Review of Methods for the Assessment of Prediction Errors in Conservation Presence/Absence Models. Environ. Conserv. 1997, 24, 38–49. [Google Scholar] [CrossRef]
- Lobo, J.M.; Jiménez-Valverde, A.; Real, R. AUC: A Misleading Measure of the Performance of Predictive Distribution Models. Glob. Ecol. Biogeogr. 2008, 17, 145–151. [Google Scholar] [CrossRef]
- Warren, D.L.; Seifert, S.N. Ecological Niche Modeling in Maxent: The Importance of Model Complexity and the Performance of Model Selection Criteria. Ecol. Appl. 2011, 21, 335–342. [Google Scholar] [CrossRef]
- Pearson, R.G.; Raxworthy, C.J.; Nakamura, M.; Townsend Peterson, A. Predicting Species Distributions from Small Numbers of Occurrence Records: A Test Case Using Cryptic Geckos in Madagascar. J. Biogeogr. 2007, 34, 102–117. [Google Scholar] [CrossRef]
- Peterson, A.T.; Papeş, M.; Soberón, J. Rethinking Receiver Operating Characteristic Analysis Applications in Ecological Niche Modeling. Ecol. Model. 2008, 213, 63–72. [Google Scholar] [CrossRef]
- Cobos, M.E.; Peterson, A.T.; Barve, N.; Osorio-Olvera, L. Kuenm: An R Package for Detailed Development of Ecological Niche Models Using Maxent. PeerJ 2019, 7, e6281. [Google Scholar] [CrossRef]
- Boyce, M.S.; Vernier, P.R.; Nielsen, S.E.; Schmiegelow, F.K.A. Evaluating Resource Selection Functions. Ecol. Model. 2002, 157, 281–300. [Google Scholar] [CrossRef]
- Hirzel, A.H.; Le Lay, G.; Helfer, V.; Randin, C.; Guisan, A. Evaluating the Ability of Habitat Suitability Models to Predict Species Presences. Ecol. Model. 2006, 199, 142–152. [Google Scholar] [CrossRef]
- Tobias, J.A.; Sheard, C.; Pigot, A.L.; Devenish, A.J.M.; Yang, J.; Sayol, F.; Neate-Clegg, M.H.C.; Alioravainen, N.; Weeks, T.L.; Barber, R.A.; et al. AVONET: Morphological, Ecological and Geographical Data for All Birds. Ecol. Lett. 2022, 25, 581–597. [Google Scholar] [CrossRef] [PubMed]
- Tobias, J.A.; Pigot, A.L. Integrating Behaviour and Ecology into Global Biodiversity Conservation Strategies. Philos. Trans. R. Soc. B 2019, 374, 20190012. [Google Scholar] [CrossRef] [PubMed]
- Dinerstein, E.; Olson, D.; Joshi, A.; Vynne, C.; Burgess, N.D.; Wikramanayake, E.; Hahn, N.; Palminteri, S.; Hedao, P.; Noss, R.; et al. An Ecoregion-Based Approach to Protecting Half the Terrestrial Realm. BioScience 2017, 67, 534–545. [Google Scholar] [CrossRef] [PubMed]
- Hanley, J.A.; McNeil, B.J. The Meaning and Use of the Area under a Receiver Operating Characteristic (ROC) Curve. Radiology 1982, 143, 29–36. [Google Scholar] [CrossRef] [PubMed]
- India Meteorological Department Climate Research and Services (CRS), Ministry of Earth Sciences (MoES). Statement on Climate of India during 2021; India Meteorological Department Climate Research and Services (CRS), Ministry of Earth Sciences (MoES): New Delhi, India, 2022. [Google Scholar]
- Dunn, R.R.; Harris, N.C.; Colwell, R.K.; Koh, L.P.; Sodhi, N.S. The Sixth Mass Coextinction: Are Most Endangered Species Parasites and Mutualists? Proc. R. Soc. B Biol. Sci. 2009, 276, 3037–3045. [Google Scholar] [CrossRef]
- Van Doren, B.M.; Conway, G.J.; Phillips, R.J.; Evans, G.C.; Roberts, G.C.M.; Liedvogel, M.; Sheldon, B.C. Human Activity Shapes the Wintering Ecology of a Migratory Bird. Glob. Change Biol. 2021, 27, 2715–2727. [Google Scholar] [CrossRef]
- Cleasby, I.R.; Bodey, T.W.; Vigfusdottir, F.; McDonald, J.L.; McElwaine, G.; Mackie, K.; Colhoun, K.; Bearhop, S. Climatic Conditions Produce Contrasting Influences on Demographic Traits in a Long-Distance Arctic Migrant. J. Anim. Ecol. 2017, 86, 285–295. [Google Scholar] [CrossRef]
- Kassara, C.; Gangoso, L.; Mellone, U.; Piasevoli, G.; Hadjikyriakou, T.G.; Tsiopelas, N.; Giokas, S.; López-López, P.; Urios, V.; Figuerola, J.; et al. Current and Future Suitability of Wintering Grounds for a Long-Distance Migratory Raptor. Sci. Rep. 2017, 7, 8798. [Google Scholar] [CrossRef]
- Liang, J.; Peng, Y.; Zhu, Z.; Li, X.; Xing, W.; Li, X.; Yan, M.; Yuan, Y. Impacts of Changing Climate on the Distribution of Migratory Birds in China: Habitat Change and Population Centroid Shift. Ecol. Indic. 2021, 127, 107729. [Google Scholar] [CrossRef]
- Wormworth, J.; Sekercioğlu, C. Winged Sentinels: Birds and Climate Change; Cambridge University Press: Port Melbourne, VIC, Australia, 2011; ISBN 978-0-521-12682-3. [Google Scholar]
- Cahill, A.E.; Aiello-Lammens, M.E.; Fisher-Reid, M.C.; Hua, X.; Karanewsky, C.J.; Yeong Ryu, H.; Sbeglia, G.C.; Spagnolo, F.; Waldron, J.B.; Warsi, O.; et al. How Does Climate Change Cause Extinction? Proc. R. Soc. B Biol. Sci. 2013, 280, 20121890. [Google Scholar] [CrossRef]
- Hannah, L.; Roehrdanz, P.R.; Marquet, P.A.; Enquist, B.J.; Midgley, G.; Foden, W.; Lovett, J.C.; Corlett, R.T.; Corcoran, D.; Butchart, S.H.M.; et al. 30% Land Conservation and Climate Action Reduces Tropical Extinction Risk by More than 50%. Ecography 2020, 43, 943–953. [Google Scholar] [CrossRef]
- Harris, G.; Pimm, S.L. Range Size and Extinction Risk in Forest Birds. Conserv. Biol. 2008, 22, 163–171. [Google Scholar] [CrossRef]
- Loiseau, N.; Mouquet, N.; Casajus, N.; Grenié, M.; Guéguen, M.; Maitner, B.; Mouillot, D.; Ostling, A.; Renaud, J.; Tucker, C.; et al. Global Distribution and Conservation Status of Ecologically Rare Mammal and Bird Species. Nat. Commun. 2020, 11, 5071. [Google Scholar] [CrossRef]
- Administrator, S. Global Patterns of Geographic Range Size in Birds. PLoS Biol. 2007, 132, e208. [Google Scholar] [CrossRef]
- Peterson, A.T.; Sánchez-Cordero, V.; Soberón, J.; Stockwell, D.R.B.; Bartley, J.; Ortega-Huerta, M.A.; Buddemeier, R.H. Future Projections for Mexican Faunas under Global Climate Change Scenarios. Nature 2002, 416, 626–629. [Google Scholar] [CrossRef]
- Wormworth, J.; Mallon, K. Bird Species and Climate Change: The Global Status Report: A Synthesis of Current Scientific Understanding of Anthropogenic Climate Change Impacts on Global Bird Species Now, and Projected Future Effects; Climate Risk Pty Ltd.: Fairlight, NSW, Australia, 2006; ISBN 978-0-646-46827-3. [Google Scholar]
- BirdLife International. State of the World’s Birds 2022: Insights and Solutions for the Biodiversity Crisis; BirdLife International: Cambridge, UK, 2022; p. 87. [Google Scholar]
- The SoIB Partnership. SoIB State of India’s Birds, 2020: Range, Trends and Conservation Status; The SoIB Partnership: Gandhinagar, India, 2020; p. 50. [Google Scholar]
- Gillings, S.; Balmer, D.E.; Fuller, R.J. Directionality of Recent Bird Distribution Shifts and Climate Change in Great Britain. Glob. Change Biol. 2015, 21, 2155–2168. [Google Scholar] [CrossRef]
- Devictor, V.; van Swaay, C.; Brereton, T.; Brotons, L.; Chamberlain, D.; Heliölä, J.; Herrando, S.; Julliard, R.; Kuussaari, M.; Lindström, Å.; et al. Differences in the Climatic Debts of Birds and Butterflies at a Continental Scale. Nat. Clim. Change 2012, 2, 121–124. [Google Scholar] [CrossRef]
- Auer, S.K.; King, D.I. Ecological and Life-History Traits Explain Recent Boundary Shifts in Elevation and Latitude of Western North American Songbirds. Glob. Ecol. Biogeogr. 2014, 23, 867–875. [Google Scholar] [CrossRef]
- Hitch, A.T.; Leberg, P.L. Breeding Distributions of North American Bird Species Moving North as a Result of Climate Change. Conserv. Biol. 2007, 21, 534–539. [Google Scholar] [CrossRef]
- Parmesan, C.; Yohe, G. A Globally Coherent Fingerprint of Climate Change Impacts across Natural Systems. Nature 2003, 421, 37–42. [Google Scholar] [CrossRef]
- Thomas, C.D.; Lennon, J.J. Birds Extend Their Ranges Northwards. Nature 1999, 399, 213. [Google Scholar] [CrossRef]
- Xu, J.; Grumbine, R.E.; Shrestha, A.; Eriksson, M.; Yang, X.; Wang, Y.; Wilkes, A. The Melting Himalayas: Cascading Effects of Climate Change on Water, Biodiversity, and Livelihoods. Conserv. Biol. 2009, 23, 520–530. [Google Scholar] [CrossRef] [PubMed]
- Aryal, A.; Shrestha, U.B.; Ji, W.; Ale, S.B.; Shrestha, S.; Ingty, T.; Maraseni, T.; Cockfield, G.; Raubenheimer, D. Predicting the Distributions of Predator (Snow Leopard) and Prey (Blue Sheep) under Climate Change in the Himalaya. Ecol. Evol. 2016, 6, 4065–4075. [Google Scholar] [CrossRef] [PubMed]
- Forrest, J.L.; Wikramanayake, E.; Shrestha, R.; Areendran, G.; Gyeltshen, K.; Maheshwari, A.; Mazumdar, S.; Naidoo, R.; Thapa, G.J.; Thapa, K. Conservation and Climate Change: Assessing the Vulnerability of Snow Leopard Habitat to Treeline Shift in the Himalaya. Biol. Conserv. 2012, 150, 129–135. [Google Scholar] [CrossRef]
- Kaul, R.; Kalsi, R.S.; Singh, R.; Basnet, H.; Awan, M.N. Cheer Pheasant (Catreus wallichii) and the Conservation Paradox: Importance of Unprotected Areas. Diversity 2022, 14, 785. [Google Scholar] [CrossRef]
- Rana, S.K.; Rawal, R.S.; Dangwal, B.; Bhatt, I.D.; Price, T.D. 200 Years of Research on Himalayan Biodiversity: Trends, Gaps, and Policy Implications. Front. Ecol. Evol. 2021, 8, 516. [Google Scholar] [CrossRef]
- Schild, A. ICIMOD’s Position on Climate Change and Mountain Systems; The Case of the Hindu Kush-Himalayas. Mt. Res. Dev. 2008, 28, 328–331. [Google Scholar] [CrossRef]
- Sharma, E.; Tse-Ring, K.; Chettri, N.; Shrestha, A. IMBC-Plenary Session 1: Climate Change and Its Implications for Mountain Biodiversity in the Himalayas-Trends, Perception and Impacts of Climate Change. In Proceedings of the International Mountain Biodiversity Conference, Kathmandu, Nepal, 16–18 November 2008. [Google Scholar]
- Shekhar, M.S.; Chand, H.; Kumar, S.; Srinivasan, K.; Ganju, A. Climate-Change Studies in the Western Himalaya. Ann. Glaciol. 2010, 51, 105–112. [Google Scholar] [CrossRef]
- Shrestha, U.B.; Shrestha, B.B. Climate Change Amplifies Plant Invasion Hotspots in Nepal. Divers. Distrib. 2019, 25, 1599–1612. [Google Scholar] [CrossRef]
- Singh, P.B.; Mainali, K.; Jiang, Z.; Thapa, A.; Subedi, N.; Awan, M.N.; Ilyas, O.; Luitel, H.; Zhou, Z.; Hu, H. Projected Distribution and Climate Refugia of Endangered Kashmir Musk Deer Moschus Cupreus in Greater Himalaya, South Asia. Sci. Rep. 2020, 10, 1511. [Google Scholar] [CrossRef]
- Telwala, Y.; Brook, B.W.; Manish, K.; Pandit, M.K. Climate-Induced Elevational Range Shifts and Increase in Plant Species Richness in a Himalayan Biodiversity Epicentre. PLoS ONE 2013, 8, e57103. [Google Scholar] [CrossRef]
- You, Q.L.; Ren, G.Y.; Zhang, Y.Q.; Ren, Y.Y.; Sun, X.B.; Zhan, Y.J.; Shrestha, A.B.; Krishnan, R. An Overview of Studies of Observed Climate Change in the Hindu Kush Himalayan (HKH) Region. Adv. Clim. Change Res. 2017, 8, 141–147. [Google Scholar] [CrossRef]
- Lawler, J.J.; Shafer, S.L.; White, D.; Kareiva, P.; Maurer, E.P.; Blaustein, A.R.; Bartlein, P.J. Projected Climate-Induced Faunal Change in the Western Hemisphere. Ecology 2009, 90, 588–597. [Google Scholar] [CrossRef]
- Jetz, W.; Thomas, G.H.; Joy, J.B.; Hartmann, K.; Mooers, A.O. The Global Diversity of Birds in Space and Time. Nature 2012, 491, 444–448. [Google Scholar] [CrossRef]
- Miller, D.A.W.; Gardner, B.; Reich, B.J.; Singh, S.; Pacifici, K.; Stauffer, G.; Mckerrow, A.; Collazo, J.A. Integrating Multiple Data Sources in Species Distribution Modeling: A Framework for Data Fusion. Ecology 2016, 98, 840–850. [Google Scholar]
- Pearce-Higgins, J.W.; Green, R.E.; Pearce-Higgins, J.W.; Green, R.E. Using Models to Predict the Effects of Climate Change on Birds. In Birds and Climate Change; Cambridge University Press: Cambridge, UK, 2014; pp. 201–249. [Google Scholar]
- Sohl, T.L. The Relative Impacts of Climate and Land-Use Change on Conterminous United States Bird Species from 2001 to 2075. PLoS ONE 2014, 9, e112251. [Google Scholar] [CrossRef]
- Blair, M.E.; Le, M.D.; Xu, M. Species Distribution Modeling to Inform Transboundary Species Conservation and Management under Climate Change: Promise and Pitfalls. Front. Biogeogr. 2022, 14, 1–11. [Google Scholar] [CrossRef]
- Sofaer, H.R.; Jarnevich, C.S.; Pearse, I.S.; Smyth, R.L.; Auer, S.; Cook, G.L.; Edwards, T.C.; Guala, G.F.; Howard, T.G.; Morisette, J.T.; et al. Development and Delivery of Species Distribution Models to Inform Decision-Making. BioScience 2019, 69, 544–557. [Google Scholar] [CrossRef]
- Hertzog, L.R.; Besnard, A.; Jay-Robert, P. Field Validation Shows Bias-Corrected Pseudo-Absence Selection Is the Best Method for Predictive Species-Distribution Modelling. Divers. Distrib. 2014, 20, 1403–1413. [Google Scholar] [CrossRef]
- Santini, L.; Benítez-López, A.; Maiorano, L.; Čengić, M.; Huijbregts, M.A.J. Assessing the Reliability of Species Distribution Projections in Climate Change Research. Divers. Distrib. 2021, 27, 1035–1050. [Google Scholar] [CrossRef]
- Early, R.; Keith, S.A. Geographically Variable Biotic Interactions and Implications for Species Ranges. Glob. Ecol. Biogeogr. 2019, 28, 42–53. [Google Scholar] [CrossRef]
- Pigot, A.L.; Tobias, J.A. Species Interactions Constrain Geographic Range Expansion over Evolutionary Time. Ecol. Lett. 2013, 16, 330–338. [Google Scholar] [CrossRef] [PubMed]


| Variable | % Importance | % Contribution |
|---|---|---|
| Terrain Wetness Index | 11.43 | 17.913 |
| Elevation | 7.0613 | 7.913 |
| Terrain Ruggedness Index | 4.553 | 5.463 |
| Precipitation Seasonality | 4.753 | 4.793 |
| Temperature Seasonality | 6.343 | 4.713 |
| Climate Change Scenarios | All (n = 1091) | Threatened (n = 64) | |||||
|---|---|---|---|---|---|---|---|
| Range Reduce | Range Expand | No Change | Range Reduce | Range Expand | No Change | ||
| RCP 4.5 2070 | n | 643 | 448 | - | 38 | 26 | - |
| r | −30.7 | 22.68 | - | −46.78 | 61.89 | - | |
| p | 58.93 | 41.06 | 59.37 | 40.62 | |||
| RCP 8.5 2070 | n | 645 | 445 | 1 | 40 | 24 | - |
| r | −40.64 | 27.89 | 0 | −59.21 | 68.41 | - | |
| p | 59.12 | 40.78 | 62.5 | 37.5 | - | ||
| Sedentary (n = 625) | Partially Migratory (n = 194) | Migratory (n = 272) | ||||||||
|---|---|---|---|---|---|---|---|---|---|---|
| Range Reduce | Range Expand | No Change | Range Reduce | Range Expand | No Change | Range Reduce | Range Expand | No Change | ||
| RCP 4.5 | n | 335 | 290 | - | 123 | 71 | - | 185 | 87 | - |
| r | −29.2 | 22.36 | - | −33.76 | 28.33 | - | −31.23 | 18.87 | - | |
| p | 53.6 | 46.4 | - | 63.40 | 36.59 | - | 68.01 | 31.98 | - | |
| RCP 8.5 | n | 338 | 287 | - | 122 | 71 | - | 185 | 87 | 1 |
| r | −40.29 | 27.84 | - | −42.78 | 30.84 | - | −39.88 | 25.66 | 0 | |
| p | 54.08 | 45.92 | - | 62.88 | 36.59 | - | 68.01 | 31.98 | - | |
| Climate Change Scenario | All (n = 1091) | Threatened (n = 64) | |||
|---|---|---|---|---|---|
| Northward | Southward | Northward | Southward | ||
| RCP 4.5 | n | 802 | 285 | 38 | 26 |
| d | 90.64 | 81.41 | 182.88 | 68.5 | |
| p | 73.51% | 26.12% | 59.37% | 40.62% | |
| RCP 8.5 | n | 727 | 355 | 36 | 26 |
| d | 135.18 | 106.29 | 193.53 | 93.37 | |
| p | 66.63% | 32.53% | 56.25% | 40.62% | |
Disclaimer/Publisher’s Note: The statements, opinions and data contained in all publications are solely those of the individual author(s) and contributor(s) and not of MDPI and/or the editor(s). MDPI and/or the editor(s) disclaim responsibility for any injury to people or property resulting from any ideas, methods, instructions or products referred to in the content. |
© 2023 by the authors. Licensee MDPI, Basel, Switzerland. This article is an open access article distributed under the terms and conditions of the Creative Commons Attribution (CC BY) license (https://creativecommons.org/licenses/by/4.0/).
Share and Cite
Deomurari, A.; Sharma, A.; Ghose, D.; Singh, R. Projected Shifts in Bird Distribution in India under Climate Change. Diversity 2023, 15, 404. https://doi.org/10.3390/d15030404
Deomurari A, Sharma A, Ghose D, Singh R. Projected Shifts in Bird Distribution in India under Climate Change. Diversity. 2023; 15(3):404. https://doi.org/10.3390/d15030404
Chicago/Turabian StyleDeomurari, Arpit, Ajay Sharma, Dipankar Ghose, and Randeep Singh. 2023. "Projected Shifts in Bird Distribution in India under Climate Change" Diversity 15, no. 3: 404. https://doi.org/10.3390/d15030404
APA StyleDeomurari, A., Sharma, A., Ghose, D., & Singh, R. (2023). Projected Shifts in Bird Distribution in India under Climate Change. Diversity, 15(3), 404. https://doi.org/10.3390/d15030404