Article

Climate Change May Pose Additional Threats to the Endangered Endemic Species Encalypta buxbaumioidea in China

1
Beijing Key Laboratory of Biodiversity and Organic Farming, College of Resources and Environmental Sciences, China Agricultural University, Beijing 100193, China
2
Resources & Environment College, Tibet Agriculture & Animal Husbandry University, Nyingchi 860000, China
3
Research Institute of Tibet Plateau Ecology, Tibet Agricultural and Animal Husbandry University, Nyingchi 860000, China
4
Key Laboratory of Herbage and Endemic Crop Biotechnology, School of Life Sciences, Inner Mongolia University, Hohhot 010020, China
*
Author to whom correspondence should be addressed.
These authors contributed equally to this work.
Diversity 2023, 15(2), 269; https://doi.org/10.3390/d15020269
Submission received: 11 January 2023 / Revised: 6 February 2023 / Accepted: 8 February 2023 / Published: 13 February 2023
(This article belongs to the Special Issue Distribution of Bryophytes in a Changing World)

Abstract

:
Rare and endangered plant species (REPs) are important in biodiversity conservation, and some REPs with narrow habitats are facing serious challenges from climate change. Encalypta buxbaumioidea T. Cao, C, Gao & X, L. Bai is an endangered bryophyte species that is endemic to China. To explore the consequences of climate change on the geographic distribution of this endangered species, we used maximum entropy to predict the potential distribution of this species in China under current and three future scenarios (RCP 2.6, RCP 4.5, and RCP 8.5) of two time periods (2050 and 2070) in China and assessed its conservation gaps. Twelve species occurrence sites and nine environmental variables were used in the modeling process. The results show that E. buxbaumioidea distribution is affected mainly by the annual mean temperature, isothermality, precipitation of the coldest quarter, and NDVI. According to species response curves, this species preferred habitats with annual mean temperature from −3 to 6 °C, precipitation of the coldest quarter from 14 to 77 mm, isothermality of more than 70%, and NDVI in the second quarter from 0.15 to 0.68. Currently, the most suitable habitat for this species is mainly distributed in the Qinghai–Tibet plateau, which is about 1.97 × 10⁵ km2. The range would sharply reduce to 0.13–0.56% under future climate change. Nature reserves overlap with only 7.32% of the current distribution and would cover a much less portion of the area occupied by the species in the future scenarios, which means the current protected areas network is insufficient. Our results show that endangered bryophyte species are susceptible to environmental stress, especially climate change; therefore, the habitats of bryophytes should be taken into account when it comes to setting up protected areas.

1. Introduction

Climate change strongly impacts the geographical distribution of species. Rare and endangered plants (REPs) are more sensitive to environmental change and are at higher risk of extinction due to their low abundance, narrow geographical distributions, and highly specific habitat requirements [1,2]. Conservation of REPs is a prerequisite and basis for biodiversity conservation. The establishment of nature reserves is currently the main form of biodiversity conservation and the primary available strategy for protecting endangered species [3,4,5]. Therefore, it is necessary to evaluate the current geographical distribution patterns and the effect of climate change on the geographical distributions of REPs in order to develop effective conservation strategies.
Species distribution models (SDMs), one of the most common methods of modeling in ecology, evolution, and conservation [6] relating species distribution data with their environmental conditions, facilitate the understanding of the correlation between species and environments. SDMs can also predict the potential distributions of species at present and under specific environmental change scenarios. MaxEnt (Maximum Entropy), a powerful algorithm method for modeling species even with few available occurrence records or inaccurate locations of species [7], has been commonly used for predicting the potential distribution areas of rare and endangered species, habitat conservation, and prioritizing protected areas under changing climates [8,9,10].
As the second largest group of land plants, bryophytes are an essential part of the Earth’s biodiversity [11] and are highly sensitive to minute changes in environmental conditions because of their morphological features, e.g., monolayer leaf cells and no true roots [12,13]. In the coming decade, bryophyte diversity and distribution patterns can be expected to be significantly affected by climate change, especially for species inhabiting high altitudes or high latitudes [14,15,16,17]. Therefore, bryophytes, especially rare and endangered species that are more vulnerable to being threatened, need to be considered in biodiversity conservation plans under global warming [18,19]. In situ conservation may be the most feasible way for biodiversity conservation in China [20]. Therefore, it is necessary to assess the geographical distribution and conservation status of endangered species under climate change in order to develop effective conservation strategies.
Encalypta buxbaumioidea T. Cao, C. Gao & X, L. Bai is one of the endemic species in China [21,22]. The plants are about 6 to 8 mm high. The leaves are long and ovate-triangular with a long, hyaline hair-point and emergent costa. The capsule is 1.6–2 mm long and 0.5 mm wide with an undifferentiated annulus and without peristomal teeth. The calyptra is large, bell-shaped, and about 2.4 mm. The seta is about 2 mm long, erect, and reddish. The spores are 31–34 μm in diameter with large, warty papillae on the distal surface. The plants mainly grow on the soil surface in shaded habitats [22,23]. To date, E. buxbaumioidea has been recorded in the Inner Mongolian plateau and the Qinghai–Tibet plateau. It is listed as an ‘endangered’ species based on its few occurrences, narrow distribution areas, and small population size [24,25].
Previous studies were limited to taxonomy, and we know little about its ecological requirements, geographical distribution, and response to climate change. In this study, we examined the type specimen of E. buxbaumioidea and built a MaxEnt model based on the information from herbarium records and 10 specimens obtained from our field surveys. Our objectives were to (1) quantify the relationship between E. buxbaumioidea presence and the selected environmental variables; (2) predict the current and future geographical distribution of E. buxbaumioidea in China; and (3) identify its conservation gaps to help provide a comprehensive picture of environmental prerequisites for the threatened species.

2. Materials and Methods

2.1. Species Occurrences Data

Our fieldwork was conducted from July to September in the period from 2012 to 2020 in the covered arid, semi-arid, semi-humid, and humid regions of Tibet that included as many vegetation types as possible. A total of 22 E. buxbaumioidea specimens were collected, including 10 specimens from Tibet and 12 specimens from 4 domestic herbariums. To avoid sampling bias and reduce the risk of spatial autocorrelation, the locations of specimens that were separated by at least 1 km were considered for modeling. Finally, 12 sets of location data were involved in the modeling (Table 1). Only two geographical populations were considered (Figure 1): one distribution in the Qinghai–Tibet plateau and the other location in the Inner Mongolian plateau. The two plateaus possess different environmental characteristics, and the environmental conditions of the species’ occurrences were assessed (Table 2).
In the Qinghai–Tibet plateau, we included eight specimens, most of which were found in Nyingchi and Qamdo in the southeastern regions, and only one specimen was collected in Shigatse in the southwestern part of Tibet. Four specimens from the Mongolian plateau, which were mainly distributed in the eastern regions in the mid-latitude prevailing subpolar westerlies with abundant wind energy resources, were used in the model. Compared with the habitats of occurrences distributed in the Mongolian plateau, localities of the species in the Qinghai–Tibet plateau had a higher altitude, a slightly lower annual temperature, and more vegetation types. Annual mean temperature and mean diurnal ranges were similar. The microhabitats were similar, which were mainly soil surfaces in shaded environments such as the shade under shrubs or trees, the slanting bottom of a stone, and the sidewall of a slope.

2.2. Environment Data

Climate data were taken from WorldClim (https://www.worldclim.org/) (accessed on 5 July 2021), including 19 bioclimatic variables in current and future scenarios. Current climatic data represent the average climatic conditions between 1970 and 2000. Future scenarios represent projected climatic conditions for 2050 and 2070. All future scenarios follow the Representative Concentration Pathway (RCPs), including RCP 2.6, RCP 4.5, and RCP 8.5, which represent the lowest, median, and highest emission scenarios, respectively [26], with the global climate models of CCSM4 (Community Climate System Model, version 4) [27]. All the climate layers were downloaded at a 1 km resolution and extracted by ArcGIS 10.2. To reduce the multicollinearity of these variables, Pearson correlation was used to analyze the 19 bioclimatic variables, and 1 of the pairs of variables with high correlation was removed (|r| ≥ 0.9). The maximum value of the satellite-derived Normalized Difference Vegetation Index (NDVI) for four quarters was downloaded from the Resource and Environment Science and Data Center (https://www.resdc.cn/data.aspx?DATAID=255) (accessed on 24 March 2021) [28]. The 20-year average of quarterly NDVI data (2000–2019) was calculated. NDVI in the second quarter (NDVI2) was selected based on Pearson correlation. In the end, nine variables (Table 3) were chosen based on an adequate characterization of the bioclimate niche of E. buxbaumioidea.

2.3. MaxEnt Model

Species distribution was predicted by Maximum Entropy Modelling (MaxEnt). A total of 25% of the occurrence data were used for model testing and 75% for model training. The recommended default values were used for the convergence threshold (10−5) and maximum iterations (500), while 10,000 background points were accepted (Phillips et al., 2006). Suitable features and regulation values used can reduce model overfitting and complexity. Feature combinations L, Q, LQ, LQH, LQHP, and LQHPT were practiced with regularizations of 0.5, 1, and 1.5 to select the optimal settings of features and regularization. Features and regularization were selected on the basis of the sample size corrected Akaike information criteria (AICc) [29].
Both threshold-independent and threshold-dependent methods were used to evaluate the predictive accuracy of the models. The threshold-independent method considered the area under the curve (AUC), which is a dominant tool in evaluating the accuracy of models. The AUC results ranged from 0 to 1, with >0.9 signifying excellent model performance. The true skill statistic (TSS), a threshold-dependent method, was also used to avoid overestimation of species presence probability by ROC [30]. The TSS values range from −1 to 1, with 1 indicating a perfect fit and 0 or less indicating a performance no better than the random model [31]. The two evaluation statistics were carried out by using the Presence-Absence package in R software [32]. The output of MaxEnt was continuous variables ranging from 0 to 1, and two thresholds were chosen [33] that divided the habitat suitability into three categories: unsuitable habitat (0–33%), moderately suitable habitat (33–67%), and highly suitable habitat (67–100%).

2.4. Gap Analysis

Conservation gaps were calculated by the overlap of nature reserves and species distributions based on the following three scenarios: current conservation gaps—the proportion of current species distribution that overlapped with nature reserves; future conservation gaps without dispersal restriction—the proportion of future distribution that overlapped with nature reserves; and future conservation gaps with dispersal restriction—the proportion of stable distribution that occurred both in current and future scenarios overlapping nature reserves. The spatial data of nature reserves were obtained from the China Nature Reserve Biospecimen Resource Sharing Platform (http://www.papc.cn/html/folder/946895-1.htm) (accessed on 27 July 2021), and we adopted the nature reserves belonging to the list of national nature reserves downloaded from the Ministry of Ecology and Environment of the People’s Republic of China. The analysis was conducted in ArcGIS 10.2.

3. Results

3.1. Model Performance and Important Environmental Variables

According to the AICc, the model with LQ features and regulation of 0.5 was selected. This model showed good performance in capturing the environmental variables at the localities of E. buxbaumioidea using the AUC value (0.9140 ± 0.0017) and TSSmax value (0.6008 ± 0.0031).
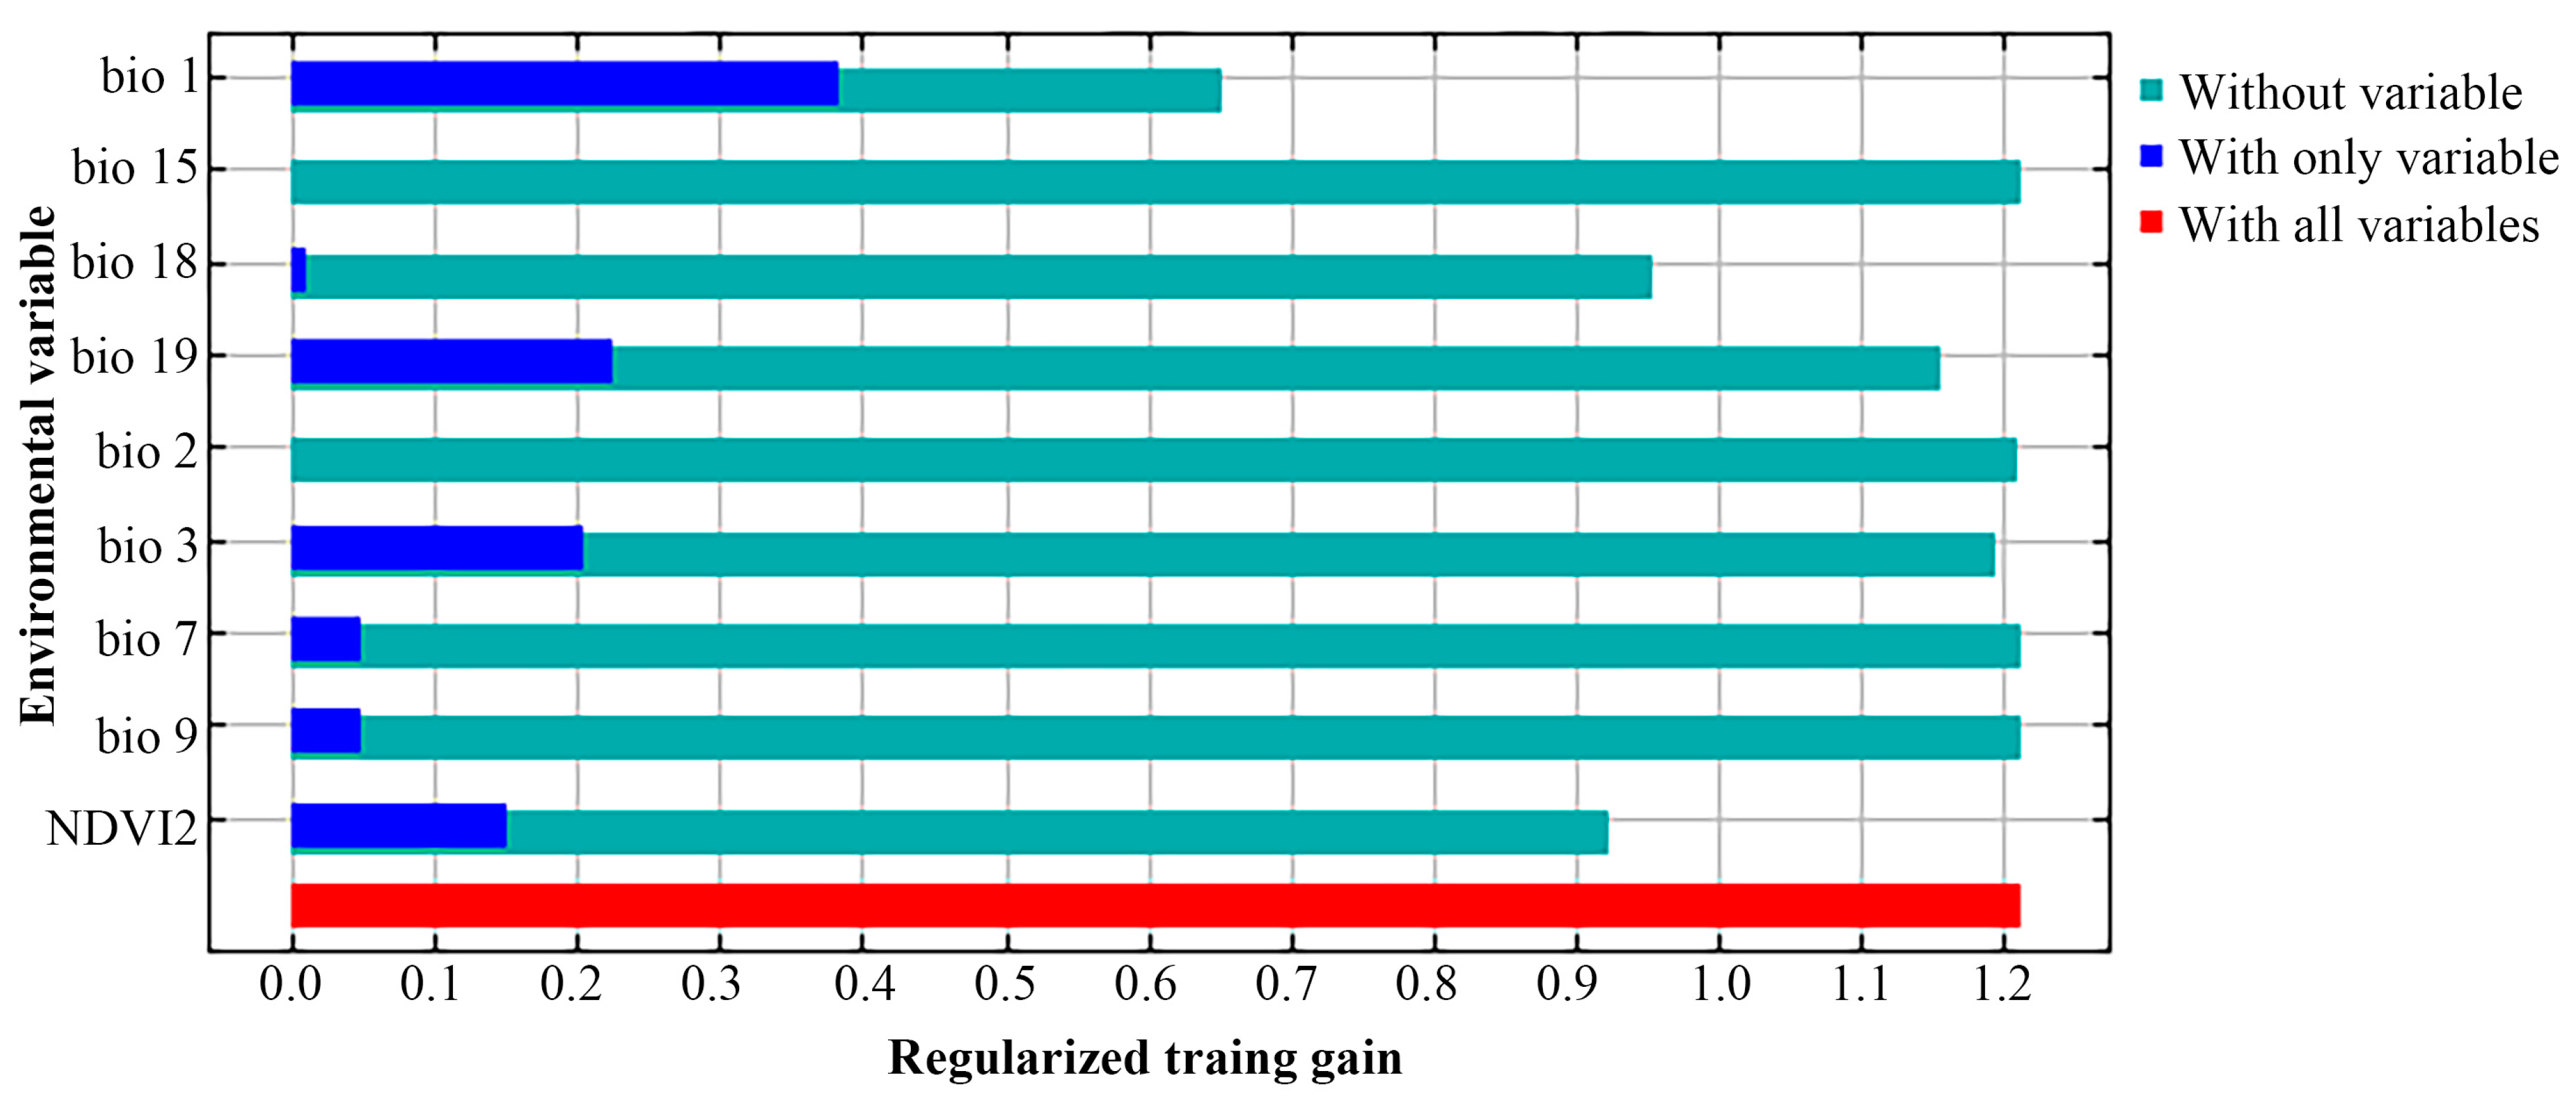
The jackknife test was performed to determine important variables influencing species’ distributions (Figure 2). The result showed that climate variables obtained higher gains than the gains from NDVI, which reflected that climate conditions may be critical to E. buxbaumioidea and strongly influence habitat suitability. Among the climatic variables involved in the model, annual mean temperature (Bio1), isothermality (Bio3), and precipitation of coldest quarter (Bio19) had high training gains when used in isolation, and possessed training gains of 0.38, 0.20, and 0.21, respectively.. As Bio1 was omitted in the variables, it would be maximum decreased in gains. NDVI in the second quarter (NDVI2) possessed training gains of 0.15 when used in isolation, which indicated that this variable also had some predictive ability.
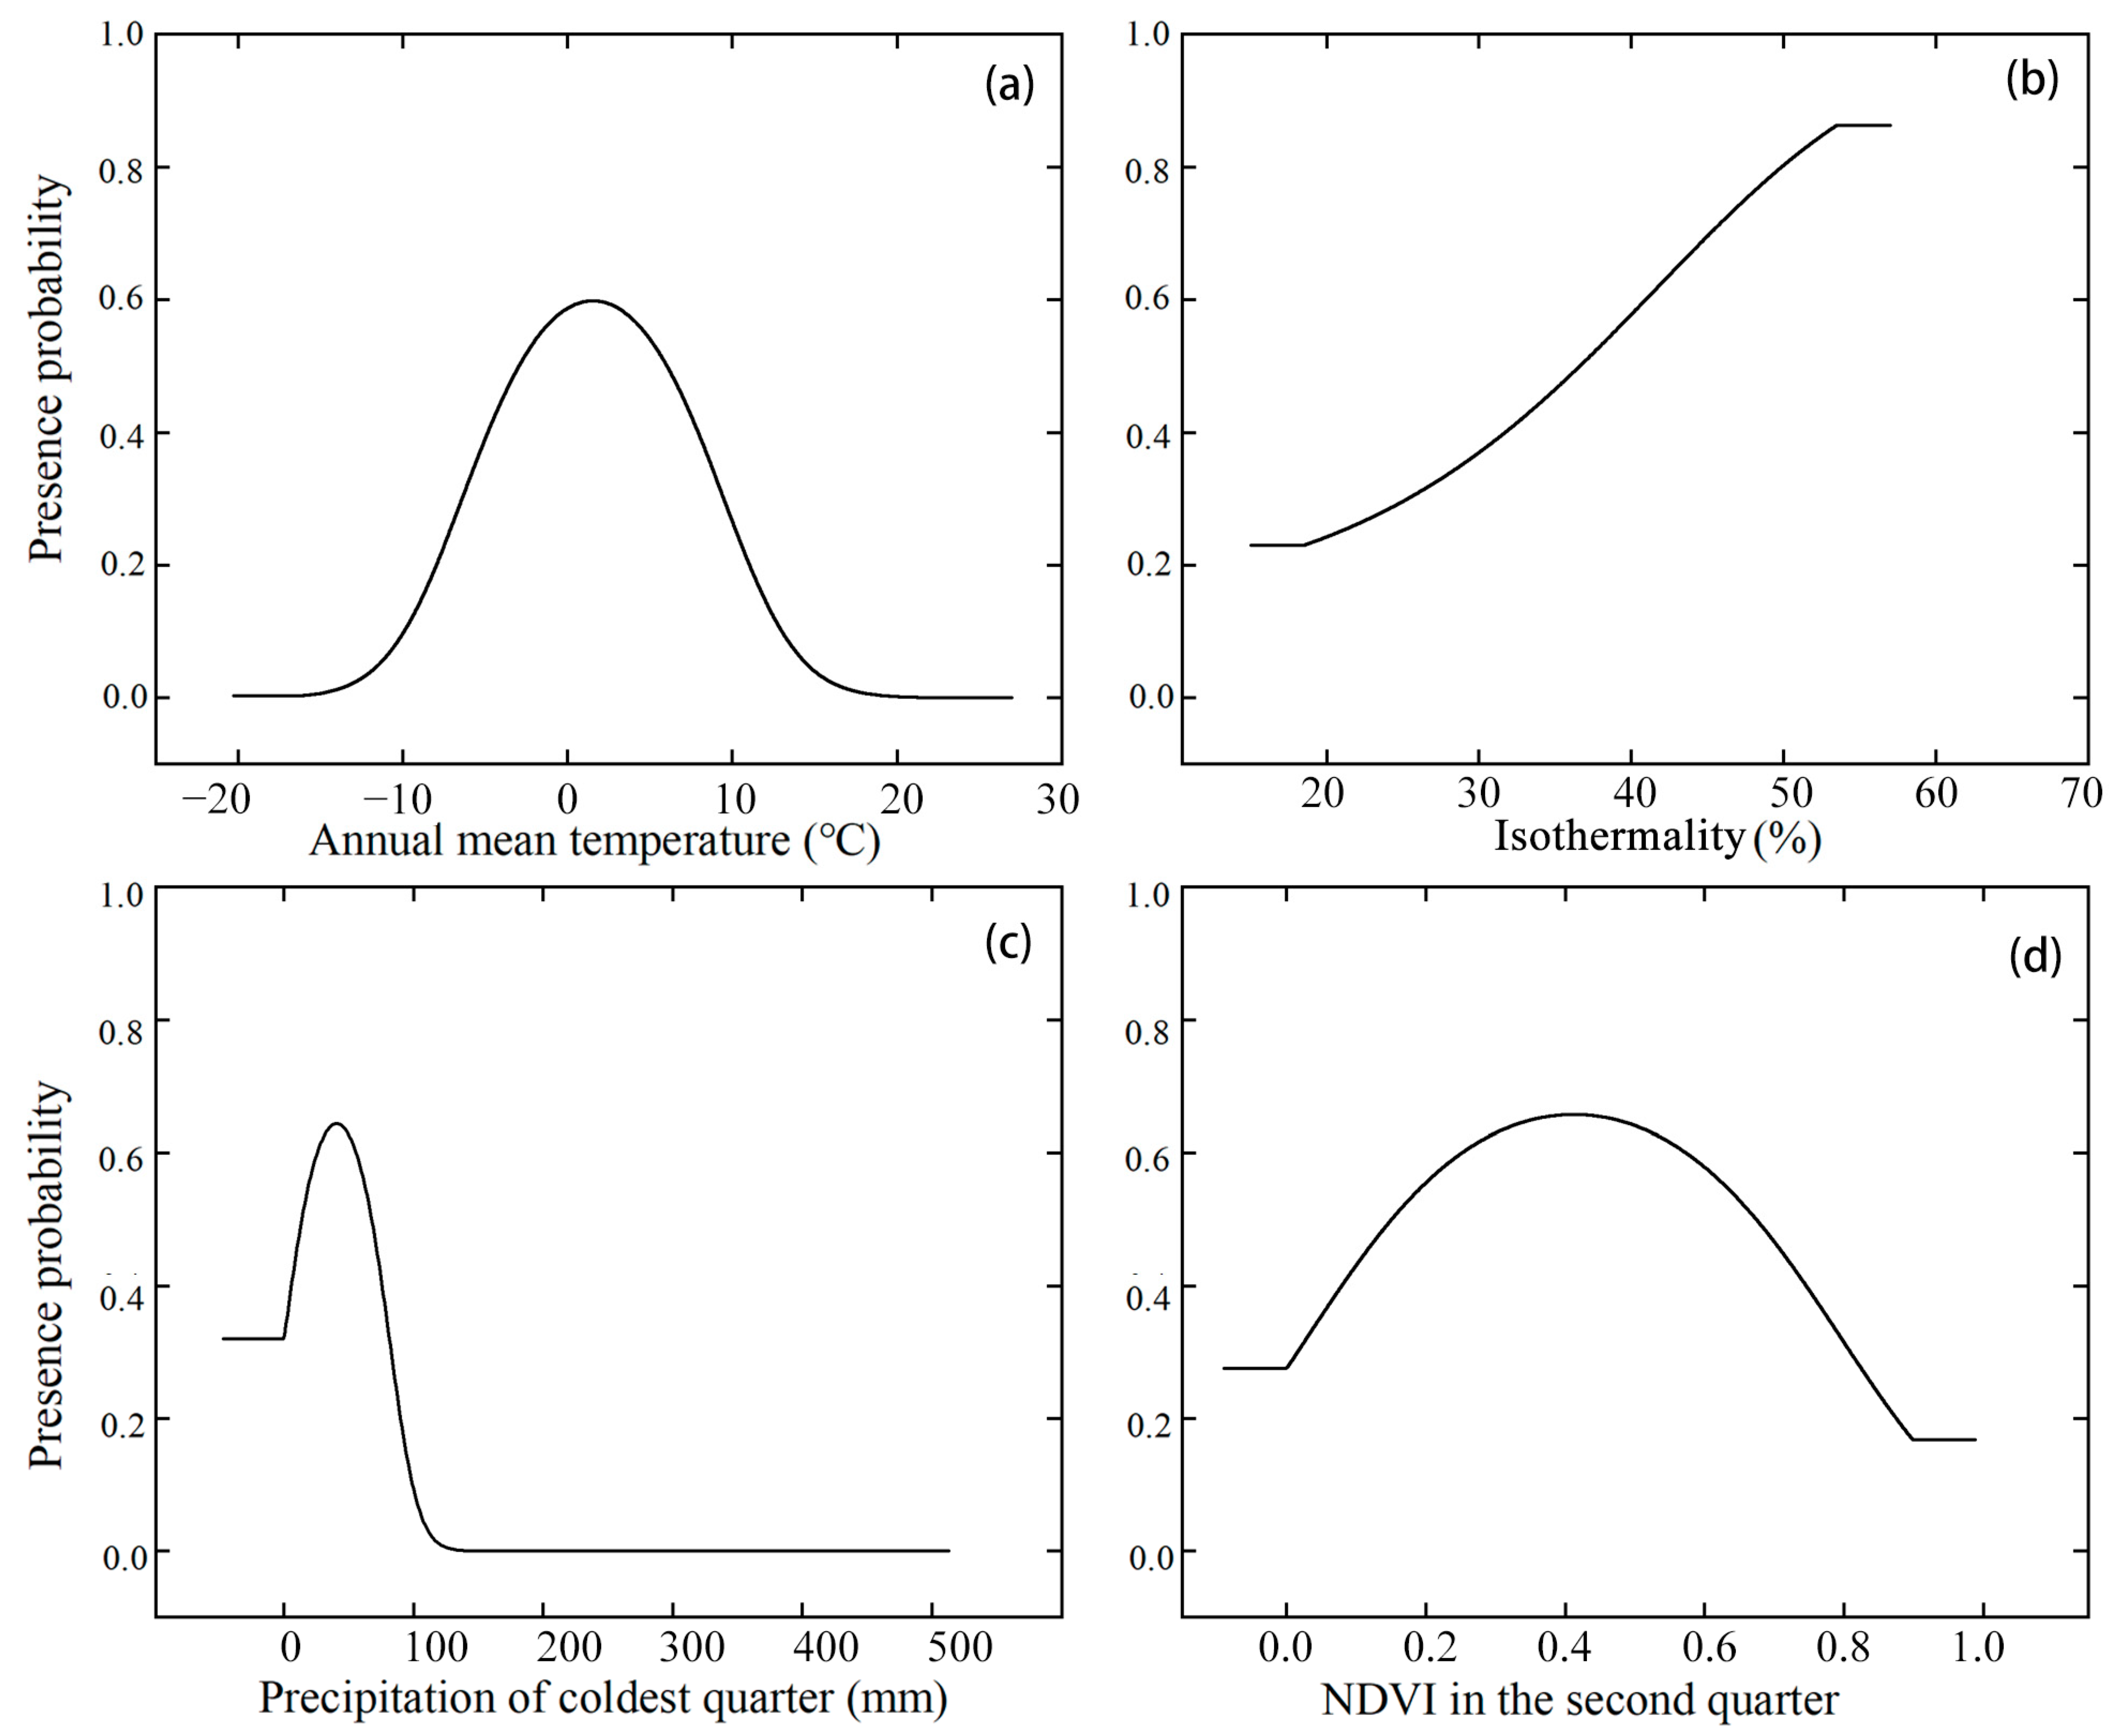
Response curves showed quantitative relationships between the logistic probability of species presence and environmental variables, which enhanced our understanding of species’ ecological niches by illustrating the effects of variables on species (Figure 3). The response curves of Bio1 and Bio19 were both single-peaked. When Bio1 was −3–6 °C and Bio19 was 14–77 mm, the presence probability of species could reach 0.5. The habitat suitability responded positively to Bio3. When the variable was more than 37%, the presence probability of species could reach 0.5. When NDVI2 was 0.15–0.68, the presence probability of species could reach 0.5.

3.2. Species Distribution of Current Climate Scenario

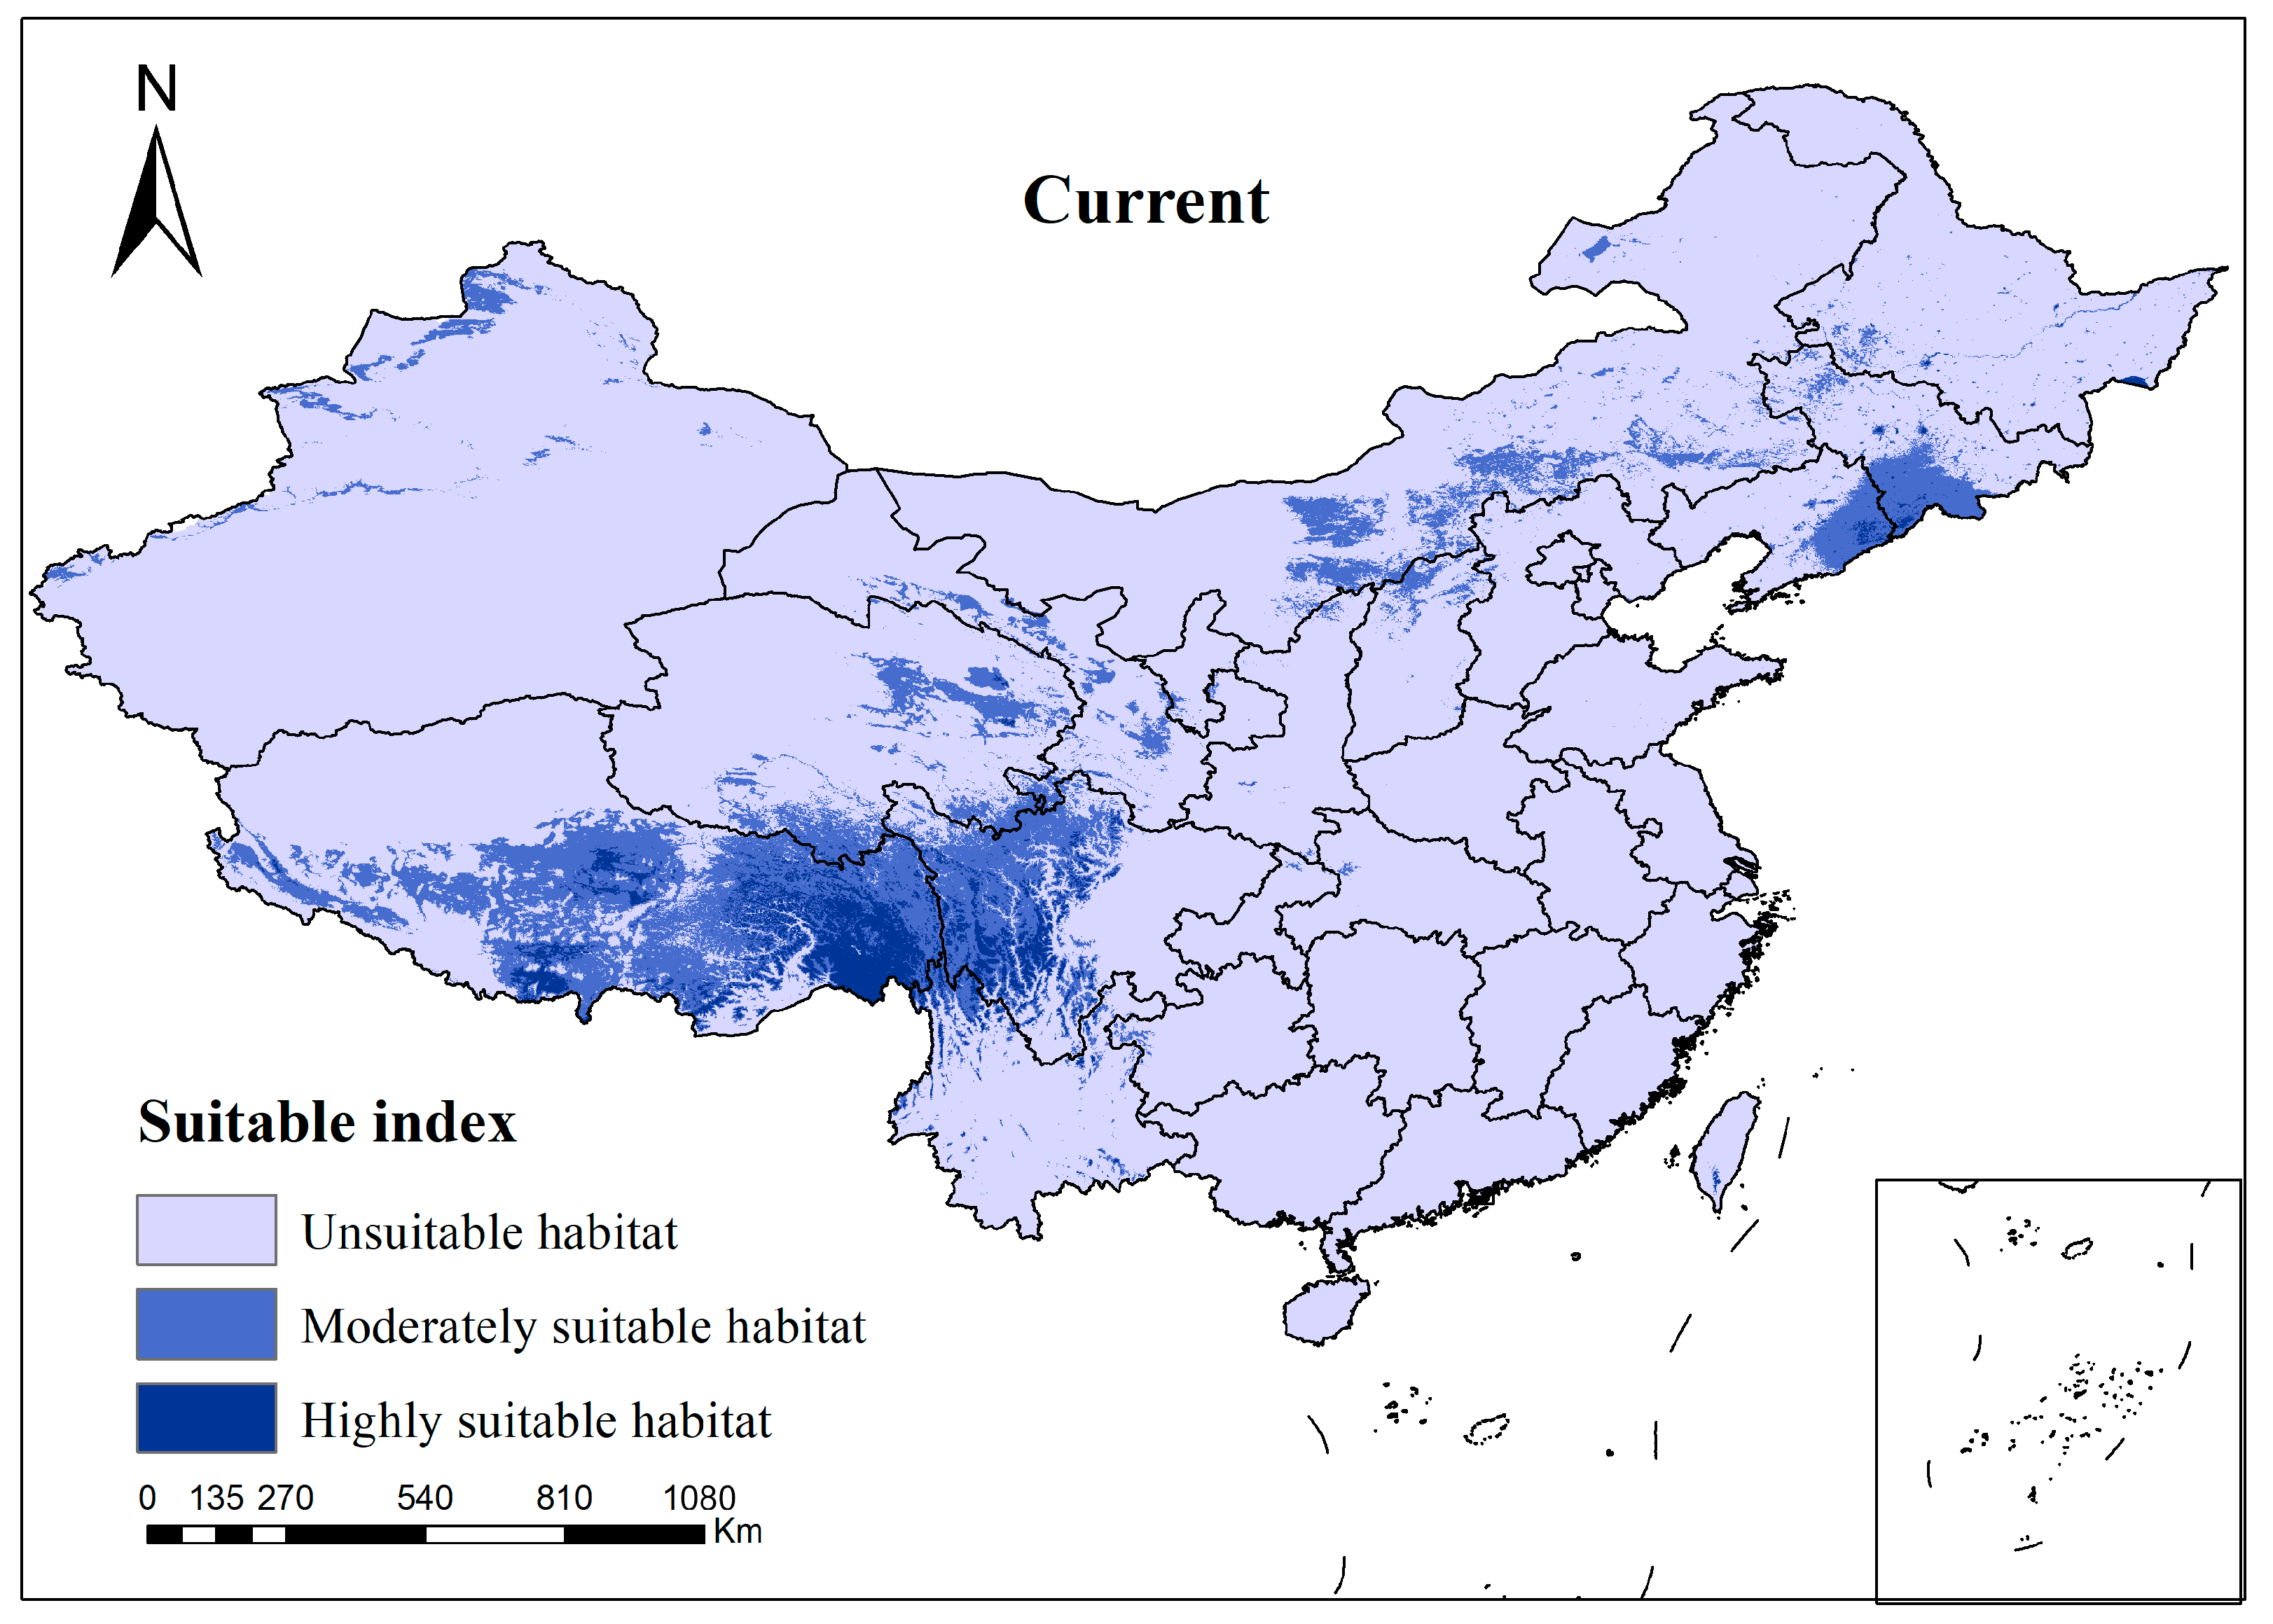
The current distribution of E. buxbaumioidea is divided into three categories (Figure 4). This endemic species has a moderately suitable habitat of 1.02 × 10⁶ km2, which is 10.64% of China’s land area, and is mainly distributed in the Qinghai–Tibet plateau, Inner Mongolian plateau, northeastern region, and northern Xinjiang province. Its highly suitable habitat is about 1.97 × 10⁵ km2, which accounts for 2.05% of China’s land area. Highly suitable habitat is mainly distributed in the Qinghai–Tibet plateau, though some is found in the northeastern region and southern Yunan-Guizhou plateau.

3.3. Species Distribution Change under Future Scenarios

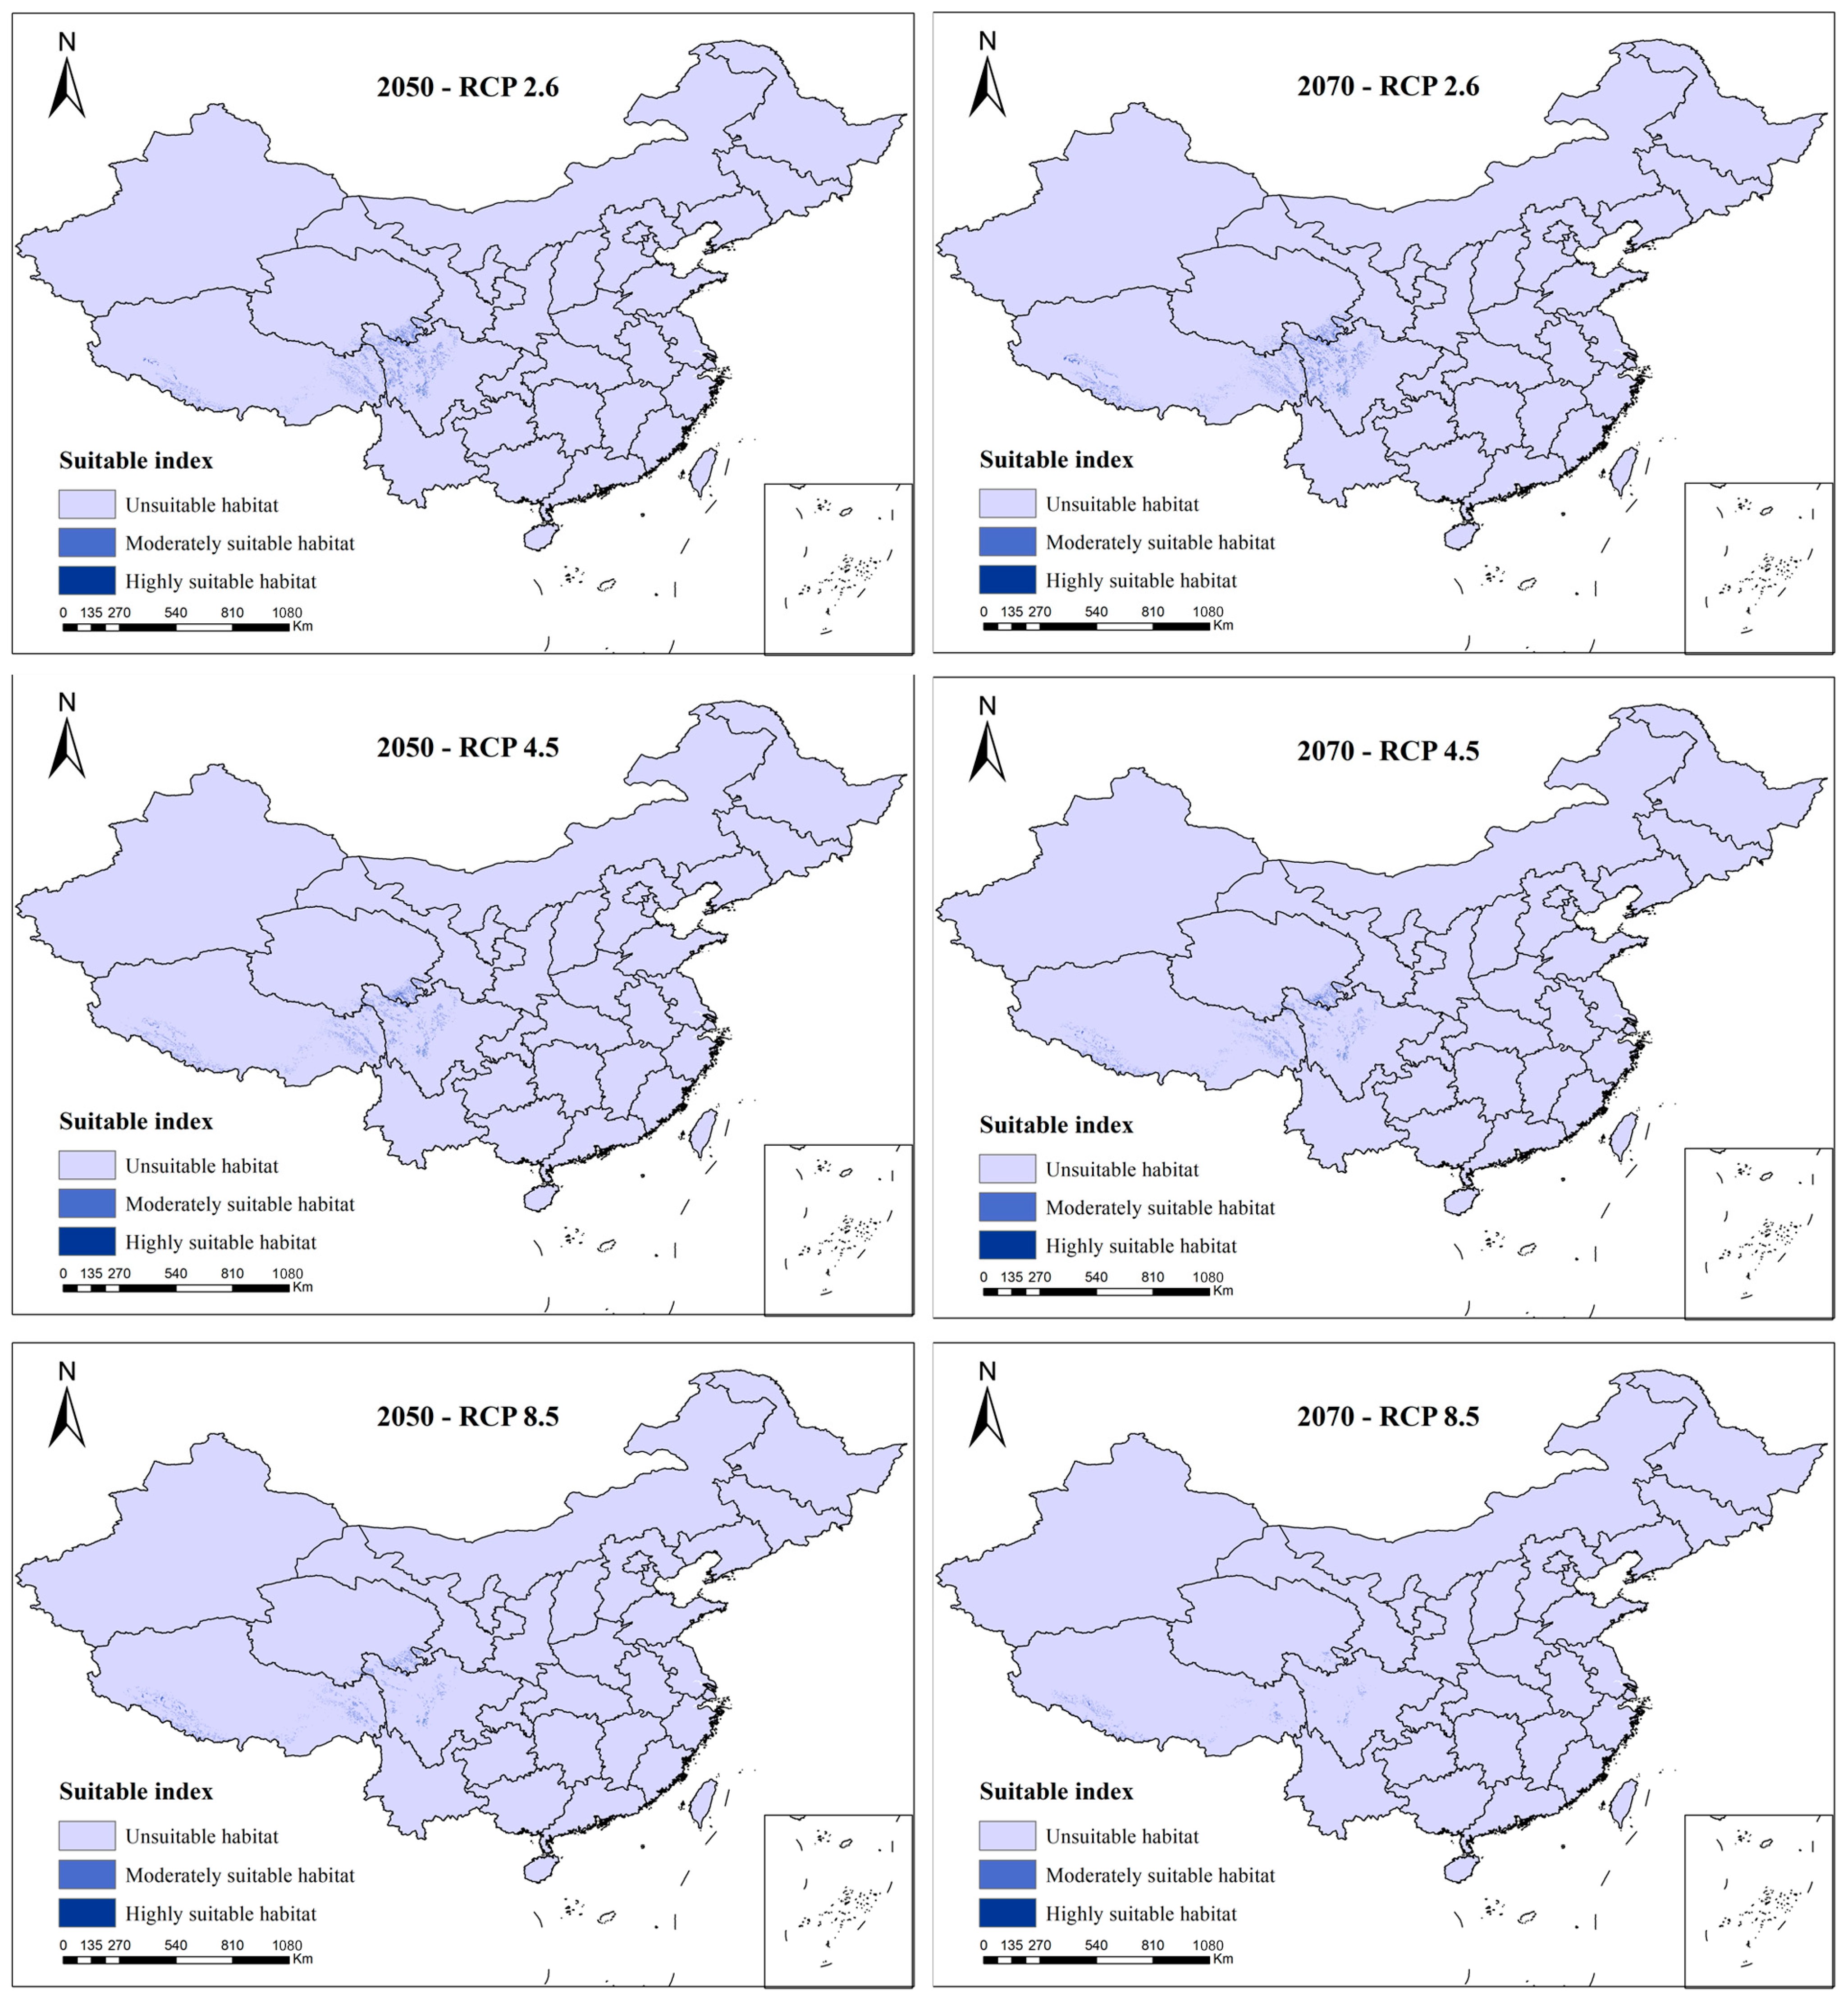
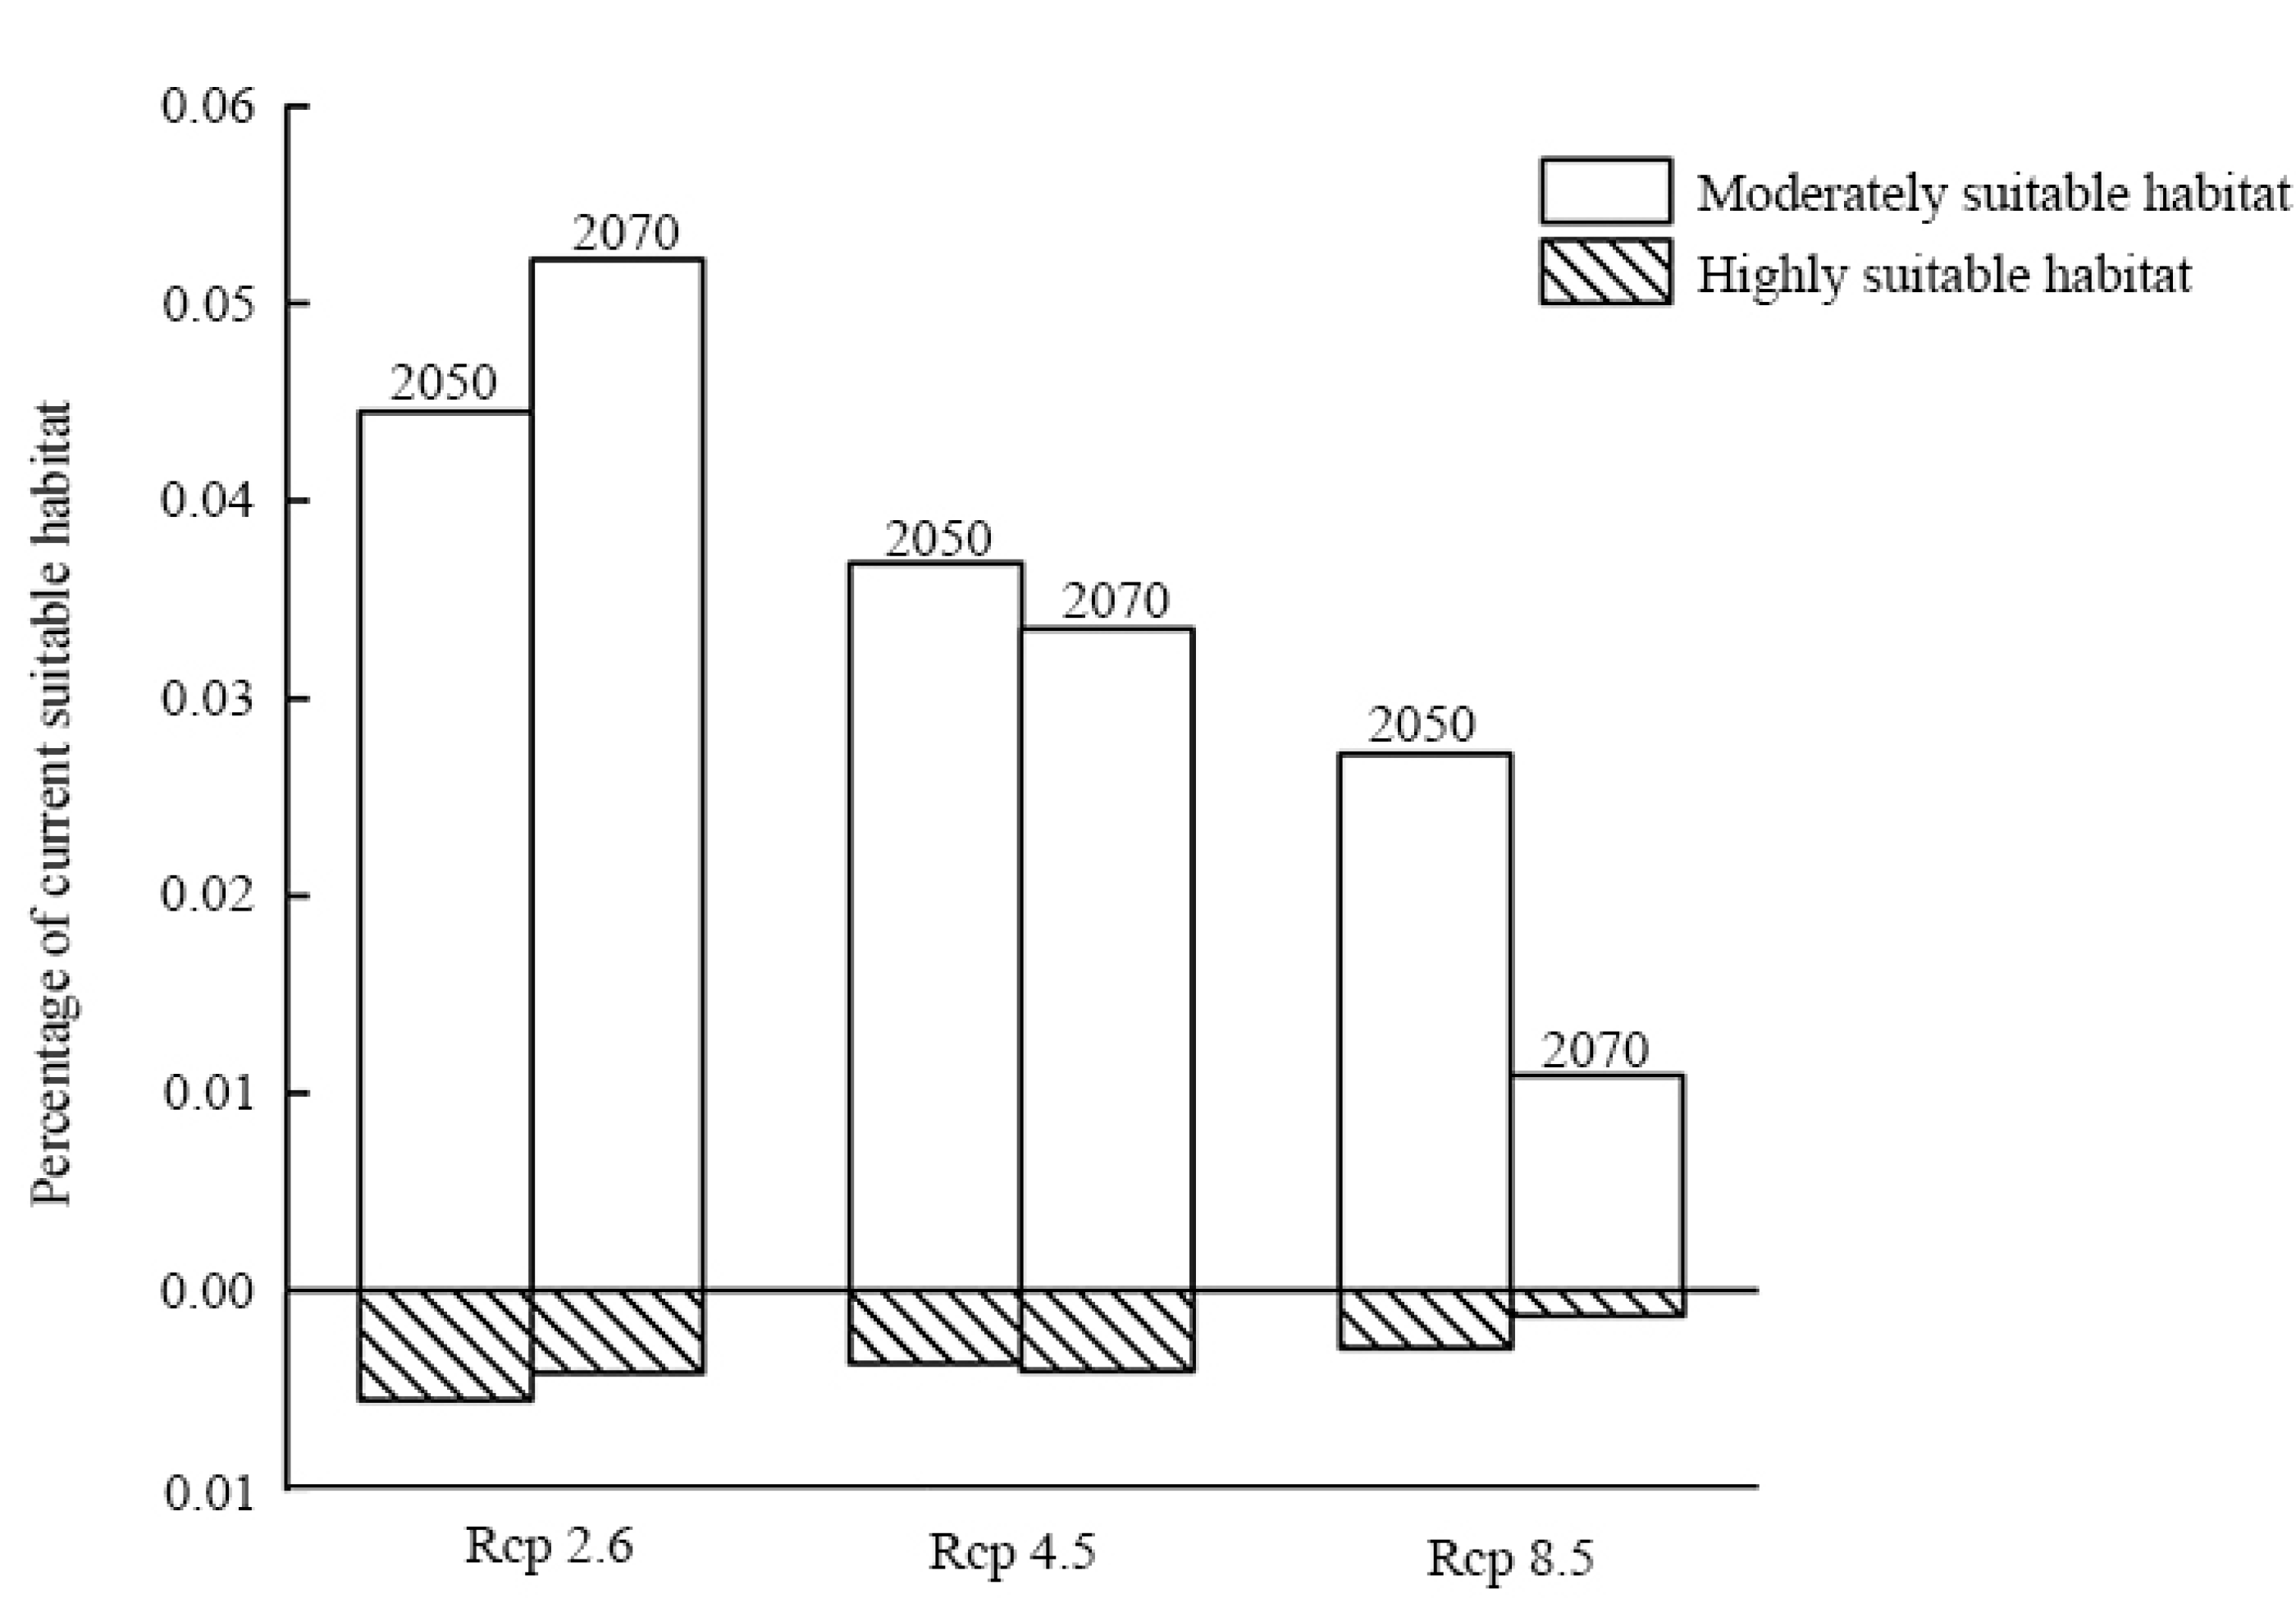
The distribution of E. buxbaumioidea was predicted to contract sharply with climate change (Figure 5). The quantitative analysis of potential distribution changes for E. buxbaumioidea is shown in Figure 6. Its moderately suitable habitat was predicted to reduce to 1.09–5.22%, and its highly suitable habitat would slump to 0.13–0.56%. With rising GHG concentration and the passage of time, the reduction in distribution became increasingly significant. However, the moderately suitable area in 2070 would be larger than that in 2050 under the climate scenario of RCP 2.6, and the highly suitable area in 2070 would be larger than that in 2050 under the climate scenario of RCP 4.5. When greenhouse gas emissions were the lowest or median, the reduction rate of species’ habitats had the potential to slow down. Overall, the distribution ranges of E. buxbaumioidea would continue with climate change.
The distribution of the species existing in current and future climate scenarios is and will mainly be in the Qinghai–Tibetan plateau. Except for the Qinghai–Tibet plateau, the moderately or highly suitable habitat in other regions would turn out to be unsuitable in the future. The suitability of these regions will be much lower than that of the Qinghai–Tibet plateau, and the habitat with high altitude in the plateau will be more appropriate for E. buxbaumioidea.

3.4. Conservation Gaps

UNESCO had set a conservation target that aimed to conserve at least 17% of terrestrial and inland water areas through effective and equitable management by 2020 (Aichi Biodiversity target; No.11 https://www.cbd.int/sp/targets/) (accessed on 27 August 2021). In our study, both highly suitable habitats and moderately suitable habitats were considered suitable habitats.
The suitable habitat of E. buxbaumioidea in nature reserves was about 7.32%, which was far below the conservation target (Figure 7a). Under the future scenarios with the dispersion of E. buxbaumioidea, only in the 2070-RCP 8.5 scenario did the area of the nature reserves meet the conservation target (22.65%). However, in other scenarios, the suitable habitats in the nature reserves were below the target (<13.65%). When the dispersal ability of E. buxbaumioidea was ignored, the field protection of any climatic scenarios was far below the conservation target (<4.54%). The lowest level of protection, which was 3.51%, was predicted in the 2070-RCP 2.6 scenarios without dispersion, in which most of the distribution fell outside of the nature reserves (Figure 7b).

4. Discussion

4.1. Environmental Variables Affecting the Distribution of E. buxbaumioidea

According to the results of the MaxEnt model, the currently suitable habitats of E. buxbaumioidea are mainly distributed in high altitude and high latitude areas in China, including the Qinghai–Tibet Plateau, Inner Mongolia Plateau, northern Xinjiang Autonomous Region, and Northeast China (Figure 4). These areas were characterized as experiencing cold, dry winters and significant temperature variations. The jackknife test results showed that Bio1, Bio3, Bio19, and NDVI2 were the main factors affecting the distribution of E. buxbaumioidea (Figure 2). The response curve further revealed that E. buxbaumioidea preferred more arid and cold habitats with moderate and low levels of NDVI in summer.
Environmental factors (e.g., temperature and precipitation) affect the survival, growth, and distribution of bryophytes [14,34]. Meanwhile, bryophytes also show strong morphological adaptability to environmental changes [35,36,37]. We observed and measured the morphological characteristics of E. buxbaumioidea specimens distributed on the Qinghai–Tibet Plateau and the Inner Mongolia Plateau in China. We found that the lengths of the leaves, capsules, and setae in the species distributed in Tibet are longer than those of the species distributed in Mongolia, which was consistent with the morphological observations of Mielichhoferia mielichhoferiana [38]. Species develop a short seta and a long calyptra to protect the tiny capsule more effectively when living in Inner Mongolia with abundant wind energy resources, and this condition alleviates the hazards of gale and helps maintain the growth and development of sexual reproductive organs. Small leaves can reduce water transpiration, which enhances tolerance to harsh environments. In Tibet, the surface area of leaves is large, which helps plants obtain nutrients quickly and store more water. A long seta also helps the dispersal of spores, which is favorable for reproduction in the extreme environment of the alpine. Our results reveal that the spore size of E. buxbaumioidea was always large, which may improve the survival probability of the next generation in extreme environments. Large spores seem heavy with regard to dispersal, and a size of 20–25 μm is usually considered an important maximum limit [39]. However, in extreme environments, such as above 4100 m in Qinghai–Tibetans plateau or Mongolia plateau with abundant wind resources, large spore size may improve the spores’ resistance to environmental disturbances, which may contribute to the reproduction of E. buxbaumioidea in cold and arid environments.

4.2. Analysis of Environmental Threats in Future Scenarios

The MaxEnt model predicted that the area of potentially suitable habitat for E. buxbaumioidea will decrease dramatically in either 2050 or 2070 (Figure 5 and Figure 6). Climate change may cause habitat extinction in most areas, while the suitable habitat has only slightly expanded in Southwest Tibet (Figure 3 and Figure 5). Bryophyte distributions are affected by two important aspects: the dispersal ability of species and environmental conditions. It was shown that bryophytes are predicted to be negatively impacted by future climate change despite having efficient wind dispersal capabilities [40]. The future potential distributions of E. buxbaumioidea may experience many more threats than our predicted results when considering factors other than climatic variables. The increased intensity of human activities has dramatically reshaped many parts of the plateau [41]. Human disturbance is distributed mainly in the southern and eastern parts of the plateau [42], which overlaps the primary distributions of E. buxbaumioidea in the current and future scenarios. With global warming, planted crops will expand to higher latitudes and altitudes [43]. Heavy grazing is believed to lead to severe rangeland degradation or even desertification [44]. These factors will further lead to the loss of suitable habitats for E. buxbaumioidea. The conflict between human activities and the future habitats of E. buxbaumioidea may pose a significant threat to its survival.

4.3. Endangered Rank of E. buxbaumioidea

The evaluation criteria for listing a species as threatened are population size, geographic range, and the species’ probabilities of extinction. After several years of flora surveys, the number of localities of E. buxbaumioidea has increased to eight. However, mature individuals may not reach up to 1000. Species distribution may be more extensive than its recorded range of occurrences. According to the distribution area and the number of specimens, the population number is conservatively speculated to be slightly growing, and its threat status may change from Endangered (EN) to Vulnerable (VN) [24]. However, in future scenarios, the suitable habitat of E. buxbaumioidea may face severe challenges. Thus, its threat status may upgrade in the future, which indicates that the protective measure for E. buxbaumioidea should be considered.

4.4. Protection Area

Red-listed species are rare and threatened species that would experience higher spatio-temporal dynamics than non-red-listed species [45]. These narrowly distributed species, that is, species with small range sizes, low population densities, or occurring in small, widely-spaced patches, are more vulnerable than widespread species [46]. Narrowly distributed species are also not likely to occur in protected areas [47]. Endangered species face a more difficult situation with climate change than other species due to their population structures. In this article, the present system of nature reserves in China fails to protect E. buxbaumioidea adequately in all scenarios. In future climate change scenarios, the vast majority of the severely contracted distributions failed to locate in the nature reserves. The stable, suitable areas of E. buxbaumioidea, which are mainly distributed in the Qinghai–Tibet plateau, also show significant gaps.
Nature reserves in the Qinghai–Tibet plateau and China are not scarce. There are nearly 60 nature reserves at and above the provincial level in the Qinghai–Tibet plateau (http://www.gov.cn/guoqing/2019-04/09/content_5380702.htm) (accessed on 30 January 2023), and there are also a large number of lower-ranked nature reserves. We should monitor changes in the distribution continuously and regularly upgrade the nature reserves that overlap with the distribution of E. buxbaumioidea.

5. Conclusions

In this study, we explored the consequences of climate change on the geographic distribution of E. buxbaumioidea and assessed its conservation gaps. Our investigations showed that its distribution is affected mainly by the annual mean temperature, isothermality, precipitation of the coldest quarter, and NDVI. Currently, the highly suitable habitat of this species is mainly distributed in the Qinghai–Tibet plateau, and the range would sharply reduce under future climate change. The nature reserves rarely overlapped with the distribution in either scenario, which means the current protected areas network is insufficient. These results are helpful for understanding the susceptibleness of endangered bryophyte species to climate change, and we need to take the habitat of bryophytes into account when setting up protected areas.

Author Contributions

Conceptualization, methodology, investigation, software, data curation, writing—original draft preparation, Y.L. and X.S. (Xiaotong Song); investigation, data curation, writing—original draft preparation, Y.Y., J.G., R.W. and Z.; investigation in Inner Mongolia, resources, D.Z.; conceptualization, methodology, investigation, writing—review and editing, supervision, X.S. (Xiaoming Shao). All authors have read and agreed to the published version of the manuscript.

Funding

This research was funded by the National Natural Science Foundation of China, grant number 41771054; The Flexible Talent Support Project of Tibet Agricultural and Animal Husbandry University, grant number 604419044; and The Joint Scientific Research Fund Project of China Agricultural University-Tibet Agricultural and Animal Husbandry University, Chinese Universities Scientific Fund, grant number 2022TC126.

Institutional Review Board Statement

Not applicable.

Informed Consent Statement

Not applicable.

Data Availability Statement

Data is contained within the manuscript.

Acknowledgments

We thank Yingjie Fan, Ling Liu, Mengzhen Wang from China Agricultural University, and Heping Ma from Tibet Agricultural and Animal Husbandry University for their help in the field investigation. We also thank the Herbarium of the Institute of Botany (PE), the Herbarium of Inner Mongolia Normal University (IMNU), and the Herbarium of Hebei Normal University (HBNU) for providing specimens and related information.

Conflicts of Interest

The authors declare no conflict of interest.

References

  1. Markham, J. Rare species occupy uncommon niches. Sci. Rep. 2014, 4, 6012. [Google Scholar] [CrossRef]
  2. Rejmanek, M. Vascular plant extinctions in California: A critical assessment. Divers. Distrib. 2018, 24, 129–136. [Google Scholar] [CrossRef]
  3. Chape, S.; Harrison, J.; Spalding, M.; Lysenko, I. Measuring the extent and effectiveness of protected areas as an indicator for meeting global biodiversity targets. Philos. Trans. R. Soc. Lond. B Biol. Sci. 2005, 360, 443–455. [Google Scholar] [CrossRef] [PubMed]
  4. Liu, X.H.; Li, J.H. Scientific solutions for the functional zoning of nature reserves in China. Ecol. Model. 2008, 215, 237–246. [Google Scholar] [CrossRef]
  5. Guo, Z.L.; Cui, G.F. Establishment of Nature Reserves in Administrative Regions of Mainland China. PLoS ONE 2015, 10, e0119650. [Google Scholar] [CrossRef] [PubMed]
  6. Elith, J.; Leathwick, J.R. Species Distribution Models: Ecological Explanation and Prediction Across Space and Time. Annu. Rev. Ecol. Evol. Syst. 2009, 40, 677–697. [Google Scholar] [CrossRef]
  7. Graham, C.H.; Elith, J.; Hijmans, R.J.; Guisan, A.; Peterson, A.T.; Loiselle, B.A.; NCEAS Predicting Species Distributions Working Group. The influence of spatial errors in species occurrence data used in distribution models. J. Appl. Ecol. 2008, 45, 239–247. [Google Scholar] [CrossRef]
  8. Qin, A.L.; Liu, B.; Guo, Q.S.; Bussmann, R.W.; Ma, F.Q.; Jian, Z.J.; Xu, G.X.; Pei, S.X. Maxent modeling for predicting impacts of climate change on the potential distribution of Thuja sutchuenensis Franch., an extremely endangered conifer from southwestern China. Glob. Ecol. Conserv. 2017, 10, 139–146. [Google Scholar] [CrossRef]
  9. Yang, Z.B.; Bai, Y.; Alatalo, J.M.; Huang, Z.D.; Yang, F.; Pu, X.Y.; Wang, R.B.; Yang, W.; Guo, X.Y. Spatio-temporal variation in potential habitats for rare and endangered plants and habitat conservation based on the maximum entropy model. Sci. Total Environ. 2021, 784, e147080. [Google Scholar] [CrossRef]
  10. Condro, A.A.; Prasetyo, L.B.; Rushayati, S.B.; Santikayasa, I.P.; Iskandar, E. Predicting Hotspots and Prioritizing Protected Areas for Endangered Primate Species in Indonesia under Changing Climate. Biology 2021, 10, 154. [Google Scholar] [CrossRef]
  11. Wang, Q.H.; Zhang, J.; Liu, Y.; Jia, Y.; Jiao, Y.N.; Xu, B.; Chen, Z.D. Diversity, phylogeny, and adaptation of bryophytes: Insights from genomic and transcriptomic data. J. Exp. Bot. 2022, 73, 4306–4322. [Google Scholar] [CrossRef]
  12. Ogwu, M.C. Ecological and Economic Significance of Bryophytes. In Current State and Future Impacts of Climate Change on Biodiversity; IGI Global: Hershey, PA, USA, 2020; pp. 54–78. [Google Scholar] [CrossRef]
  13. Singh, R.; Joshi, H.; Singh, A. Bryophytes: Natural Biomonitors. In Natural Products Chemistry; Apple Academic Press: Palm Bay, FL, USA, 2020; pp. 139–153. [Google Scholar] [CrossRef]
  14. He, X.L.; He, K.S.; Hyvonen, J. Will bryophytes survive in a warming world? Perspect. Plant Ecol. Evol. Syst. 2016, 19, 49–60. [Google Scholar] [CrossRef]
  15. Alatalo, J.M.; Jagerbrand, A.K.; Erfanian, M.B.; Chen, S.B.; Sun, S.Q.; Molau, U. Bryophyte cover and richness decline after 18 years of experimental warming in alpine Sweden. AoB Plants 2020, 12, plaa061. [Google Scholar] [CrossRef] [PubMed]
  16. Camara, P.; Valente, D.V.; Sancho, L.G. Changes in the moss (Bryophyta) flora in the vicinity of the Spanish Juan Carlos I Station (Livingston island, Antarctica) over three decades. Polar Biol. 2020, 43, 1745–1752. [Google Scholar] [CrossRef]
  17. Kou, J.; Wang, T.J.; Yu, F.Y.; Sun, Y.W.; Feng, C.; Shao, X.M. The moss genus Didymodon as an indicator of climate change on the Tibetan Plateau. Ecol. Indic. 2020, 113, e106204. [Google Scholar] [CrossRef]
  18. Patiño, J.; Mateo, R.G.; Zanatta, F.; Marquet, A.; Aranda, S.C.; Borges, P.A.V.; Dirkse, G.; Gabriel, R.; Gonzalez-Mancebo, J.M.; Guisan, A.; et al. Climate threat on the Macaronesian endemic bryophyte flora. Sci. Rep. 2016, 6, 29156. [Google Scholar] [CrossRef]
  19. Wu, J.G. The danger and indeterminacy of forfeiting perching space of bryophytes from climate shift: A case study for 115 species in China. Environ. Monit. Assess. 2022, 194, 233. [Google Scholar] [CrossRef] [PubMed]
  20. Wang, W.; Feng, C.T.; Liu, F.Z.; Li, J.S. Biodiversity conservation in China: A review of recent studies and practices. Env. Sci. Ecotechnol. 2020, 2, e100025. [Google Scholar] [CrossRef]
  21. Cao, T.; Gao, C. A new species of Encalypta (Musci) from China. Acta Bryolichenolog. Asiat. 1990, 2, 1–4. [Google Scholar]
  22. Cao, T.; Gao, C.; Horton, D.G. Fissidentaceae-Ptychomitriaceae; English Version; Science Press: Beijing, China; Missouri Botanical Garden: New York, NY, USA, 2001; Volume 2, pp. 103–113. [Google Scholar]
  23. Zhao, J.C.; Li, X.Q.; Tang, W.B. Taxonomy and distribution of Encalyptaceae, Musci. Acta Bot. Boreali Occident. Sin. 2002, 22, 453–466. [Google Scholar]
  24. He, Q.; Jia, Y. Assessing the threat status of China’s bryophytes. Biodivers. Sci. 2017, 25, 774–780. [Google Scholar] [CrossRef]
  25. Cao, T.; Zhu, R.; Guo, S.; Zuo, B.; Yu, J. A brief report of the first red list of endangered bryophytes in China. Bull. Bot. Res. 2006, 26, 756–762. [Google Scholar] [CrossRef]
  26. IPCC. Climate Change 2013: The Physical Science Basis. Contribution of Working Group I to the Fifth Assessment Report of the Intergovernmental Panel on Climate Change; Cambridge University Press: Cambridge, UK, 2013. [Google Scholar] [CrossRef]
  27. Gent, P.R.; Danabasoglu, G.; Donner, L.J.; Holland, M.M.; Hunke, E.C.; Jayne, S.R.; Lawrence, D.M.; Neale, R.B.; Rasch, P.J.; Vertenstein, M.; et al. The Community Climate System Model Version 4. J. Clim. 2011, 24, 4973–4991. [Google Scholar] [CrossRef]
  28. Xu, X.L. Spatial Distribution Dataset of Quarterly Vegetation Indices (NDVI) in China; Data Registration and Publication System for Resource and Environment Science and Data Center, Chinese Academy of Sciences: Beijing, China, 2018; Available online: http://www.resdc.cn/DOI (accessed on 24 March 2021). [CrossRef]
  29. Warren, D.L.; Seifert, S.N. Ecological niche modeling in Maxent: The importance of model complexity and the performance of model selection criteria. Ecol. Appl. 2011, 21, 335–342. [Google Scholar] [CrossRef]
  30. Manel, S.; Williams, H.C.; Ormerod, S.J. Evaluating presence-absence models in ecology: The need to account for prevalence. J. Appl. Ecol. 2001, 38, 921–931. [Google Scholar] [CrossRef]
  31. Allouche, O.; Tsoar, A.; Kadmon, R. Assessing the accuracy of species distribution models: Prevalence, kappa and the true skill statistic (TSS). J. Appl. Ecol. 2006, 43, 1223–1232. [Google Scholar] [CrossRef]
  32. Freeman, E.A.; Moisen, G. PresenceAbsence: An R package for presence absence analysis. J. Stat. Softw. 2008, 23, 1–31. [Google Scholar] [CrossRef]
  33. Lu, Y.P.; Liu, H.C.; Chen, W.; Yao, J.; Huang, Y.Q.; Zhang, Y.; He, X.Y. Conservation planning of the genus Rhododendron in Northeast China based on current and future suitable habitat distributions. Biodivers. Conserv. 2021, 30, 673–697. [Google Scholar] [CrossRef]
  34. Coe, K.K.; Sparks, J.P.; Belnap, J. Physiological Ecology of Dryland Biocrust Mosses. Photosynth. Bryophyt. Early Land Plants 2014, 37, 291–308. [Google Scholar] [CrossRef]
  35. Frahm, J.-P. Bryophytes. In Inselbergs; Springer: Berlin/Heidelberg, Germany, 2000; pp. 91–102. [Google Scholar] [CrossRef]
  36. Wang, L.L.; Zhao, L.; Song, X.T.; Wang, Q.G.; Kou, J.; Jiang, Y.B.; Shao, X.M. Morphological traits of Bryum argenteum and its response to environmental variation in arid and semi-arid areas of Tibet. Ecol. Eng. 2019, 136, 101–107. [Google Scholar] [CrossRef]
  37. Liu, L.; Jiang, Y.B.; Song, X.T.; Tang, J.W.; Kou, J.; Fan, Y.J.; Shao, X.M. Temperature, not precipitation, drives the morphological traits of Didymodon rigidulus in Tibet. Ecol. Indic. 2021, 133, e108401. [Google Scholar] [CrossRef]
  38. Zhang, H. Morphological Characteristics and Geographical Distribution of Mielichhoferia mielichhoferiana(Bryaceae, Bryophyta). Acta Bot. Boreali Occident. Sin. 2014, 34, 851–854. [Google Scholar] [CrossRef]
  39. Johansson, V.; Lonnell, N.; Sundberg, S.; Hylander, K. Release thresholds for moss spores: The importance of turbulence and sporophyte length. J. Ecol. 2014, 102, 721–729. [Google Scholar] [CrossRef]
  40. Zanatta, F.; Engler, R.; Collart, F.; Broennimann, O.; Mateo, R.G.; Papp, B.; Munoz, J.; Baurain, D.; Guisan, A.; Vanderpoorten, A. Bryophytes are predicted to lag behind future climate change despite their high dispersal capacities. Nat. Commun. 2020, 11, 5601. [Google Scholar] [CrossRef] [PubMed]
  41. Chen, H.; Zhu, Q.A.; Peng, C.H.; Wu, N.; Wang, Y.F.; Fang, X.Q.; Gao, Y.H.; Zhu, D.; Yang, G.; Tian, J.Q.; et al. The impacts of climate change and human activities on biogeochemical cycles on the Qinghai-Tibetan Plateau. Global Change Biol. 2013, 19, 2940–2955. [Google Scholar] [CrossRef] [PubMed]
  42. Zhao, H.D.; Liu, S.L.; Dong, S.K.; Su, X.K.; Wang, X.X.; Wu, X.Y.; Wu, L.; Zhang, X. Analysis of vegetation change associated with human disturbance using MODIS data on the rangelands of the Qinghai-Tibet Plateau. Rangeland J. 2015, 37, 77–87. [Google Scholar] [CrossRef]
  43. Chen, D.; Xu, B.; Yao, T.; Guo, Z.; Cui, P.; Chen, F.; Zhang, R.; Zhang, X.; Zhang, Y.; Fan, J.; et al. Assessment of past, present and future environmental changes on the Tibetan Plateau. Sci. Bull. 2015, 60, 3025–3035. [Google Scholar]
  44. Chen, B.X.; Zhang, X.Z.; Tao, J.; Wu, J.S.; Wang, J.S.; Shi, P.L.; Zhang, Y.J.; Yu, C.Q. The impact of climate change and anthropogenic activities on alpine grassland over the Qinghai-Tibet Plateau. Sci. Bull. 2014, 189, 11–18. [Google Scholar] [CrossRef]
  45. Tingstad, L.; Grytnes, J.A.; Saetersdal, M.; Gjerde, I. Using Red List species in designating protection status to forest areas: A case study on the problem of spatio-temporal dynamics. Biodivers. Conserv. 2020, 29, 3429–3443. [Google Scholar] [CrossRef]
  46. Purvis, A.; Gittleman, J.L.; Cowlishaw, G.; Mace, G.M. Predicting extinction risk in declining species. Proc. R. Soc. B-Biol. Sci. 2000, 267, 1947–1952. [Google Scholar] [CrossRef]
  47. Rodrigues, A.S.L.; Gaston, K.J. How large do reserve networks need to be? Ecol. Lett. 2001, 4, 602–609. [Google Scholar] [CrossRef]
Figure 1. Study area and locations of the occurrence records of Encalypta buxbaumioidea used in the species distribution models.
Diversity 15 00269 g001
Figure 2. Analysis of the importance of environmental variables based on the jackknife test. Notes: Bio1: Annual mean temperature; Bio2: Mean diurnal range; Bio3: Isothermality; Bio7: Temperature annual range; Bio9: Mean temp. of driest quarter; Bio15: Variation of precipitation seasonality; Bio18: Precipitation of warmest quarter; Bio19: Precipitation of coldest quarter; NDVI2: NDVI in the second quarter.
Diversity 15 00269 g002
Figure 3. Response curves illustrating the quantitative relationship between logistic probability of Encalypta buxbaumioidea presence and annual mean temperature (a), isothermality (b), precipitation of coldest quarter (c), or NDVI in the second quarter (d).
Diversity 15 00269 g003
Figure 4. Simulate the suitable areas of Encalypta buxbaumioidea based on current data in China.
Diversity 15 00269 g004
Figure 5. Maps showing the suitable area of Encalypta buxbaumioidea in China from six different model scenarios.
Diversity 15 00269 g005
Figure 6. Future suitable habitats for three future scenarios of climate change (RCP 2.6, RCP 4.5, and RCP 8.5) and two time periods (2050 and 2070) as a percentage of current suitable habitat.
Diversity 15 00269 g006
Figure 7. Percentage of species distributions that overlap with nature reserves (NR) based on current and future climatic scenarios with dispersion (a) or without dispersion (b). The dashed line represents 17% protection, which is the criterion used by our study and stipulated under Aichi Biodiversity target No. 11.
Diversity 15 00269 g007
Table 1. Sample information of Encalypta buxbaumioidea.
Specimen NumberLongitude (°)Latitude (°)Altitude (m)MatrixSource
2019P110Y00187.4428.955209SoilBAU
20200808SSL09797.6029.484442SoilBAU
20200808SWZ06596.8529.394147SoilBAU
20200811SGL02596.7629.574213SoilBAU
20200811SSL03196.0429.374128SoilBAU
20200812SGL01897.2930.154505SoilBAU
20200812SWZ00297.4628.664357SoilBAU
529198.0029.045080Soil on the rock surfacePE
2015037116.2442.601598SoilIMNU
3881116.0743.91993SoilIMU
70117.5343.591444SoilIMU
98775-a114.6041.80-SoilHBNU
Notes: BAU: Herbarium of China Agriculture University; PE: Herbarium of Institute of Botany, Chinese Academy of Sciences; IMNU: Herbarium of Inner Mongolia Normal University; IMU: Herbarium of Inner Mongolia University; HBNU: Herbarium of Hebei Normal University.
Table 2. Environmental conditions of Encalypta buxbaumioidea’s localities.
Environmental ConditionsLocalities
Qinghai–Tibet PlateauMongolian Plateau
Annual mean temperature (°C)−3–100–6
Mean diurnal range (°C)10–1511–14
MicrohabitatsSoil surface in a shaded habitatSoil surface in a shaded habitat
Altitude (m)4128–5209About 1600
Temperature annual range (°C)25–3246–52
VegetationThicket; grassland; alpine vegetation; coniferous forestGrassland; cultivated vegetation
Table 3. Nine environmental factors used to build the MaxEnt model of Encalypta buxbaumioidea in China.
VariableDescriptionUnit
Bio1Annual mean temperature°C
Bio2Mean diurnal range°C
Bio3Isothermality%
Bio7Temperature annual range°C
Bio9Mean temp. of driest quarter°C
Bio15Precipitation seasonality (coefficient of variation)%
Bio18Precipitation of warmest quartermm
Bio19Precipitation of coldest quartermm
NDVI2NDVI in the second quarter/
Disclaimer/Publisher’s Note: The statements, opinions and data contained in all publications are solely those of the individual author(s) and contributor(s) and not of MDPI and/or the editor(s). MDPI and/or the editor(s) disclaim responsibility for any injury to people or property resulting from any ideas, methods, instructions or products referred to in the content.