Article

Microbial Communities of Peaty Permafrost Tundra Soils along the Gradient of Environmental Conditions and Anthropogenic Disturbance in Pechora River Delta in the Eastern European Arctic

1
Winogradsky Institute of Microbiology, Research Center of Biotechnology, Russian Academy of Sciences, 119071 Moscow, Russia
2
SciBear OU, 10115 Tallinn, Estonia
3
Skryabin Institute of Bioengineering, Research Center of Biotechnology, Russian Academy of Sciences, 119071 Moscow, Russia
4
Care for Ecosystems (CfE), 02826 Görlitz, Germany
5
Peatland Protection and Restoration Center, Institute of Forest Science, Russian Academy of Sciences, 143030 Uspenskoye, Russia
*
Authors to whom correspondence should be addressed.
Diversity 2023, 15(2), 251; https://doi.org/10.3390/d15020251
Submission received: 30 November 2022 / Revised: 23 January 2023 / Accepted: 3 February 2023 / Published: 10 February 2023
(This article belongs to the Special Issue Peatland Ecosystems under Climate Change)

Abstract

:
Microbial communities play crucial roles in the global carbon cycle, particularly in peatland and tundra ecosystems experiencing climate change. The latest IPCC assessments highlight the anthropogenic changes in the Arctic peatlands and their consequences due to global climate change. These disturbances could trigger permafrost degradation and intensification of the biogeochemical processes resulting in greenhouse gas formation. In this study, we describe the variation in diversity and composition of soil microbial communities from shallow peat tundra sites with different anthropogenic loads and applied restoration interventions in the landscape of remnant fragments of terraces in the Pechora River delta, the Russian Arctic, Nenets Autonomous Okrug. The molecular approaches, including quantitative real-time PCR and high-throughput Illumina sequencing of 16S RNA and ITS, were applied to examine the bacterial and fungal communities in the soil samples. Anthropogenic disturbance leads to a significant decrease in the representation of Acidobacteria and Verrucomicrobia, while the proportion and diversity of Proteobacteria increase. Fungal communities in undisturbed sites may be characterized as monodominant, and anthropogenic impact increases the fungal diversity. Only the verrucomicrobial methanotrophs Methyloacifiphilaceae were found in the undisturbed sites, but proteobacterial methanotrophs Methylobacterium-Methylorubrum, as well as different methylotrophs affiliated with Methylophilaceae, and Beijerinckiaceae (Methylorosula), were detected in disturbed sites.

1. Introduction

Climate warming is becoming increasingly critical, most notably at high latitudes [1]. Anthropogenic impacts exacerbate climate change, increase the vulnerability of ecosystems, and have complex implications for various aspects of human life [2]. Peatlands have a special place in climate change mitigation and adaptation problem solutions [3], which lead on land in terms of carbon stocks, outstrip all other ecosystems in terms of carbon stocks per unit area, influence greenhouse gas fluxes [4], and are carriers of specific biodiversity [5,6].
The conditions in the north (excess of precipitation over evaporation, presence of permafrost) promote peatland formation. The short vegetation period that is compensated by extended daylight provides sufficient ecosystem productivity. Plant remains that have not fully decayed contribute to peat formation. Thermokarst, frost heaving, and frost cracking form the morphological diversity of peatlands and shallow peat landscapes in the Arctic [7]. The presence of permafrost and, hence, insignificant summer thawing of the soil limits the biogeochemical processes to the upper soil layers, so, in the Arctic conditions, shallow peatlands are functionally close to oligotrophic mires [8]. Even though the Conservation of Arctic Flora and Fauna working group classifies watershed peatlands, including shallow peatlands, under the tundra category, peatlands occupy 12.3%, and, together with shallow peatlands (peat less than 30 cm), 34.8% of the Russian Arctic [9]. They carry critical ecosystem functions, such as greenhouse gas fluxes regulation, protection of the permafrost from thawing, maintenance of the water balance, and diversity of the biota. At the same time, due to the small peat depth, they are the least resistant to anthropogenic mechanical impacts [3]. Disturbance or loss of vegetation cover can quickly lead to peat soil destruction, water, and wind erosion and further peat decomposition. Shallow tundra peatlands in the Arctic are underestimated in terms of their extent, ecosystem functions, services, and robustness against climate change and human impacts [8]. Shallow tundra peatlands in the Arctic are underestimated in terms of their extent, ecosystem functions, services, and robustness against climate change and human impacts [8]. That is one of the reasons that studies insufficiently cover their structural and functional characteristics.
Soil microbiomes play an essential role in soil biochemical processes [10]. Microorganisms are responsible for both the decomposition and formation of organic matter, as well as ensuring the cycling of nutrients in the soil. These processes are crucial for the regeneration of disturbed ecosystems of the Arctic [11]. The composition of microbial communities is decisive for ecosystems’ carbon balance and greenhouse gas (GHG) exchange in the rapidly changing environment [12]. Hence, the microbial composition could be an informative indicator for assessing ecosystem disturbances and regeneration status in relation to the key ecosystem functions.
The connections between vegetation, hydrology, soil properties, and microbial communities have been examined in a number of studies carried out in the boreal [13,14] and frozen Arctic peatlands [15,16,17], while, to date, there is practically no research on the interconnections between biophysical features of ecosystems and microbial community structure in the natural shallow peat tundra and in disturbed landscapes in the Arctic zone.
For practical needs of ecological indication, it would be helpful to designate whether the changes in microbial communities’ diversity characteristics follow the biophysical attributes in the course of regeneration changes. The latest publications prove that modern molecular approaches allow for capturing less abundant and uncultured microbial taxa [18,19].
We hypothesized that anthropogenic disturbances of the shallow tundra peatland would modulate the composition of the soil resident microbiome and lead to different patterns of bacterial community shifts according to the gradient of environmental conditions and anthropogenic disturbance. Therefore, the present study aimed to determine if the structure of soil microbial communities reflects the level of disturbance/regeneration in the transformed shallow peatland ecosystems in the Arctic and evaluate their indication capacity.

2. Materials and Methods
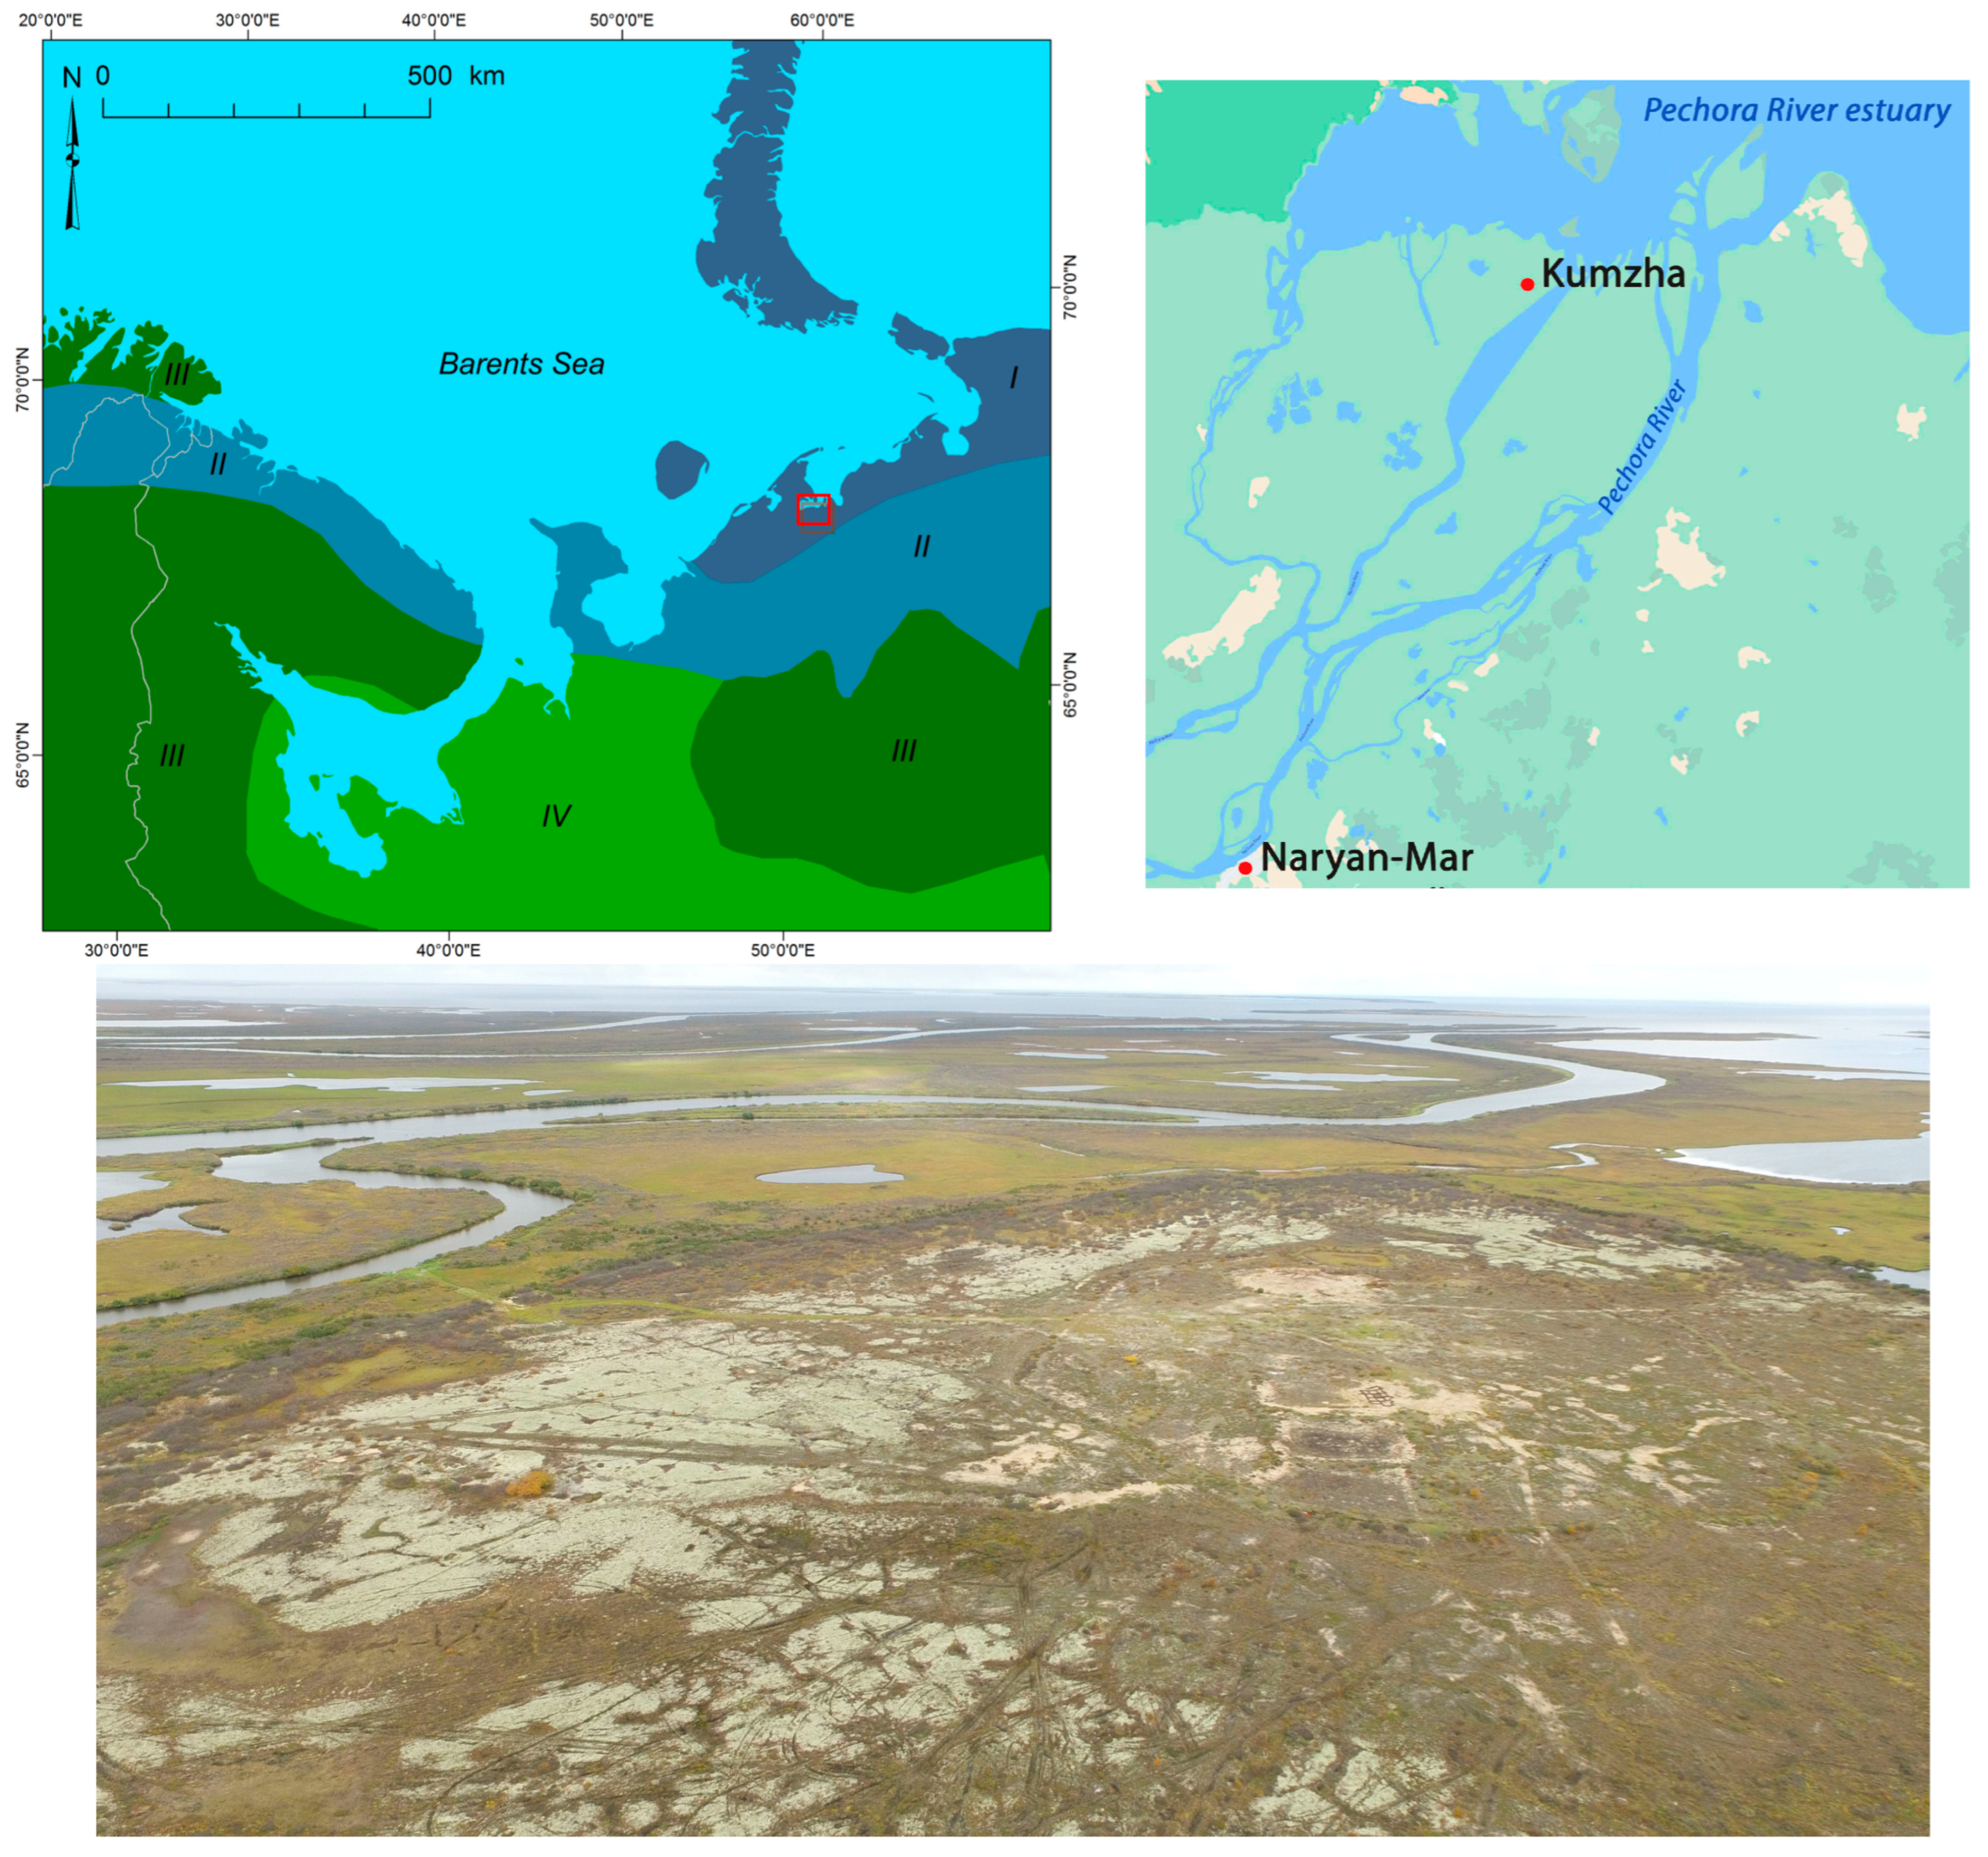
2.1. Study Region

The research object is located in the Nenets Autonomous Okrug in the delta of the Pechora River, Barents Sea basin, on the territory of Nenets State Nature Reserve (Figure 1). The climate is a moderately cold Arctic climate. The average annual temperature is −2.4 °C, with an average maximum of 18.9 °C and absolute maximum of 33.9 °C in July and an average minimum of −21.1 °C and an absolute minimum of −47.9 °C in January. The mean annual precipitation is 516 mm and ranges from a minimum of 257 mm to a maximum of 706 mm.
The study area is located in the southern tundra belt and from the point of mire zoning in the Arctic seepage and polygon mire region [20]. This mire region is characterized by the presence of frozen polygon mires in watersheds and patches of lowland fens in river valleys, as well as other watercourses where permafrost is deep or absent. Occasionally, isolated patches of palsa mires, often degraded, appear on the slopes of river valleys and closer to the coast, where drainage is better [22]. Frozen polygons are usually covered by shallow peat; morphologically and by vegetation, it is often challenging to distinguish polygon mires from polygon shallow peat tundra. The shallow peat tundra covers most of the transgression terraces and lasts up to 50 km from the Barents coast towards the continent. It is found along the coast and in the river deltas on the residual fragments of the terraces. The region’s peatlands are significantly less disturbed by human activities than European peatlands, and the degree of degradation is about 1% [22]. At the same time, the development of infrastructure and transport in this region leads to violations of vulnerable Arctic ecosystems, which is especially dangerous under current climate conditions [23]. The presence of sandy bedrocks in the coastal transgression landscapes and deltas makes the landscape degradation almost irreversible. Shallow peatlands get replaced by sandy dunes that carry different ecosystem functions and services [8].

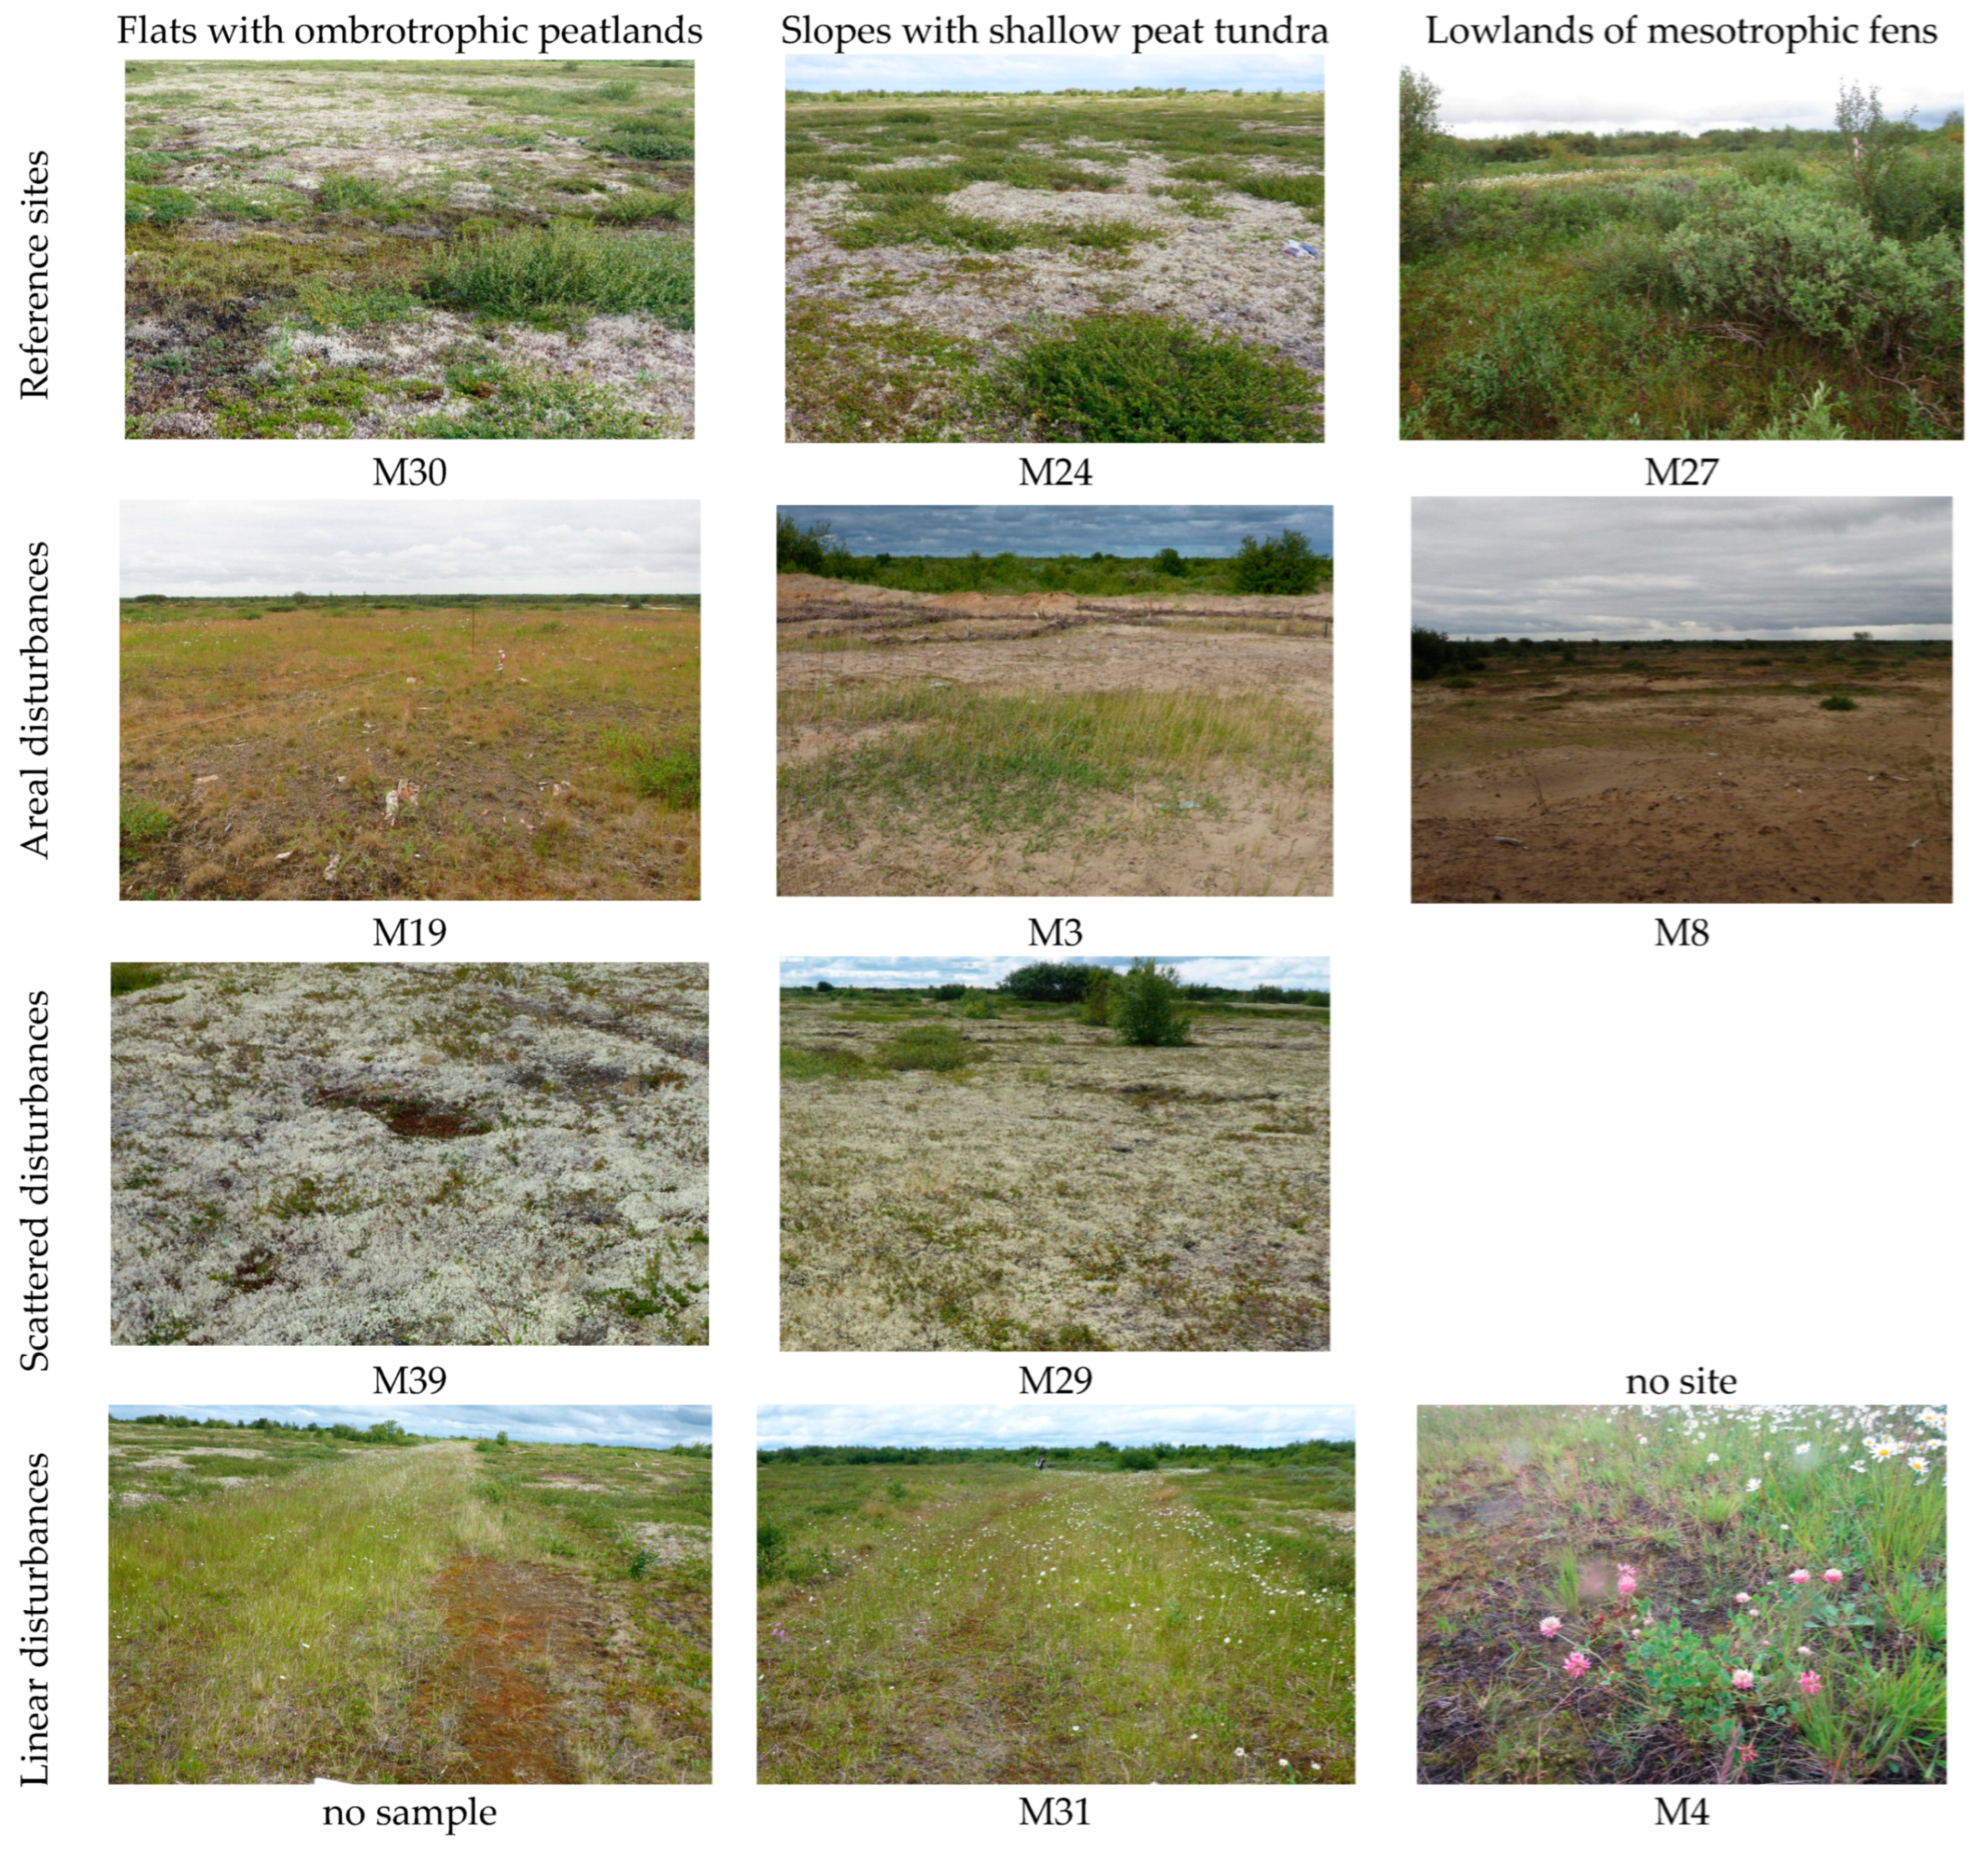
2.2. Study Sites and Objects

The site under study, the Kumzha site (68°11′ N 53°47′ E, CALM R24A-2), is the part of the slightly elevated (4–10 m asl) remains of the young first inland alluvial terrace (I am) that used to be covered with the relic inland southern tundra vegetation and shallow peat cover. The bedrock is composed of thawed and frozen sand with clay and peat inclusions. An example of the intact peatlands and shallow peat tundra on the residual terrace can be found on Kashin Island (68°14′ N 53°51′ E, CALM R24A—[19]), which is also a remnant of the first terrace and maintained in its natural status by the Nenets Nature Reserve [20].
The terraces’ fragments cover not more than 5% of the delta area and are valuable habitats under solid anthropogenic pressure, given that they are handy places used for the development of all types of infrastructure, including traditional use and recreation (hunting and fishing facilities), and use by the oil and gas industry. Specifically, the Kumzha site was used as a natural platform for condensed gas exploration in the late eighties of the 20th century.
The exploration installations included two rows of ridges bounding the drilling pad, depressions from which the ground for artificial ridges was taken, two drilling wells, underground sludge pits for drilling waste water storage, plots cleared for camps and storage facilities, unpaved roads from local ground, and decking roads (Figure 1).
Since the end of the exploration works, the area has been under natural regeneration and interrupted by several interventions for rehabilitation. In 2008, the technical stage of site rehabilitation aimed at removal of metal trash brought additional disturbances to the ecosystem. In 2014, several experimental sites for ecosystem restoration were set up. In 2016, the drilling pad wellheads were removed, and routine rehabilitation was implemented, such as ploughing and grass sawing. The site was the subject of detailed study in the framework of the Circumpolar Active Layer Monitoring (CALM) program [24] and ecological restoration experiments supported by the UNDP program [23,25].
The typical initial landscape structure of the study site was retrieved from the undisturbed area, e.g., on the Kashin Island. The concept of peatland structure diversity was applied to identify and describe initial spatial landscape units at the level of micro-landscapes [12]. Further, the disturbed and relevant reference micro-landscapes were paired by predicted successional connections.
The following three classes of micro-landscapes were identified at the natural site: flattened areas parts on the top of the island and flat terraces of the slope are covered by ombrotrophic mires or bogs with peat depth of more than 50 cm (half a meter) and the dense cover of sphagnum mosses, lichens, small sedges, and dwarf shrubs; the drained gentle slopes covered with shallow (less than half a meter) peat and lichen moss dwarf shrub tundra; and the poor minerotrophic fen with mesotrophic mire vegetation, including brown mosses, tall sedges, and willows.
The area under study presents a diverse mosaic of patches with different disturbance character and intensity distributed through three main initial landscape types. The following types of disturbances we used for designation of the testing sites: the areal disturbances, that are the most heavy and where both vegetation and peat cover are destroyed at an area rate of more than the first dozens of square meters; the linear disturbances that include all types of roads, ditches, and artificial ridges where vegetation and peat cover are destroyed at the limited locations along the artificial linear structures; and the scattered disturbances that include the areas with sporadic distribution of patches where vegetation and soil are disturbed at the limited space, and self-regeneration is still visible.
The study design was aimed to cover the diversity of habitats that are formed after the transformation of each of three initial micro-landscapes by each of three types of disturbances and reference sites. For lowland micro-landscapes, the ecological restoration was applied. The newly created habitats were also included in the research. Not all combinations were available for study. Eleven sampling plots were chosen to reflect the diversity of the habitats (Table 1).
The selected plots represented, at the time of sampling (2020), different types of habitats representing stages of vegetation regeneration succession with a wide range of plant communities (Figure 2). The vegetation cover of the plots was described by common geobotanical methods, and all vegetation species were classified according to the stratification of the plants [26]. The spatial structure of the vegetation cover was established using the methods of large-scale geobotanical mapping. The vascular plant, moss, and lichen species were preliminarily identified in the field, sampled, and confirmed by the specialists based on the herbarium; the samples are available for verification.

2.3. Sample Collection and Soil Characterization

Sampling was done in August 2020 at the selected sites. The “envelope” inclusive sampling design was applied. The vegetation relevé was bounded by a circle with the diameter of five meters. Triplicate soil samples were taken by cylinder from the depth 0–4 cm; samples were collected by the sampler at 5 × 5 cm in every corner of every of five 50 × 50 cm squares and further mixed. The vegetation relevé included a list of presented vascular species, bryophytes, and lichens with their phenological status, height, and cover, as well as cover and height of every plant community layer. The active layer depth (distance to permafrost roof) was measured by the probe corer at 1.80 m length. In some cases (sites M9, M39, M30, and M24) the deep coring data were available due to the presence of CALM plot. The soil subsamples were homogenized and stored in the cooling incubator (2–5 °C) before being transferred to the laboratory. Samples for DNA extraction were immediately frozen.
The main soil parameters were determined using standard procedures. Values of pH in soil were measured using a pH150 m (1:5 soil: H2O ratio). Bulk density was determined by the soil core method. The dry matter content of the soil was determined by drying the samples (105 °C, 12 h), and OM content was analyzed by loss upon ignition (475 °C, 4 h). Carbon and nitrogen content were measured using a Vario Max element analyzer (Elementar Analysensystem GmbH, Langenselbold, Germany).

2.4. DNA Extraction, qPCR Assays, and Sequencing

We used the Power Soil DNA Isolation Kit (Qiagen, Carlsbad, CA, USA) to extract total soil DNA from 0.25 g of rhizosphere soil samples, following the manufacturer’s protocol. To evaluate the DNA concentration and purity, a NanoDrop 1000 spectrophotometer (Thermo Scientific, Waltham, MA, USA) was used.
The total abundance of bacterial (16S rRNA genes) and fungal (18S rRNA genes) communities was evaluated by quantitative PCR assays (qPCR) with the primers [27] for bacteria and [28] for fungi. Briefly, the synthesis of the first cDNA chain from a single-stranded RNA matrix was carried out using MMLV reverse transcriptase (revertase) according to the manufacturer’s recommendations (CJSC Eurogen, Moscow, Russia). The qPCR reactions were carried out in real-time in a PCR buffer-RV (Syntol LLC, Moscow, Russia), in the presence of SYBR Green I and a passive reference dye ROX using the CFX96 Touch Real-time PCR Detection System (Bio-Rad Laboratories, Hercules, CA, USA). The standard curves were prepared using Escherichia coli for bacteria and Penicillium chrysogenum for fungi. Each qPCR mix consisted of 4.2 µL sterilized water, 10 µL SYBR green master mix, 0.4 µL of each primer (0.4 pmoles/ µL) and 5 µL of diluted template DNA for a final reaction volume of 20 µL. The PCR program included a polymerase activation stage for 5 min at 95 °C, and the next 40 cycles were 15 s at 95 °C, 45 s at 62 °C.
High throughput sequencing was applied to evaluate microbial diversity. The variable V4 region of the bacterial 16S rRNA gene was amplified using universal primers 515F and 806R (https://doi.org/10.17504/protocols.io.nuudeww) (accessed on 26 November 2021), and the fungal ITS1 region was amplified with primers ITS5 and 5.8S_fungi [29], together with linkers and unique barcodes. PCR was performed on a T100 Thermal Cycler device (Bio-Rad Laboratories, Hercules, CA, USA) in 15 µL containing 0.5 units of Q5® High-Fidelity DNA Polymerase (New England BioLabs Inc., Ipswich, MA, USA), 1X Q5 reaction buffer, 5 pmol of each of the primers, 3.5 mM dNTP (CJSC Eurogen, Moscow, Russia) and 1–10 ng of the DNA matrix. The PCR program included a denaturation stage at 94 °C for1 min, amplification for 35 cycles (94 °C—30 s, 50 °C—30 s, 72 °C—30 s), and final elongation at 72 °C for3 min.
Further analysis was performed following the Illumina protocol (16S Metagenomic Sequencing Library Preparation) on the Illumina MiSeq instrument (Illumina, Inc., Foster City, CA, USA) using the MiSeq Reagent Kit v3 (600 cycles) (Illumina, San Diego, CA, USA) running 2 × 300 bp paired-end reads.

2.5. Sequence Data Processing and Statistical Analysis

Pre-processing of the Illumina sequencing reads included removal of the adapters and indices using the Cutadapt ver. 1.11 [30], as well as denoising, combining paired reads, and deleting chimeras using the Dada2 package implemented in the QIIME2 package, ver. 2019.7 [31].
After filtering, high-quality sequences were obtained and included for subsequent analyses. The OTU abundance of each sample was standardized by using the lowest level of sequence depth as a reference. The OTUs were assigned de novo at 97% identity level. The taxonomic classification of the obtained amplicon sequence variants was also performed using SILVA v.138 database containing data for the SSU rRNA genes [32]. Features with an abundance of less than 10 or that presented in only one sample were filtered out to remove the possible PCR artifacts or chimeras. The OTUs were assigned de novo at 97% identity level. The taxonomic classification of the obtained amplicon sequence variants was also performed using SILVA database containing data for the SSU rRNA genes [32].
Further processing, including the construction of a phylogenetic tree using the FastTree algorithm [33], for the calculation of α and β diversity, was performed within the QIIME2 package [31] and the plugins implemented in it. The diversity indices reflecting the predicted species richness (Faith’s PD) and the degree of evenness (Pielou’s index) were considered to assess the α- diversity.
All measurements were performed in at least three repetitions. For each sample, the mean and standard deviation were calculated in the Excel software product (Microsoft Corp.). Statistical processing was carried out using the Statistica 8.0 program (StatSoft Inc., Tulsa, OK, USA). For paired comparisons, the Student’s criterion (t-test) was used, and the criteria were considered statistically significant at p < 0.05.

3. Results

3.1. The Characteristics of the Sampling Sites and Soil Physicochemical Properties

Characteristics of the vegetation cover and soil profile of the sampling sites are presented in Table 2. Reference sites (M24, 27, and 30) were characterized by 100% undisturbed peat soils with a peat layer of 10–25 cm. They were almost 90% covered with vegetation, including mosses, lichens, and grasses. In the case of peatland micro-landscapes (M30) and mesotrophic peatland micro-landscapes (M27) presented shrub layers. In disturbed sites, the peat layer, if still present in a fraction of the area, was no more than 1–3 cm thick. There was no difference in thawing depth and thickness of the active layer between undisturbed and disturbed areas. The exception was the ombrotrophic peatland micro-landscape, where the permafrost thawing depth was only 1.25 m deep. In all other cases, the thawing depth of about 2 m was not detectable by gauging and was retrieved from the CALM plot data [25]. At the same time, all disturbed areas differed from the reference areas in terms of the depth of soil water table levels. For undisturbed sites, the water table was at a depth of 3–7 cm; on disturbed sites, it was at a depth of more than 30 cm. The exception was the M4 site, where the water table was at a depth of 15 cm.
A summary of the basic soil parameters for the studied soils is presented in Table 3. The key soil physicochemical parameters revealed correlations with environmental conditions and anthropogenic disturbance. The pH values were predominantly slightly acidic. The pH was between 4.55 and 5.37 (Table 4). The exception was point M19, where the pH was 6.25, which seems to be related to anthropogenic contamination. This can be indirectly indicated by the sulfur content, which was not observed at the other sites. The lowest values were found in the samples containing peat and moss material and the highest in the samples of turf with sand. Soil bulk density showed a generally increasing trend with depth of disturbance (M3, M8, M9) across the landscape types, with large variabilities at a given landscape type. The bulk density of peat soil on undisturbed plots was 0.49–0.72 g/cm3, while on disturbed plots, in most cases, it was well over 1 g/cm3, due to high mineral particle content. Ash content on undisturbed plots was 64–77%, while on disturbed plots, in most cases, it approached or even exceeded 90%. The organic content approached or exceeded 30% only for undisturbed plots. For disturbed plots, this value was observed only for site M39; for the rest, it was the first percent.
Unlike the bulk densities, the soil OM content decreased in the disturbed site, and the highest content was found in undisturbed reference sites M24, M30, M27, and slightly sparse disturbance site M39. Soil total C (TC) and N (TN) ranged from 1.4 to 23.4% and from 0.05 to 0.85%, respectively. Organic carbon content was highest (up to 35.8%) in M30, which was the ombrotrophic mire reference site. The contents of nitrogen varied from 0.05 to 0.85%. In addition to the OM content, the soil C: N ratio can provide additional insights on the characteristics of the soil carbon and its potential impact on carbon decomposition. The C:N ratio has been suggested to be a better indicator of the degree of OM decomposition when compared to soil carbon or nitrogen content alone [34]. The analysis of C: N mean values revealed that the soils of the Kumzha site had the widest ratio, likely as a result of the gradual distribution within the illuvial profile. The wide C: N ratio (from 19 to 65) suggested a deficit of nitrogen, inhibited decomposition of the plant remnants, and accumulation of the organic material. This observation supports data reported previously for permafrost-affected soils in various sectors of the Arctic [35] and is needed to properly investigate soil carbon and nitrogen pools in studied sites.

3.2. Results of qPCR Estimates of Bacterial and Fungal Abundance

Quantitative PCR (qPCR) was applied to determine the abundance of bacteria and fungi across disturbance gradients. Strong decreasing trends were observed from low to high disturbance levels (Table 4). The number of bacteria genes copies increased nearly tenfold, and the numbers of fungal copies changed to a lesser extent.

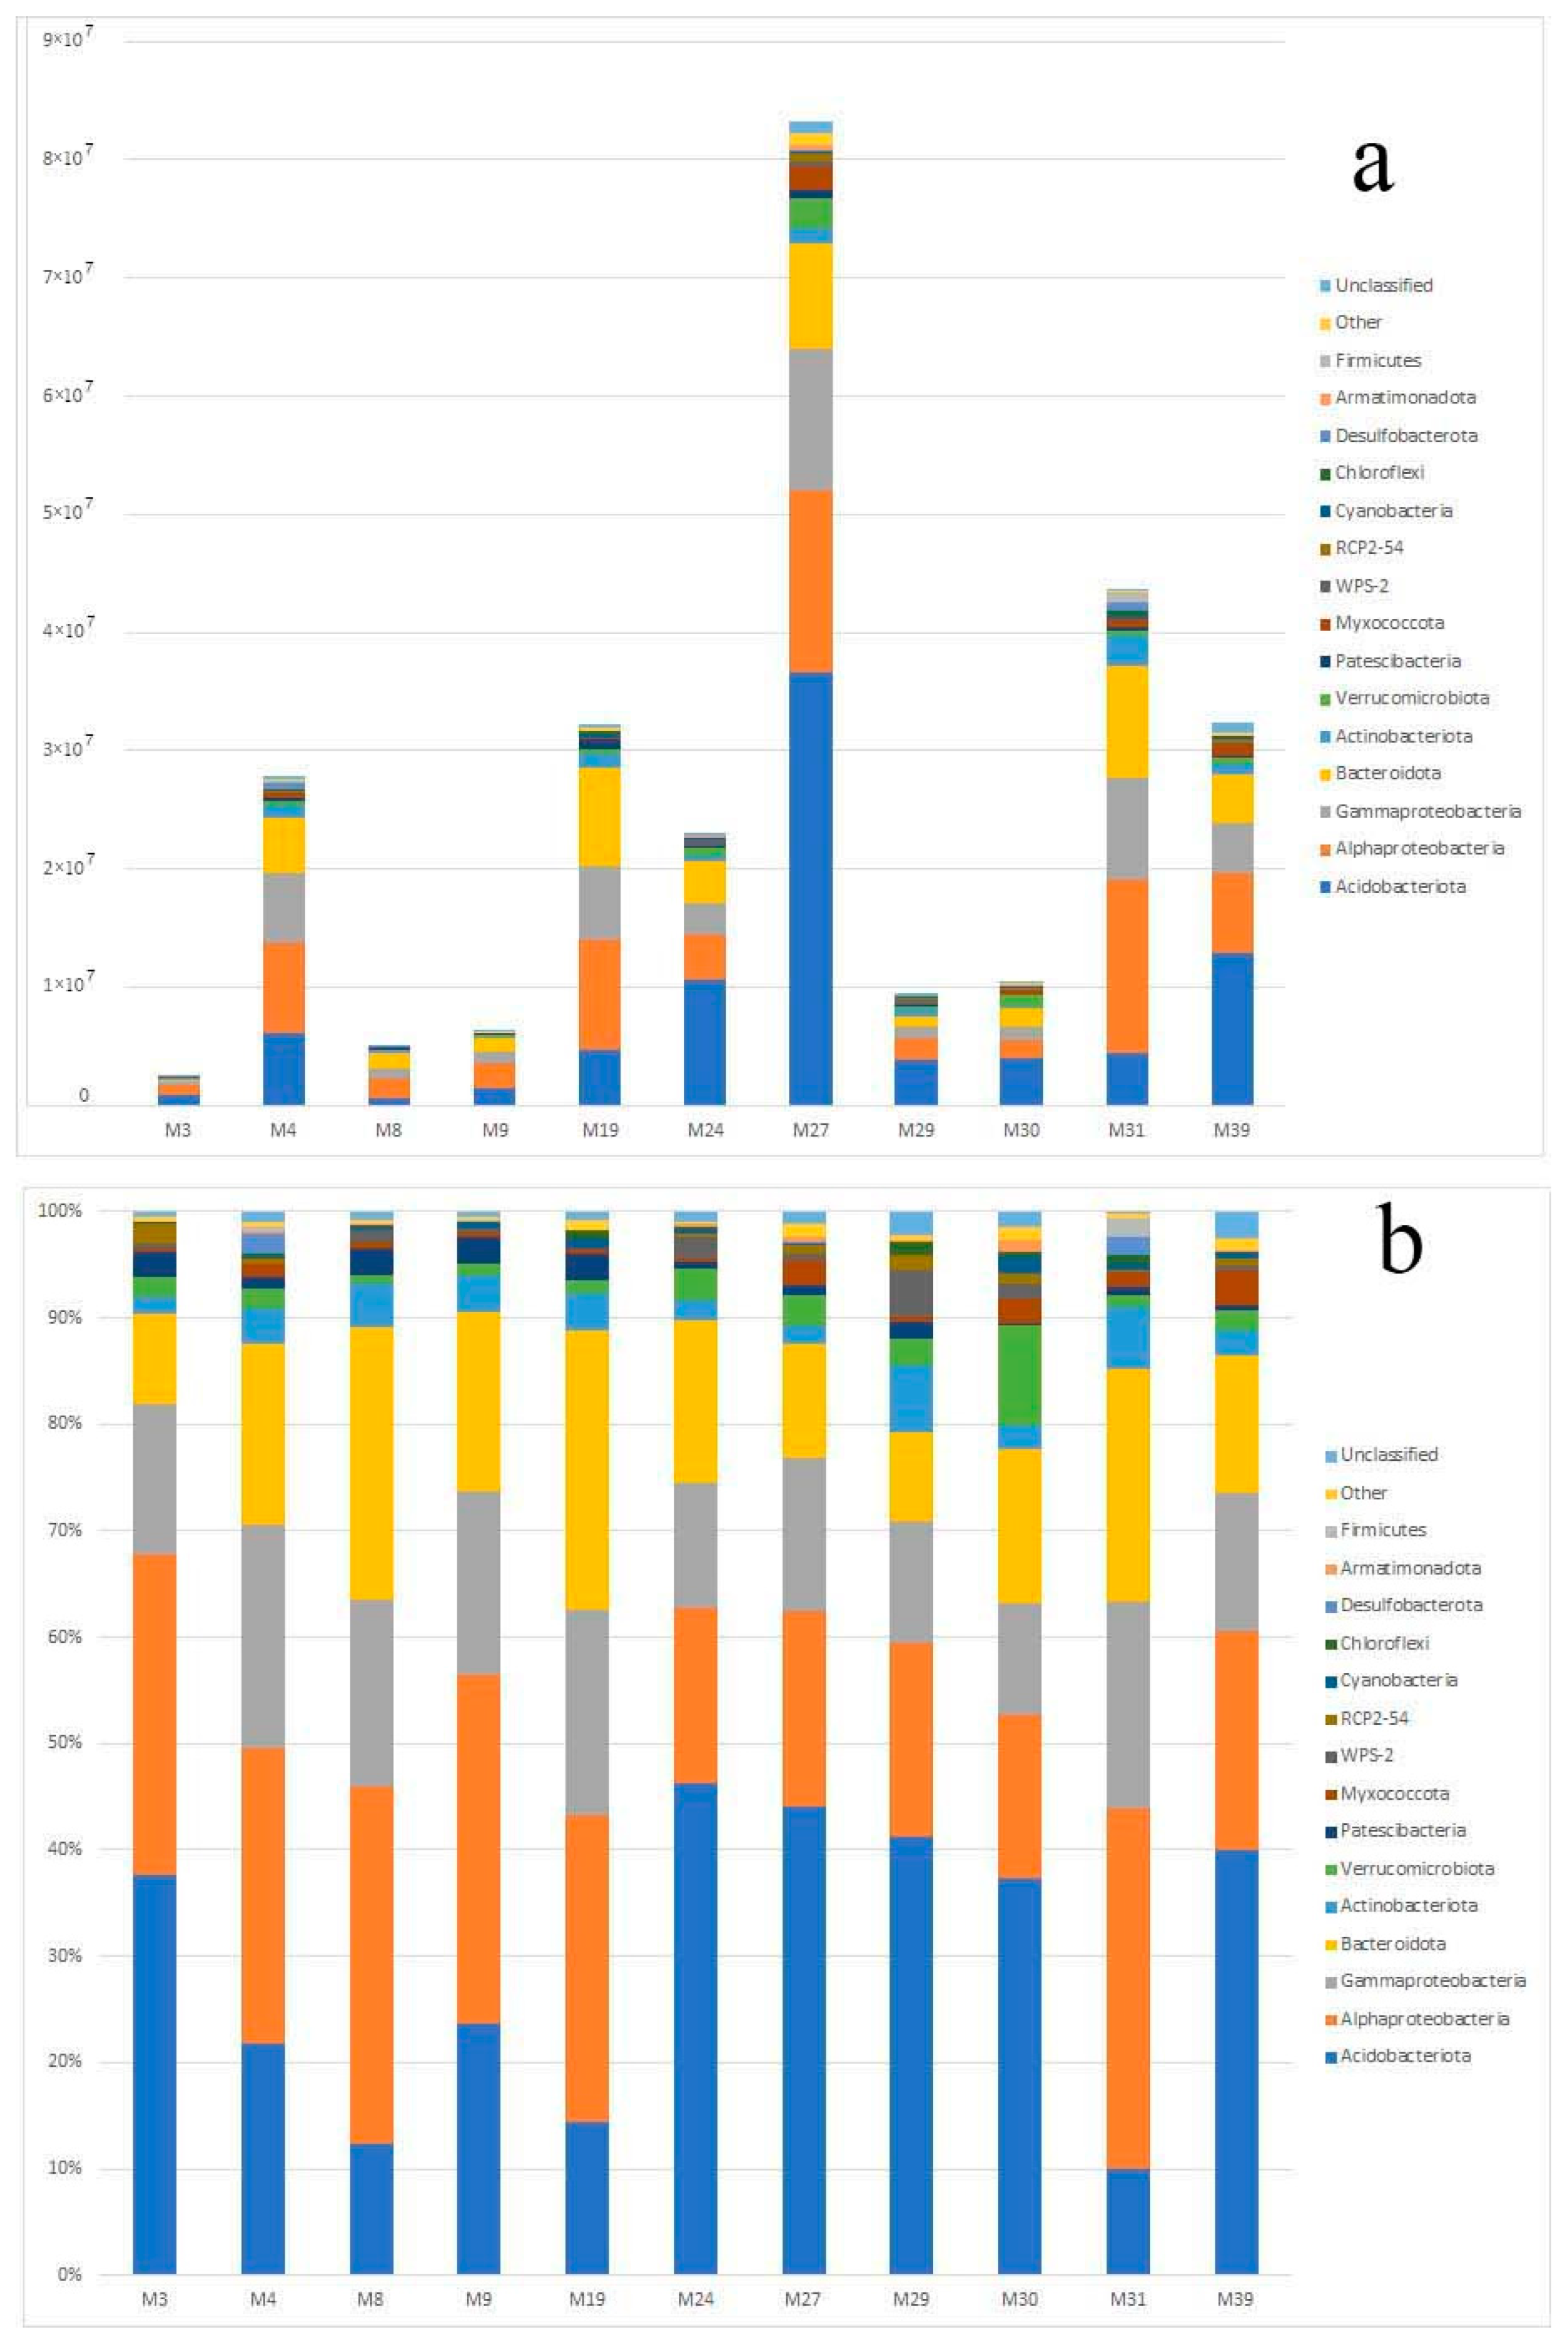
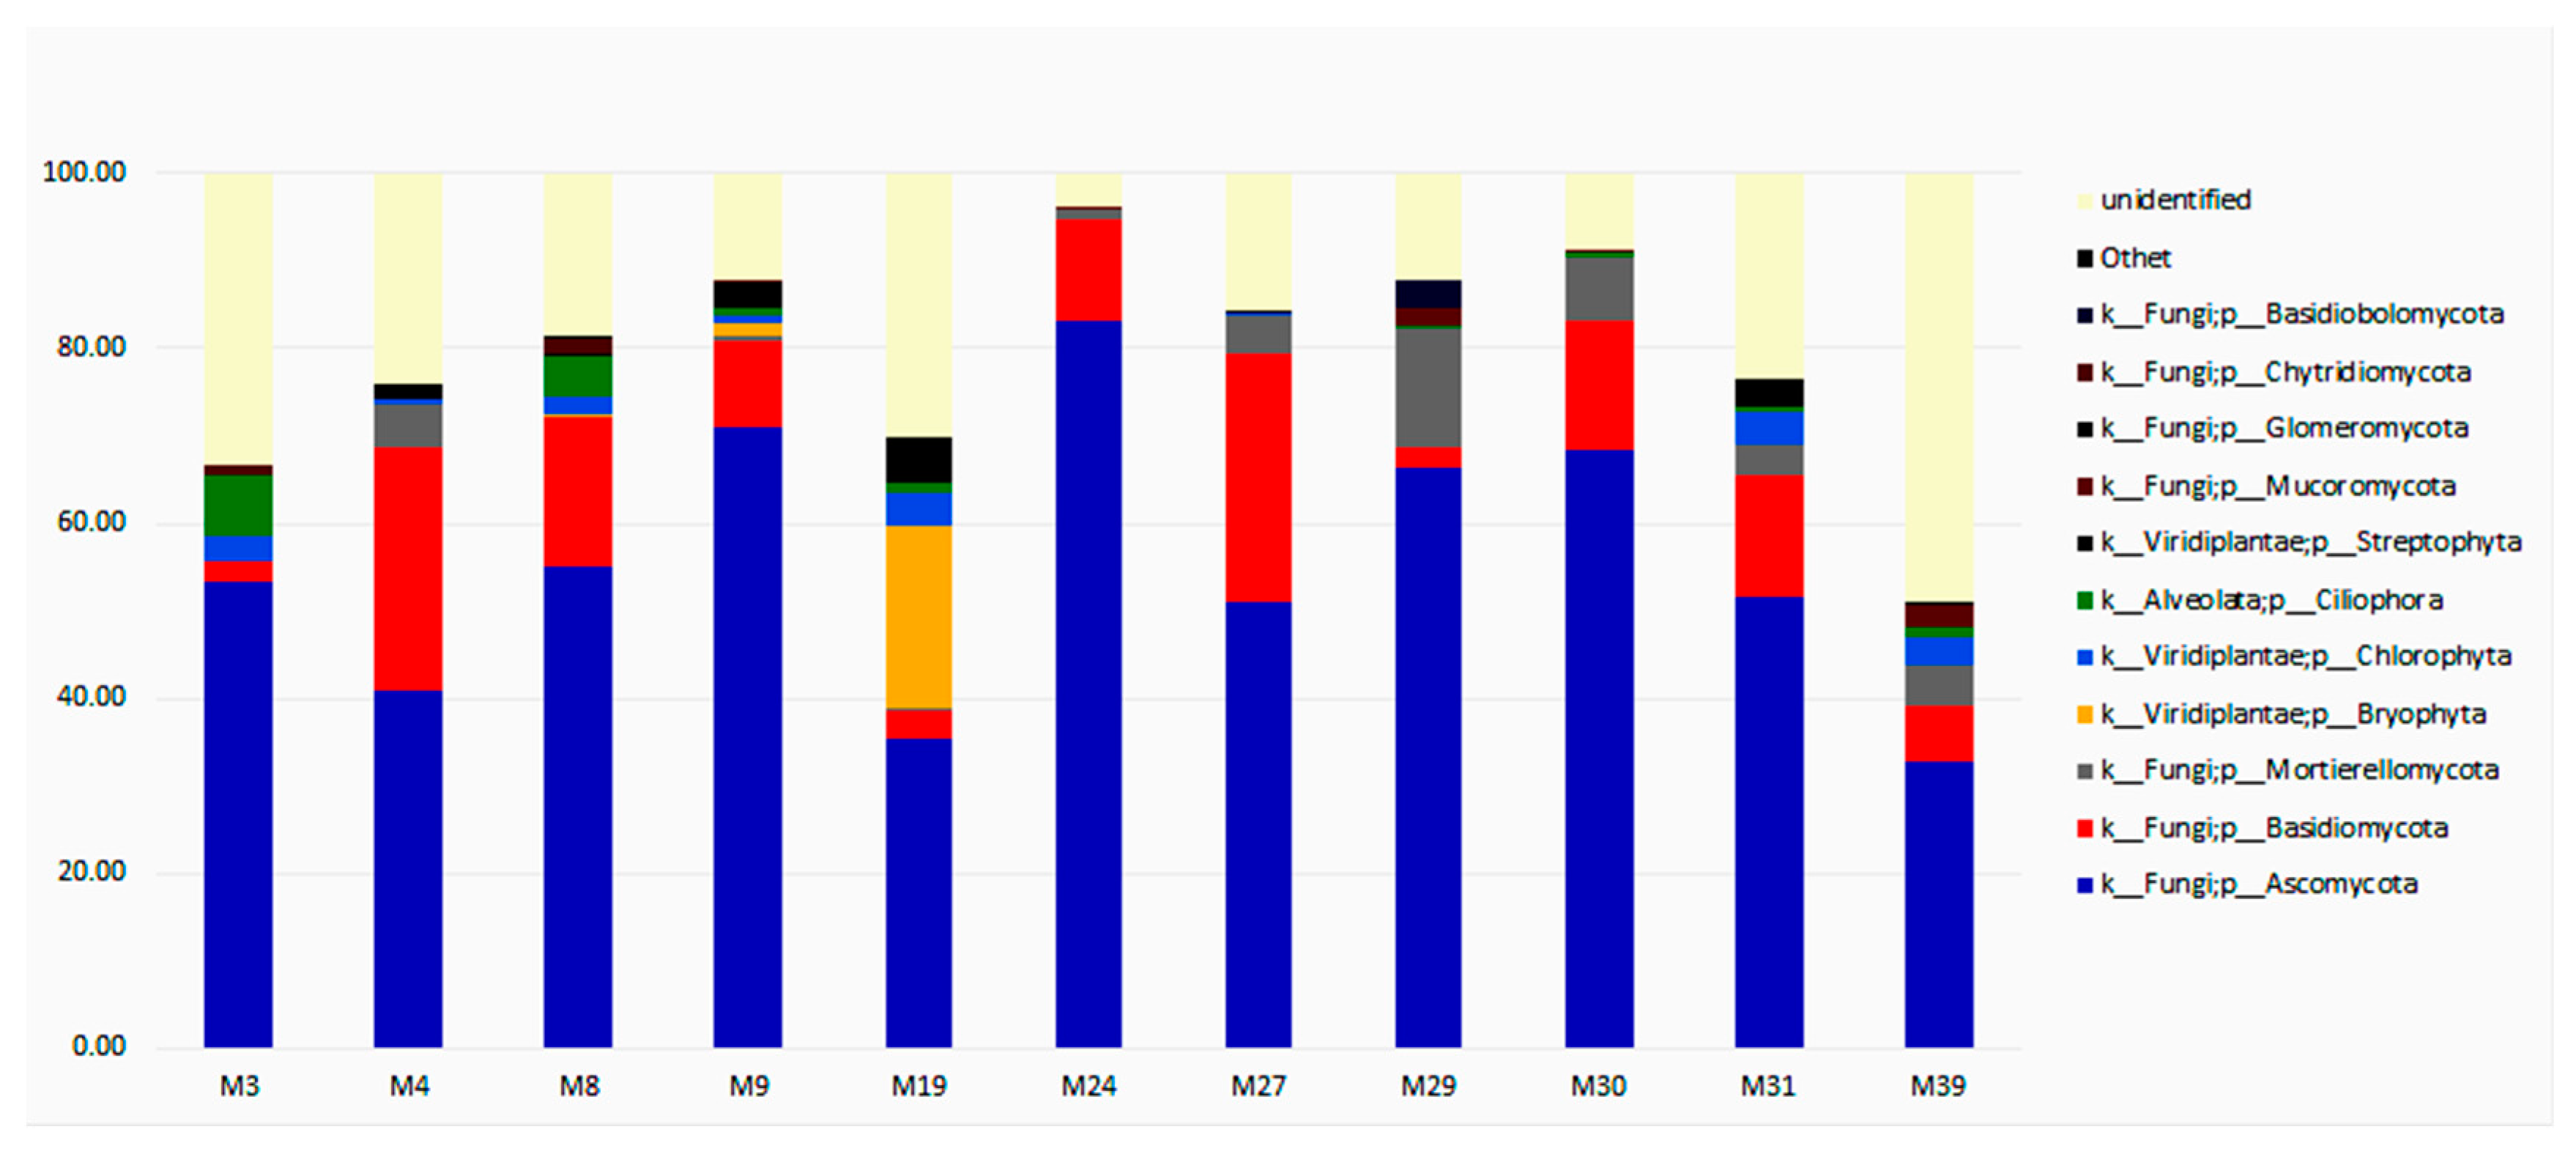
3.3. Taxonomic Diversity and Microbial Community’s Composition

The number of the prokaryotic 16S rRNA gene reads decreased in samples of the disturbed sites M3, M8, and M9 (Figure 3a), especially in the shallow peat tundra on the slopes. The largest number of readings was found in the rich and transition fens reference site M27. This correlated with the values of the number of prokaryotes obtained for these objects by quantitative PCR.
In the soil of undisturbed sites, at the phylum level, the bacterial community was sufficiently aligned, and the dominant phyla were Proteobacteria (30–37%), Acidobacteria (33–45%), Bacteroidetes (10–13%), and Verrucomicrobia (9–12%) (Figure 3b). Representatives of other phyla made up no more than 10–15% of the total number of prokaryotes. Anthropogenic impact leads to changes in the structure of communities at the phylum level. There was a significant decrease in the proportion of Acidobacteria (15–8%) and Verrucomicrobia (4–2%), but the proportion of Proteobacteria increased (45–49%). There was a significant increase in the relative abundance of representatives of the phylum of prokaryotes, whose share in the communities of undisturbed tundra soils was less than 1%, and these included Actinobacteria (3–37%) and Firmicutes (5–8%). For representatives of Planctomycetes, Cyanobacteria, Bacteroidetes, Gemmatimonadetes, Crenarchaeota, and candidates of AD3 and WPS-2 groups, the differences were statistically unreliable.
Analysis of the microscopic fungi in the undisturbed sites showed a significant presence of Ascomycota (30–83%) and Basidiomycota (9–31%). In the samples of disturbed sites, an increase in taxonomic diversity was observed due to representatives of the phyla Mucoromycota, Glomeromycota, and Cilophora (Figure 4). A significant part of the obtained sequences referred to uncultivated organisms.
To explore bacterial and fungal species richness of a particular sample, we calculated phylogenetic diversity using the Faith’s PD index, and species evenness using Pielou’s index and Shannon’s index (Table 5). The assessment of the α diversity of the bacterial community revealed significant differences in the variants. An increase in the overall diversity, the number of OTU, in disturbed sites was noted. This was confirmed by the values of the Chao and Shannon indices.

4. Discussion

Arctic terrestrial ecosystems are the largest depositories of organic carbon, and the loss of their stability is becoming increasingly real in the light of ongoing climate change. Even a slight warming can lead to the involvement of a significant part of the organic matter buried in the Arctic in the carbon cycle, which will make these ecosystems the largest source of greenhouse gas methane (CH4). At the same time, the activity and structure of microbial communities of these soils can be used to indicate changes under the influence of global warming and anthropogenic impact, as well as the effectiveness of the restoration of disturbed peat bogs in the permafrost zone. Taking into account the insufficient knowledge of the microbial communities of the cryosphere, the newly obtained data will significantly supplement the knowledge on the diversity of microorganisms and will allow us to assess their role in this ecosystem while taking into account the metabolic potential.
The soil cover and its functional characteristics of the permafrost-affected ecosystems of the Arctic and highlands has been investigated in only a few pedological and geophysical studies, which have mainly been devoted to undisturbed landscapes of palsa and polygon peatlands sites [36,37,38]. From the standpoint of methods of microbiological studies in this region, they have been limited to the application of conventional microbiological methods [39,40], and several works were performed based on modern molecular approaches [41]. In this study, we used a high-throughput next-generation sequencing approach, which allowed us to significantly expand the understanding of microbial diversity. Generally, Arctic bacterial communities seem to be dominated by taxa differently than in other biomes, which likely reflects the impact of polar environmental conditions on microbial communities [42]. Tundra soils are generally characterized as poorly enriched by organic matter, saturated, and poorly aerated. These conditions result in relatively low levels of microbial diversity [43].
The integrative analysis of data on characteristics of the primary site is reflected in the matrix (Table 6).
The initial landscapes were rated along the resilience gradient from lower to higher resilience. Less resilient are slopes. The organic layer is, as a rule, thin and, due to the sandy bedrock, could be easily destroyed. The ombrotrophic mire micro-landscapes were resilient at the medium level. In contrast, the most resilient were peatlands at the lower positions, depressions, riverine habitats, etc. that were represented by poor and transition fens.
The revealed differences in the diversity of the bacterial communities prompted us to study mor deeply the differences in the taxonomic composition and relative abundance of bacterial taxa. Beta diversity was analyzed to elucidate major drivers of microbial community composition using the weighted UniFrac distance metric, which uses phylogenetic information to compare environmental samples. Non-metric multidimensional scaling (NMDS) indicated habitat type as the vector responsible for the greatest variability (Figure 5). Our results showed that the microbial communities of the studied sites demonstrated pronounced clustering for similar habitats types and were clearly separated from others.
The analysis of the relative representation of bacteria showed that a sharp decrease in the content of acidobacteria of the genus Granulicella and Candidatus Solibacter could indicate anthropogenic disturbance (Figure 6).
Data on the composition of methanotrophs and closely related trophic methylotrophic microorganisms can also be an important indicator of disturbance. Methanotrophic Proteobacteria were not found in the studied samples of undisturbed objects. Methylacidiphilaceae are probably responsible for methane oxidation in these soils (Figure 7). Their high proportion was also registered on the disturbed slopes, where permafrost thaw is very intensive [24].
At the same time, methanotrophic Proteobacteria Methylobacterium-Methylorubrum and facultatively methylotrophic psychrotolerant bacterium Methylorosula were detected only in the anthropogenically disturbed objects, and the proportion of methanotrophic verrucomicrobia was significantly lower. The data obtained convincingly indicate changes in microbial communities of the methane cycle under anthropogenic influences, which allows us to consider them as indicators for environmental monitoring.
Numerous natural and anthropogenic factors influence soil microbial communities, and these factors must be considered when interpreting microbiome parameters. In this work, we discuss only some of these factors. It should be noted, however, that, in the current study, climatic parameters (such as temperature and precipitation), which can significantly affect the soil microbial community, probably did not impact microbial diversity. This is because all study sites were chosen in the same bioclimatic region and were, therefore, exposed to similar weather conditions.

5. Conclusions

Intact and disturbed permafrost-affected Arctic shallow peat soils are diverse in terms of microbial life. Our research demonstrated that, despite very harsh Arctic environments, the diversity of its soil bacterial communities is as high as in other biomes. Anthropogenic disturbance leads to a significant decrease in the representation of Acidobacteria and Verrucomicrobia, while the proportion and diversity of Proteobacteria increase. Fungal communities in undisturbed sites may be characterized as monodominant, and anthropogenic impact leads to an increase in fungal diversity. The patterns of changes depend on the initial landscape and level of disturbance. The usual proteobacterial methanotrophs were not detected in undisturbed reference sites, while Methylobacterium-Methylorubrum associated with methylotrophic Methylorosula were found in the disturbed sites.

Author Contributions

Conceptualization, methodology, I.K., T.M. and A.S.; resources, T.M. and A.S.; formal analysis, I.K., D.G. and M.S.; writing—original draft preparation, I.K. and T.M.; writing—review and editing, I.K., T.M. and A.S.; visualization, I.K. and T.M. All authors have read and agreed to the published version of the manuscript.

Funding

The work was supported by the AWERRS project ‘‘Arctic Wetlands Ecosystems—Resilience through Restoration & Stewardship’’—a joint project of the Belmont Forum (CRA Arctic II) and the Russian Foundation for Basic Research (Research Project 20-54-71002) and by the Ministry of Science and Higher Education of the Russian Federation (122040800164-6 for IK and 122040860186-8 for MS).

Institutional Review Board Statement

Not applicable.

Data Availability Statement

The raw data generated from 16S rRNA sequencing of microbial communities have been deposited in the NCBI Sequence Read Archive (SRA) under the accession numbers SRX18380871–SRX18380881 (Bioproject PRJNA904242).

Acknowledgments

We are grateful to the Nenets State Nature Reserve and personally to its director, Stanislav Zolotoy, for the assistance with the fieldwork. We thank Dmitry Moseyev who carried out part of the geobotanical relevés, Margarita Boychuk for the identification of bryophytes, and Ekaterina Kulyugina for the identification of the vascular plants. Soil CNS analysis was performed by Gennady Suvorov and Olesya Firsova, Institute of Forest Science RAS; soil bulk density and moisture were measured at the Agriculture lab in Naryan-Mar. We thank Maria Medvedeva and Yuliya Denisova for their assistance in mapping material. The qPCR analysis was carried out using the equipment of the Core facility “Bioengineering”, Research Center of Biotechnology RAS.

Conflicts of Interest

The authors declare no conflict of interest.

References

  1. Masson-Delmotte, V.; Zhai, P.; Pirani, A.; Connors, S.; Péan, C.; Berger, S.; Caud, N.; Chen, Y.; Goldfarb, L.; Gomis, M.; et al. (Eds.) IPCC, 2021: Climate Change 2021: The Physical Science Basis. Contribution of Working Group I to the Sixth Assessment Report of the Intergovernmental Panel on Climate Change; Cambridge University Press: Cambridge, UK; New York, NY, USA, 2021; p. 2391. [Google Scholar] [CrossRef]
  2. Shukla, P.R.; Skea, J.; Calvo Buendia, E.; Masson-Delmotte, V.; Pörtner, H.-O.; Roberts, D.C.; Zhai, P.; Slade, R.; Connors, S.; van Diemen, R.; et al. (Eds.) IPCC, 2019. Climate Change and Land: An IPCC Special Report on Climate Change, Desertification, Land Degradation, Sustainable Land Management, Food Security, and Greenhouse Gas Fluxes in Terrestrial Ecosystems; IPCC: Geneva, Switzerland, 2019; Available online: https://www.ipcc.ch/srccl/ (accessed on 20 November 2022).
  3. Parish, F.; Sirin, A.; Charman, D.; Joosten, H.; Minayeva, T.; Silvius, M.; Stringer, L. (Eds.) Assessment on Peatlands, Biodiversity and Climate Change: Main Report; Global Environment Centre: Kuala Lumpur, Malaysia; Wetlands International: Wageningen, The Netherlands, 2008; pp. 118–138. [Google Scholar]
  4. Joosten, H.; Sirin, A.; Couwenberg, J.; Laine, J.; Smith, P. The role of peatlands in climate regulation. In Peatland Restoration and Ecosystem Services: Science, Policy and Practice; Bonn, A., Allott, T., Evans, M., Joosten, H., Stoneman, R., Eds.; Cambridge University Press: Cambridge, UK, 2016; pp. 66–79. [Google Scholar] [CrossRef]
  5. Minayeva, T.Y.; Sirin, A.A. Peatland biodiversity and climate change. Biol. Bull. Rev. 2012, 2, 164–175. [Google Scholar]
  6. Minayeva, T.Y.; Bragg, O.M.; Sirin, A.A. Towards ecosystem-based restoration of peatland biodiversity. Mires Peat 2017, 19, 1–36. [Google Scholar] [CrossRef]
  7. Minayeva, T.; Sirin, A.; Kershaw, P.; Bragg, O. Arctic Peatlands. In The Wetland Book II: Distribution, Description, and Conservation; Springer: Dordrecht, The Netherlands, 2018; pp. 275–288. [Google Scholar] [CrossRef]
  8. Minayeva, T.; Sirin, A. Arctic peatlands. In Arctic Biodiversity Trends 2010–Selected Indicators of Change; CAFF International Secretariat: Akureyri, Iceland, 2010; pp. 71–74. Available online: http://www.arcticbiodiversity.is/images/stories/report/pdf/Arctic_Biodiversity_Trends_Report_2010.pdf (accessed on 20 November 2022).
  9. Sirin, A.A. Bolota. In Rossijskaya Arktika: Prostranstvo. Vremya. Resursy. Atlas; Agafonova, S.A., Ajbulatov, D.N., Baburin, V.L., Eds.; Feoriya: Moscow, Russia, 2019; pp. 344–345. (In Russian) [Google Scholar]
  10. Naylor, D.; Sadler, N.; Bhattacharjee, A.; Graham, E.B.; Anderton, C.R.; McClure, R.; Lipton, M.; Hofmockel, K.S.; Jansson, J.K. Soil Microbiomes Under Climate Change and Implications for Carbon Cycling. Annu. Rev. Environ. Resour. 2020, 45, 29–59. [Google Scholar] [CrossRef]
  11. Grosse, G.; Harden, J.W.; Turetsky, M.; McGuire, A.D.; Camill, P.; Tarnocai, C.; Frolking, S.; Schuur, E.A.G.; Jorgenson, T.; Marchenko, S.; et al. Vulnerability of high-latitude soil organic carbon in North America to disturbance. J. Geophys. Res. Atmos. 2011, 116, G00K06. [Google Scholar] [CrossRef]
  12. Muhammad, I.; Lv, J.Z.; Wang, J.; Ahmad, S.; Farooq, S.; Ali, S.; Zhou, X.B. Regulation of Soil Microbial Community Structure and Biomass to Mitigate Soil Greenhouse Gas Emission. Front. Microbiol. 2022, 13, 868862. [Google Scholar] [CrossRef]
  13. Andersen, R.; Chapman, S.; Artz, R. Microbial communities in natural and disturbed peatlands: A review. Soil Biol. Biochem. 2012, 57, 979–994. [Google Scholar] [CrossRef]
  14. Yu, S.; Ehrenfeld, J.G. Relationships among plants, soils and microbial communities along a hydrological gradient in the New Jersey Pinelands, USA. Ann. Bot. 2010, 105, 185–196. [Google Scholar] [CrossRef]
  15. Ji, M.; Kong, W.; Liang, C.; Zhou, T.; Jia, H.; Dong, X. Permafrost thawing exhibits a greater influence on bacterial richness and community structure than permafrost age in Arctic permafrost soils. Cryosphere 2020, 14, 3907–3916. [Google Scholar] [CrossRef]
  16. Aksenov, A.; Shirokova, L.; Kisil, O.; Kolesova, S.; Lim, A.; Kuzmina, D.; Pouillé, S.; Alexis, M.; Castrec-Rouelle, M.; Loiko, S.; et al. Bacterial Number and Genetic Diversity in a Permafrost Peatland (Western Siberia): Testing a Link with Organic Matter Quality and Elementary Composition of a Peat Soil Profile. Diversity 2021, 13, 328. [Google Scholar] [CrossRef]
  17. Liu, L.; Wang, Z.; Ma, D.; Zhang, M.; Fu, L. Diversity and Distribution Characteristics of Soil Microbes across Forest–Peatland Ecotones in the Permafrost Regions. Int. J. Environ. Res. Public Health 2022, 19, 14782. [Google Scholar] [CrossRef]
  18. Vitorino, L.C.; Bessa, L.A. Microbial Diversity: The Gap between the Estimated and the Known. Diversity 2018, 10, 46. [Google Scholar] [CrossRef]
  19. Liu, S.; Moon, C.D.; Zheng, N.; Huws, S.; Zhao, S.; Wang, J. Opportunities and challenges of using metagenomic data to bring uncultured microbes into cultivation. Microbiome 2022, 10, 76. [Google Scholar] [CrossRef] [PubMed]
  20. Tanneberger, F.; Moen, A.; Barthelmes, A.; Lewis, E.; Miles, L.; Sirin, A.; Tegetmeyer, C.; Joosten, H. Mires in Europe—Regional Diversity, Condition and Protection. Diversity 2021, 13, 381. [Google Scholar] [CrossRef]
  21. Moen, A.; Joosten, H.; Tanneberger, F. Mire diversity in Europe: Mire regionality. In Mires and Peatlands of Europe. Status, Distribution and Conservation; Joosten, H., Tanneberger, F., Moen, A., Eds.; Schweizerbart: Stuttgart, Germany, 2017; pp. 97–150. [Google Scholar]
  22. Sirin, A.; Minayeva, T.; Yurkovskaya, T.; Kuznetsov, O.; Smagin, V.; Fedotov, Y.U. Russian Federation (European Part). In Mires and Peatlands of Europe: Status, Distribution and Conservation; Joosten, H., Tanneberger, F., Moen, A., Eds.; Schweizerbart Science Publishers: Stuttgart, Germany, 2017; pp. 589–616. [Google Scholar] [CrossRef]
  23. Minaevoj, T.Y. E`Kologicheskaya Restavracziya v Arktike: Obzor Mezhdunarodnogo i Rossijskogo opy`ta. [Ecological Restoration in the Arctic: A Review of International and Russian Experience]; Sy`kty`vkar-Nar`yan-Mar; Triada Publ.: Sewickley, PA, USA, 2016; p. 287. ISBN 978-5-94789-751-7. (In Russian) [Google Scholar]
  24. Sudakova, M.; Sadurtdinov, M.; Skvortsov, A.; Tsarev, A.; Malkova, G.; Molokitina, N.; Romanovsky, V. Using Ground Penetrating Radar for Permafrost Monitoring from 2015–2017 at CALM Sites in the Pechora River Delta. Remote Sens. 2021, 13, 3271. [Google Scholar] [CrossRef]
  25. Nikonova, A.N. Transformation of Floodplain Ecosystems in the Pechora Delta within the Kumzhinsk Gas Condensate Field (Nenets Autonomous Okrug). Izvestiya Rossiiskoi Akademii Nauk. Seriya Geogr. 2015, 5, 117–129. (In Russian) [Google Scholar] [CrossRef]
  26. Korchagin, A.A. Structure of plant communities. In Field Geobotany; Nauka: Moscow, Russia, 1976; Volume 5, 313p. [Google Scholar]
  27. Fierer, N.; Jackson, J.A.; Vilgalys, R.; Jackson, R.B. Assessment of Soil Microbial Community Structure by Use of Taxon-Specific Quantitative PCR Assays. Appl. Environ. Microbiol. 2005, 71, 4117–4120. [Google Scholar] [CrossRef]
  28. Martin, K.J.; Rygiewicz, P.T. Fungal-specific PCR primers developed for analysis of the ITS region of environmental DNA extracts. BMC Microbiol. 2005, 5, 28. [Google Scholar] [CrossRef] [Green Version]
  29. Banos, S.; Lentendu, G.; Kopf, A.; Wubet, T.; Glöckner, F.O.; Reich, M. A comprehensive fungi-specific 18S rRNA gene sequence primer toolkit suited for diverse research issues and sequencing platforms. BMC Microbiol. 2018, 18, 190. [Google Scholar] [CrossRef]
  30. Martin, V. Cutadapt removes adapter sequences from high-throughput sequencing reads. EMBnet J. 2011, 17, 10–12. [Google Scholar] [CrossRef]
  31. Bolyen, E.; Rideout, J.R.; Dillon, M.R.; Bokulich, N.A.; Abnet, C.C.; Al-Ghalith, G.A.; Alexander, H.; Alm, E.J.; Arumugam, M.; Asnicar, F.; et al. Reproducible, interactive, scalable and extensible microbiome data science using QIIME 2. Nat. Biotechnol. 2019, 37, 852–857. [Google Scholar] [CrossRef]
  32. Quast, C.; Pruesse, E.; Yilmaz, P.; Gerken, J.; Schweer, T.; Yarza, P.; Peplies, J.; Glöckner, F.O. The SILVA ribosomal RNA gene database project: Improved data processing and web-based tools. Nucleic Acids Res. 2012, 41, D590–D596. [Google Scholar] [CrossRef] [PubMed]
  33. Price, M.N.; Dehal, P.S.; Arkin, A.P. FastTree 2—Approximately Maximum-Likelihood Trees for Large Alignments. PLoS ONE 2010, 5, e9490. [Google Scholar] [CrossRef]
  34. Vieira, S.; Sikorski, J.; Dietz, S.; Herz, K.; Schrumpf, M.; Bruelheide, H.; Scheel, D.; Friedrich, M.W.; Overmann, J. Drivers of the composition of active rhizosphere bacterial communities in temperate grasslands. ISME J. 2020, 14, 463–475. [Google Scholar] [CrossRef]
  35. Strauss, J.; Schirrmeister, L.; Mangelsdorf, K.; Eichhorn, L.; Wetterich, S.; Herzschuh, U. Organic-matter quality of deep permafrost carbon—A study from Arctic Siberia. Biogeosciences 2015, 12, 2227–2245. [Google Scholar] [CrossRef]
  36. Wu, Y.; Ulrich, C.; Kneafsey, T.; Lopez, R.; Chou, C.; Geller, J.; McKnight, K.; Dafflon, B.; Soom, F.; Peterson, J.; et al. Depth-Resolved Physicochemical Characteristics of Active Layer and Permafrost Soils in an Arctic Polygonal Tundra Region. J. Geophys. Res. Biogeosci. 2018, 123, 1366–1386. [Google Scholar] [CrossRef]
  37. Matyshak, G.V.; Bogatyrev, L.G.; Goncharova, O.Y.; Bobrik, A.A. Specific features of the development of soils of hydromorphic ecosystems in the Northern Taiga of Western Siberia under conditions of cryogenesis. Eurasian Soil Sci. 2017, 50, 1115–1124. [Google Scholar]
  38. Pastukhov, A.; Kovaleva, V.; Kaverin, D. Microbial community structure in ancient European Arctic Peatlands. Plants 2022, 11, 2704. [Google Scholar] [CrossRef]
  39. Alekseev, I.; Shamilishvilly, G.; Abakumov, E. Content of trace elements in selected permafrost-affected soils of Yamal region with different functional load. Polarforschung 2014, 88, 125–133. [Google Scholar] [CrossRef]
  40. Kitrsidelli, I.Y.; Vlasov, D.Y.; Barantsevich, E.P.; Krylenkov, V.A.; Sokolov, V.T. Kompleksy mikroskopicheskih gribov v pochvah i gruntah poljarnogo ostrova Izvestija Cik (Karskoje more). (Microfungi from soil of polar Island Izvestia tsik [Kara Sea]). Mikol. Fitopatol. 2014, 48, 365–371. [Google Scholar]
  41. Vlasov, D.; Abakumov, E.; Tomashunas, V.; Krylenkov, V.; Zelenskaya, M. Micobiota pochv i antropogennyh substratov poluostrova Jamal. (Mycobiota of soil and anthropogenic substrates of the Yamal Peninsula). Gig. Sanit. 2014, 5, 49–51. [Google Scholar]
  42. Alekseev, I.; Zverev, A.; Abakumov, E. Organic carbon and microbiome in tundra and forest–tundra permafrost soils, southern Yamal, Russia. Polar Res. 2021, 40, 5283. [Google Scholar] [CrossRef]
  43. Malard, L.; Anwar, M.Z.; Jacobsen, C.S.; Pearce, D. Biogeographical patterns in soil bacterial communities across the Arctic region. FEMS Microbiol. Ecol. 2019, 95, fiz128. [Google Scholar] [CrossRef] [PubMed] [Green Version]
Figure 1. Location of study area in relation to the European mire regions marked with the red frame, the Pechora River delta, and a general view of the site from the quadcopter. The European mire regions are given according to [20], as simplified from [21]: I—Arctic seepage and polygon mire region, II—palsa mire region, III—northern fen region, IV—typical raised bog region.
Diversity 15 00251 g001
Figure 2. Characteristic types of micro-landscapes represented in the studied peatlands. The numbers indicate the monitoring plots.
Diversity 15 00251 g002
Figure 3. The number of bacterial sequences (a) and the taxonomic structure at the phylum level of the bacterial community of the studied soils in % of the total number of sequences in the sample (b) according to high-throughput sequencing of 16s rRNA. The median value of the three replicate samples per sampling site is presented. The taxa constituting >1% in at least one library are listed.
Diversity 15 00251 g003
Figure 4. Taxonomic structure of the fungal community at the phylum level in the studied soils, % of the total number of sequences in the sample according to ITS data.
Diversity 15 00251 g004
Figure 5. Non-metric multidimensional scaling (NMDS) plot based on the Bray–Curtis similarity coefficients of experimental soil samples. Points closer to one another in ordination space are more similar than those apart.
Diversity 15 00251 g005
Figure 6. Comparison of the bacterial community structure at the phylum level across all studied sites. Abbreviations: blue boxplots—undisturbed sites, red boxplots—disturbed sites; outliers in a data set are indicated by the blue rhombus. See Table 6 for details.
Diversity 15 00251 g006
Figure 7. Distribution patterns of methylotrophs retrieved from the peat samples.
Diversity 15 00251 g007
Table 1. General characteristic of the sampling sites.
Site IDCoordinatesElevation, mInitial Micro-LandscapeDominating Current VegetationDisturbance TypeRestoration Action
M30N 68°11′31.25″; E 53°46′41.29″4.0Ombrotrophic mires of flat landscapesSedge, lichen, sphagnum hummocks within fenReferenceNo
M24N 68°11′36.51″; E 53°46′46.35″6.1Shallow peat tundra on the slopeLichen, dwarf shrubs with dwarf birchReferenceNo
M27N 68°11′38.58″; E 53°46′47.18″4.0Fens on the lowlands and riverine habitatsBrown moss forbs, willow dwarf birchReferenceNo
M19N 68°11′35.70″; E 53°47′11.92″6.5Ombrotrophic mires of flat landscapesGrass, moss mesophilic with shrubsArealSelf-regeneration
M3N 68°11′37.78″; E 53°47′15.74″6.1Shallow peat tundra on the slope Grass, forbs xerophilic with crustArealSelf-regeneration
M8N 68°11′37.04″; E 53°47′15.68″5.4Fens on the lowlands and riverine habitatsGrass, forbs xerophilic with crustArealSelf-regeneration
M9N 68°11′38.27″; E 53°47′15.68″5.4Fens on the lowlands and riverine habitatsGrass, forbs xerophilic with lichensArealEcological restoration
M39N 68°11′35.55″; E 53°46′50.42″5.6Ombrotrophic mires of flat landscapesLichen, dwarf birchScatteredSelf-regeneration
M29N 68°11′35.81″; E 53°46′50.50″5.6Shallow peat tundra on the slopeLichen, dwarf shrubsScatteredSelf-regeneration
M31N 68°11′37.49″; E 53°46′54.36″5.2Shallow peat tundra on the slopeMoss, forbs, willow dwarf birchLinearSelf-regeneration
M4N 68°11′38.94″; E 53°46′47.45″4.0Fens on the lowlands and riverine habitatsBrown moss, forbs with willowLinearSelf-regeneration
Table 2. Descriptive characteristics of soil profile and vegetation cover of the sampling sites.
Site IDOrganic Soil LayerUnderlying BedrockVegetation Cover, %Litter Cover, %Number of High Plants SpeciesAverage Vegetation Height, cmSoil Water Level, cmActive Layer Depth, m
TypeCover, %Depth, cmOverallShrubHerbMoss, LichenShrubHerb
Reference sites
M30peat10012sandy loess9540509015196025−31.25
M24peat and litter10010sandy loess903408502310040−52.2
M27moss, litter, turf, peat10025sand9030703001512040−7>1.80
Areal disturbance
M19turf, moss, litter803sand and technogenic loam905702020191535>30>1.80
M3litter, crust, and lichen502sand3002010106030>30>1.80
M8crust and lichen302sand3503030511030>30>1.80
M9crust 51sand200205511030>302.2
Scattered disturbance
M39peat and litter1006sand10040605020148025>302
M29moss, lichen, turf, peat806sand9007560013040>30>1.80
Linear disturbance
M31turf and peat906sand70070202011030>30>1.80
M4litter and crust652sand90080601014015−15>1.80
Table 3. Physicochemical parameters of the topsoil material in the studied sites.
Site IDMaterialpHBulk Density, g/cm3Moisture Content, %Ash Content, %Organic Matter, %TC, %TN, %C:NTS, %
Reference sites
M30peat and moss4.940.5464.0064.235.8n.d.n.d.n.d.n.d.
M24peat, moss, lichen4.550.7238.0072.327.7n.d.n.d.n.d.n.d.
M27moss, turf and peat with sand5.030.4954.0076.823.1616.20.85190.00
Areal disturbance
M19turf with sand6.251.1512.9089.510.555.20.08651.07
M3sand and humified sand5.371.3510.3898.11.887.40.23320.00
M8sand and humified sand5.301.345.7098.91.091.40.05280.00
M9sand and humified sand5.341.4410.4499.10.911.40.05280.00
Scattered disturbance
M39lichen and peat 5.320.2639.0068.8731.1323.40.61380.00
M29moss, turf with sand4.630.9412.8093.86.236.50.24270.00
Linear disturbance
M31litter and turf with sand5.321.266.7098.81.202.20.07310.00
M4moss, crust and turf with sand4.901.0116.6096.43.564.30.19230.00
n.d.—not determined.
Table 4. The abundance of bacteria and fungi, as indicated by the number of 16S rRNA and ITS copies measured using quantitative PCR (qPCR).
Sample IDBacteria, 16S rRNA Copies g−1Fungi, ITS Copies g−1
Reference sites
M3010.50 ± 2.1 × 10914.56 ± 4.2 × 10⁶
M241.30 ± 0.8 × 10¹⁰ 7.20 ± 2.2 × 10⁷
M278.32 ± 1.8 × 1096.94 ± 2.2 × 10⁷
Areal disturbance
M193.22 ± 1.2 × 10¹⁰ 4.42 ± 0.4 × 10⁷
M32.42 ± 0.8 × 10⁹ 15.72 ± 4.4 × 10⁵
M84.98 ± 0.8 × 10⁹ 7.98 ± 2.4 × 10⁶
Scattered disturbance
M393.24 ± 0.8 × 10105.52 ± 1.1 × 10⁶
M299.46 ± 2.2 × 10⁹ 14.52 ± 5.4 × 10⁶
M96.20 ± 2.3 × 10⁹ 2.14 ± 0.6 × 10⁷
Linear disturbance
M314.36 ± 1.1 × 10105.72 ± 1.7 × 10⁷
M42.78 ± 0.6 × 10102.70 ± 0.3 × 10⁷
Table 5. Alpha diversity indices of the soil bacterial communities based on the 16S rRNA gene analysis and fungal communities based on ITS analysis.
Site IDOTU NumberChao1ShannonSimpsonRichnessRaw
Bacteria
M301290 ± 271850.4 ± 123.18.58 ± 0.150.9916 ± 0.0020.6971± 0.00417,138
M241102 ± 421590.6 ± 111.57.82 ± 0.310.9809± 0.0030.6928 ± 0.00716,413
M271594 ± 212205.0 ± 126.18.97 ± 0.170.9935± 0.0010.7229 ± 0.00919,948
M191910 ± 242149.3 ± 118.49.32 ± 0.230.9941± 0.0040.8887± 0.01223,801
M31149 ± 151766.4 ± 117.38.56 ± 0.300.9932± 0.0030.6504 ± 0.01112,281
M81483 ± 232313.3 ± 124.49.2 ± 0.270.9959± 0.0010.6411± 0.02212,929
M91498 ± 192120.3 ± 119.88.86 ± 0.160.9947± 0.0040.7065 ± 0.01617,177
M391207 ± 111604.9 ± 111.28.83 ± 0.170.9935± 0.0030,7521 ± 0.01113,580
M291287 ± 161775.2 ± 121.18.90 ± 0.220.9952± 0.0040.7250 ± 0.01416,899
M311936 ± 222789.9 ± 125.49.93 ± 0.240.9976± 0.0020.6939 ± 0.02313,521
M42030 ± 263055.0 ± 128.69.96 ± 0.190.9978± 0.0040.6645 ± 0.01915,428
Fungi
M30407 ± 3444.0 ± 47.46.17 ± 0.110.9694 ± 0.0040.9167 ± 0.00619,346
M24435 ± 5476.6 ± 39.53.98 ± 0.230.7591 ± 0.0020.9128 ± 0.00820,937
M27116 ± 2139.0 ± 29.34.21 ± 0.240.8632 ± 0.0010.8348 ± 0.00560,281
M19410 ± 5422.2 ± 22.16.14 ± 0.330.9635 ± 0.0030.9711 ± 0.00723,848
M3413 ± 2438.4 ± 14.25.15 ± 0.180.9341± 0.0020.9420 ± 0.00513,908
M8670 ± 6705.6 ± 31.16.72 ± 0.170.9724 ± 0.0040.9495 ± 0.00816,541
M9594 ± 6651.0 ± 23.25.63 ± 0.190.9121 ± 0.0010.9124 ± 0.00723,872
M39403 ± 7414.1 ± 22.25.77 ± 0.270.9122 ± 0.0030.9731 ± 0.00714,049
M29378 ± 2417.1 ± 13.16.12 ± 0.310.9647 ± 0.0030.9062 ± 0.00810,035
M31639 ± 9705.1 ± 29.27.35 ± 0.250.9861 ± 0.0030.9063 ± 0.00516,505
M4511 ± 4575.1 ± 18.46.16 ± 0.230.9552 ± 0.0050.8886 ± 0.00429,912
Table 6. Matrix of habitats describing disturbance types along the initial landscape types. Abbreviations: green cells indicate less disturbed objects, yellow—more disturbed. The intensity of the color reflects the degree of severity of the property along the gradient.
Initial Microlandscape TypeDisturbancesReference
Areal—Self-RegenerationAreal—Restoration ActivitiesLinearScattered
Shallow peat tundra on slopesM3No sampleM31M29M24
Ombrotrophic shallow peatlands of flat landscapesM19No sampleNo sampleM39M30
Rich and transition fens in the lowlands and riverine habitatsM8M9M4No sampleM27
Disclaimer/Publisher’s Note: The statements, opinions and data contained in all publications are solely those of the individual author(s) and contributor(s) and not of MDPI and/or the editor(s). MDPI and/or the editor(s) disclaim responsibility for any injury to people or property resulting from any ideas, methods, instructions or products referred to in the content.

