Article

Effects of Floods on Zooplankton Community Structure in the Huayanghe Lake

1
School of Resources and Environmental Engineering, Anhui University, Hefei 230601, China
2
Anhui Province Key Laboratory of Wetland Ecosystem Protection and Restoration, Auhui University, Hefei 230601, China
*
Author to whom correspondence should be addressed.
Diversity 2023, 15(2), 250; https://doi.org/10.3390/d15020250
Submission received: 6 December 2022 / Revised: 6 February 2023 / Accepted: 7 February 2023 / Published: 9 February 2023

Abstract

:
Floods can change the physicochemical factors of the water body and the zooplankton community. In the summer of 2020, Huayanghe Lake experienced floods. Here, eight cruises were conducted in Huayanghe Lake from 2020 to 2022 to study the response of environmental factors and the zooplankton community to the floods. The results demonstrated that floods increased the concentrations of total nitrogen, total phosphorus and chlorophyll a. In addition, during the floods, the number of rotifer species increased, while the number of cladoceran and copepod species decreased. Floods also reduced the average density and biomass of zooplankton. The results of Pearson correlation analysis and redundancy analysis showed that environmental factors, such as water depth, water temperature, transparency, nitrogen and phosphorus concentration, conductivity, coverage of aquatic vegetation and chlorophyll a, were closely related to the seasonal dynamics of zooplankton in Huayanghe Lake. Our research emphasizes that zooplankton can quickly respond to floods, providing data support for the ecological relationship between flooding and the zooplankton community, which is crucial for the preservation and restoration of the lake water ecosystem.

1. Introduction

Anhui Province retains a relatively intact series of lakes connected to the Yangtze River. These lakes constitute the ecological barrier of the economically developed areas of the Yangtze River Delta and are an important ecological functional area in China. On the one hand, they play an important role in flood storage and drought prevention, climate regulation and soil and water conservation [1]; on the other hand, their periodic hydrological variation characteristics result in more types of wetland habitats. These not only provide migration and breeding sites for fish, but also important habitats for migratory birds, which are essential for maintaining the balance of the ecosystem and the conservation of biodiversity [2,3].
Huayanghe Lake is located in the middle and lower reaches of the Yangtze River, with obvious periodic hydrological fluctuation. Due to the long-term influence of the Asian monsoon climate and the interaction of river and lake patterns, the lake has a relatively stable pattern of water level fluctuations, i.e., high water period, receding water period and low water period [4,5]. In this paper, we refer to this relatively stable water level fluctuation pattern as the regular water level fluctuation (RWF). Depending on the season, water levels fluctuate with the water level of the Yangtze River. Sometimes, the inflow of the Yangtze River in summer and the increase in rainfall make the water level of Huayanghe Lake rise, forming a flood period [6]. This is an extreme water level fluctuation (EWF). In July 2020, Huayanghe Lake suffered from floods, and it continued to exceed the 15 m warning level for 116 days from July 10 to November 2, reaching a maximum of 16.42 m.
Some studies have found that zooplankton density decreases with the increase in lake water level during the flood period [7]. In addition to the rapid rise in water level, rainfall washes a large amount of pesticides, sediment and other pollutants from agricultural fields into the lakes [8], leading to an increase in the concentration of nutrients, such as nitrogen and phosphorus in the water column, and an increase in turbidity [9,10,11]. Some scholars have shown that fluctuations in lake levels due to floods can also cause changes in the zooplankton community structure [12]; more and more studies have since confirmed the importance of water level stability on the zooplankton community structure and dynamics [13]. For example, water level fluctuations can disturb the plankton community and affect the plankton biomass and species composition [14]. Additionally, it has been found that the hydrological regime of floodplains is crucial for zooplankton biomass patterns and succession and that flood events and high water levels reset the community to an early successional phase [15].
Zooplankton are primary consumers of aquatic ecosystems and are one of the unique life forms in aquatic ecosystems due to their small size, large numbers and strong metabolic capacity [16]. They are also responsive to environmental changes and are important indicators of changes in the aquatic environment [17].
In this study, we selected the Huayanghe Lake as our study area and focused on zooplankton. This study aimed to: (1) explore how floods affect environmental factors including water depth, transparency, pH, dissolved oxygen, turbidity, conductivity, aquatic vegetation coverage, chlorophyll a, nitrogen and phosphorus concentration; (2) study what changes will happen to the community structure of zooplankton under the flood background; and (3) analyze which environmental factors are closely related to these changes. This study provides necessary data support for water quality assessment and ecological restoration of lakes by comparing zooplankton and environmental factors in different years with and without floods.

2. Materials and Methods

2.1. Study Area

Huayanghe Lake (116°00″ E–116°33″ E, 29°52″ N–30°58″ N) lies on the north bank of the Yangtze River in Anhui Province, China, with a surface area of 580 ± 115.8 km2. With the aim of scientific management, it is divided into three parts: Longgan Lake in the west, Huangda Lake in the middle and Po Lake in the north (Figure 1). It is a north subtropical monsoon humid climate, with four distinct seasons, long sunshine, more rainfall and a short frost period. The average temperature throughout the year is about 17 °C, with the lowest temperature in winter and the highest temperature in summer. The average annual rainfall is about 1307 mm, and the rainfall fluctuates greatly from season to season, especially from June to July, which is commonly known as the plum rain season and is a major climatic feature of the middle and lower reaches of the Yangtze River [18].

2.2. Sampling Points and Sampling Time

A total of 26 sampling points were set up in Huayanghe Lake (Figure 1), including 9 sampling points in Huangda Lake, 7 sampling points in Po Lake and 10 sampling points in Longgan Lake. According to the actual situation, the zooplankton community structure and main environmental factors of Huayanghe Lake were investigated in May, August and November 2020; February, May, August and November 2021; and February 2022. We used the precise calculation and positioning of GPS to determine the location of sampling points to ensure our samples came from the exact same location every time [19].

2.3. Sample Collection and Processing

We employed the sample collection methods as found in “Zooplankton methodology, collection and identification—A field manual” to collect the zooplankton samples [20]. The collection of zooplankton included rotifers, cladocerans and copepods, and the samples were divided into qualitative and quantitative. When the depth of the lake water was not more than 3 m, samples can be taken at 0.5 m below the water surface. For lake with a depth of 3–10 m, two water samples were taken from the surface layer (0.5 m) and the bottom layer (0.5 m from the bottom of the lake), and then the samples of each layer were mixed evenly to take quantitative samples. Qualitative samples of rotifers were collected with a 25# (mesh size = 64 µm) plankton net at the water depth of 0.3 m that was towed in the shape of “∞” for 3~5 min (the speed was 20–30 cm per second). Then, the water was concentrated into 50 mL bottles and fixed by adding 1 mL of Lugol’s solution on site. The quantitative samples of rotifers were created by collecting 1 L water sample, putting into 1 L sample bottles, and then fixing by adding 10 mL of Lugol’s solution on site. After being brought back to the laboratory and left to stand for 24 h, the supernatant was carefully and slowly removed with a siphon (with an inner diameter of 3–5 mm), and the remaining 30 mL was put into a quantified bottle. Qualitative samples of cladocerans and copepods were collected with a 13# (mesh size = 112 = µm) plankton net. When sampling, we rotated the net at a water depth of 0.3 m in the shape of “∞” for 3–5 min (the speed was 20–30 cm per second), then the net was slowly lifted to make the zooplankton concentrate. The sample was poured into the 50 mL quantification bottles and fixed by adding a 4% formaldehyde solution 1 mL on site. The quantitative samples of cladocerans and copepods were collected with a plexiglass water sampler (the volume was 10 L), and 10 L of water were collected, filtered through a 25# (mesh size = 64 µm) plankton net, and concentrated into 50 mL quantified bottles. A 1 mL of 4% formaldehyde was added for fixation, and the samples were taken back to the laboratory, where we let them stand for 24 h before fixing the volume to 30 mL. The rotifer biomass was calculated using the volumetric method [21], and the planktonic crustacean biomass was calculated using the body length weight regression equation [22]. Zooplankton were classified and identified according to their morphological characteristics and size [23]. The species were identified under the light microscope with reference to “Chinese Freshwater Rotifers” [24], “Index of Common Freshwater Cladoceran in China” [25] and “Fauna of China Arthropoda Crustacea Freshwater Copepoda” [26]. The nomenclature of the recorded species refers to the Rotifer World Catalog [27], the List of Available Names (LAN) part Rotifera [28], the cladoceran checklist [29] and the World Register of Marine Species (WoRMS).
While collecting zooplankton samples, we measured water temperature (WT), pH, dissolved oxygen (DO) and electrical conductivity (EC) using a multi-parameter water quality analysis meter (HI9828). Water depth (WD) was measured with a sounding hammer. Transparency (SD) was measured with a Secchi disk. Turbidity (Turb) was measured with a Hach 2100Q portable turbidimeter. Another 1 L water sample was taken and brought back to the laboratory for determination of various nutrients. Total nitrogen (TN) was determined by the UV spectrophotometric method utilizing alkaline potassium persulfate elimination [30], ammonia nitrogen (NH4+-N) was ascertained by the spectrophotometric method using Nessler reagent [31], total phosphorus (TP) was measured by ammonium molybdate spectrophotometry [32], and chlorophyll a (Chl-a) was determined by 90% acetone extraction [33]. The aquatic vegetation monitoring was carried out simultaneously with the collection of zooplankton samples. The survey of aquatic vegetation in Huayanghe Lake was carried out by the line–point combination method, and the coverage of aquatic vegetation (Cov) was calculated by the visual observation method. We defined the period from May 2020 to February 2021 as the extreme water level fluctuation period (EWF), and the period from May 2021 to February 2022 as the regular water level fluctuation period (RWF).
The distribution of sampling points was mapped using Arc GIS 10.6 software and Ovi Interactive Map software. Arc GIS 10.6 software was also employed to insert the density of zooplankton at each sampling point into the base map of the study area by using ordinary Kriging interpolation method, and then we charted the spatial distribution map of zooplankton density [34], and we used this software to chart the distribution map of aquatic vegetation combined with the field survey results. Using SPSS 26 software, we calculated the Pearson correlation analysis of zooplankton density, biomass, Shannon-Wiener diversity index and environmental factors. SPSS 26 software was also utilized for cluster analysis of zooplankton. The square Euclidean distance was utilized for the distance between indicators, and the cluster method of inter group connection was used. Because of the large degree of variability in the raw data for the zooplankton and environmental factors, the raw data were transformed by Log (x + 1) to meet the normality required for ANOVA, and Canoco 5 software was used to perform the detrended fluctuation analysis (DCA) of zooplankton dominant species density data, yielding the first axis length as less than 3. Therefore, redundancy analysis (RDA) was selected, and the Monte Carlo permutation test was utilized to screen environmental factors and draw an RDA analysis ranking diagram to analyze the relationship between environmental factors and dominant species.

2.4. Data Processing

The Margalef richness index (D) [35], the Pielou evenness index (J) [36] and the Shannon–Wiener diversity index (H′) [37] were chosen to analyze the structural characteristics of zooplankton diversity, and were calculated following Equations (1)–(5)
Margalef   richness   index   ( D )   D = ( S 1 ) / log 2 N
Pielou   evenness   index   ( J )   J = H / log 2 S
Shannon Wiener   diversity   index   ( H )   H = i = 1 S ( n i / N ) log 2 ( n i / N )
Species   dominance   ( Y )   Y = n i N f i
Species   density   ( N i )   N i = C V 1 V 2 V 3
where n i is the density of the i species, N is the total density of all species in the sample, f i is the frequency of occurrence of the i species, S is the total number of all species at the sampling site, Ni is the number of zooplankton per liter of water, C is the number of individuals counted, V1 is the volume of the concentrated sample (mL), V2 is the counting volume (mL) and V3 is the volume of sampling volume (L). Y 0.02 means that the zooplankton is a dominant species [38].
The calculation of water body trophic level index adopts the method of mean and standard deviation, selects SD, TN, TP and Chl.a 4 indicators, and evaluates them with the following comprehensive trophic level index: TLI(∑) < 30 indicates oligotrophic; 30 ≤ TLI(∑) ≤ 50 signifies mesotrophic; 50 < TLI(∑) ≤ 60 points to mildly eutrophic; 60 < TLI() ≤ 70 means moderately eutrophic; TLI(∑) > 70 signals hypertrophic. The calculation formula is [39]:
T L I ( ) = j = 1 m w j T L I ( j )
w j = r 2 i j / j = 1 m r 2 i j
In the formula, TLI(∑) represents the comprehensive trophic level index; Wj is the relative weight of the trophic level index of the jth parameter; rij is the jth index and the reference parameter; m is the number of evaluation parameters; TLI(j) is the trophic index representing the first parameter. They are calculated by the following formulas [40]:
T L I C h l . a = 10 2.5 + 1.086 l n C h l . a
T L I T P = 10 9.436 + 1.624 l n T P
T L I T N = 10 5.453 + 1.694 l n T N
T L I S D = 10 5.118 1.94 l n S D
In the formula, Chl.a is the concentration of chlorophyll a (ug/L), TP is the concentration of total phosphorus in water (mg/L), TN is the concentration of total nitrogen in water (mg/L) and SD is the transparency of lake water (m).

3. Results

3.1. Environmental Parameters of Huayanghe Lake

The changes of two different water level fluctuation cycles from May 2020 to February 2022 were compared by monitoring the main environmental parameters of Huayanghe Lake. The results revealed that in the extreme water level fluctuation period, the water depth of the lake increased from May 2020 and gradually rose to 6.77 m. The water temperature and transparency in both different water level fluctuation cycles exhibited a trend of first increasing and then decreasing, reaching the maximum in summer and the minimum in winter. The pH was greater than 7 in both regular and extreme water level fluctuation periods, indicating that the water is alkaline most of the time. The turbidity was the lowest in summer. The concentrations of total nitrogen, total phosphorus and chlorophyll a in the extreme water level fluctuation period were higher than that in regular water level fluctuation period. The coverage of aquatic vegetation was the highest in summer and the lowest in winter. Sunshine duration was the shortest in winter and the longest in summer (Table 1). The average values of the comprehensive trophic level index (TLI) in the extreme water level fluctuation period and the regular water level fluctuation period were 53.17 and 48.66, respectively. It can be seen that during the extreme water level fluctuation period, the water body was mildly eutrophic, while during the regular water level fluctuation period, the water body was mesotrophic.

3.2. Zooplankton Species Composition and Dominant Species

A total of 52 species of zooplankton in 19 families and 31 genera were detected in the two periods, including 26 species of rotifers, 15 species of cladocerans and 11 species of copepods (Table S1). In the period of extreme water level fluctuation, there were 26 species of rotifers, 6 species of cladocerans and 8 species of copepods; in the period of regular water level fluctuation, there were 20 species of rotifers, 15 species of cladocerans and 11 species of copepods. It can be seen that the number of rotifer species in the period of extreme water level fluctuation increased by six species compared with the period of regular water level fluctuation, while the number of cladoceran and copepod species decreased by nine and three species, respectively.
During the survey, we found a total of 16 dominant species, mainly rotifers. There were more dominant species in the regular water level fluctuation period, among which were Brachionus budapestinensis, Polyarthra euryptera and Brachionus urceolaris. The species with the highest dominance was Polyarthra trigla, which had the highest dominance in autumn, with a value of 0.241. There were significant seasonal differences in dominant species, with dominant species present in spring and summer and fewer dominant species found in autumn and winter (Table 2).

3.3. Zooplankton Density, Biomass and Species Diversity

The independent sample t-test demonstrated that there was no significant difference in the density and biomass of zooplankton in the two periods. The average density of zooplankton during the period of extreme water level fluctuation was 213.60 ind./L, of which 153.34 ind./L were rotifers, 25.59 ind./L were cladocerans and 34.67 ind./L were copepods; the average density of zooplankton during the period of regular water level fluctuation was 291.07 ind./L, of which 273.33 ind./L were rotifers, 8.50 ind./L were cladocerans and 9.24 ind./L were copepods (Figure 2a). During the extreme water level fluctuation, the average biomass of zooplankton was 1.54 mg/L, with rotifers accounting for 0.54 mg/L, cladocerans accounting for 0.19 mg/L and copepods accounting for 0.81 mg/L; the average biomass of zooplankton during the regular water level fluctuation period was 2.75 mg/L, of which rotifers were 1.20 mg/L, cladocerans were 0.28 mg/L and copepods were 1.27 mg/L. This shows that the average density and biomass of zooplankton in the period of regular water level fluctuation were higher than that in the period of extreme water level fluctuation (Figure 2b).
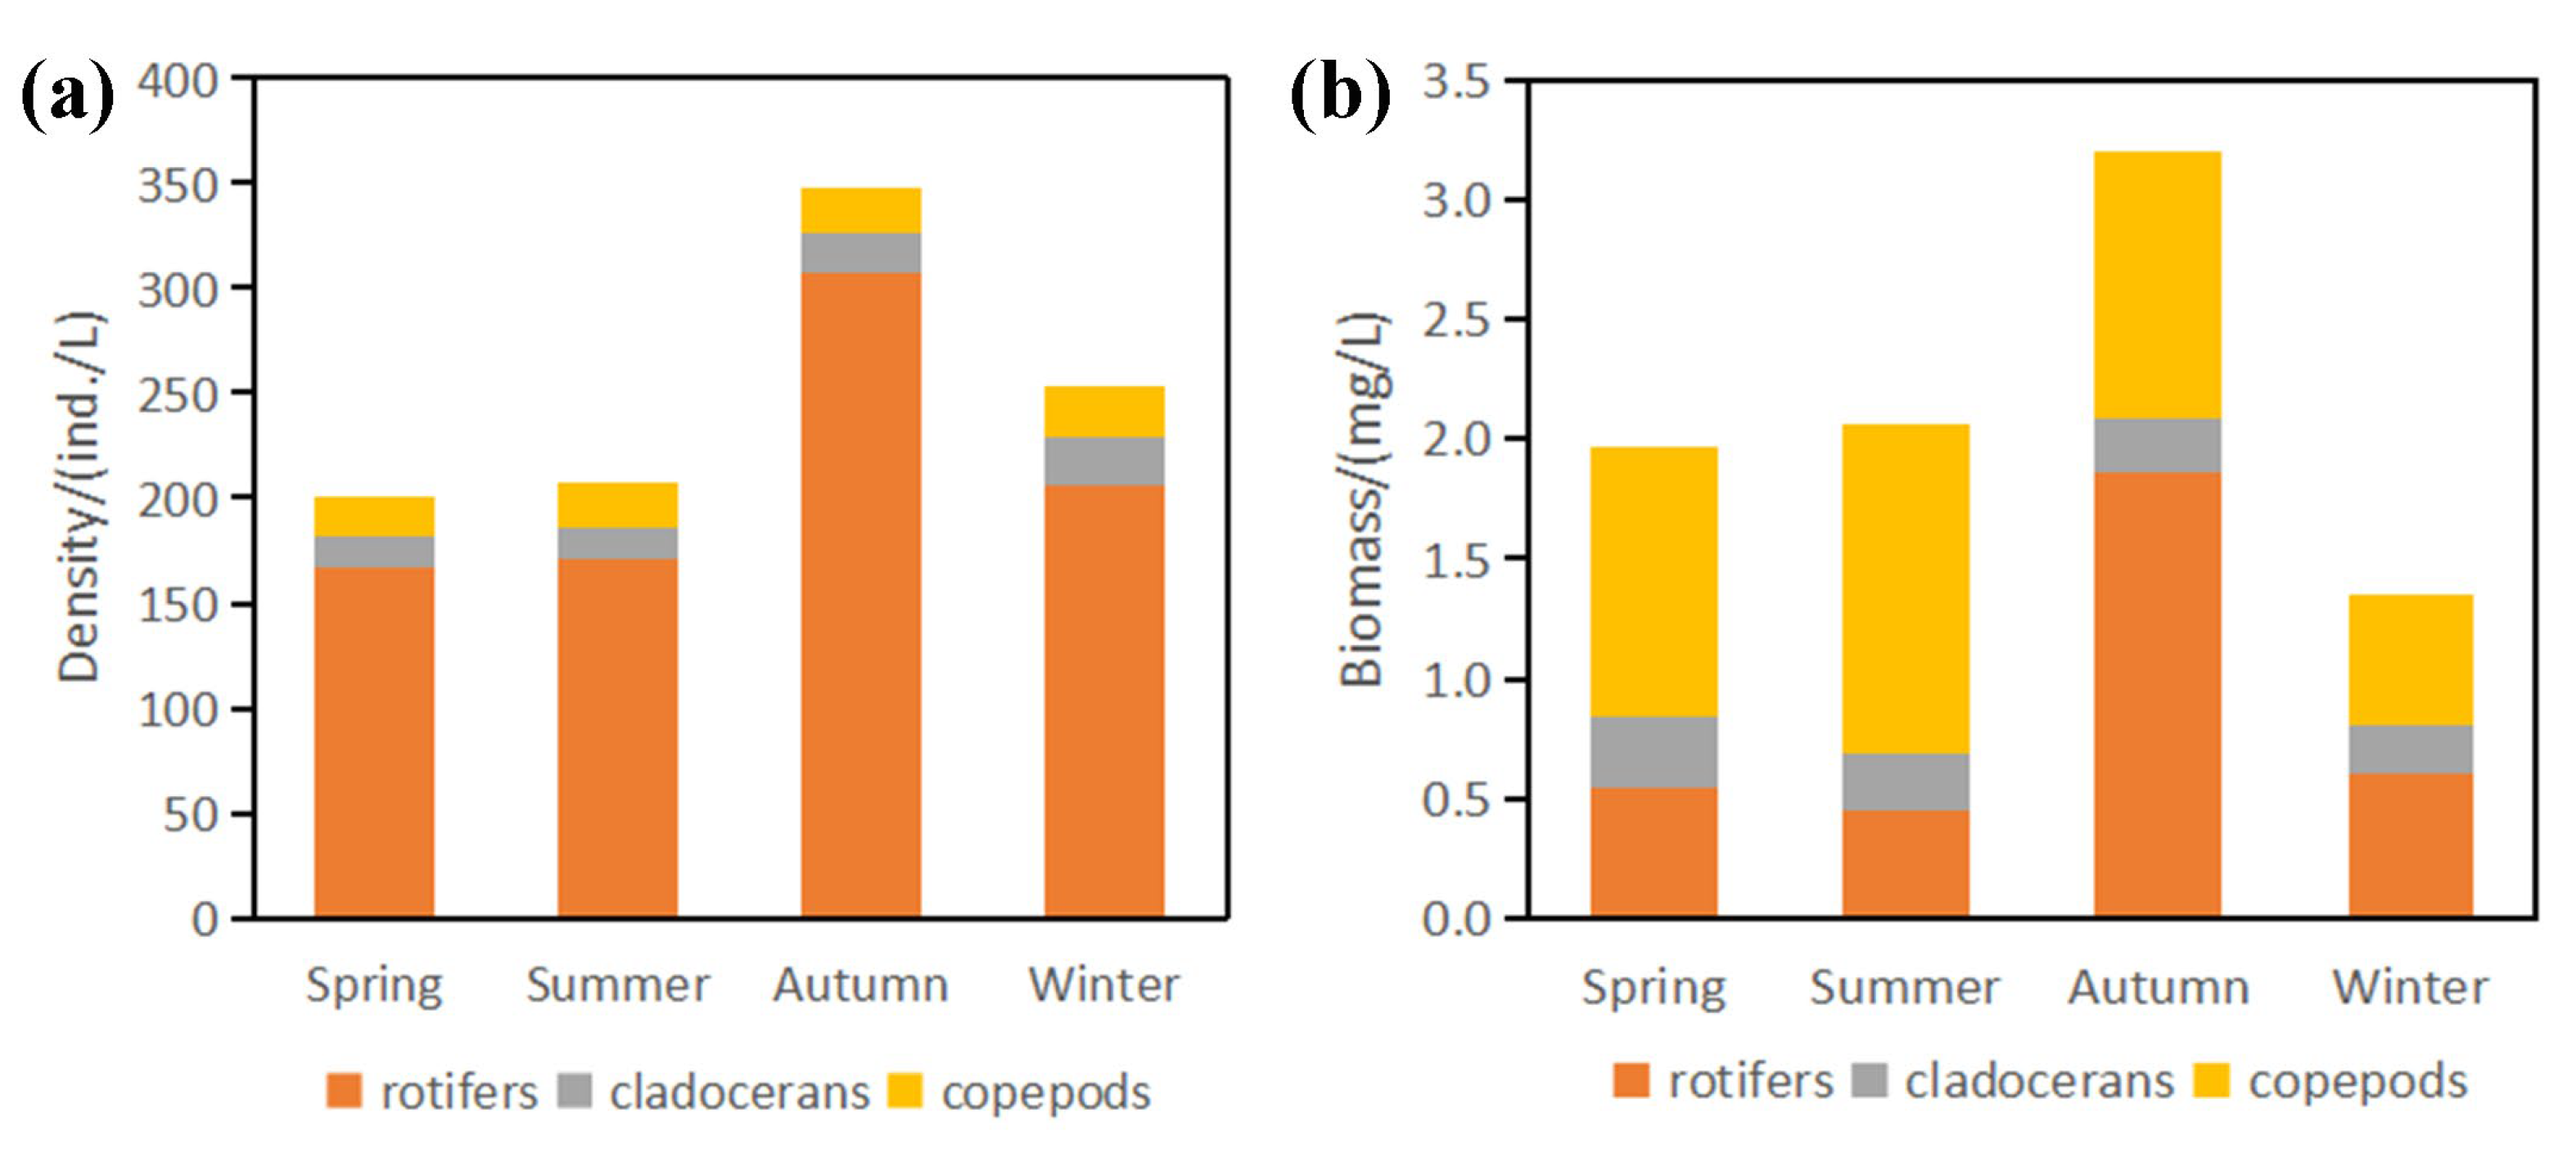
In terms of the seasonal distribution of density and biomass, the density in autumn (347.17 ind./L) was much higher than that in the other three seasons, and the density in spring (201.11 ind./L) was the lowest (Figure 3a). Biomass was the highest in autumn (3.20 mg/L) and the lowest in winter (1.35 mg/L) (Figure 3b).
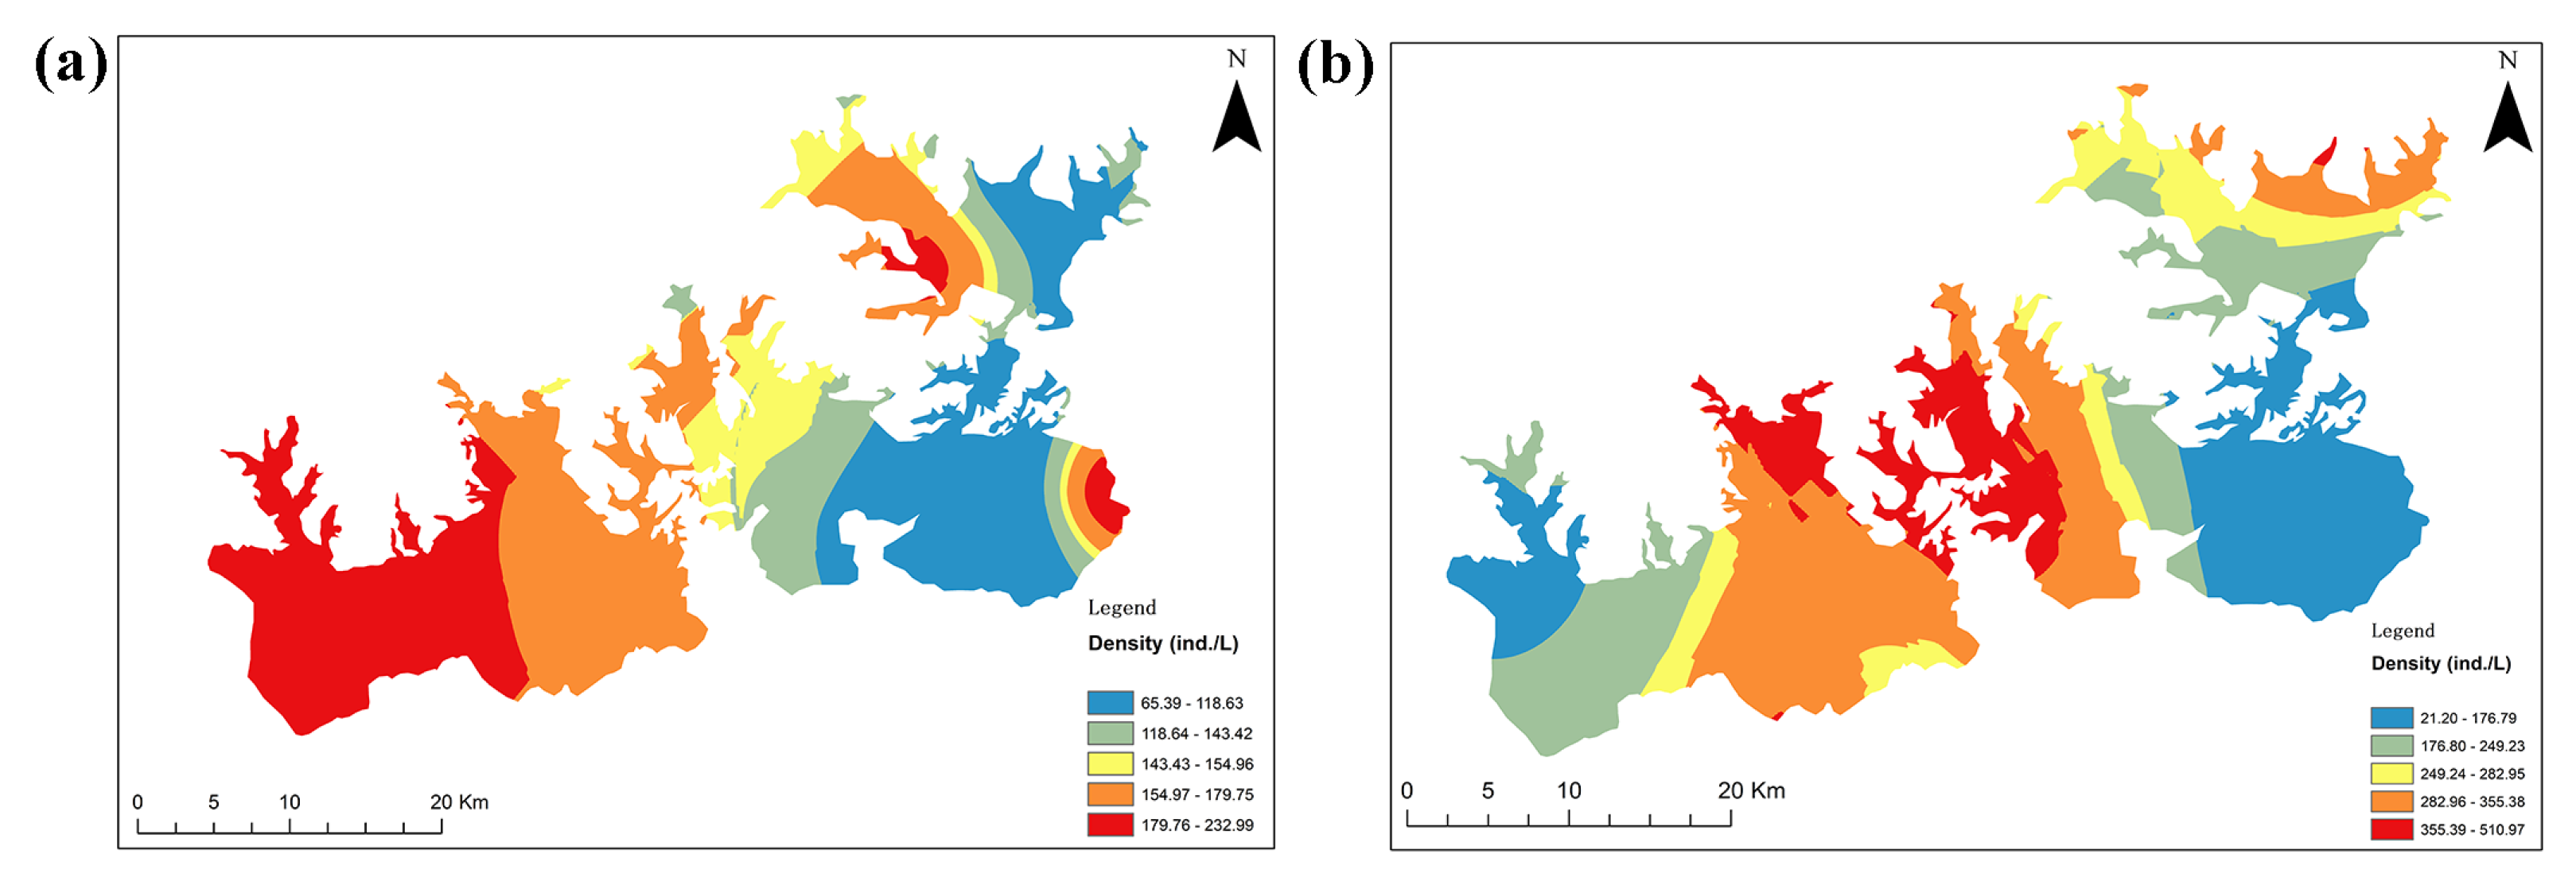
In terms of the spatial distribution, the density of zooplankton in the period of extreme water level fluctuation illustrated a higher density in Longgan Lake, with the western part being higher than the eastern part, while the density in the middle of Huangda Lake was lower, and the density in the western part was higher than the eastern part of Po Lake (Figure 4a). The zooplankton in the period of regular water level fluctuation also revealed a higher density in Longgan Lake, which was the same as that in the period of extreme water level fluctuation. The density of Huangda Lake demonstrated a decreasing trend from west to east, and the density of Po Lake indicated an increasing trend from south to north (Figure 4b).
The Shannon–Wiener diversity index (H′) was 2.14 (1.78–2.35), the Margalef richness index (D) was 1.53 (0.94–2.11) and the Pielou evenness index (J) was 0.63 (0.56–0.72) in the period of extreme water level fluctuation. In the period of regular water level fluctuation the Shannon–Wiener diversity index (H′) was 2.25 (1.80–2.65), the Margalef richness index (D) was 3.01 (2.03–3.59) and the Pielou evenness index (J) was 0.64 (0.62–0.66). The richness index (D) was significantly higher in the period of regular water level fluctuation than in the period of extreme water level fluctuation, while the diversity index (H′) and evenness index (J) were not significantly different in the two water level fluctuation periods; however, they were slightly higher in the period of regular water level fluctuation (Figure 5). The pollution degree of the water body is inversely proportional to the richness index (D): 0 < D ≤ 1 indicates heavy pollution; 1 < D ≤ 3 indicates medium pollution; D > 3 indicates light pollution. Using the richness index (D) to evaluate the water body, it can be seen that the degree of water pollution was aggravated during the floods.

3.4. Relationship between the Zooplankton Community Structure and Environmental Parameters

Pearson correlation analysis showed that in the extreme water level fluctuation period, zooplankton density was positively correlated with water temperature, transparency, water depth and sunshine duration, and negatively correlated with turbidity, ammonia nitrogen concentration and chlorophyll a concentration. Zooplankton biomass was positively correlated with water temperature, transparency and water depth, negatively correlated with turbidity, ammonia nitrogen and chlorophyll a concentration (Table 3). In the regular water level fluctuation period, zooplankton density was positively correlated with water temperature, pH, transparency and sunshine duration, negatively correlated with total phosphorus and chlorophyll a concentrations, and zooplankton biomass was positively correlated with water temperature and transparency, and negatively correlated with total phosphorus concentration (Table 4).
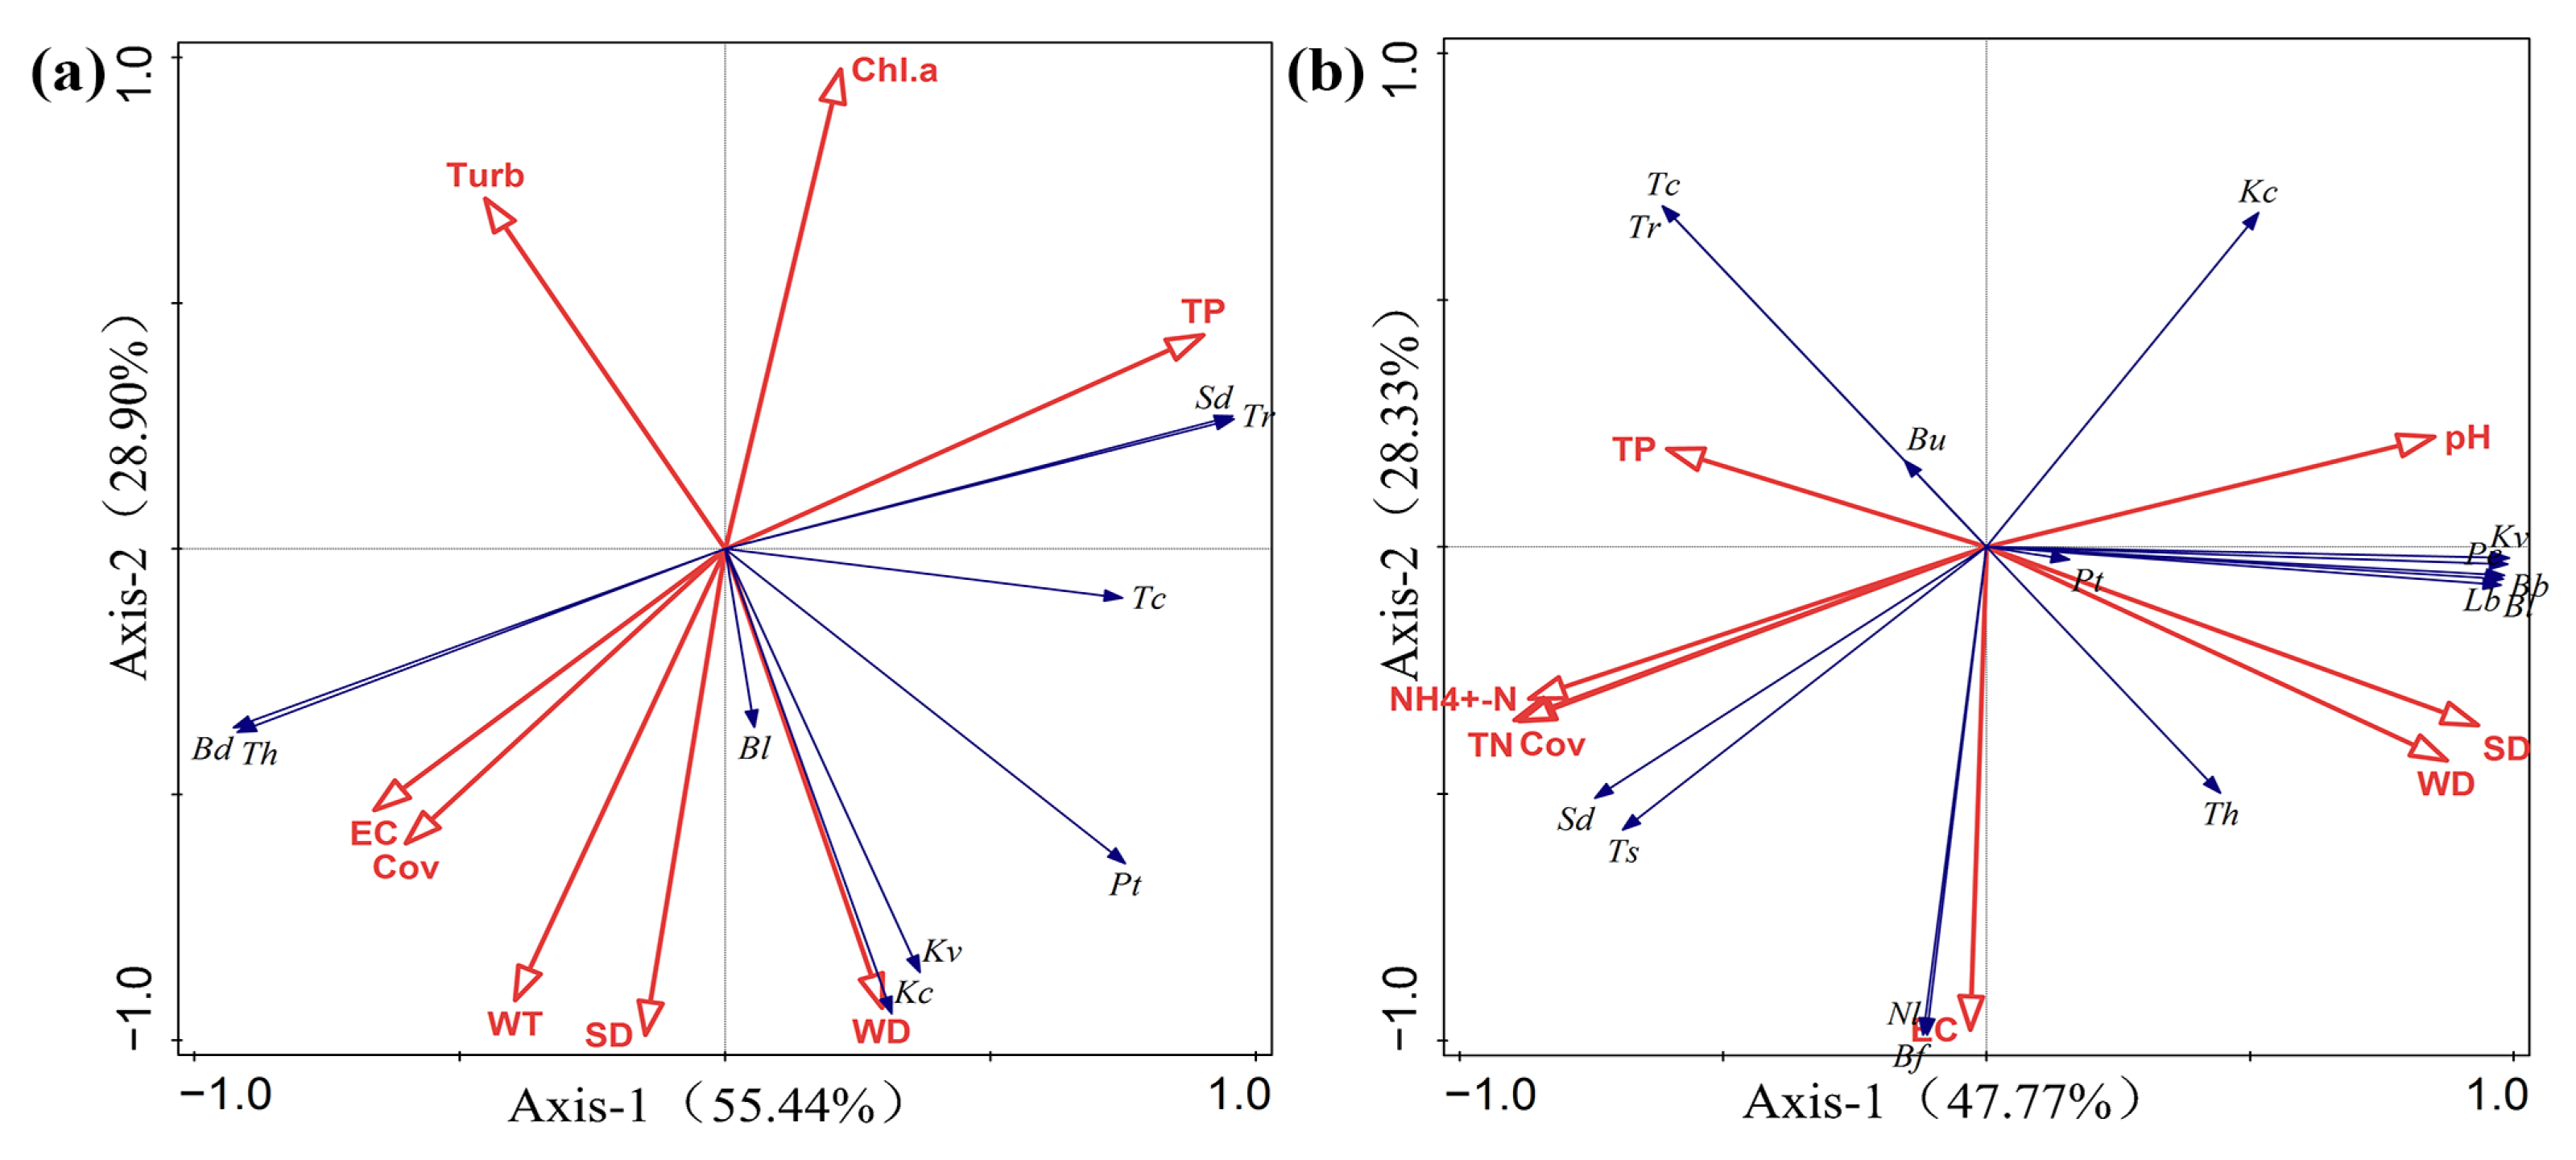
The RDA results showed that during the extreme water level fluctuation period, the eigenvalues of the first and second sort axes were 0.544 and 0.289, respectively. The species interpretation rates were 54.44% and 28.90%, respectively, and the cumulative interpretation rate of the two axes was 83.34%. During the regular water level fluctuation period, the eigenvalues of the first and second sort axes were 0.477 and 0.283, respectively. The species interpretation rates were 47.77% and 28.33%, respectively, and the cumulative interpretation rate of two axes was 76.10%.
The results of RDA analysis in the period of extreme water level fluctuation established that Turb was negatively correlated with Keratella cochlearis, Keratella valga and Polyarthra trigla; TP was positively correlated with Trichocerca rousseleti and Sinocalanus doerrii; and EC and Cov were positively correlated with Thermocyclops hyalinus and Bosminopsis deitersi (Figure 6a). The results of RDA analysis in the period of regular water level fluctuation revealed that TP was negatively correlated with Keratella valga, Lecane bulla and Bosmina longirostris; pH was negatively correlated with Sinocalanus doerrii and Trichocerca stylata; WD and SD were negatively correlated with Trichocerca rousseleti, Trichocerca capucina and Brachionus urceolaris; EC was positively correlated with Bosmina fatalis and Notholca labis; and NH4+-N, and Cov and TN were negatively correlated with Keratella cochlearis (Figure 6b).
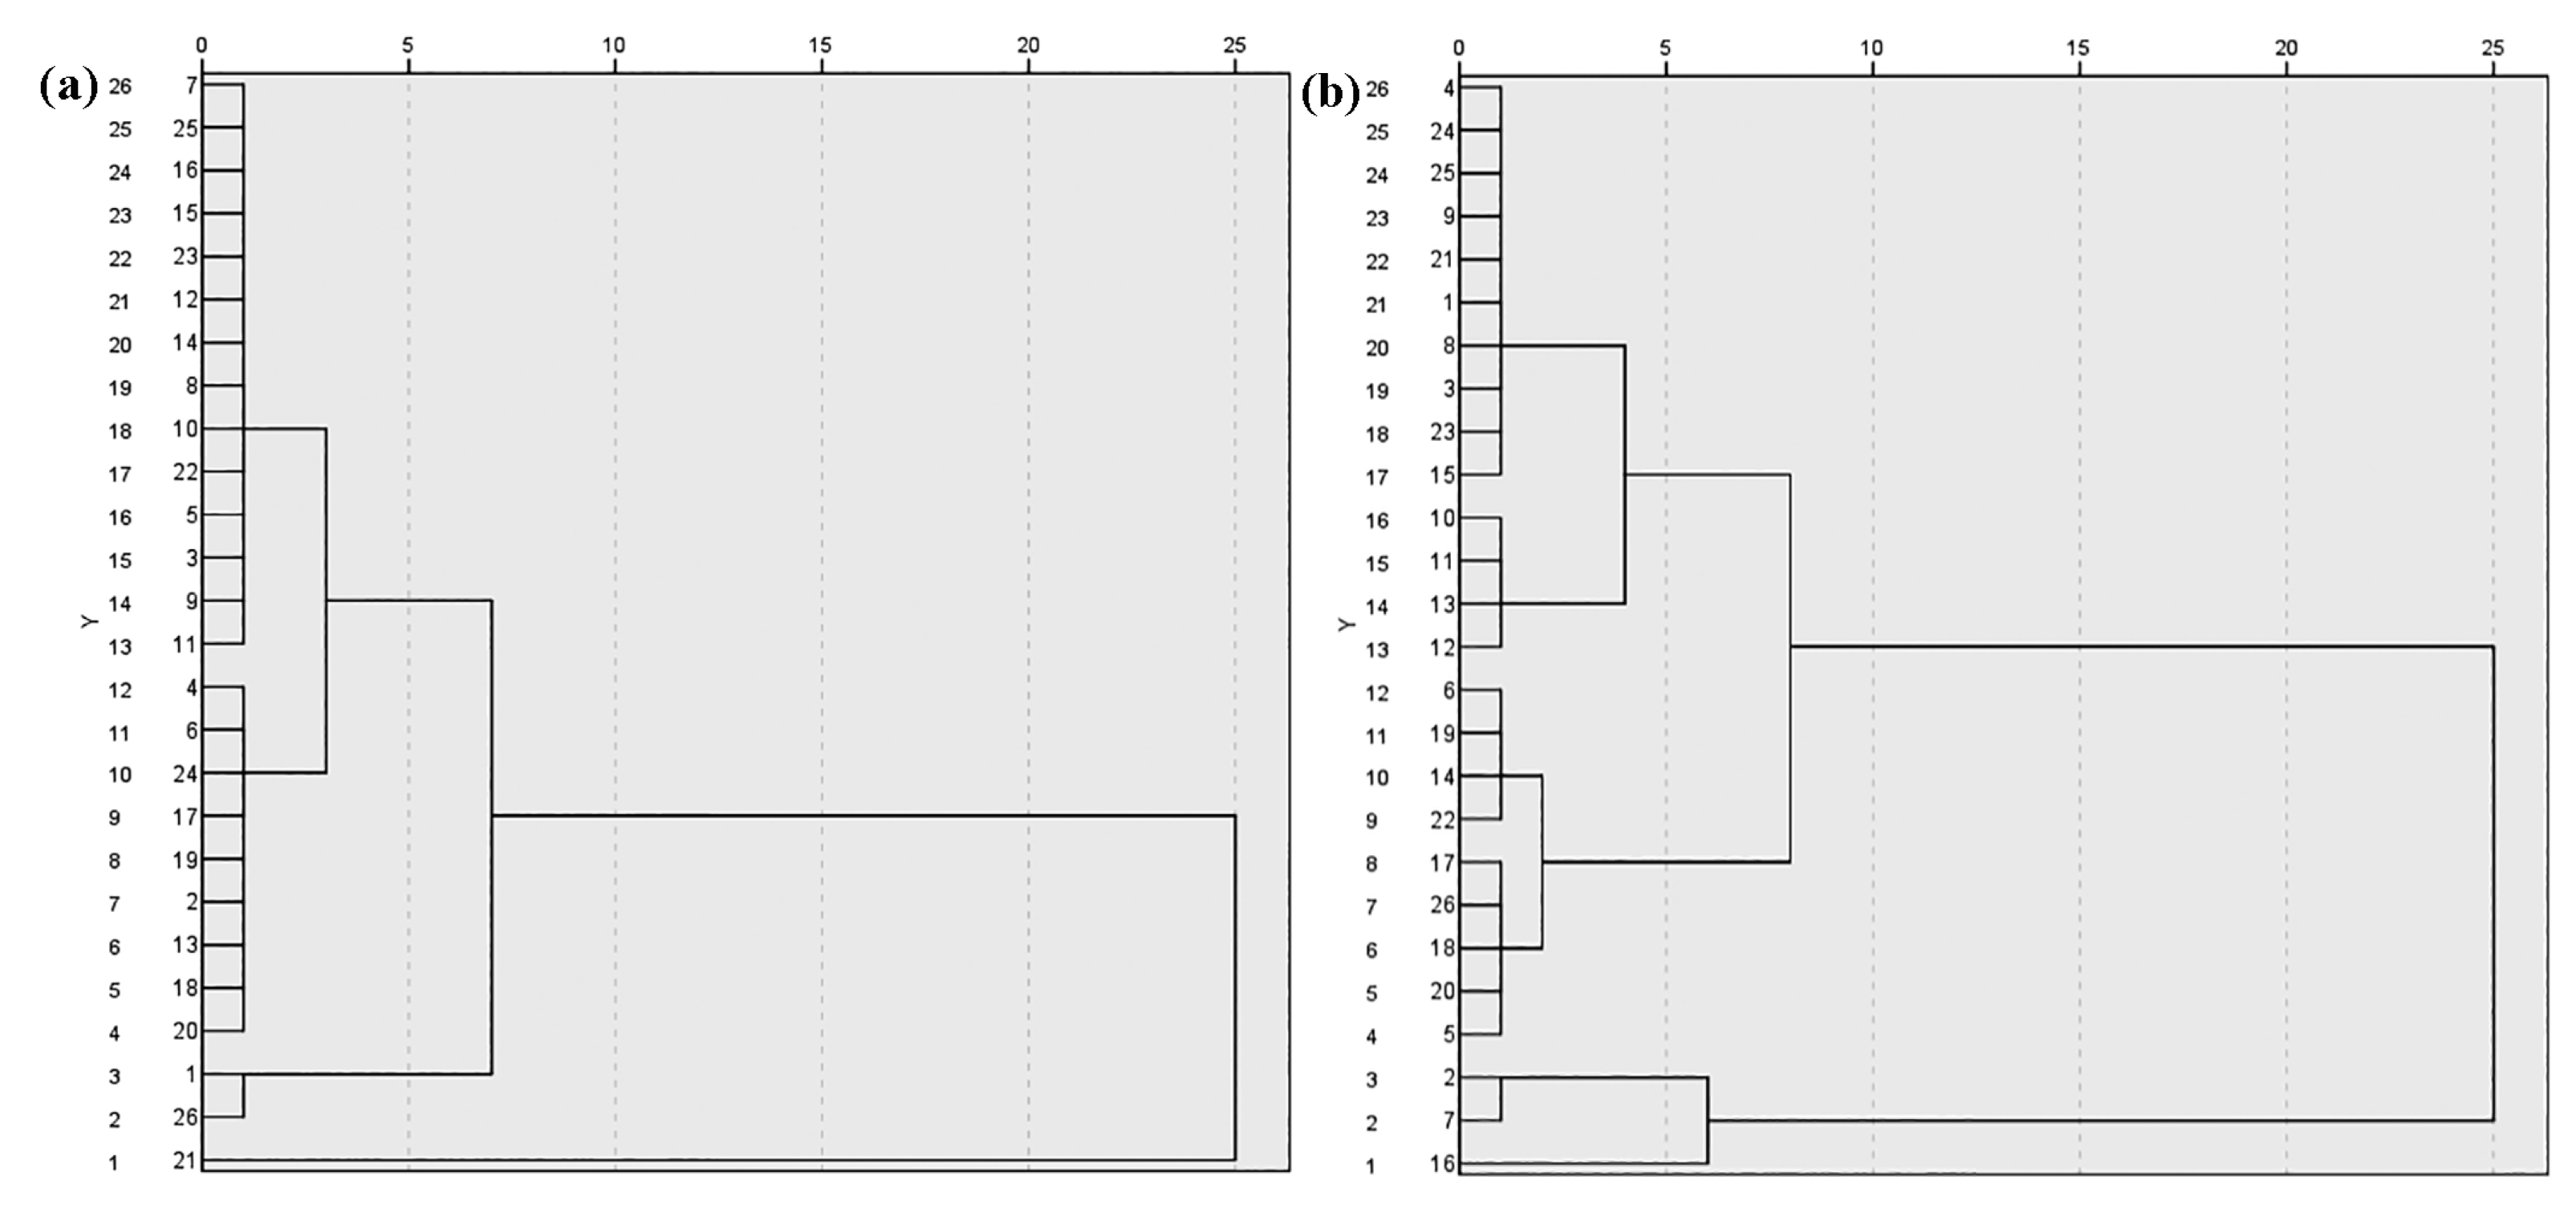
The results showed that zooplankton in the extreme water level fluctuation period can be roughly divided into three community types—group 1: points 1, 26; group 2: point 21; and group 3: other sampling points (Figure 7a). Zooplankton can be roughly divided into four community types during the regular water level fluctuation period, including group 1: point 16; group 2: points 2, 7; group 3: points 5, 6, 14, 17, 18, 19, 20, 22, 26; and other sampling points were in group 4 (Figure 7b). The similarity of zooplankton during the regular water level fluctuation period was generally poor in comparison with the extreme water level fluctuation period, which also indicated that the zooplankton community type during the regular water level fluctuation period was more complex.

4. Discussion

4.1. Effects of Floods on Environmental Parameters

Floods generally affect the environmental parameters of aquatic ecosystems, which usually play a synergistic role in maintaining the lake community structure, notably affecting the limnological parameters of lakes when their water levels are too high [41]. In July 2020, Huayanghe Lake experienced extreme rainfall and the water level rose rapidly, flooding large areas of agricultural land around the lake and causing Huayanghe Lake to be fully connected to the surrounding rivers. This made Huayanghe Lake highly homogeneous. The concentrations of total nitrogen, total phosphorus and chlorophyll a were all higher during the extreme water level fluctuation period than they were during the regular water level fluctuation period. In his analysis of Huayanghe Lake during the 2016 mega-floods, Kun Zhang [42] came to the same result. Different aquatic vegetation has been found to absorb nitrogen, phosphorus and other nutrients from the water body in various ways, and the cultivation of aquatic vegetation can clean up contaminated water bodies [43]. The concentrations of total nitrogen, total phosphorus and chlorophyll a during the extreme water level fluctuation period in our study were lower than in 2016 [42] due to the rapid recovery of aquatic vegetation after the culture purse removal and uptake of nutrients in early 2018 [44]. The allelopathy of aquatic vegetation inhibited the growth of phytoplankton, which led to a decrease in chlorophyll a concentration [45].
The concentrations of total nitrogen, total phosphorus and chlorophyll a were higher in the period of extreme water level fluctuation than in the period of regular water level fluctuation. There are several possible reasons for this: First, it may be due to the rise of water level caused by rainfall, which flooded the surrounding farmland and caused nutrients, such as fertilizers in the farmland, to flow into the lake, resulting in a rise in nutrients, such as nitrogen and phosphorus. Second, because the water level of the lake rose, which made the lake more connected to the surrounding rivers or small ponds, a large amount of domestic sewage flowed into the lake. Finally, extreme rainfall could cause damage to the emerged vegetation, such as Zizania latifolia, and floating vegetation, such as Euryale ferox, in the lakeshore areas. This outcome was consistent with the study that used two methods (surveying and remote sensing image data) to determine the changes in aquatic vegetation before and after the floods in Shengjin Lake, and uncovered that the coverage of aquatic vegetation decreased sharply after the floods [46], in part because the aquatic vegetation itself can absorb nutrient salts. This resulted in an increase in the concentration of nutrients, such as nitrogen and phosphorus, during the period of extreme water level fluctuation. A study has found that the coastal waters of the South China Sea are affected by the Pearl River’s fresh water and coastal upwelling. The nutrient supplement rate is fast, and the phytoplankton biomass is also high. This demonstrates that nutrient salts are essential for the growth and reproduction of phytoplankton [47]. In our study, chlorophyll a concentration was higher in the extreme water level fluctuation period because the elevation in nutrient salts caused an increase in the abundance of phytoplankton. Floods also affect transparency of the water body. At the beginning of the floods, the water body was violently stirred, the suspension of the water body sediment mushroomed, and the transparency of the water body decreased. This was followed by a rise in the water level, a reduction in the extent of wind and wave effects on the water column circulation in the deeper parts of the lake, a sinking of suspended water column sediments, and an increase in transparency in the absence of resuspended sediments [48]. One study pointed out that the water body’s change in pH value is significantly affected by precipitation and river sediment concentration [49]. In this study, during the extreme water level fluctuation period in summer, precipitation increased, the water body of Huayanghe Lake fluctuated violently, and the sediment concentration in the water body changed significantly. During this period, the pH value of the water body increased significantly—up to 9.06. However, there were no significant changes in water temperature, dissolved oxygen, conductivity and turbidity between the extreme water level fluctuation period and the regular water level fluctuation period.

4.2. Effects of Floods on the Zooplankton Community Structure

In the period of extreme water level fluctuation, the intense rainfall at the beginning of the floods caused a violent stirring of the water column. This led to an increase in the suspension of sediments in the water column. According to a study, more than half of the zooplankton will perish when the concentration of suspended particles in the water body hits 60.17 mg/L [50]. Because the filtering apparatus of cladocerans and copepods are easily clogged [51], as a result, the deterioration of the food conditions for cladocerans and copepods, as well as the clogging of their feeding filters, causes mortality. The decrease in the number of cladocerans and copepods also made rotifers get rid of competition. These conditions may have triggered the rise in the number of rotifer species and the decline in the number of cladoceran and copepod species compared with the period of regular water level fluctuation. At the same time, the upsurge in nutrients in the water column caused the rapid growth of algae and a proliferation of small zooplankton with short life cycles, such as rotifers [52].
Additionally, there are some variations in zooplankton densities and biomass between the two periods. The density and biomass of zooplankton were lower in the period of extreme water level fluctuation. There are a number of potential causes for this: First, it may be due to the dilution effect brought about by increased rainfall, which resulted in lower zooplankton density and biomass. This was consistent with the study of Gazonato Neto et al. [53], who collected zooplankton samples from eight locations in two reservoirs during the dry and rainy seasons. Their results showed that zooplankton densities in reservoirs were lower at seven of the eight sites sampled during the rainy season, which they believed was caused by dilution. Second, intense rainfall can cause some of the zooplankton to be washed to the shore, which can bring about a decrease in zooplankton density and biomass [54]. In addition, the rapid water movement and high velocity caused by floods can cause physical damage to zooplankton and reduce their ability to catch food [55]. Finally, floods can affect the growth and community distribution of aquatic vegetation, prompting a partial loss of aquatic vegetation [56], depriving zooplankton of shelter and habitat, increasing the probability of predation by fish, and leading to damage to the zooplankton community structure [57]. In terms of the seasonal distribution of density and biomass, we found that the density and biomass were higher in autumn. The study of Huayanghe Lake from 2015 to 2016 also concluded that the density and biomass in autumn were much higher than in other seasons [58].
In August 2020, due to the increase in rainfall, the dominance of cladocerans and copepods, such as Bosmina longirostris and Sinogalanus doerrii, decreased, while the dominance of rotifers, such as Notholca labis, increased. This shows that different species of zooplankton have different sensitivities to floods. Among them, rotifers have a short development time and a strong ability to adapt to the environment. They can quickly resume reproduction, and their dominance recovers rapidly. We also uncovered that Keratella cochlearis and Polyarthra trigla were dominant in most studied months, similar to what was found in Yixing Zhang’s [59] research on Huayanghe Lake. Cladocerans and copepods have a longer growth cycle. Their dominance decreases as the water level rises quickly because they are carried away by the water flow before they can mature [60].
Through cluster analysis, we discovered that in the extreme water level fluctuation period, the zooplankton’s similarity was high, and the community type became simpler. This can be explained by the “flood pulse concept”. The “flood pulse concept” states that a flood pulse may create homogeneity in tropical lowland floodplain systems, which is also known as flood homogenization [61]. Indeed, the literature illustrates that the heterogeneity of plankton communities decreases when a flood pulse occurs [62,63,64,65]. Various studies in the Amazonian floodplain system [66] and the Upper Parana River system [67] have also confirmed that floods can reduce environmental heterogeneity and zooplankton diversity.

4.3. Relationship between Zooplankton and Environmental Factors

The Pearson correlation analysis and redundancy analysis (RDA) results showed that environmental factors, such as water depth, water temperature, transparency, conductivity, chlorophyll a, the coverage of aquatic vegetation, nitrogen and phosphorus concentration, were closely correlated with changes in the zooplankton community structure in Huayanghe Lake, which was consistent with the results of previous studies [68,69].
Zooplankton are sensitive to changes in the water environment, and environmental changes can contribute to the evolution of the zooplankton community structure [70]. For example, water temperature plays an important role in the seasonal succession of zooplankton [71,72]. In this study area, the water temperature has clear seasonal features. The low water temperature in winter is not conducive to the growth and reproduction of zooplankton. Their density and biomass are low, with even the dominant species found in winter appearing in low numbers. With the increase in water temperature, the winter eggs continue to hatch, zooplankton density and biomass increase, and the density of the rotifer rises markedly. In summer, the water temperature is too high, exceeding the optimum temperature of some species, such as Bosmina longirostris, Bosmina fatalis and Bosminopsis deitersi, a large number of such species die, and the density and biomass of zooplankton falls.
Nutrients, such as nitrogen and phosphorus, affect the community structure of zooplankton mainly by affecting phytoplankton, the main food of zooplankton [73,74]. In this study, in the period of extreme water level fluctuation, the concentrations of nitrogen and phosphorus were higher than that of regular water level fluctuation. As a result, phytoplankton biomass increased, which induced an increase in zooplankton species.
In aquatic ecosystems, aquatic vegetation plays an important role, mainly as a refuge and habitat for zooplankton, providing a place for zooplankton growth and reproduction. Because the floods in the summer of 2020 destroyed part of the aquatic vegetation, the coverage was lower than in the summer of 2021. This resulted in a lower biomass of zooplankton in the extreme water level fluctuation period.
Through the study of zooplankton in Wuhan East Lake, it was found that rotifers were more susceptible to changes in chlorophyll a concentration [75]. Pearson correlation analysis in this paper showed that zooplankton density and biomass were negatively correlated with chlorophyll a concentration, which also confirms this point. This may be because algae is the main food source of zooplankton. The increase in the number of zooplankton will increase the predation of algae, resulting in a decrease in the concentration of chlorophyll a.

5. Conclusions

Our study showed that floods can lead to an increase in the concentrations of total nitrogen, total phosphorus and chlorophyll a. Compared with the regular water level fluctuation period, the density and biomass of zooplankton decreased during the extreme water level fluctuation period. The number of rotifer species monitored during the extreme water level fluctuation period increased, while the number of cladoceran and copepod species decreased. Our research provides important evidence for the ecological relationship between floods and the zooplankton community, and helps us understand the impact of floods on the composition change of the zooplankton community. However, extending our results to other lake ecosystems should be performed with caution due to site-dependent responses. Thus, we call for long-term and multi-point-filed monitoring for a better understand of the influences of floods.

Supplementary Materials

The following supporting information can be downloaded at: https://www.mdpi.com/article/10.3390/d15020250/s1, Table S1: Zooplankton community composition in the Huayanghe Lake.

Author Contributions

Conceptualization: Z.Z. and W.C.; data curation: M.Z.; investigation: M.Z.; methodology: Z.Z.; writing—original draft: M.Z.; writing—review and editing: M.Z., Z.Z. and W.C.; funding acquisition: Z.Z. and W.C. All authors have read and agreed to the published version of the manuscript.

Funding

This research was supported by the Aquatic Biological Resources Monitoring in Key Watershed of Anhui Province (No. ZF2021-18-0786) and National Natural Science Foundation of China (No. 31901218).

Institutional Review Board Statement

Not applicable.

Data Availability Statement

Data about the density and biomass of zooplankton is listed in Supplementary Materials. More details are available on request from Mengmeng Zhou. E-mail: [email protected].

Acknowledgments

We would like to thank Yutao Wang for assistance with data collection. We also thank Marci Baun from the University of California, Los Angeles, for language editing.

Conflicts of Interest

The authors declare no conflict of interest.

References

  1. Li, B.; Yang, G.S.; Wan, R.R.; Lai, X.J.; Wagner, P.D. Impacts of hydrological alteration on ecosystem services changes of a large river-connected lake (Poyang Lake), China. J. Environ. Manag. 2022, 310, 114750. [Google Scholar] [CrossRef] [PubMed]
  2. Yang, X.; Ma, J.S.; Zhang, H.; Zhou, Q. Community structure and the water quality during different hydrological periods in Poyang Lake. Acta. Hydrobiol. Sin. 2021, 45, 1093–1103. [Google Scholar]
  3. Yang, S.; Hu, L.M.; Gao, R.; Liu, Q. Study of the problems and countermeasures in the ecosystem of Dongting Lake wetland. Environ. Sci. Manag. 2006, 31, 111–113. [Google Scholar]
  4. Wan, R.R.; Yang, G.S.; Wang, X.L.; Qin, N.X.; Dai, X. Progress of research on the relationship between the Yangtze River and its connected lakes in the middle reaches. J. Lake Sci. 2014, 26, 1–8. [Google Scholar]
  5. Zhang, D.M.; Zhou, L.Z.; Song, Y.W. Effect of water level fluctuations on temporal-spatial patterns of foraging activities by the wintering hooded crane (Grus monacha). Avian. Res. 2015, 6, 169–177. [Google Scholar] [CrossRef]
  6. Cui, Y.H.; Wang, J. Influence of the sluice on water level and area of Yangtze river-connected lakes: A case study in Shengjin Lake. J. Water Resour Water Eng. 2018, 29, 47–52. [Google Scholar]
  7. Krylov, A.V.; Mendsaihan, B.; Ayushsuren, C.; Tsvetkov, A.I. Zooplankton of Pulsating Lakes Orog and Tatsyn-Tsagaan (West Mongolia) in the period of the beginning of the stabilization of water-level regime. Inland. Water. Biol. 2020, 13, 242–250. [Google Scholar] [CrossRef]
  8. Carpenter, S.R. Phosphorus control is critical to mitigating eutrophication. Proc. Natl. Acad. Sci. USA 2008, 105, 1039–1040. [Google Scholar] [CrossRef]
  9. Tong, Y.L.; Liang, T.; Wang, L.Q.; Li, K.X. Simulation on phosphorus release characteristics of Poyang Lake sediments under variable water levels and velocities. J. Geogr. Sci. 2017, 27, 697–710. [Google Scholar] [CrossRef]
  10. Baldwin, D.S.; Mitchell, A.M. The effects of drying and re-flooding on the sediment and soil nutrient dynamics of lowland river-floodplain systems: A synthesis. Regul. Rivers: Res. Mgmt. 2000, 16, 457–467. [Google Scholar] [CrossRef]
  11. Qiu, S.; McComb, A.J. Effects of oxygen concentration on phosphorus release from reflooded air-dried wetland sediments. Mar. Freshwater. Res. 1994, 45, 1319–1328. [Google Scholar] [CrossRef]
  12. Dube, T.; DeNecker, L.; Van Vuren, J.H.; Wepener, V.; Smit, N.J.; Brendonck, L. Spatial and temporal variation of invertebrate community structure in flood-controlled tropical floodplain wetlands. J. Freshwater Ecol. 2017, 32, 1–15. [Google Scholar] [CrossRef]
  13. Meng, C.L.; Li, Q.H.; Li, H.M.; Hu, Y.; Li, Y. Comparison of community structure of zooplankton in Shuimodu Reservoir and Daotianhe Reservoir based on the path model. Ecol. Sci. 2021, 40, 1–12. [Google Scholar] [CrossRef]
  14. Mac Donagh, M.E.; Casco, M.A.; Claps, M.C. Plankton relationships under small water level fluctuations in a subtropical reservoir. Aquat Ecol. 2009, 43, 371–381. [Google Scholar] [CrossRef]
  15. Baranyi, C.; Hein, T.; Holarek, C.; Keckeis, S.; Schiemer, F. Zooplankton biomass and community structure in a Danube River floodplain system: Effects of hydrology. Freshw. Biol. 2002, 47, 473–482. [Google Scholar] [CrossRef]
  16. Cavan, E.L.; Henson, S.A.; Belcher, A.; Sanders, R. Role of zooplankton in determining the efficiency of the biological carbon pump. Biogeosciences 2017, 14, 177–186. [Google Scholar] [CrossRef]
  17. Ndah, A.B.; Meunier, C.L.; Kirstein, I.V.; Göbel, J.; Rönn, L.; Boersma, M. A systematic study of zooplankton-based indices of marine ecological change and water quality: Application to the European marine strategy framework directive (MSFD). Ecol. Indic. 2022, 135, 108587. [Google Scholar] [CrossRef]
  18. Zhu, W.Z.; Zhou, L.Z. Biodiversity and Conservation in Anqing Floodplain Wetlands; Hefei University of Technology Press: Hefei, China, 2010; pp. 1–64. [Google Scholar]
  19. Wang, J.Q.; Wu, J.P.; Yu, Y.B.; Wang, T.Y.; Cheng, G. The specific list, quantitative distribution and change of zooplankton in the season of spring and autumn in Poyang Lake. J. Lake Sci. 2003, 15, 345–352. [Google Scholar]
  20. Goswami, S.C. Zooplankton Methodology, Collection and Identification-A Field Manual; National Institute of Oceanography: Dona Paula, India, 2004; p. 26. [Google Scholar]
  21. Ruttner-Kolisko, A. Suggestions for biomass calculations of planktonic rotifers. Arch. Fur Hydrobiol. Beih. 1977, 21, 71–76. [Google Scholar]
  22. Downing, J.A. Assessment of secondary production: The first step. A manual on methods for the assessment of secondary productivity in fresh waters. IBP Handb. 1984, 17, 1–18. [Google Scholar]
  23. Zhang, W.C.; Zhang, C.X.; Xiao, T. Role of microzooplankton in marine planktonic ecosystem. Adv. Earth Sci. 2009, 24, 1195–1201. [Google Scholar]
  24. Wang, J.J. Chinese Freshwater Rotifers; Science Press: Beijing, China, 1961; pp. 24–289. [Google Scholar]
  25. Du, N.S. Index of Common Freshwater Cladocera in China; Science Press: Beijing, China, 1973; pp. 33–89. [Google Scholar]
  26. Shen, J.R. Fauna of China Arthropoda Crustacea Freshwater Copepoda; Science Press: Beijing, China, 1979; pp. 297–696. [Google Scholar]
  27. Jersabek, C.D.; Leitner, M.F. The Rotifer World Catalog; World Wide Web Electronic Publication. 2013. Available online: http://rotifera.hausdernatur.at/ (accessed on 5 December 2022).
  28. Segers, H.; De Smet, W.H.; Fischer, C.; Fontaneto, D.; Michaloudi, E.; Wallace, R.L.; Jersabek, C.D. Towards a list of available names in zoology, partim Phylum Rotifera. Zootaxa 2012, 3179, 61–68. [Google Scholar] [CrossRef]
  29. Chatterjee, T.; Kotov, A.A.; Van Damme, K.; Chandrasekhar, S.V.A.; Padhye, S. An annotated checklist of the Cladocera (Crustacea: Branchiopoda) from India. Zootaxa 2013, 3667, 1–89. [Google Scholar] [CrossRef]
  30. Liu, X.Y.; Tang, P.; Liu, Y.H.; Xie, W.C.; Chen, C.; Li, T.; He, Q.P.; Bao, J.; Tiraferri, A.; Liu, B.C. Efficient removal of organic compounds from shale gas wastewater by coupled ozonation and moving-bed-biofilm submerged membrane bioreactor. Bioresour. Technol. 2022, 344, 126191. [Google Scholar] [CrossRef]
  31. He, C.Q.; Chen, Y.N.; Liu, C.; Jiang, Y.; Yin, R.Y.; Qiu, T.S. The role of reagent adding sequence in the NH4+-N recovery by MAP method. Sci. Rep. 2020, 10, 7672. [Google Scholar] [CrossRef]
  32. Chen, H.W.; Zhao, L.L.; Yu, F.B.; Du, Q.L. Detection of phosphorus species in water: Technology and strategies. Analyst 2019, 144, 7130–7148. [Google Scholar] [CrossRef]
  33. Rousso, B.Z.; Bertone, E.; Stewart, R.; Aguiar, A.; Chuang, A.; Hamilton, D.P.; Burford, M.A. Chlorophyll and phycocyanin in-situ fluorescence in mixed cyanobacterial species assemblages: Effects of morphology, cell size and growth phase. Water. Res. 2022, 212, 118127. [Google Scholar] [CrossRef]
  34. De Silva-Dávila, R.; Franco-Gordo, C.; Hochberg, F.G.; Godínez-Domínguez, E.; Avendaño-Ibarra, R.; Gómez-Gutiérrez, J.; Robinson, C.J. Cephalopod paralarval assemblages in the Gulf of California during 2004–2007. Mar. Ecol. Prog. Ser. 2015, 520, 123–141. [Google Scholar] [CrossRef] [Green Version]
  35. Margalef, D.R. Information theory in ecology. Gen. Syst. 1957, 32, 374–559. [Google Scholar]
  36. Pielou, E.C. An Introduction to Mathematical Ecology; Wiley-Interscience, Inc.: New York, NY, USA, 1969. [Google Scholar]
  37. Shannon, C.E. A mathematical theory of communication. Bell. Syst. Tech. J. 1948, 27, 379–423. [Google Scholar] [CrossRef]
  38. Zhu, W.J.; Hu, W.G.; Zhang, Y.D.; Jia, W.P.; Ma, D.C.; Gao, Y.; You, Y.; Zhang, X.R. Characteristics of zooplankton communities and their responses to water environmental factors during different hydrological periods of the Daquangou Reservoir. Asian. J. Ecotoxicol. 2020, 6, 243–251. [Google Scholar]
  39. Burns, N.M.; Rutherford, J.C.; Clayton, J.S. A monitoring and classification system for New Zealand lakes and reservoirs. Lake Reserv. Manage. 1999, 15, 255–271. [Google Scholar] [CrossRef]
  40. Zhang, Y.; Li, M.X.; Dong, J.F.; Yang, H.; Van Zwieten, L.; Lu, H.; Alshameri, A.; Zhan, Z.H.; Chen, X.; Jiang, X.D.; et al. A critical review of methods for analyzing freshwater eutrophication. Water 2021, 13, 225. [Google Scholar] [CrossRef]
  41. Xiong, W.; Ni, P.; Chen, Y.Y.; Gao, Y.C.; Shan, B.Q.; Zhan, A.B. Zooplankton community structure along a pollution gradient at fine geographical scales in river ecosystems: The importance of species sorting over dispersal. Mol. Ecol. 2017, 26, 4351–4360. [Google Scholar] [CrossRef]
  42. Zhang, K. Characteristics of Zooplankton Communities in Tongjiang Lakes in the Anhui Section of Yangtze River and Their Relationship with Environmental Factors. Ph.D. Thesis, Anhui University, Hefei, China, 2019. [Google Scholar]
  43. Fang, Y.X.; He, C.Q.; Liang, X.; Jia, H.; Ma, Z.F.; Zhan, Y.W.; Zhang, Y.K.; Zhang, X.X. The Purifying Effect of Polluted Water by the Aquatic Plants. J. Hydroecol. 2010, 3, 36–40. [Google Scholar]
  44. Wang, Y.T.; Wang, W.C.; Zhou, Z.Z.; Wan, X.; Zhang, Y.X. Effect of fast restoration of aquatic vegetation on phytoplankton community after removal of purse seine culture in Huayanghe Lakes. Sci. Total Environ. 2021, 768, 144024. [Google Scholar] [CrossRef]
  45. Usenko, O.M.; Sakevich, A.I. Allelopathic influence of higher aquatic plants on the functional activity of plankton algae. Hydrobiology 2005, 41, 54–66. [Google Scholar]
  46. Guo, W.L.; Zhou, Z.Z.; Chen, J.W.; Zheng, X.D.; Ye, X.X. Effects of extreme flooding on aquatic vegetation cover in Shengjin Lake, China. Hydrol. Process. 2022, 36, e14459. [Google Scholar]
  47. Peng, X.; Ning, X.R.; Sun, J.; Le, F.F. Responses of phytoplankton growth on nutrient enrichments in the northern South China Sea. Acta Ecol. Sin. 2006, 26, 3959–3968. [Google Scholar]
  48. Golubkov, M.; Golubkov, S. Impact of the construction of new port facilities on primary production of plankton in the Neva Estuary (Baltic Sea). Front. Mar. Sci. 2022, 9, 851043. [Google Scholar] [CrossRef]
  49. Yan, D.H.; Deng, W.; He, Y. The evolution of pH-value of natural water and its course of formation Tumen water systems. Agro Environ. Prot. 2001, 20, 4–6. [Google Scholar]
  50. Huang, C.; Liu, M.D.; Liu, S.P.; Chen, Z.X.; Liang, X.Y. Prediction and analysis of the influence of suspension on aquatic life in waterway regulation in the middle reaches of the Yangtze River: Taking the section from Xinzhou to Jiujiang river as an example. Environ. Impact Assess. 2019, 41, 50–55+60. [Google Scholar]
  51. Boon, P.I.; Bunn, S.E.; Green, J.D.; Shiel, R.J. Consumption of cyanobacteria by freshwater zooplankton: Implications for the success of “top-down” control of cyanobacterial blooms in Australia. Mar. Freshw. Res. 1994, 45, 875–887. [Google Scholar] [CrossRef]
  52. AL-Keriawy, H.A.H. Impact of fish farming in floating cages on zooplankton community in Euphrates River, Iraq. IOP. Conf. Ser. Earth. Environ Sci. 2021, 722, 012042. [Google Scholar] [CrossRef]
  53. Gazonato Neto, A.J.; Silva, L.C.D.; Saggio, A.A.; Rocha, O. Zooplankton communities as eutrophication bioindicators in tropical reservoirs. Biota Neotrop. 2014, 14, 1–12. [Google Scholar] [CrossRef]
  54. Ortega-Cisneros, K.; Scharler, U.M.; Whitfield, A.K. Inlet mouth phase influences density, variability and standing stocks of plankton assemblages in temporarily open/closed estuaries. Estuar. Coast. Shelf. Sci. 2014, 136, 139–148. [Google Scholar] [CrossRef]
  55. Viroux, L. Zooplankton development in two large lowland rivers, the Moselle (France) and the Meuse (Belgium). J. Plankton Res. 1997, 19, 1743–1762. [Google Scholar] [CrossRef]
  56. Ge, Y.W.; Zhang, K.; Yang, X.D. Long-term succession of aquatic plants reconstructed from palynological records in a shallow freshwater lake. Sci. Total Environ. 2018, 643, 312–323. [Google Scholar] [CrossRef]
  57. Sun, X.Y.; Arnott, S.E. Interactive effects of increased salinity and heatwaves on freshwater zooplankton communities in simultaneous and sequential treatments. Freshw. Biol. 2022, 67, 1604–1617. [Google Scholar] [CrossRef]
  58. Xu, M. The Research on the Community Structure of Metazoan Zooplanktons in Lake Jiaoganghu and Lake Huayanghe. Master’s Thesis, Anhui University, Hefei, China, 2016. [Google Scholar]
  59. Zhang, Y.X. The Effect of Removing the Fisher Purse Seine on Zooplankton Communities Structure in the Huayanghe Lakes. Master’s Thesis, Anhui University, Hefei, China, 2021. [Google Scholar]
  60. Paidere, J. Influence of flooding frequency on zooplankton in the floodplains of the Daugava River (Latvia). Acta Zool Litu. 2009, 19, 306–313. [Google Scholar] [CrossRef]
  61. Tockner, K.; Malard, F.; Ward, J.V. An extension of the flood pulse concept. Hydrol. Process. 2000, 14, 2861–2883. [Google Scholar] [CrossRef]
  62. Thomaz, S.M.; Bini, L.M.; Bozelli, R.L. Floods increase similarity among aquatic habitats in river-floodplain systems. Hydrobiologia 2007, 579, 1–13. [Google Scholar] [CrossRef]
  63. Higuti, J.; Velho, L.F.M.; Lansac-Toha, F.A.; Martens, K. Pleuston communities are buffered from regional flood pulses: The example of ostracods in the Parana River floodplain, Brazil. Freshwat. Biol. 2007, 52, 1930–1943. [Google Scholar] [CrossRef]
  64. da Conceição, E.d.O.; Higuti, J.; de Campos, R.; Martens, K. Effects of flood pulses on persistence and variability of pleuston communities in a tropical floodplain lake. Hydrobiologia 2018, 807, 175–188. [Google Scholar] [CrossRef]
  65. Kobayashi, T.; Ralph, T.J.; Ryder, D.S.; Hunter, S.J.; Shiel, R.J.; Segers, H. Spatial dissimilarities in plankton structure and function during flood pulses in a semi-arid floodplain wetland system. Hydrobiologia 2015, 747, 19–31. [Google Scholar] [CrossRef]
  66. Bozelli, R.L.; Thomaz, S.M.; Padial, A.A.; Lopes, P.M.; Bini, L.M. Floods decrease zooplankton beta diversity and environmental heterogeneity in an Amazonian floodplain system. Hydrobiologia 2015, 753, 233–241. [Google Scholar] [CrossRef]
  67. Braghin, L.S.M.; Figueiredo, B.R.S.; Meurer, T.; Michelan, T.S.; Simoes, N.R.; Bonecker, C.C. Zooplankton diversity in a dammed river basin is maintained by preserved tributaries in a tropical floodplain. Aquat. Ecol. 2015, 49, 175–187. [Google Scholar] [CrossRef]
  68. O’Hare, M.T.; Baattrup-Pedersen, A.; Baumgarte, I.; Freeman, A.; Gunn, I.D.M.; Lázár, A.N.; Sinclair, R.; Wade, A.J.; Bowes, M.J. Responses of aquatic plants to eutrophication in rivers: A revised conceptual model. Front. Plant. Sci. 2018, 9, 451. [Google Scholar] [CrossRef]
  69. Pretty, T.J. Boreal Subarctic Lake Water Quality, Zooplankton Communities, and Benthic Macroinvertebrate Communities in areas Impacted by Wildfire. Master’s Thesis, Wilfrid Laurier University, Waterloo, ON, Canada, 2020. [Google Scholar]
  70. Chiba, S.; Batten, S.; Martin, C.S.; Ivory, S.; Miloslavich, P.; Weatherdon, L.V. Zooplankton monitoring to contribute towards addressing global biodiversity conservation challenges. J. Plankton Res. 2018, 40, 509–518. [Google Scholar] [CrossRef]
  71. Fullgrabe, L.; Grosjean, P.; Gobert, S.; Lejeune, P.; Leduc, M.; Engels, G.; Dauby, P.; Boissery, P.; Richir, J. Zooplankton dynamics in a changing environment: A 13-year survey in the northwestern Mediterranean Sea. Mar. Environ Res. 2020, 159, 104962. [Google Scholar] [CrossRef]
  72. Dorche, E.E.; Shahraki, M.Z.; Farhadian, O.; Keivany, Y. Seasonal variations of plankton structure as bioindicators in Zayandehrud Dam Lake, Iran. Limnol. Rev. 2018, 18, 157–165. [Google Scholar] [CrossRef]
  73. Song, J.; Hou, C.Y.; Liu, Q.; Wu, X.F.; Wang, Y.J.; Yi, Y.J. Spatial and temporal variations in the plankton community because of water and sediment regulation in the lower reaches of Yellow River. J. Clean. Prod. 2020, 261, 120972. [Google Scholar] [CrossRef]
  74. Taipale, S.J.; Ventelä, A.M.; Litmanen, J.; Anttila, L. Poor nutritional quality of primary producers and zooplankton driven by eutrophication is mitigated at upper trophic levels. Ecol. Evol. 2022, 12, e8687. [Google Scholar] [CrossRef]
  75. Cai, Q.H. Multivariate analysis for the relationship between zooplankton and phytoplankton of Lake Donghu, Wuhan. J. Grad. Sch. Acad. Sinica. 1995, 12, 97–102. [Google Scholar]
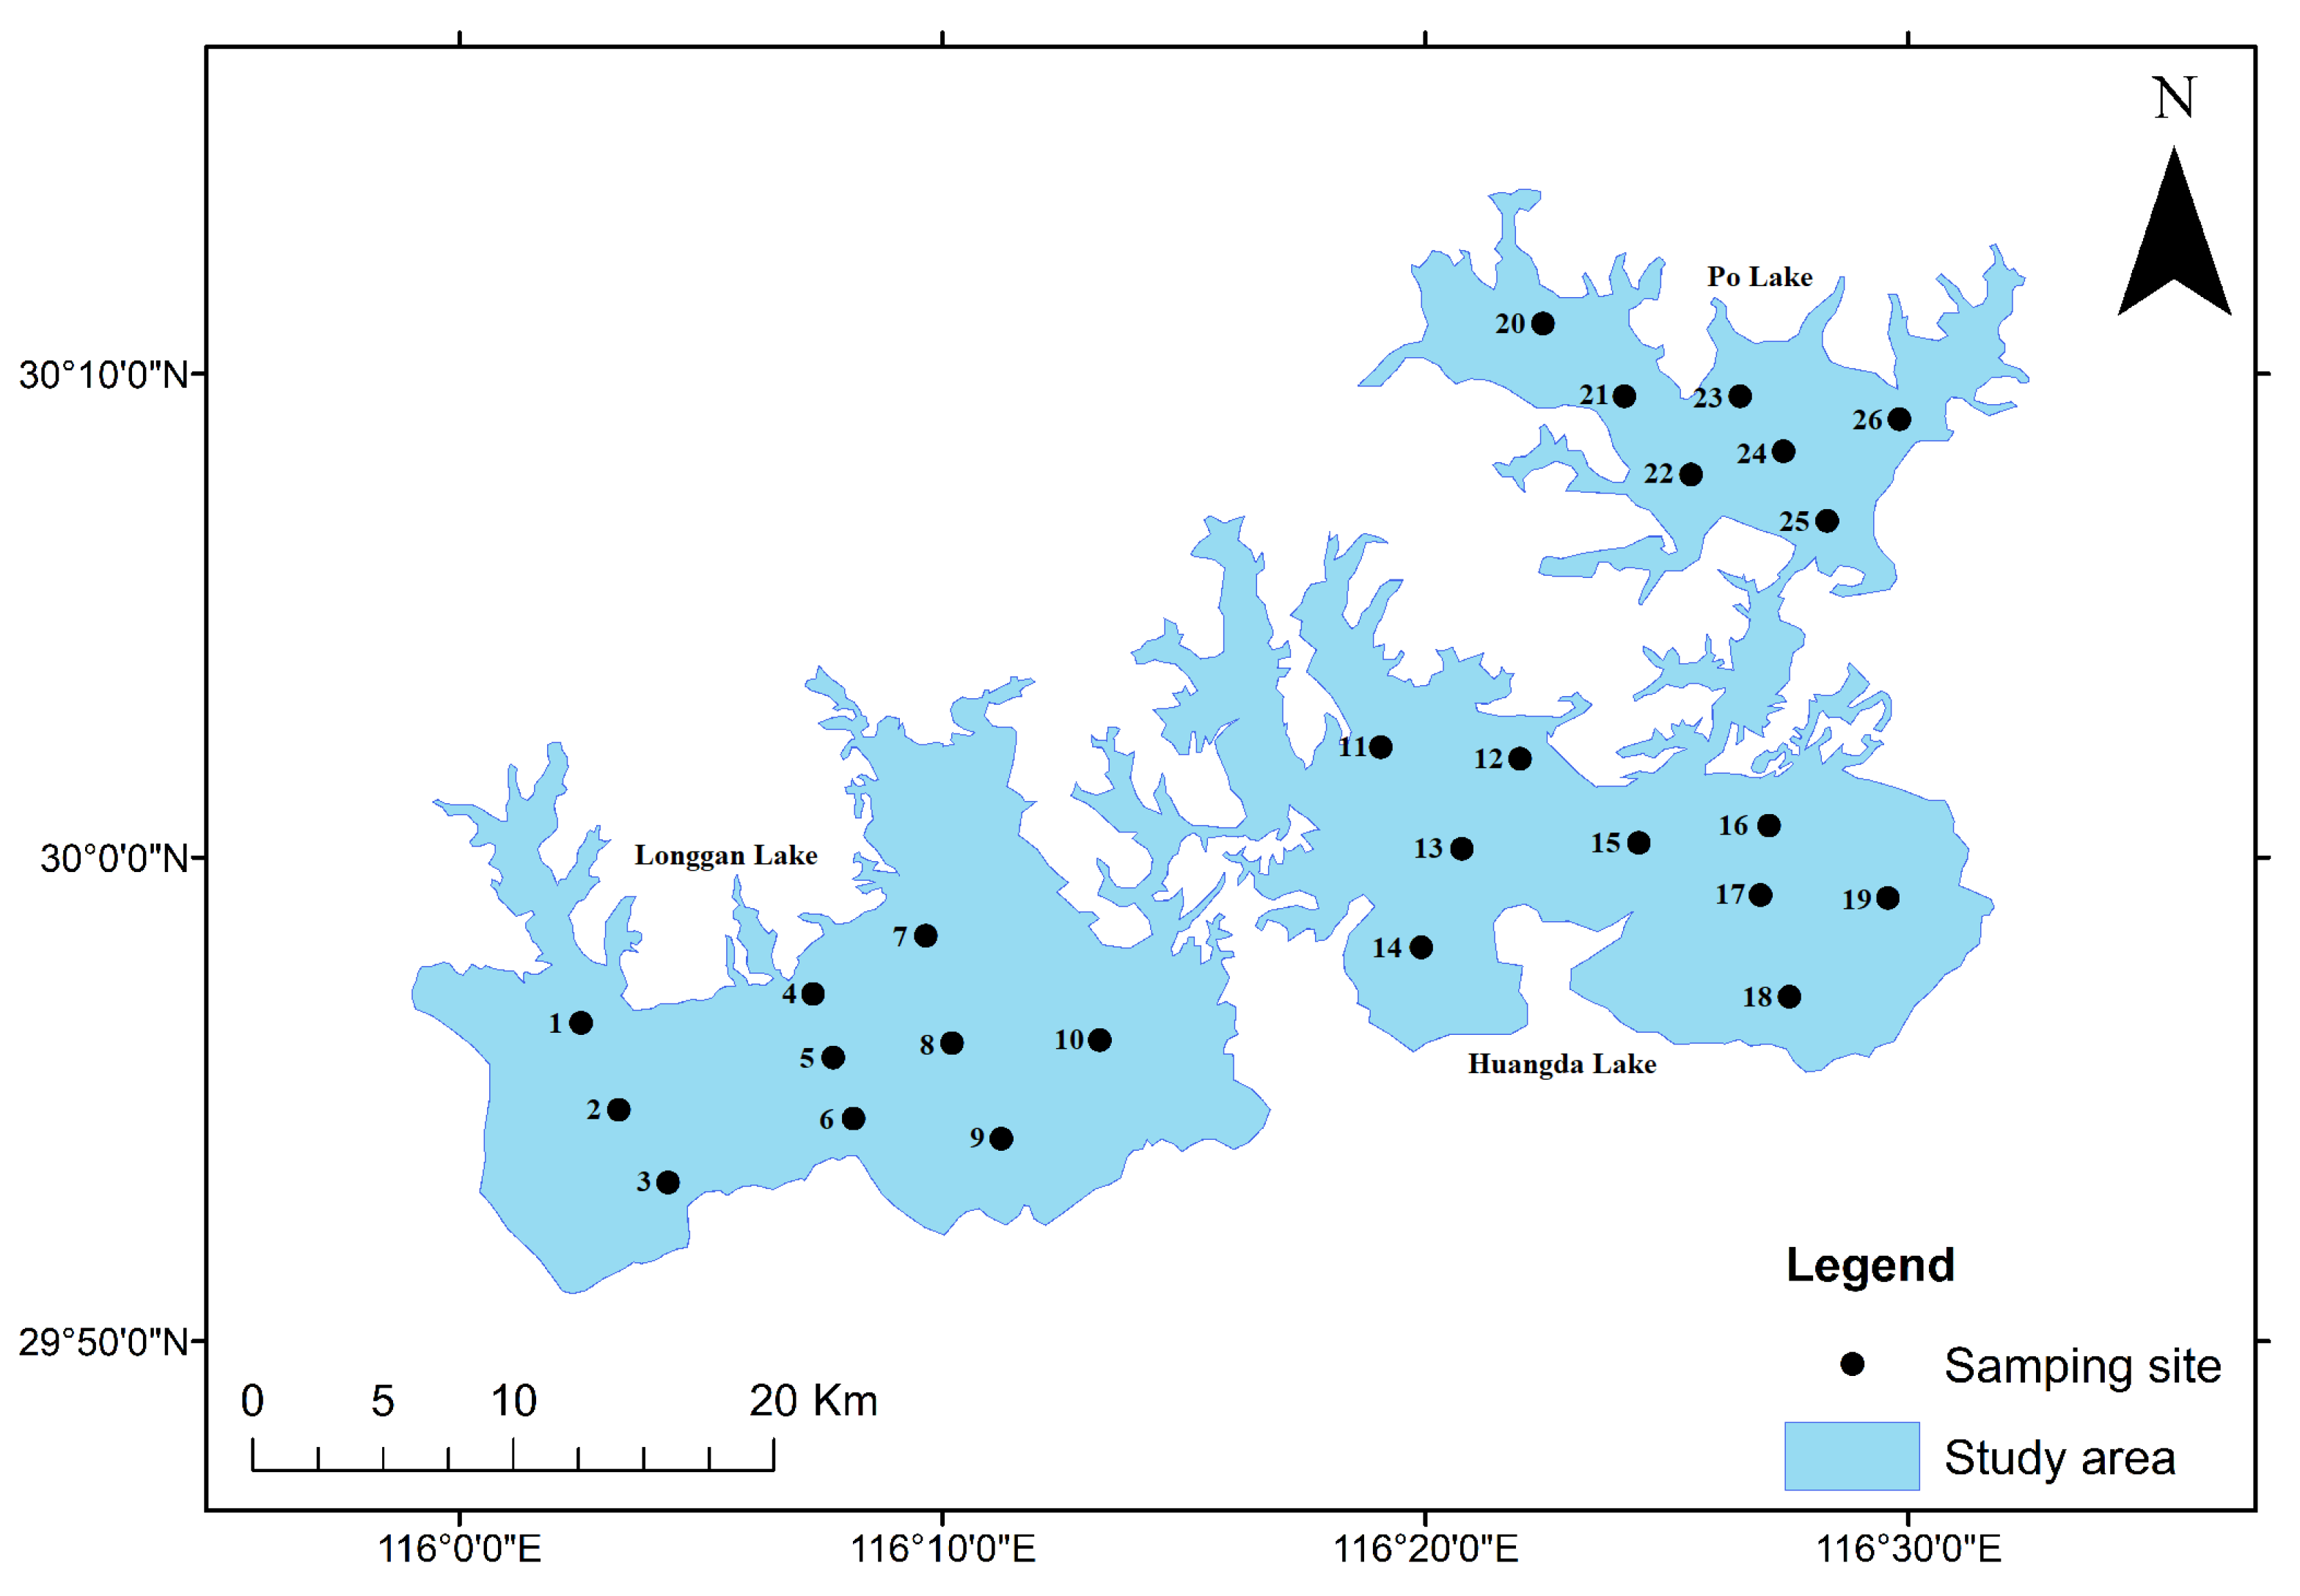
Figure 1. Sampling points of Huayanghe Lake.
Diversity 15 00250 g001
Figure 2. Zooplankton density (a) and biomass (b). Abbreviations used in the diagram: EWF, extreme water level fluctuation period; RWF, regular water level fluctuation period.
Diversity 15 00250 g002
Figure 3. Seasonal distribution of zooplankton density (a) and biomass (b).
Diversity 15 00250 g003
Figure 4. Spatial distribution of zooplankton density in the period of extreme water level fluctuation (a) and in the period of regular water level fluctuation (b).
Diversity 15 00250 g004
Figure 5. Zooplankton diversity index. Abbreviations used in the diagram: H′, Shannon–Wiener diversity index; D, Margalef richness index; J, Pielou evenness index.
Diversity 15 00250 g005
Figure 6. RDA analysis ranking of the zooplankton dominant species density and environmental factors in the period of extreme water level fluctuation (a) and in the period of regular water level fluctuation (b). Tc: Trichocerca capucina; Tr: Trichocerca rousseleti; Kc: Keratella cochlearis; Kv: Keratella valga; Pt: Polyarthra trigla; Bl: Bosmina longirostris; Bd: Bosminopsis deitersi; Sd: Sinocalanus doerrii; Th: Thermocyclops hyalinus; Ts: Trichocerca stylata; Nl: Notholca labis; Bu: Brachionus urceolaris; Bb: Brachionus budapestinensis; Lb: Lecane bulla; Pe: Polyarthra euryptera; Bf: Bosmina fatalis.
Diversity 15 00250 g006
Figure 7. Cluster analysis of the zooplankton in the extreme water level fluctuation period (a) and the regular water level fluctuation period (b).
Diversity 15 00250 g007
Table 1. Environmental parameters during the survey period.
Environmental Factors/TimesEWFRWF
Spring
May 2020
Summer
Aug. 2020
Autumn
Nov. 2020
Winter
Feb. 2021
Spring
May 2021
Summer
Aug. 2021
Autumn
Nov. 2021
Winter
Feb. 2022
WT/(°C)24.57 ± 0.3932.47 ± 0.6523.82 ± 1.219.33 ± 0.1918.26 ± 0.4333.26 ± 1.8919.90 ± 0.5811.79 ± 0.98
pH7.09 ± 0.169.06 ± 0.528.64 ± 0.518.30 ± 0.258.94 ± 0.228.65 ± 0.418.72 ± 0.407.56 ± 0.13
DO/(mg/L)8.94 ± 0.7210.38 ± 2.339.16 ± 0.8711.51 ± 0.059.34 ± 0.209.21 ± 2.1210.05 ± 0.3111.27 ± 0.42
EC/(µs/cm)240.20 ± 53.70188.07 ± 30.39181.08 ± 18.86141.6 ± 15.19229.55 ± 26.72237.50 ± 36.78141.33 ± 29.03148.68 ± 30.14
SD/m0.39 ± 0.190.93 ± 0.430.73 ± 0.150.06 ± 0.030.37 ± 0.070.63 ± 0.370.57 ± 0.100.21 ± 0.10
WD/m1.98 ± 0.415.96 ± 0.876.77 ± 0.931.30 ± 0.142.32 ± 0.193.05 ± 0.493.26 ± 0.493.21 ± 0.58
Turb/(NTU)54.81 ± 44.3211.20 ± 7.9912.64 ± 5.2935.49 ± 10.3225.94 ± 6.3210.23 ± 2.3146.52 ± 19.5223.39 ± 13.31
TN/(mg/L)1.81 ± 0.512.39 ± 1.451.41 ± 0.301.24 ± 0.382.36 ± 0.540.47 ± 0.050.33 ± 0.180.31 ± 0.04
NH4+-N/(mg/L)0.07 ± 0.050.02 ± 0.010.03 ± 0.010.06 ± 0.010.10 ± 0.050.04 ± 00.05 ± 0.020.01 ± 0
TP/(mg/L)0.03 ± 0.070.05 ± 0.020.04 ± 0.020.13 ± 0.050.05 ± 0.100.02 ± 0.090.03 ± 0.030.06 ± 0.06
Chl.a/(µg/L)4.32 ± 4.823.25 ± 2.653.74 ± 3.827.25 ± 5.832.64 ± 2.032.77 ± 3.023.01 ± 0.975.35 ± 3.95
Cov/(%)53521104021
Sunshine duration/(h)6.937.835.721.436.937.835.721.43
Table 2. Dominant species and dominance of zooplankton.
SpeciesSpecies Dominance (Y)
May 2020Aug. 2020Nov. 2020Feb. 2021May 2021Aug. 2021Nov. 2021Feb. 2022
Trichocerca capucina0.0450.031---0.020--
Trichocerca stylata0.030---0.0220.0260.020-
Trichocerca rousseleti--0.0910.068-0.047--
Brachionus budapestinensis----0.0340.077--
Brachionus urceolaris----0.0220.0500.033-
Keratella cochlearis0.1210.1000.0410.0940.215-0.0580.026
Keratella valga-0.055--0.0280.0560.0610.035
Notholca labis-0.020---0.1850.0230.180
Polyarthra euryptera-----0.032--
Polyarthra trigla0.081-0.241-0.090-0.1120.155
Lecane bulla--0.024-0.024--0.061
Bosmina longirostris0.059--0.0200.022--
Bosmina fatalis0.025--0.024-0.027--
Bosminopsis deitersi--0.0370.031--0.095
Sinocalanus doerrii0.025-0.028--0.023--
Thermocyclops hyalinus-0.022--0.0210.0600.0300.020
Note: “-” means dominance Y < 0.02.
Table 3. Correlation analysis between zooplankton and environmental factors in the period of extreme water level fluctuation.
DensityBiomass
rprp
WT0.800.0160.740.037
pH0.530.1750.700.056
DO−0.490.220−0.290.489
EC0.300.4690.130.756
SD0.920.0010.860.006
WD0.99<0.0011.00<0.001
Turb−0.840.010−0.930.001
NH4+-N−0.820.012−0.920.001
TN0.450.2640.460.248
TP−0.600.118−0.430.287
Chl.a−0.910.002−0.860.006
Cov0.490.2160.530.174
Sunshine duration0.750.0320.650.078
Table 4. Correlation analysis between zooplankton and environmental factors in the period of regular water level fluctuation.
DensityBiomass
rprp
WT0.800.0160.820.013
pH0.720.0450.620.105
DO−0.630.098−0.560.146
EC0.130.7660.100.817
SD0.97<0.0010.95<0.001
WD0.180.6640.310.458
Turb0.030.944−0.060.887
NH4+-N0.530.1800.390.334
TN−0.170.692−0.300.477
TP−0.880.004−0.930.001
Chl.a−0.710.048−0.620.102
Cov0.450.2680.440.274
Sunshine duration0.770.0250.700.055
Disclaimer/Publisher’s Note: The statements, opinions and data contained in all publications are solely those of the individual author(s) and contributor(s) and not of MDPI and/or the editor(s). MDPI and/or the editor(s) disclaim responsibility for any injury to people or property resulting from any ideas, methods, instructions or products referred to in the content.