Article

Spatiotemporal Patterns of Wolves, and Sympatric Predators and Prey Relative to Human Disturbance in Northwestern Greece

1
Biodiversity Conservation Laboratory, Department of Biological Applications & Technology, University of Ioannina, 45500 Ioannina, Greece
2
School of Natural Resources, University of Nebraska, Lincoln, NE 68583, USA
3
CEFE, Univ Montpellier, CNRS, EPHE, IRD, 34293 Montpellier, France
*
Authors to whom correspondence should be addressed.
Diversity 2023, 15(2), 184; https://doi.org/10.3390/d15020184
Submission received: 29 December 2022 / Revised: 22 January 2023 / Accepted: 24 January 2023 / Published: 28 January 2023
(This article belongs to the Section Animal Diversity)

Abstract

:
In an era of increasing human pressure on nature, understanding the spatiotemporal patterns of wildlife relative to human disturbance can inform conservation efforts, especially for large carnivores. We examined the temporal activity and spatial patterns of wolves and eight sympatric mammals at 71 camera trap stations in Greece. Grey wolves temporally overlapped the most with wild boars (Δ = 0.84) and medium-sized mammals (Δ > 0.75), moderately with brown bears (Δ = 0.70), and least with roe deer (Δ = 0.46). All wild mammals were mainly nocturnal and exhibited low temporal overlap with human disturbance (humans, vehicles, livestock, and dogs; Δ = 0.18–0.36), apart from roe deer, which were more diurnal (Δ = 0.80). Six out of nine species increased their nocturnality at sites of high human disturbance, particularly roe deer and wolves. The detection of wolves was negatively associated with paved roads, the detection of roe deer was negatively associated with human disturbance, and the detection of wild boars was negatively associated with dogs. The detection of bears, boars, and foxes increased closer to settlements. Our study has applied implications for wolf conservation and human–wildlife coexistence.

1. Introduction

Studying the activity patterns of animals in time and space is critical to understanding their behavior, interactions with other species, and resource requirements [1]. The spatiotemporal patterns of wildlife are affected by human disturbance [2,3], climatic factors [4], the activity and abundance of prey [5], and interspecific interactions [6,7]. Given the rapid industrialization of the Earth [8], together with the predicted sharp expansion of roads globally [9], wildlife, and especially large carnivores, are increasingly vulnerable to human-induced pressures [10]. This issue was recently addressed by governments around the world with the Kunming–Montreal Global Biodiversity Framework [11], with two distinct targets: (a) eliminating the loss of areas of high ecological importance by 2030 (Target 1), and (b) minimizing human–wildlife conflict to promote coexistence (Target 4). Therefore, it is of critical importance to understand the spatiotemporal patterns of wildlife to inform conservation practice and future research efforts.
Humans are perceived as “super predators” and can trigger strong avoidance in wild animals, who usually adjust their behavior in time and space to minimize encounters with humans [2,12]. Human activity in some areas may affect large herbivores more than habitat or natural predators [13,14]. Wild mammals often increase nocturnality relative to the intensity of human disturbance in anthropogenic landscapes [2,15,16]. For many large carnivores, their long history of persecution likely contributes to their crepuscular–nocturnal behavior [17]. Animals do not respond homogenously to human disturbance and variable environmental conditions; therefore, a multi-species approach is required [18].
The challenge of adapting spatiotemporal behavioral patterns to optimize fitness is even more pronounced for large carnivores, which sometimes increase their hunting success by adopting the spatiotemporal patterns of their prey [19,20]. As top predators, grey wolves (Canis lupus) make an effective model species for studying spatiotemporal relationships, given that their populations in human-dominated landscapes across Europe appear to be on the increase [21]. Thus, we focused our research on grey wolves, a species protected under European legislation (Habitats Directive of the European Union 92/43/EEC). Wolves are widespread in Greece (60% of the mainland) [22], where wolf–human conflict is a major management concern [23]. Thus, understanding the spatiotemporal activity patterns of wolves and their wild prey is a necessity to inform wildlife management and wolf–human conflict mitigation, and to guide future research efforts. This topic remains largely unstudied in the human-dominated landscapes of south-eastern Europe, and Greece in particular, such that our research contributes to filling an important ecological knowledge gap.
We focused our research on grey wolves and their main wild prey in northwestern Greece by studying wildlife behavior using camera trapping [1]. Apart from the main target species, we used camera “bycatch” data to study the behavior of other sympatric species. We had four objectives, which were to investigate: (a) the temporal activity patterns of wolves and temporal overlap with their main wild prey and other sympatric predators, (b) the temporal activity patterns of wild mammals in relation to human disturbance, (c) the nocturnality of wild mammals as a response to the intensity of human disturbance, and (d) factors influencing the detection rates of wild mammals. We interpreted our findings in the context of wolf conservation.

2. Materials and Methods

2.1. Study Area

The study was conducted in Ioannina Regional Unit, northwestern Greece (c. 5000 km2, 39.8116969 N, 20.808036 E) (Figure 1). It is a mountainous area with an elevation range between 92 and 2586 m. The area is covered by broadleaved forests, coniferous forests, mixed forests (38.0%), scrublands (26.4%), agricultural land (17.3%), natural grasslands/sparse vegetation (15.4%), artificial surfaces (1.6%), water bodies/wetlands (0.7%), and natural bare land (0.6%) [24]. The climate was intermediate between the Mediterranean and the Continental type, with a mean total annual precipitation of 1015 mm, and a mean monthly temperature ranging from 4.7 °C (January) to 26.8 °C (August), with a minimum in January (−3.2 °C) and a maximum in August (35.0 °C) (data from Ioannina Meteorological Station, 2010–2020, 475 m). Mammals that are present in the region include wolves, brown bears (Ursus arctos), wild boars (Sus scrofa), roe deer (Capreolus capreolus), Balkan chamois (Rupicapra rupicapra balcanica), red foxes (Vulpes vulpes), European badgers (Meles meles), stone martens (Martes foina), European brown hares (Lepus europaeus), and occasionally, golden jackals (Canis aureus). Protected areas cover 44% of the study area (16 sites of the Natura 2000 network). Human density is 33.6 inhabitants/km2 [25]. Livestock breeding is a main economic activity in the study area with an average density of 66.5 sheep/goat and 7.3 cattle animals per km2 [26]. Most free-ranging livestock herds are protected by guardian dogs and shepherds. Hunting is widespread, with 5500–6000 regional licenses issued each hunting season (Ioannina Hunting Association). Hunting is permitted from the middle of August to the end of February; however, hunters often walk their hunting dogs outdoors outside of hunting season. Hunters are not allowed to hunt close to human settlements or in wildlife reserves (n = 15 reserves, 6% of the study area). The main mammalian game species are wild boars and brown hares. The hunting of roe deer and Balkan chamois has been legally banned in Greece since 1969 due to the low population densities of these species, although poaching does occur.

2.2. Data collection: Camera Trapping

We conducted the camera trap survey between July and October 2019, and July and November 2020, using 20 no-glow camera traps (Browning Dark Ops HD Pro X 2019). We rotated the camera traps every 30–40 days at a total of 75 stations within a standard 5 × 5 km EEA grid [27], covering 36% of the Ioannina regional unit. We positioned cameras to maximize the probability of detecting wolves along forest roads. We hid cameras and locked them on trees (height: 60–250 cm) to minimize camera theft and vandalism. Nonetheless, towards the end of the survey period, three cameras were stolen, and one was disrupted by livestock, resulting in a final set of 71 camera trap stations (Figure 1). Cameras remained for an average of 37.5 (±6.5 SD) trap days per site. The average spacing between cameras was 4.1 km (±1.5 km). We programmed the cameras to be active 24 h per day and to take three photos per trigger with no delay between consecutive images, without using any baits or lures (research permissions 59655/252 and 36097/927).

2.3. Data Analysis

2.3.1. Relative Abundance Index

We considered all wild mammalian species and 12 human disturbance types (related to human presence, vehicles, dogs, and livestock) (Table 1). We created the raw database by classifying images using the open access Wild.ID software version 0.9.31 [1]. We extracted the matrices of independent detection events in R software version 4.1.1 using scripts available online [28]. We did not use photographs recorded within 30 min of a previous picture of the same species at the same site, as they are not considered to be independent [29]. We used independent detections to estimate the detection rate, also called the relative abundance index (RAI), by dividing the number of independent detections by the sampling effort (100 camera trap days) [30]. We calculated RAI for all mammals and human disturbance types recorded across all sites, and separately for each site.

2.3.2. Wolf Temporal Activity Patterns Relative to Other Mammals

We estimated the temporal activity patterns of wolves and sympatric species using kernel density estimation in the R package ‘overlap’ [31]. We excluded small species as well as mammals with <20 records from the analyses. We first converted the time of each observation into radians to account for the circular distribution of the time of day. We then created kernel density estimation curves for each species and calculated the non-parametric coefficient of overlap Δ between each species pair. The minimum sample size defines the appropriate estimator (Δ4 if n > 75, otherwise Δ1 [1]), and since our sample size was >75 detections for all species, we used the Δ4 estimator. We estimated the mean coefficient of overlapping with 95% CIs by bootstrapping with 10,000 permutations. Coefficient Δ ranges between 0 (no overlap) and 1 (total overlap) [32] and is considered to be high if Δ > 0.75, intermediate if 0.50 < Δ < 0.75, and low if Δ < 0.50 [33,34]. Besides coefficient Δ, we employed a more refined method to test whether activity patterns significantly differed between each species pair, using the circular statistic Mardia–Watson–Wheeler test (MWW test) in the R package ‘circular’ [35]. We considered differences to be significant if p < 0.05 and marginally significant if 0.10 < p < 0.05.

2.3.3. Temporal Activity Patterns Relative to Human Disturbance

We evaluated temporal segregation between the mammalian community and human disturbance, as described in Section 2.3.2. We first evaluated total temporal activity pattern overlap between each species and human disturbance using data from all camera trap sites. We then defined each camera trap site as either having high or low human disturbance, using the mean value of human disturbance RAI as the threshold [16]. The mean value of the RAI for human disturbance was 125.3 (min = 4.8, max = 544.4) and resulted in 24 high and 47 low human disturbance sites (Figure 1). We estimated overlap in the temporal activity patterns (coefficient Δ) between (a) wild mammals and human disturbance (at all sites), and (b) each species at high and low human disturbance sites (Δ4 for >75 detections, Δ1 for <75 detections). We evaluated the significance of the differences using MWW tests.
We quantified temporal shifts in the activity of wild mammals following the methodology of Gaynor et al. [2]. We first categorized the detections of each species as: day (between sunrise and sunset) and night (between sunset and sunrise), using https://sunrise.maplogs.com/ (accessed on 15 September 2022) for the exact sunrise and sunset times for each detection. We then calculated the risk ratio (RR) for each species, reflecting the comparative nocturnality shift under different disturbance regimes, using the formula:
RR = ln X H i g h X L o w    
where:
  • XHigh is the percentage of the nocturnal detections of wild mammals at high human disturbance sites;
  • XLow is the percentage of the nocturnal detections of wild mammals at low human disturbance sites.
A positive risk ratio (RR > 0) represents a shift to increased nighttime activity (and decreased daytime activity) in sites of high human disturbance.

2.3.4. Modeling Detection Rates of Mammals

We used generalized linear models to investigate environmental, anthropogenic, and biological factors (predictor variables) potentially influencing the detection rates (response variable) of wild mammals [36,37,38]. First, we selected four habitat-related variables: elevation, slope, percentage of forest cover, and percentage of scrubland cover. Second, we considered six main anthropogenic-related variables, namely, distance to the nearest settlement and the nearest paved road, and the RAIs for humans, vehicles, dogs, livestock separately and combined (total human disturbance), as well as two sub-categories (i.e., the RAI of hunters and Livestock Guarding Dog (LGD)) (Table S1). Third, for each of the four large mammal species we considered the RAI values of the other three large mammal species, and for each of the five medium-sized species we considered the RAI values of the other four medium-sized species. We calculated spatial variables using ArcGIS Pro version 3.0.1 [39]. The distance-based values were estimated from the location of the cameras, while the percentage of forest and scrubland cover were estimated within a buffer of 500 m radius around each camera, as in other wolf studies [40].
We included camera trap days as an offset in all models to account for variability in the sampling effort across sites. We then standardized all continuous values by subtracting their mean and dividing them by two standard deviations [41]. When variables were correlated (r > |0.5|), we included them in separate models and kept the variables that better explained the response variable. As sample sizes limit the number of model predictors, we used the rule-of-thumb of 10 outcome events per predictor to ensure the validity of statistical relationships [42], concluding a maximum of 7 predictors in our models. To do so, we used the Least Absolute Shrinkage and Selection Operator (LASSO), a regression analysis method that performs variable selection and regularization [43] with 1000 permutations, using the package ‘glmnet’ in R [44] (Figure S1). We included the variables selected by this process (variables with a lambda.min coefficient > 0; see Figure S1) in Generalized Linear Models (GLMs) with a quasi-Poisson distribution error to account for overdispersion [45]. We conducted model selection with a multi-model inference approach that compares all possible combinations of variables [46], using the ‘MuMIn’ R package [47]. We ranked models using the quasi-Akaike Information Criteria for small samples (QAICc) and made inferences on those with ΔQAICc < 2. We estimated the model-averaged coefficients (β), standard errors (SE), p-values, 95% and 90% confidence intervals (CI). We considered predictor variables to significantly and marginally significantly influence the response variable if their 95% and 90% CI did not overlap with zero, respectively.

3. Results

The dataset comprised 2698 camera days and 8659 independent detections, of which 5295 were of 14 species of wild mammals (Table 1). Wild boars were the most frequently detected large mammal (94% of sites, n = 598 detections), followed by wolves (79%, n = 168), roe deer (62%, n = 159), and brown bears (52%, n = 150). Red foxes, brown hares, and martens were the most frequently detected medium-sized species. Human disturbance was widespread (100% of sites, n = 3379 detections), with vehicles having the highest rate of detections, followed by dogs, humans, and livestock (Table 1).

3.1. Wolf Activity Pattern Overlap with Other Mammals

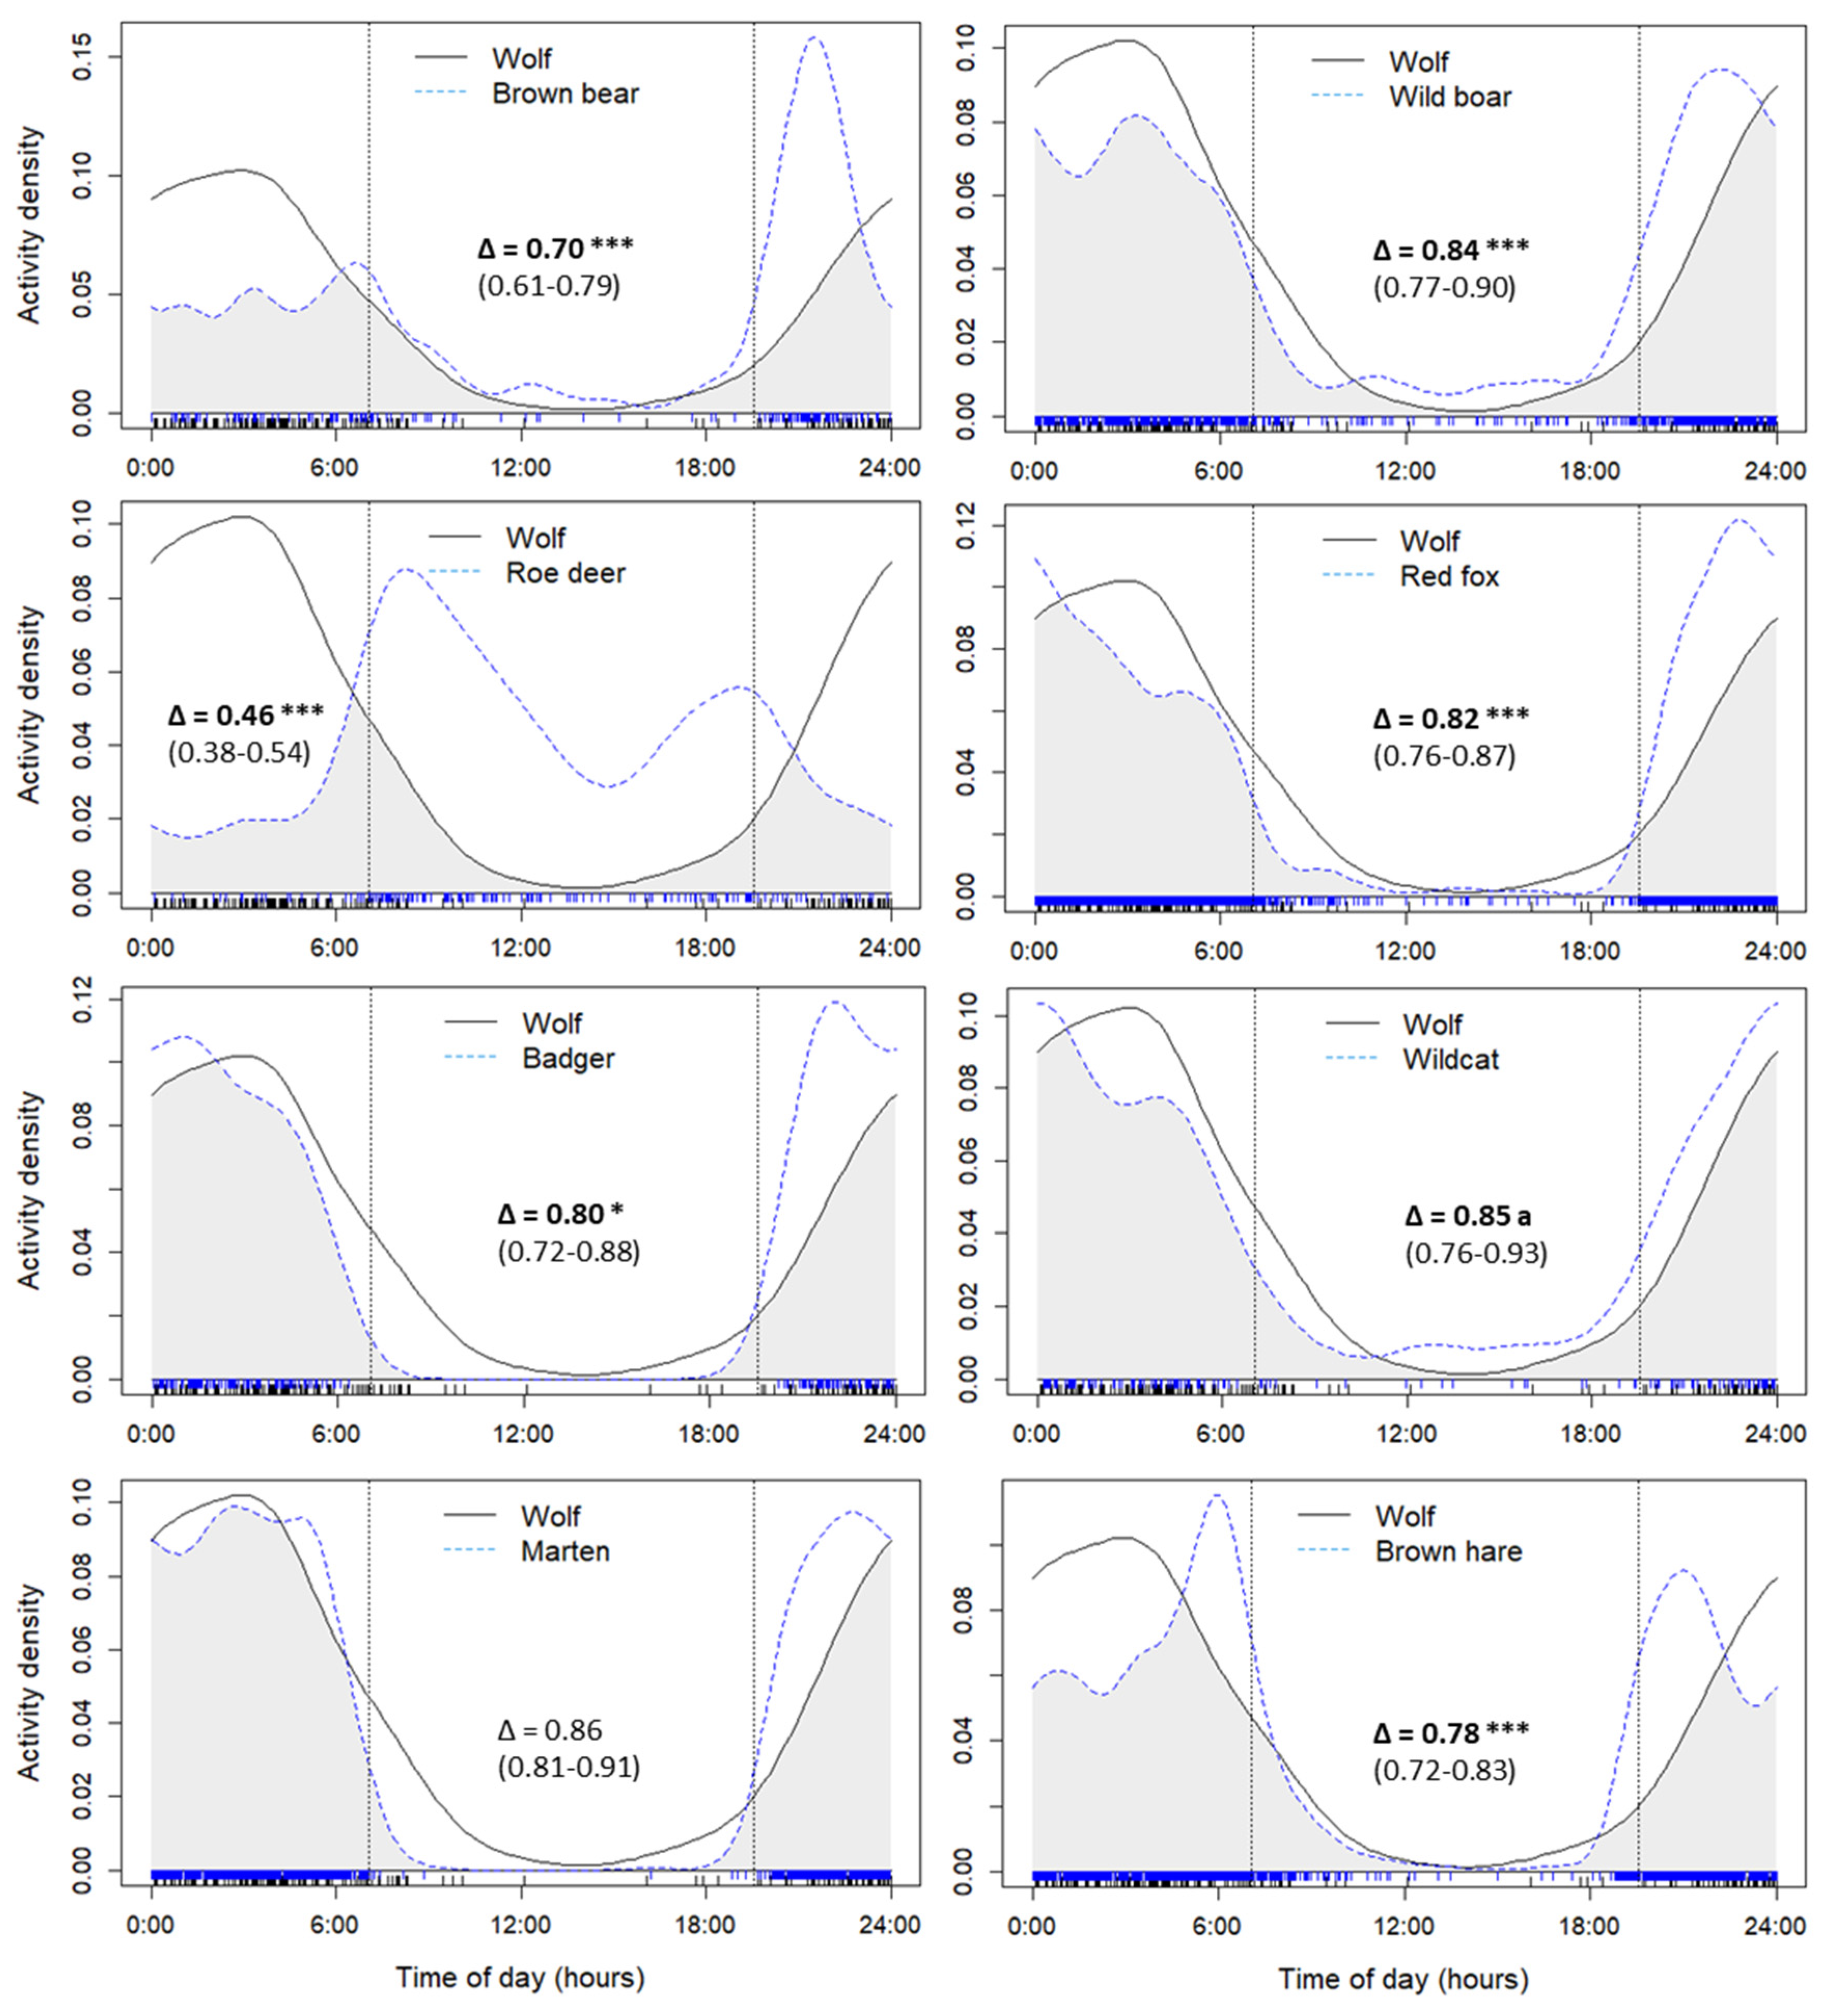
The temporal overlap of wolves with their two primary wild prey species was high for wild boars (Δ > 0.75) and low for roe deer (Δ < 0.50) (Figure 2, Table S2). Wolves showed an intermediate overlap with brown bears (Δ = 0.70) and a high overlap with medium-sized mammals (Δ > 0.75). The temporal activity of all species was significantly (p < 0.05) or marginally significantly (p < 0.10) different from that of wolves, except for martens.

3.2. Mammal Activity Patterns Overlap with Human Disturbance

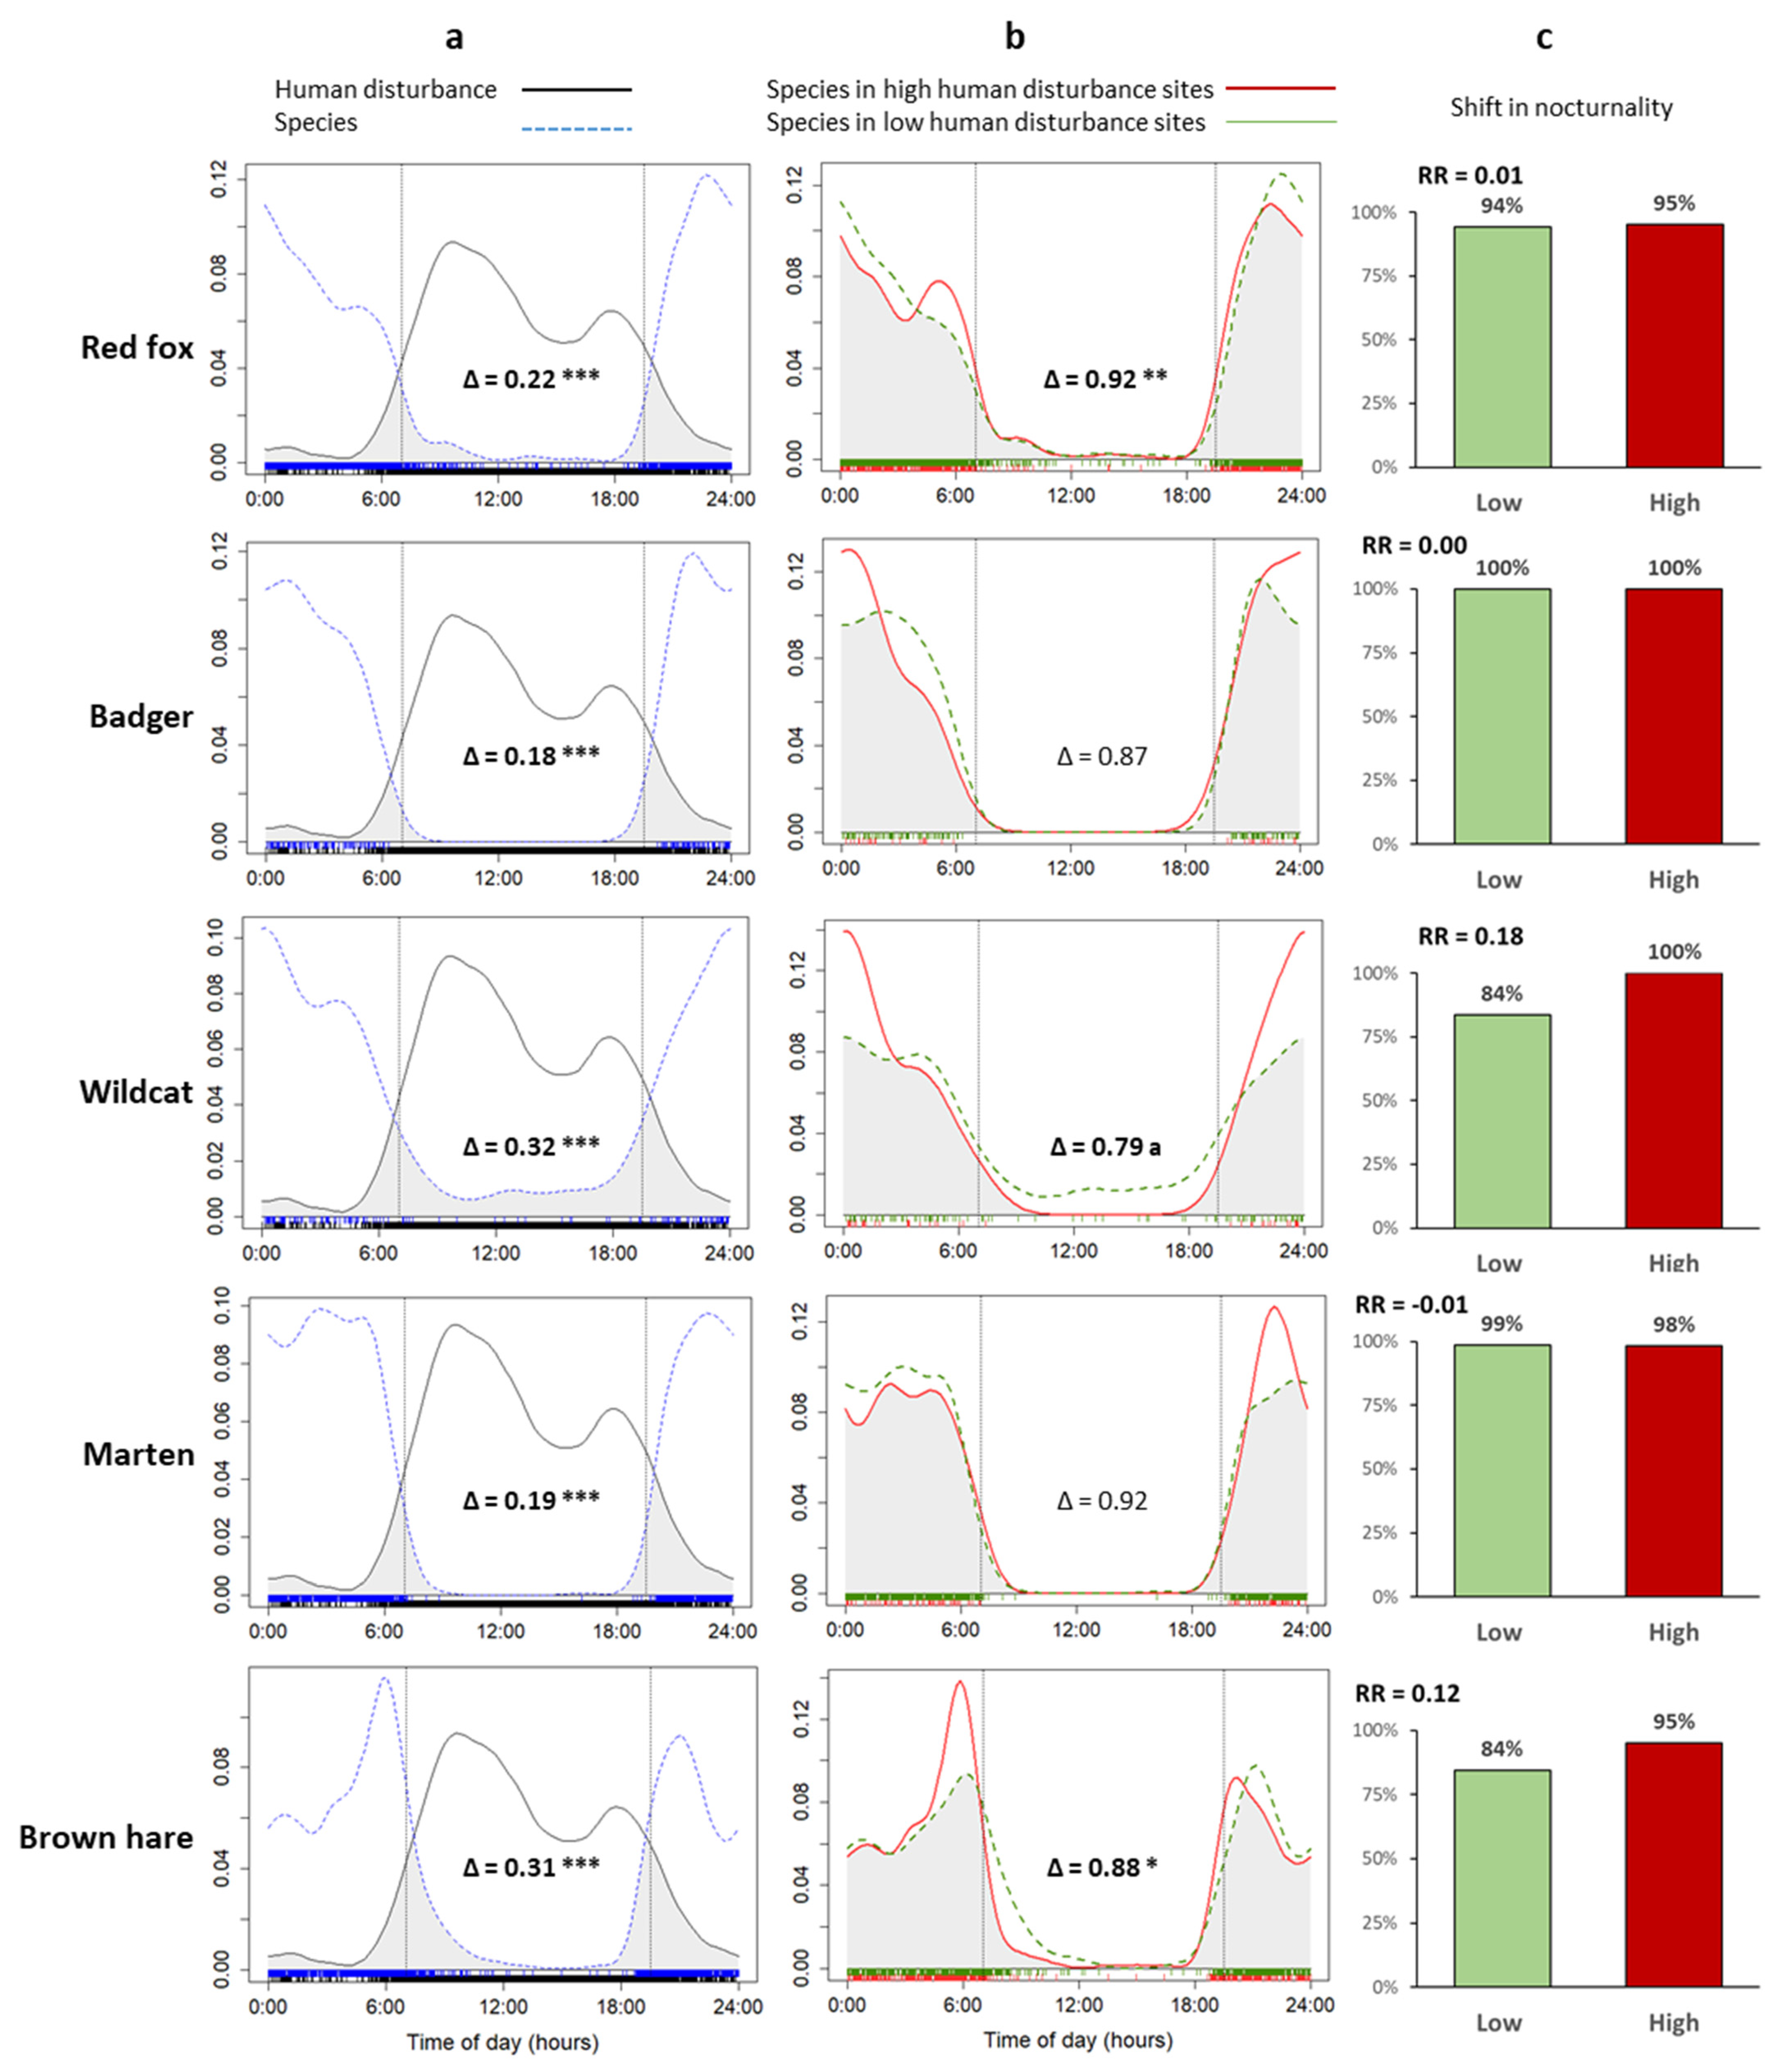
All wild mammals exhibited a relatively low temporal overlap with total human disturbance (Δ = 0.18–0.36), except for roe deer (Δ = 0.80) (Figure 3a). Human disturbance was concentrated in diurnal periods (peaks in early morning and late afternoon), whereas wild mammals were most active at night. The temporal activity patterns of all wild mammals were significantly different than the temporal patterns of human disturbance pooled across all camera sites (MWW tests; p < 0.001) (Table S3).

3.3. Mammal Nocturnality Relative to Intensity of Human Disturbance
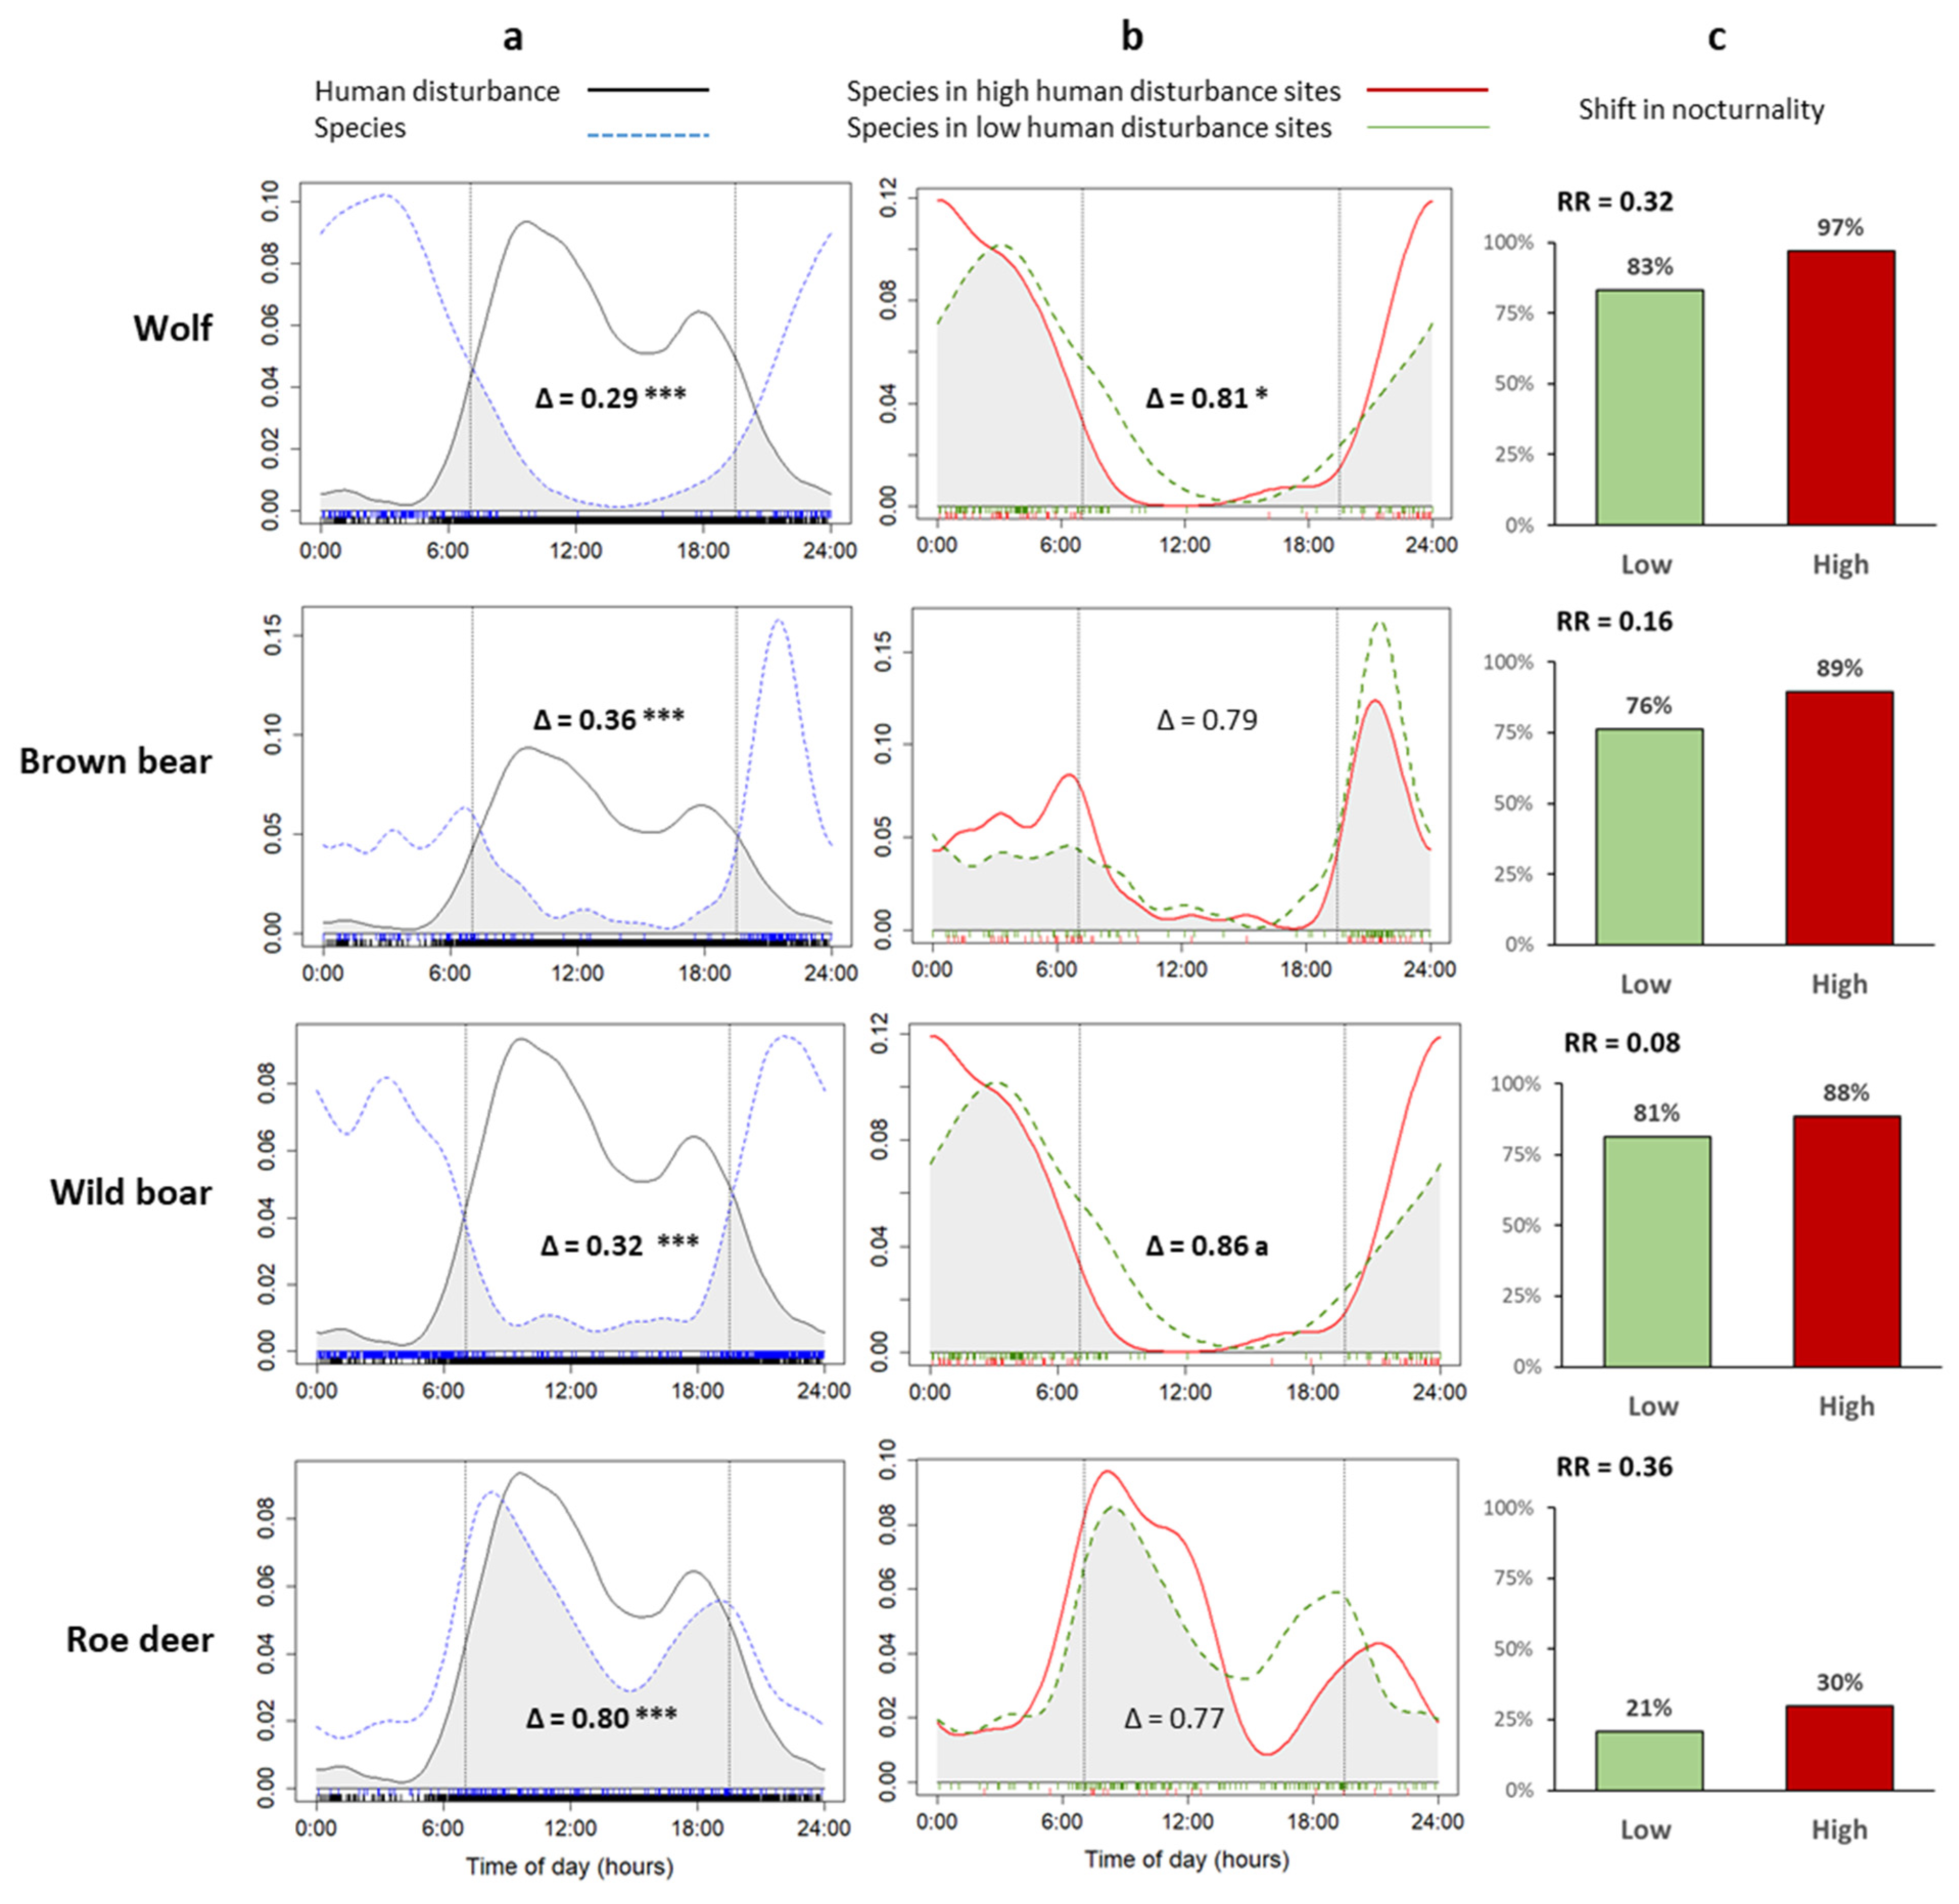
All four large mammals increased their nocturnality in response to increased human disturbance, particularly roe deer and wolves, as shown by the risk ratio index (Figure 3c, Table S4). Wolves and wild boars also exhibited different activity patterns between low and high human disturbance levels (Figure 3b). Of the five medium-sized mammals, only wildcats and brown hares increased their nocturnality in high human disturbance sites (Figure 3c). Wildcats, brown hares, and red foxes had different activity patterns between low and high human disturbance sites (Figure 3b,c).
Figure 3. (a) Overlap in temporal activity between wild mammals and human disturbance in Greece, 2019–2020. (b) Wild mammal temporal activity overlap between low and high human disturbance sites. Vertical dashed lines represent the average sunrise (07:04) and sunset (19:32) times. Significant and marginally significant differences in overlap resulting from the MWW test are shown in bold (***: p < 0.001, **: p < 0.01, *: p < 0.05, a: 0.1 < p < 0.05) (c) Nocturnality (percentage of nighttime detections) and shift of nocturnality (RR: risk ratio) between low and high human disturbance sites.
Diversity 15 00184 g003aDiversity 15 00184 g003b

3.4. Factors Influencing Spatial Variation in Detection Rates of Wild Mammals

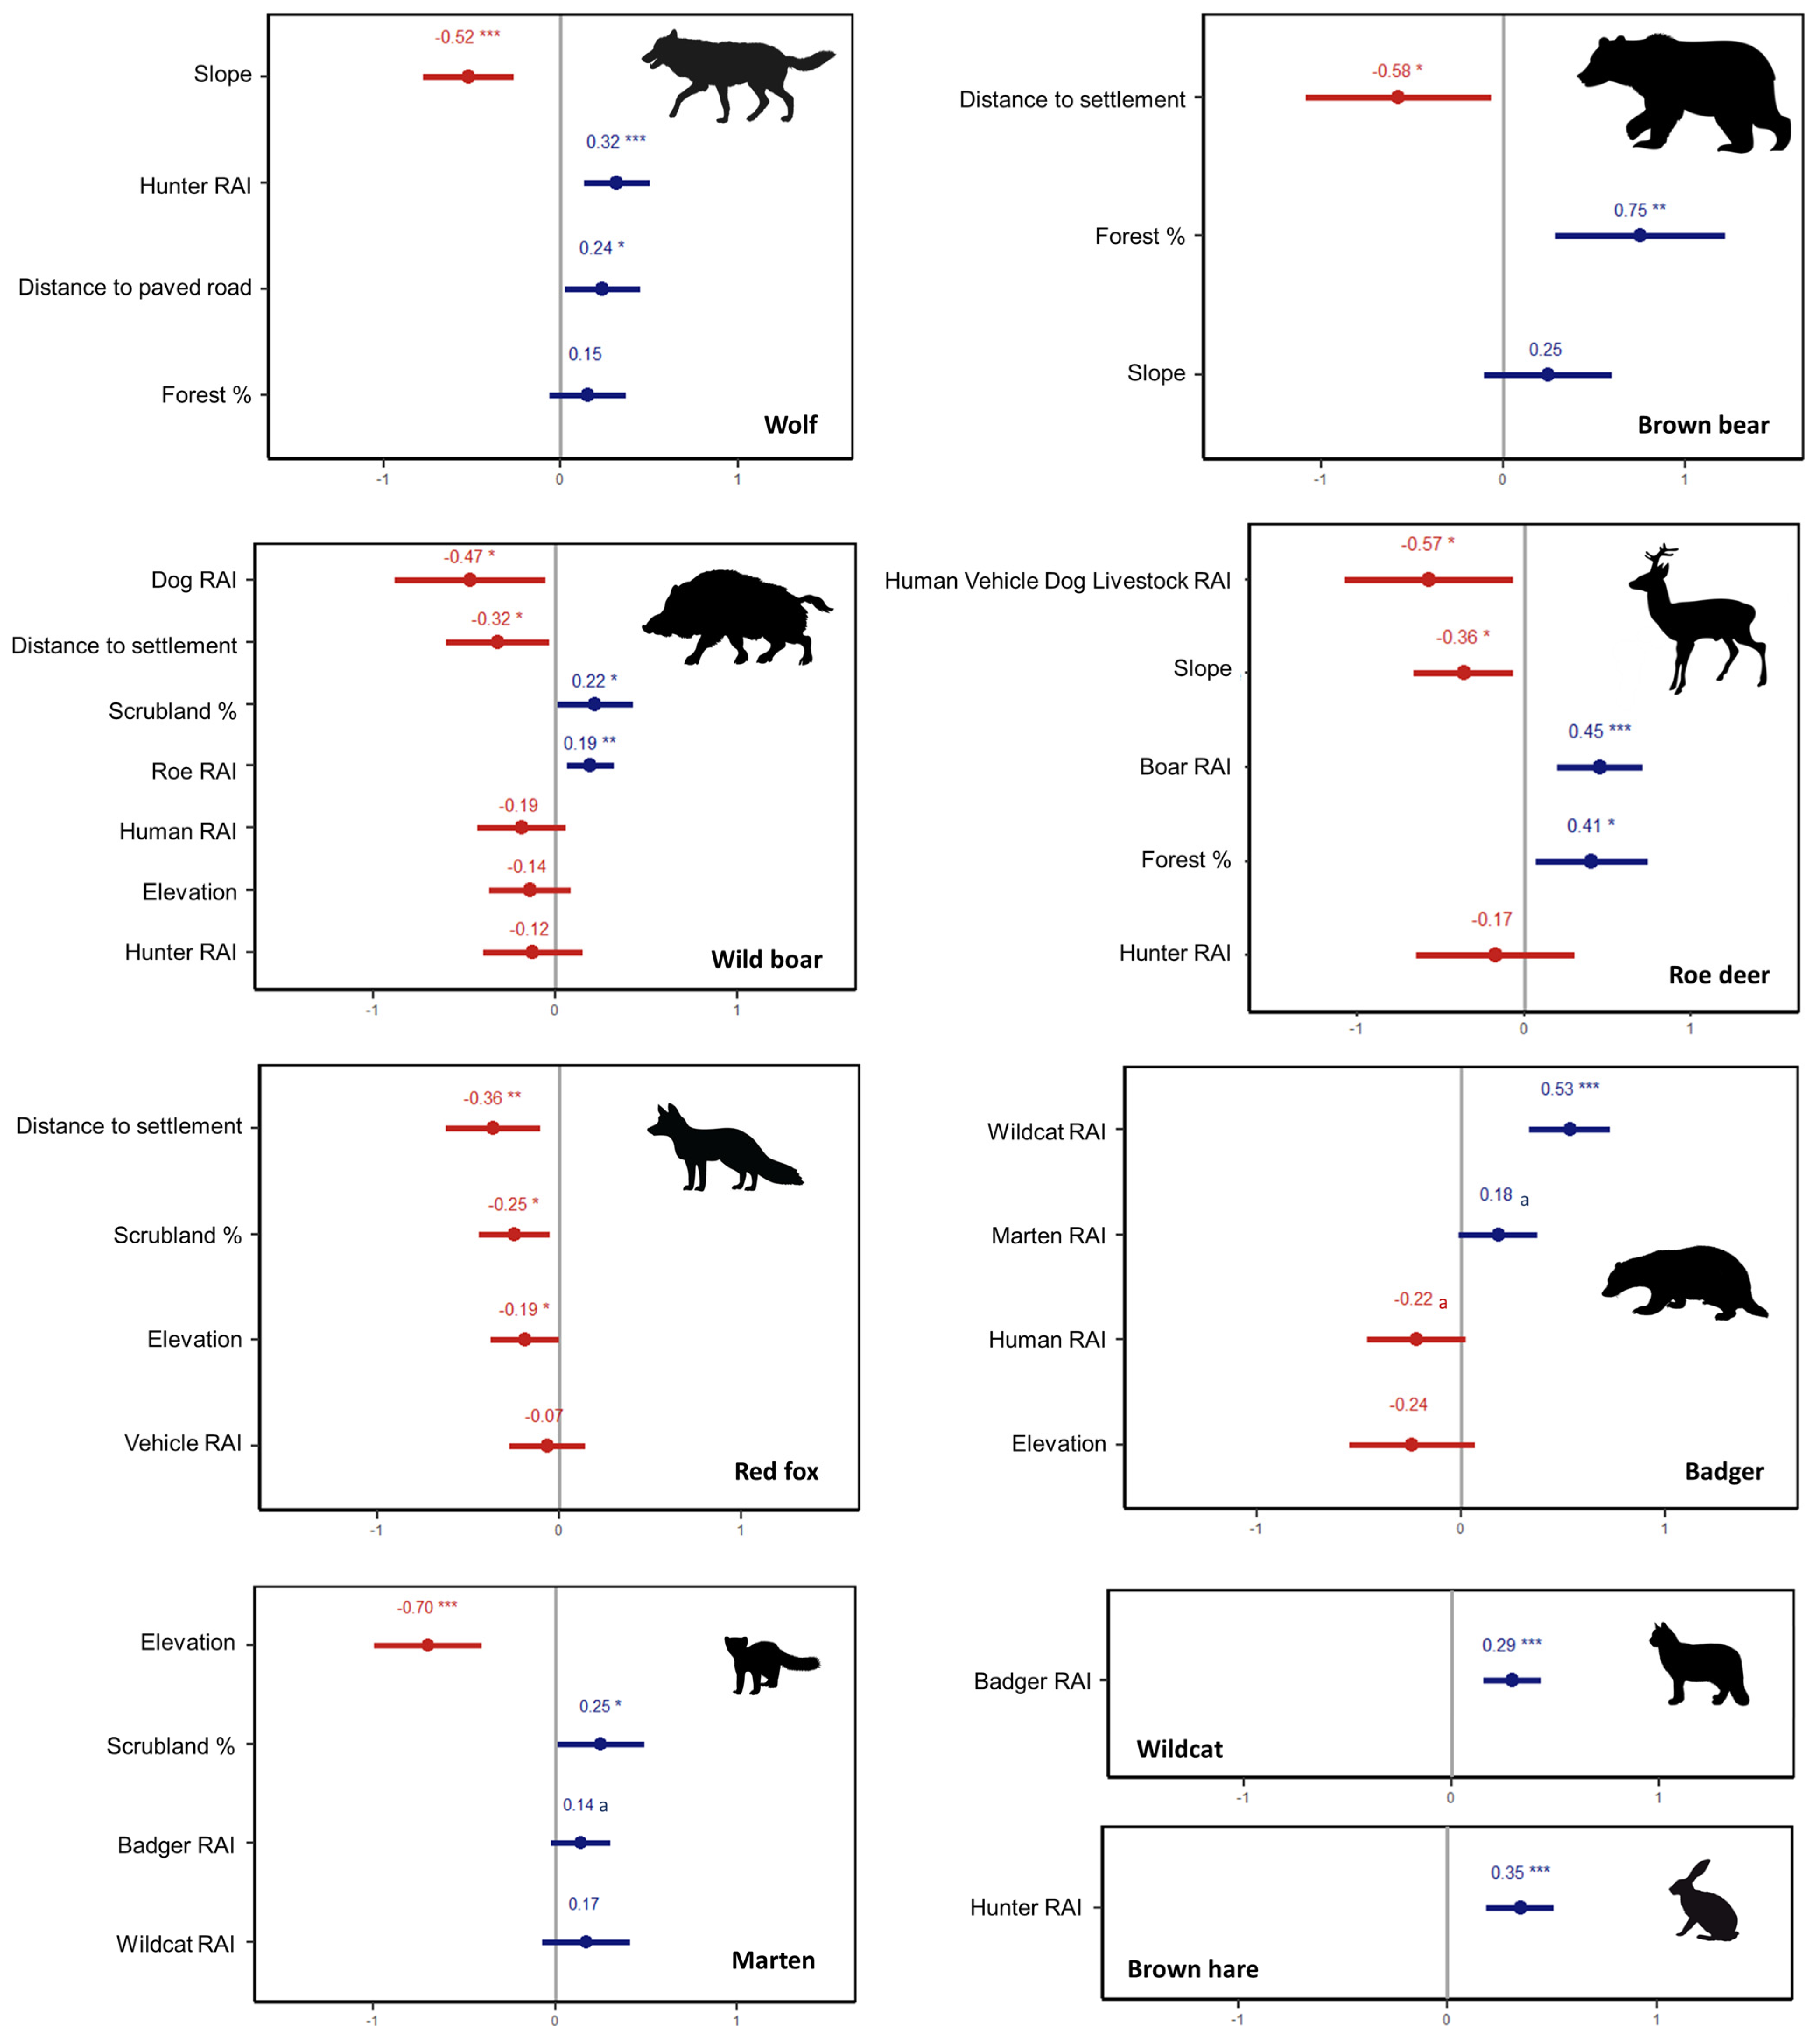
We identified a set of one to five strongly supported models per species (Table S5). Different environmental factors influenced the detection rate of different wild mammals. The detection of wolves and roe deer was positively associated with gentler slopes, whereas the detection of red foxes and martens increased at lower elevations (Figure 4, Table S6). The detection of brown bears and roe deer was positively associated with increased forest cover. The detection of wild boars and martens was positively associated with increased scrubland cover, while the detection of foxes was negatively associated with scrubland cover.
The influence of anthropogenic variables varied across species. The detection of wolves was negatively influenced by paved roads and positively influenced by the abundance of hunters (Figure 4, Table S6). Roe deer detection was negatively influenced by total human disturbance (combined RAI of human, vehicle, dog, and livestock). The detection of brown bears, wild boars, and red foxes was higher near settlements. Wild boar detection was negatively associated with an abundance of dogs. Badgers were marginally negatively associated with an abundance of humans, while brown hares were positively associated with hunters. The detection rates of the following pairs of species were positively associated: wild boars with roe deer from the large mammals, as well as badgers with wildcats, and badgers with martens from the medium-sized mammals (Figure 4, Table S6).

4. Discussion

4.1. Temporal Overlap between the Wolf, and Sympatric Predators and Prey

We found a high temporal overlap between wolves and wild boars, which is consistent with other studies in the Mediterranean [5,6,34]. Wild boars represent the most important wild prey for wolves in Europe [48], where populations of wild boar are increasing [49]. Wolves exhibited a lower overlap with roe deer, the second most important wild prey of wolves in Europe [48]. Previous work has shown that wolves may exhibit a lower temporal overlap with roe deer [6], but that overlap is greater where wolves are more diurnal [34]. The use of the diel cycle greatly influences encounter rates between wolves and their main prey. The low temporal overlap we documented between wolves and roe deer might demonstrate an anti-predator strategy of the roe deer, trying to avoid wolves. For example, roe deer became more diurnal as a response to the presence of lynx [13]. Roe deer were detected at fewer cameras than wild boars (62% of them versus 94% for the wild boar) and with an overall lower RAI (6.04 for roe deer and 22.52 for wild boars). Roe deer in Greece display low densities and fragmented distribution, and they are currently mostly present in mountainous forested areas with low human disturbance, after suffering significant population declines and local population extinctions due to intense hunting and deforestation in the past [50]. Following their protection in the 1960s, there are indications of local population increases, especially during the last few decades; however, scientific data on population trends are largely lacking. Roe deer may not yet be common prey for wolves in our study area, meaning that wolves may not have adapted their temporal activity to that of roe deer. Conversely, wolves and wild boars showed very similar nocturnal patterns, suggesting that wolves likely maximized the probability of encounters with wild boars. Further studies are needed, including population estimation and a wolf diet analysis, to better understand the relationship between wolves and wild ungulates in the study area.
Brown hares are important prey for wolves in some areas [51], although hares represent only a minor proportion (<1%) of the diet of wolves in Greece [52], as in other Mediterranean areas [53]. Our results indicated a high temporal overlap between wolves and brown hares (Δ = 0.78), which is consistent with a study in central Italy (Δ = 0.88) [34]. Medium-sized carnivores are occasional prey for wolves [54], although only foxes and badgers have been detected (in very small amounts, <1%) in the diet of wolves in Greece [52]. We found a high temporal overlap between wolves and the four species of mesocarnivores we considered, similar to research in Italy [7,34]. Finally, we found a medium (Δ = 0.70) temporal overlap between wolves and brown bears. Future studies will be needed to fully evaluate the potential interactions, including competition [55], between wolves and brown bears, the two largest predators in Greece.

4.2. Temporal Anthropogenic Avoidance Patterns

Wolves in our study area were mainly nocturnal, whereas humans were mainly diurnal, as reported elsewhere, allowing wolves to visit and travel in areas intensively used by humans [56,57]. This behavior may have evolved after centuries of human persecution. Wolves adjust their behavior to reduce the risk of being killed by humans: wolves increased their night activity following a four-year predator control program in Alberta, AB Canada [58]. Higher wolf activity at night can also be explained by high day temperatures, especially in southern areas [59], and during the summer [57].
We also documented pronounced nocturnal activity by wild boars, as in other Mediterranean areas, which is probably a behavioral adaptation caused by long-term hunting and harassment by humans, also influenced by a strategy to reduce energetic costs and achieve an optimal thermal balance [4]. Roe deer, on the other hand, exhibited crepuscular activity peaks in our study, similarly to other areas, which can be explained by strong physiological and/or behavioral constraints stimulating the maintenance of crepuscular activity, regardless of the risk context [13]. Brown bears exhibited primarily nocturnal behavior in our study, similar to other European populations, which is likely an effect of human disturbance [16,60]. We documented predominantly nocturnal activity and high temporal segregation with human activity by medium-sized mammals. Nocturnal patterns of Mediterranean mesocarnivores have also been reported elsewhere and are possibly related to physical/physiological adaptations, ambient temperature, prey activity, and human presence [33,61].
We found a high, broad temporal overlap of roe deer and human disturbance estimated by the coefficient of overlapping. Despite the substantial overlap, we still detected a significant difference between the activity patterns of roe deer and human disturbance. This difference may be explained by subtle differences in activity peaks, with roe deer being most active somewhat earlier in the morning and later in the evening than the peaks of human disturbance. Moreover, the activity of roe deer was higher during the night than human disturbance.

4.3. Nocturnality Shift vs. Human Disturbance

As humans shape new timescapes on Earth, altering the temporal patterns of many wild taxa [62], it is important to identify those species that are most affected. Our findings contribute further evidence to the global trend of increased wildlife nocturnality in human-occupied areas [2] and highlight that large mammals generally exhibit higher nocturnality shifts than medium-sized mammals. This can likely be attributed to the greater risk that large mammals face from human persecution and because they require large spaces, resulting in more frequent contact with humans [2].
We recorded a substantial increase in nocturnality between areas of low and high human disturbance in all four of the large mammal species we studied. Roe deer were the most diurnal species and overlapped most with human disturbance, which likely explains their strong increase in nocturnality shift relative to high human disturbance (RR = 0.36). Wolves also increased nocturnality, which is likely a response to persecution by humans (RR = 0.32). Brown bears (RR = 0.16) and wild boars (RR = 0.08) exhibited smaller temporal shifts to nocturnality. Our findings corroborated the patterns of nocturnality shift reported in other parts of the world for roe deer [13,16], wolves [58,63], brown bears [16,60], and wild boars [15,64]. Regarding the smaller species, only wildcats (RR = 0.18) and brown hares (RR = 0.12) exhibited a nocturnality shift, which is consistent with research on brown hares in Italy [16]. Wildcats are mainly nocturnal in Mediterranean areas [33,61] where they tend to avoid humans and livestock [65]. In our study area, red foxes, badgers, and martens, which were predominantly nocturnal (Figure 3), did not show any nocturnality shift from low to high disturbance levels (−0.01 < RR < 0.01). Our findings are in line with a similar study in Italy with respect to badgers and foxes, but not for the marten, as they exhibited a nocturnality shift in Italy (RR = 0.17) [16] but not in Greece.
The six species showing a nocturnality shift on the basis of the RR index in our study did not all show a corresponding shift in their overall temporal activity patterns, on the basis of MWW tests (roe deer and brown bear: non-significant tests). This may be attributed to the different methodological approach, as MWW tests consider the exact time of day, whereas the RR index considers time relative to sunrise and sunset. A larger sample size of species detections would also allow us to define low and high human disturbance levels more precisely (e.g., top and lowest quartiles). Regardless, our findings provided a first indication of the temporal behavioral responses of wild mammals to human disturbance in Greece.

4.4. Factors Affecting Spatial Detection Patterns of Wild Mammals

Our results showed that the detection of wolves and roe deer was positively associated with gentler slopes, which could reflect movement strategies to maximize energy efficiency [66,67]. Both brown bear and roe deer detection was greater in areas with higher proportions of forest cover, which is consistent with previous work showing that forests are an important habitat for both species [68,69]. Wild boar detection increased at sites with a greater proportion of scrubland, as this is a typical habitat for the species, providing food resources and shelter [70].
According to our findings, anthropogenic factors had variable impacts across species of wild mammals, with all large mammals being affected. Although we detected wolves on forest roads, they appeared to avoid paved roads, as detection increased farther from these areas. Wolves generally avoid main roads, where the risk of encounters with humans is high, while they often use forest roads for traveling, but with a preference towards the night hours to avoid human disturbance [67,71]. We also found that the detection of wolves was positively related to an increased activity of hunters, which might reflect that both wolves and hunters exploit wild ungulates.
Roe deer was the most sensitive species to human disturbance with respect to all human presence, vehicles, dogs, and livestock presence. Roe deer are sensitive to a range of human pressures and often avoid hunters, roads, houses, agricultural land, plantations, livestock, and recreational activities [68,72,73,74]. Conversely, wild boars were more active near human settlements, probably while searching for food resources [70], but they were particularly sensitive to the presence of dogs. Dogs are known to severely impact wildlife in various ways, such as direct predation, behaviorally mediated risk effects, harassment, and extending the human footprint deeper into wildlands than humans [75,76]. Brown bears did not seem to be negatively affected by anthropogenic features, showing increased activity closer to human settlements, where they may exploit food resources near agricultural fields and fruit trees [77].
In general, we did not find pronounced associations between the detection of medium-sized mammals and anthropogenic factors, apart from badgers, whose detection seemed to be negatively affected by human presence, and foxes, which were detected more near settlements, potentially to exploit anthropogenic food resources [78]. Brown hares also co-occurred with hunters, as it is a popular game species in the study area.

5. Implications for Wolf Conservation

The wolf is an adaptable species exploiting food and shelter resources across heterogeneous landscapes, and even co-occurring with hunters in our study area. Wolves have adopted a strategy of avoiding humans in space and time in response to increased disturbance on contemporary landscapes shared with humans [67,71]. This was reflected by the shift to increased nocturnal activity and the avoidance of paved roads in our study area in Greece.
Although the diet of wolves has not been investigated in the study area, our findings suggest that wild boars are likely an important food resource. Wolves and wild boars exhibited temporal overlap, as both were most active during nocturnal periods. Moreover, wild boars seemed to be abundant in our study area and may contribute to the prey base for wolves, as indicated by frequent detections by our camera traps, with the species reportedly increasing in Europe [49]. Conversely, the other potential large ungulate prey for wolves, roe deer may be less abundant in our study area given that their detections were approximately one-fourth that of wild boars. Indeed, roe deer populations in Greece are among the most vulnerable in Europe, currently legally protected by national legislation [50]. Roe deer appeared to adopt a spatial, rather than temporal, avoidance strategy in response to human disturbance. Therefore, it would be difficult for wolves to use roe deer as prey, given that they were more diurnal and less active at night when wolf activity peaked. Additionally, the spatial pattern of roe deer detections suggested that they avoid all types of human activity. Balkan chamois is likely not an important prey species for wolves in the study area because of its very low population size and different habitat preferences [3].
Wolves require rich and diverse ungulate populations as a prey-base to reduce predation on livestock and subsequent wolf–human conflicts [79]. Increased roe deer availability for wolves can significantly decrease livestock consumption, as it acts as a second potential prey species in Mediterranean landscapes, in addition to wild boar [80]. We suggest that human disturbance could indirectly increase wolf–livestock conflict, since it was found to increase wolf nocturnality and, consequently, reduce opportunities for wolves to prey on roe deer during the day, while spatially restricting roe deer availability. Although wild boars were not a particularly sensitive species to human disturbance, we argue that reducing human disturbance to wildlife in the study area would be beneficial for both ungulate and carnivore populations, and contribute to wolf–livestock conflict mitigation. Our proposal is in line with the new European Biodiversity Strategy [81], which calls for expanding the network of protected areas to cover 30% of each Member State’s land, and for designating one-third of the protected areas as strictly protected zones (target: 10% of the EU land to be strictly protected). The compliance of the Greek state with the new European Biodiversity Strategy by designating one-third of the Natura 2000 network as strictly protected zones of minimum human disturbance will protect 15% of our study area and would be beneficial for wildlife. According to the relevant European guideline [81], strictly protected areas should be “non-intervention areas”, where no active management should be allowed but to sustain natural processes, and hunting should be banned, except for ungulate population control when natural predators are insufficient [82]. The implementation of the provisions of the EU 2030 Biodiversity strategy in the study area would be an efficient tool to reduce human disturbance and could increase ungulate populations, enhance wild prey resources for wolves and, hence, reduce livestock depredation. Furthermore, limiting the construction of new roads and access to existing roads in ecologically sensitive areas [83], including the breeding sites of wolves [84], would reduce overall human disturbance and benefit wildlife in the broader study area. Research approaches, such as the utilization of camera trap surveys, to understand and monitor human–wildlife interactions, can improve and guide future conservation efforts and management interventions in a world with increasing human activity and infrastructure.

Supplementary Materials

The following supporting information can be downloaded at: https://www.mdpi.com/article/10.3390/d15020184/s1. Table S1: Name, description, and source of predictor variables used in regression models. Table S2: Coefficient of overlap (∆4), confidence intervals (95% CI), and Mardia–Watson–Wheeler test (MWW) of diel activity data between wolves and other wild mammals. Table S3: Coefficient of overlap (∆4/Δ1), confidence intervals (95% CI), and Mardia–Watson–Wheeler test (MWW) of diel activity data between (a) wild mammals and human disturbance, and (b) wild mammals in high versus low human disturbance sites. Table S4: Number (N) and percentage of detections for each period in the diel cycle: day and night. Results are presented for all sites in total, and separately for the high and low human disturbance sites. Figure S1: Results of LASSO regression models with 1000 permutations. Table S5: Most highly supported models (ΔQAIC < 2) relating species detection rates to predictor variables. Table S6: Summary of model-averaged coefficients from GLM models relating species detection rates to predictor variables.

Author Contributions

Conceptualization, M.P. and V.K.; methodology, M.P. and V.K.; validation, V.K., J.F.B. and O.G.; formal analysis, M.P.; investigation, M.P.; writing—original draft preparation, M.P. and V.K.; writing—review and editing, V.K., J.F.B., and O.G.; visualization, M.P.; supervision, V.K.; funding acquisition, M.P. and V.K. All authors have read and agreed to the published version of the manuscript.

Funding

This research is co-financed by Greece and the European Union (European Social Fund—ESF) through the Operational Programme “Human Resources Development, Education and Lifelong Learning” in the context of the project “Strengthening Human Resources Research Potential via Doctorate Research” (MIS-5000432), implemented by the State Scholarships Foundation (IKY).Camera trapping was partially funded by Pindos Perivallontiki NGO (Project AOOS).

Institutional Review Board Statement

All research was conducted under the appropriate annual research permits issued by the Department of Forest Management of the Directorate General of Forests, and the Forest Environment of the Ministry of Environment and Energy of Greece [Protocol codes/dates: 36097/927/10.07.2020, 59655/252/05.07.2019].

Informed Consent Statement

Not applicable.

Data Availability Statement

Not applicable.

Acknowledgments

We are grateful to Pindos Perivallontiki NGO for allowing the use of equipment; to P. Papantzima for assistance; and to several students of the BAT Department for field assistance. We warmly thank Y. Iliopoulos, Y. Mertzanis, and H. Papaioannou for their support and advice.

Conflicts of Interest

The authors declare no conflict of interest.

References

  1. Rovero, F.; Zimmermann, F. Camera Trapping for Wildlife Research; Pelagic Publishing Ltd.: London, UK, 2016. [Google Scholar]
  2. Gaynor, K.M.; Hojnowski, C.E.; Carter, N.H.; Brashares, J.S. The influence of human disturbance on wildlife nocturnality. Science 2018, 360, 1232–1235. [Google Scholar] [CrossRef] [PubMed] [Green Version]
  3. Kati, V.; Kassara, C.; Vassilakis, D.; Papaioannou, H. Balkan Chamois (Rupicapra rupicapra balcanica) Avoids Roads, Settlements, and Hunting Grounds: An Ecological Overview from Timfi Mountain, Greece. Diversity 2020, 12, 124. [Google Scholar] [CrossRef] [Green Version]
  4. Brivio, F.; Grignolio, S.; Brogi, R.; Benazzi, M.; Bertolucci, C.; Apollonio, M. An analysis of intrinsic and extrinsic factors affecting the activity of a nocturnal species: The wild boar. Mamm. Biol. 2017, 84, 73–81. [Google Scholar] [CrossRef]
  5. Torretta, E.; Serafini, M.; Imbert, C.; Milanesi, P.; Meriggi, A. Wolves and wild ungulates in the Ligurian Alps (Western Italy): Prey selection and spatial-temporal interactions. Mammalia 2017, 81, 537–551. [Google Scholar] [CrossRef]
  6. Rossa, M.; Lovari, S.; Ferretti, F. Spatiotemporal patterns of wolf, mesocarnivores and prey in a Mediterranean area. Behav. Ecol. Sociobiol. 2021, 75, 32. [Google Scholar] [CrossRef]
  7. Torretta, E.; Serafini, M.; Puopolo, F.; Schenone, L. Spatial and temporal adjustments allowing the coexistence among carnivores in Liguria (N-W Italy). Acta Ethol. 2016, 19, 123–132. [Google Scholar] [CrossRef]
  8. Theobald, D.M.; Kennedy, C.; Chen, B.; Oakleaf, J.; Baruch-Mordo, S.; Kiesecker, J. Earth transformed: Detailed mapping of global human modification from 1990 to 2017. Earth Syst. Sci. Data 2020, 12, 1953–1972. [Google Scholar] [CrossRef]
  9. Meijer, J.R.; Huijbregts, M.A.J.; Schotten, K.C.G.J.; Schipper, A.M. Global patterns of current and future road infrastructure. Environ. Res. Lett. 2018, 13, 64006. [Google Scholar] [CrossRef] [Green Version]
  10. Wolf, C.; Ripple, W.J. Range contractions of the world’s large carnivores. R. Soc. Open Sci. 2017, 4, 170052. [Google Scholar] [CrossRef] [Green Version]
  11. UNEP (United Nations Environment Programme). Kunming-Montreal Global Biodiversity Framework; Convention on Biological Diversity, CBD/COP/15/L.25; United Nations: New York, NY, USA, 2022. [Google Scholar]
  12. Clinchy, M.; Zanette, L.Y.; Roberts, D.; Suraci, J.P.; Buesching, C.D.; Newman, C.; Macdonald, D.W. Fear of the human “super predator” far exceeds the fear of large carnivores in a model mesocarnivore. Behav. Ecol. 2016, 27, 1826–1832. [Google Scholar] [CrossRef]
  13. Bonnot, N.C.; Couriot, O.; Berger, A.; Cagnacci, F.; Ciuti, S.; De Groeve, J.E.; Gehr, B.; Heurich, M.; Kjellander, P.; Kröschel, M.; et al. Fear of the dark? Contrasting impacts of humans versus lynx on diel activity of roe deer across Europe. J. Anim. Ecol. 2020, 89, 132–145. [Google Scholar] [CrossRef] [PubMed]
  14. Ciuti, S.; Northrup, J.M.; Muhly, T.B.; Simi, S.; Musiani, M.; Pitt, J.A.; Boyce, M.S. Effects of Humans on Behaviour of Wildlife Exceed Those of Natural Predators in a Landscape of Fear. PLoS ONE 2012, 7, e50611. [Google Scholar] [CrossRef] [PubMed]
  15. Cremonesi, G.; Bisi, F.; Gaffi, L.; Zaw, T.; Naing, H.; Moe, K.; Aung, Z.; Gagliardi, A.; Wauters, L.A.; Preatoni, D.G.; et al. Evaluation of Human Disturbance on the Activity of Medium–Large Mammals in Myanmar Tropical Forests. Forests 2021, 12, 290. [Google Scholar] [CrossRef]
  16. Oberosler, V.; Groff, C.; Iemma, A.; Pedrini, P.; Rovero, F. The influence of human disturbance on occupancy and activity patterns of mammals in the Italian Alps from systematic camera trapping. Mamm. Biol. 2017, 87, 50–61. [Google Scholar] [CrossRef]
  17. Ordiz, A.; Aronsson, M.; Persson, J.; Støen, O.-G.; Swenson, J.E.; Kindberg, J. Effects of Human Disturbance on Terrestrial Apex Predators. Diversity 2021, 13, 68. [Google Scholar] [CrossRef]
  18. Naidoo, R.; Burton, A.C. Relative effects of recreational activities on a temperate terrestrial wildlife assemblage. Conserv. Sci. Pract. 2020, 2, e271. [Google Scholar] [CrossRef]
  19. De Matos Dias, D.; de Campos, C.B.; Guimarães Rodrigues, F.H. Behavioural ecology in a predator-prey system. Mamm. Biol. 2018, 92, 30–36. [Google Scholar] [CrossRef]
  20. Theuerkauf, J.; Jȩdrzejewski, W.; Schmidt, K.; Okarma, H.; Ruczyński, I.; Śniezko, S.; Gula, R. Daily Patterns and Duration of Wolf Activity in the Białowieza Forest, Poland. J. Mammal. 2003, 84, 243–253. [Google Scholar] [CrossRef]
  21. Chapron, G.; Kaczensky, P.; Linnell, J.D.C.; von Arx, M.; Huber, D.; Andrén, H.; López-Bao, J.V.; Adamec, M.; Álvares, F.; Anders, O.; et al. Recovery of large carnivores in Europe’s modern human-dominated landscapes. Science 2014, 346, 1517–1519. [Google Scholar] [CrossRef] [Green Version]
  22. Iliopoulos, Y.; Petridou, M.; Astaras, C.; Sideri, E. Total deliverables for wolf monitoring. In Monitoring and Assessment of the Conservation Status of Species of Mammals of Community Interest in Greece; Prepared for the Hellenic Ministry of Environment; Papamichail, C., Arapis, T., Petkidis, K., Eds.; Ministry of the Environment and Energy: Athens, Greece, 2015. [Google Scholar]
  23. Linnell, J.D.; Cretois, B. Research for AGRI Committee—The Revival of Wolves and Other Large Predators and Its Impact on Farmers and Their Livelihood in Rural Regions of Europe; European Parliament: Strasbourg, France, 2018. [Google Scholar]
  24. CLC. Corine Land Cover. 2018. Available online: https://land.copernicus.eu/pan-european/corine-land-cover/clc2018 (accessed on 20 February 2022).
  25. ELSTAT (Hellenic Statistical Authority). Population Census Data. 2011. Available online: https://www.statistics.gr/el/statistics/pop (accessed on 15 October 2022).
  26. ELGA (Hellenic Agricultural Insurance Organization). Data on Single Livestock Breeding Declarations; ELGA: Athens, Greece, 2018. [Google Scholar]
  27. EEA. European Environment Agency Reference Grid. 2013. Available online: https://www.eea.europa.eu/data-and-maps/data/eea-reference-grids-2 (accessed on 20 February 2019).
  28. Beirne, C.; The Wildlife Coexistence Lab; UBC; WildCam Network. An Introduction to Camera Trap Data Management and Analysis in R. Online Book. 2022. Available online: https://bookdown.org/c_w_beirne/wildCo-Data-Analysis/ (accessed on 5 August 2022).
  29. Linkie, M.; Ridout, M.S. Assessing tiger–prey interactions in Sumatran rainforests. J. Zool. 2011, 284, 224–229. [Google Scholar] [CrossRef]
  30. O’Brien, T.G.; Kinnaird, M.F.; Wibisono, H.T. Crouching tigers, hidden prey: Sumatran tiger and prey populations in a tropical forest landscape. Anim. Conserv. 2003, 6, 131–139. [Google Scholar] [CrossRef] [Green Version]
  31. Meredith, M.; Ridout, M. R Package “Overlap”: Estimates of Coefficient of Overlapping for Animal Activity Patterns. 2022. Available online: https://cran.r-project.org/web/packages/overlap/overlap.pdf (accessed on 5 August 2022).
  32. Ridout, M.S.; Linkie, M. Estimating overlap of daily activity patterns from camera trap data. J. Agric. Biol. Environ. Stat. 2009, 14, 322–337. [Google Scholar] [CrossRef]
  33. Monterroso, P.; Alves, P.C.; Ferreras, P. Plasticity in circadian activity patterns of mesocarnivores in Southwestern Europe: Implications for species coexistence. Behav. Ecol. Sociobiol. 2014, 68, 1403–1417. [Google Scholar] [CrossRef] [Green Version]
  34. Mori, E.; Bagnato, S.; Serroni, P.; Sangiuliano, A.; Rotondaro, F.; Marchianò, V.; Cascini, V.; Poerio, L.; Ferretti, F. Spatiotemporal mechanisms of coexistence in an European mammal community in a protected area of southern Italy. J. Zool. 2020, 310, 232–245. [Google Scholar] [CrossRef]
  35. Agostinelli, C.; Lund, U. R Package ‘Circular’: Circular Statistics (Version 0.4-95). 2022. Available online: https://r-forge.r-project.org/projects/circular/ (accessed on 25 August 2022).
  36. Aurich-Rodriguez, F.; Piana, R.P.; Appleton, R.D.; Burton, A.C. Threatened Andean bears are negatively affected by human disturbance and free-ranging cattle in a protected area in northwest Peru. Mamm. Biol. 2022, 102, 177–187. [Google Scholar] [CrossRef]
  37. Lovell, C.; Li, S.; Turner, J.; Carbone, C. The effect of habitat and human disturbance on the spatiotemporal activity of two urban carnivores: The results of an intensive camera trap study. Ecol. Evol. 2022, 12, e8746. [Google Scholar] [CrossRef] [PubMed]
  38. Sollmann, R. A gentle introduction to camera-trap data analysis. Afr. J. Ecol. 2018, 56, 740–749. [Google Scholar] [CrossRef] [Green Version]
  39. ESRI. ArcGIS Pro; Release 3.0.1; Environmental Systems Research Institute: Redlands, CA, USA, 2022. [Google Scholar]
  40. Rehman, E.U.; Din, J.U.; Ahmad, S.; Hameed, S.; Shah, K.A.; Mehmood, T.; Nawaz, M.A. Insight into occupancy determinants and conflict dynamics of grey wolf (Canis lupus) in the dry temperate zone of Hindukush Range. Glob. Ecol. Conserv. 2021, 25, e01402. [Google Scholar] [CrossRef]
  41. Gelman, A. Scaling regression inputs by dividing by two standard deviations. Stat. Med. 2008, 27, 2865–2873. [Google Scholar] [CrossRef]
  42. Peduzzi, P.; Concato, J.; Kemper, E.; Holford, T.R.; Feinstein, A.R. A simulation study of the number of events per variable in logistic regression analysis. J. Clin. Epidemiol. 1996, 49, 1373–1379. [Google Scholar] [CrossRef]
  43. Tibshirani, R. Regression Shrinkage and Selection Via the Lasso. J. R. Stat. Soc. Ser. B Stat. Methodol. 1996, 58, 267–288. [Google Scholar] [CrossRef]
  44. Friedman, J.; Hastie, T.; Tibshirani, R. Regularization Paths for Generalized Linear Models via Coordinate Descent. J. Stat. Softw. 2010, 33, 1–22. [Google Scholar] [CrossRef] [PubMed] [Green Version]
  45. Zuur, A.; Ieno, E.N.; Walker, N.; Saveliev, A.A.; Smith, G.M. Mixed Effects Models and Extensions in Ecology with R; Springer: New York, NY, USA, 2009; Volume 574. [Google Scholar]
  46. Burnham, K.P.; Anderson, D.R. Model Selection and Multimodel Inference: A Practical Information-Theoretic Approach, 2nd ed.; Springer: New York, NY, USA, 2002. [Google Scholar]
  47. Barton, K. MuMIn: Multi-Model Inference. R Package Version 1.46.0. 2022. Available online: https://CRAN.R-project.org/package=MuMIn (accessed on 10 September 2022).
  48. Newsome, T.M.; Boitani, L.; Chapron, G.; Ciucci, P.; Dickman, C.R.; Dellinger, J.A.; López-Bao, J.V.; Peterson, R.O.; Shores, C.R.; Wirsing, A.J.; et al. Food habits of the world’s grey wolves. Mamm. Rev. 2016, 46, 255–269. [Google Scholar] [CrossRef]
  49. Massei, G.; Kindberg, J.; Licoppe, A.; Gačić, D.; Šprem, N.; Kamler, J.; Baubet, E.; Hohmann, U.; Monaco, A.; Ozoliņš, J.; et al. Wild boar populations up, numbers of hunters down? A review of trends and implications for Europe. Pest Manag. Sci. 2015, 71, 492–500. [Google Scholar] [CrossRef] [PubMed]
  50. Tsaparis, D.; Sotiropoulos, K.; Legakis, A.; Kotoulas, G.; Kasapidis, P. New phylogeographic insights support the distinctiveness and conservation value of the little-known Greek roe deer populations. Mamm. Biol. 2019, 96, 23–27. [Google Scholar] [CrossRef]
  51. Capitani, C.; Chynoweth, M.; Kusak, J.; Çoban, E.; Şekercioğlu Çağan, H. Wolf diet in an agricultural landscape of north-eastern Turkey. Mammalia 2016, 80, 329. [Google Scholar] [CrossRef] [Green Version]
  52. Petridou, M.; Youlatos, D.; Lazarou, Y.; Selinides, K.; Pylidis, C.; Giannakopoulos, A.; Kati, V.; Iliopoulos, Y. Wolf diet and livestock selection in central Greece. Mammalia 2019, 83, 530. [Google Scholar] [CrossRef]
  53. Ciucci, P.; Artoni, L.; Crispino, F.; Tosoni, E.; Boitani, L. Inter-pack, seasonal and annual variation in prey consumed by wolves in Pollino National Park, southern Italy. Eur. J. Wildl. Res. 2018, 64, 5. [Google Scholar] [CrossRef]
  54. Martins, I.; Krofel, M.; Mota, P.G.; Álvares, F. Consumption of Carnivores by Wolves: A Worldwide Analysis of Patterns and Drivers. Diversity 2020, 12, 470. [Google Scholar] [CrossRef]
  55. Ordiz, A.; Milleret, C.; Uzal, A.; Zimmermann, B.; Wabakken, P.; Wikenros, C.; Sand, H.; Swenson, J.E.; Kindberg, J. Individual Variation in Predatory Behavior, Scavenging and Seasonal Prey Availability as Potential Drivers of Coexistence between Wolves and Bears. Diversity 2020, 12, 356. [Google Scholar] [CrossRef]
  56. Ciucci, P.; Boitani, L.; Francisci, F.; Andreoli, G. Home range, activity and movements of a wolf pack in central Italy. J. Zool. 1997, 243, 803–819. [Google Scholar] [CrossRef]
  57. Kusak, J.; Skrbinšek, A.M.; Huber, D. Home ranges, movements, and activity of wolves (Canis lupus) in the Dalmatian part of Dinarids, Croatia. Eur. J. Wildl. Res. 2005, 51, 254–262. [Google Scholar] [CrossRef]
  58. Frey, S.; Tejero, D.; Baillie-David, K.; Burton, A.C.; Fisher, J.T. Predator control alters wolf interactions with prey and competitor species over the diel cycle. Oikos 2022, 2022, e08821. [Google Scholar] [CrossRef]
  59. Theuerkauf, J. What Drives Wolves: Fear or Hunger? Humans, Diet, Climate and Wolf Activity Patterns. Ethology 2009, 115, 649–657. [Google Scholar] [CrossRef]
  60. Ordiz, A.; Kindberg, J.; Sæbø, S.; Swenson, J.E.; Støen, O.-G. Brown bear circadian behavior reveals human environmental encroachment. Biol. Conserv. 2014, 173, 1–9. [Google Scholar] [CrossRef]
  61. Lazzeri, L.; Fazzi, P.; Lucchesi, M.; Mori, E.; Velli, E.; Cappai, N.; Ciuti, F.; Ferretti, F.; Fonda, F.; Paniccia, C.; et al. The rhythm of the night: Patterns of activity of the European wildcat in the Italian peninsula. Mamm. Biol. 2022, 102, 1–14. [Google Scholar] [CrossRef]
  62. Gilbert, N.A.; McGinn, K.A.; Nunes, L.A.; Shipley, A.A.; Bernath-Plaisted, J.; Clare, J.D.J.; Murphy, P.W.; Keyser, S.R.; Thompson, K.L.; Maresh Nelson, S.B.; et al. Daily activity timing in the Anthropocene. Trends Ecol. Evol. 2022; in press. [Google Scholar]
  63. Frey, S.; Volpe, J.P.; Heim, N.A.; Paczkowski, J.; Fisher, J.T. Move to nocturnality not a universal trend in carnivore species on disturbed landscapes. Oikos 2020, 129, 1128–1140. [Google Scholar] [CrossRef]
  64. Podgórski, T.; Baś, G.; Jędrzejewska, B.; Sönnichsen, L.; Śnieżko, S.; Jędrzejewski, W.; Okarma, H. Spatiotemporal behavioral plasticity of wild boar (Sus scrofa) under contrasting conditions of human pressure: Primeval forest and metropolitan area. J. Mammal. 2013, 94, 109–119. [Google Scholar] [CrossRef] [Green Version]
  65. Anile, S.; Devillard, S.; Nielsen, C.K.; Valvo, M.L. Anthropogenic threats drive spatio-temporal responses of wildcat on Mt. Etna. Eur. J. Wildl. Res. 2021, 67, 50. [Google Scholar] [CrossRef]
  66. Gaudry, W.; Saïd, S.; Gaillard, J.-M.; Chevrier, T.; Loison, A.; Maillard, D.; Bonenfant, C. Partial migration or just habitat selection? Seasonal movements of roe deer in an Alpine population. J. Mammal. 2015, 96, 502–510. [Google Scholar] [CrossRef]
  67. Mancinelli, S.; Falco, M.; Boitani, L.; Ciucci, P. Social, behavioural and temporal components of wolf (Canis lupus) responses to anthropogenic landscape features in the central Apennines, Italy. J. Zool. 2019, 309, 114–124. [Google Scholar] [CrossRef]
  68. Ares-Pereira, G.; Rosalino, L.M.; Teixeira, D.; Castro, G.; Magalhães, A.; Lima, C.; Fonseca, C.; Torres, R.T. Eucalyptus plantations alter spatiotemporal relationships of wild ungulates. Agric. Ecosyst. Environ. 2022, 340, 108174. [Google Scholar] [CrossRef]
  69. Fernández, N.; Selva, N.; Yuste, C.; Okarma, H.; Jakubiec, Z. Brown bears at the edge: Modeling habitat constrains at the periphery of the Carpathian population. Biol. Conserv. 2012, 153, 134–142. [Google Scholar] [CrossRef]
  70. Rutten, A.; Casaer, J.; Strubbe, D.; Leirs, H. Agricultural and landscape factors related to increasing wild boar agricultural damage in a highly anthropogenic landscape. Wildl. Biol. 2020, 2020, wlb.00634. [Google Scholar] [CrossRef] [Green Version]
  71. Smith, A.F.; Ciuti, S.; Shamovich, D.; Fenchuk, V.; Zimmermann, B.; Heurich, M. Quiet islands in a world of fear: Wolves seek core zones of protected areas to escape human disturbance. Biol. Conserv. 2022, 276, 109811. [Google Scholar] [CrossRef]
  72. Bonnot, N.; Morellet, N.; Verheyden, H.; Cargnelutti, B.; Lourtet, B.; Klein, F.; Hewison, A.J.M. Habitat use under predation risk: Hunting, roads and human dwellings influence the spatial behaviour of roe deer. Eur. J. Wildl. Res. 2013, 59, 185–193. [Google Scholar] [CrossRef]
  73. Liu, M.; Wang, Y.; Xia, F.; Bu, H.; Liu, Y.; Shen, X.; Li, S. Free-ranging livestock altered the spatiotemporal behavior of the endangered North Chinese leopard (Panthera pardus japonensis) and its prey and intensified human–leopard conflicts. Integr. Zool. 2022, 18, 143–156. [Google Scholar] [CrossRef]
  74. Zini, V.; Wäber, K.; Hornigold, K.; Lake, I.; Dolman, P.M. Human and environmental associates of local species-specific abundance in a multi-species deer assemblage. Eur. J. Wildl. Res. 2021, 67, 99. [Google Scholar] [CrossRef]
  75. Gompper, M.E. Adding Nuance to Our Understanding of Dog–Wildlife Interactions and the Need for Management. Integr. Comp. Biol. 2021, 61, 93–102. [Google Scholar]
  76. Young, J.K.; Olson, K.A.; Reading, R.P.; Amgalanbaatar, S.; Berger, J. Is Wildlife Going to the Dogs? Impacts of Feral and Free-roaming Dogs on Wildlife Populations. Bioscience 2011, 61, 125–132. [Google Scholar] [CrossRef] [Green Version]
  77. Skuban, M.; Find’o, S.; Kajba, M. Bears napping nearby: Daybed selection by brown bears (Ursus arctos) in a human-dominated landscape. Can. J. Zool. 2018, 96, 1–11. [Google Scholar] [CrossRef]
  78. Jahren, T.; Odden, M.; Linnell, J.D.C.; Panzacchi, M. The impact of human land use and landscape productivity on population dynamics of red fox in southeastern Norway. Mammal Res. 2020, 65, 503–516. [Google Scholar] [CrossRef]
  79. Meriggi, A.; Brangi, A.; Schenone, L.; Signorelli, D.; Milanesi, P. Changes of wolf (Canis lupus) diet in Italy in relation to the increase of wild ungulate abundance. Ethol. Ecol. Evol. 2011, 23, 195–210. [Google Scholar] [CrossRef]
  80. Imbert, C.; Caniglia, R.; Fabbri, E.; Milanesi, P.; Randi, E.; Serafini, M.; Torretta, E.; Meriggi, A. Why do wolves eat livestock? Factors influencing wolf diet in northern Italy. Biol. Conserv. 2016, 195, 156–168. [Google Scholar] [CrossRef]
  81. EC. EU Biodiversity Strategy for 2030 Bringing Nature Back into Our Lives; Communication from the Commission to the European Parliament, the Council, the European Economic and Social Committee and the Committee of the Regions, 20.5.2020.COM (2020) 380 Final; European Commission: Brussels, Belgium, 2020. [Google Scholar]
  82. EC. Commission Staff Working Document: Criteria and Guidance for Protected Areas Designations; SWD (2022) 23 Final; European Commission: Brussels, Belgium, 2022; p. 27. [Google Scholar]
  83. Kati, V.; Kassara, C.; Psaralexi, M.; Tzortzakaki, O.; Petridou, M.; Galani, A.; Hoffmann, M.T. Conservation policy under a roadless perspective: Minimizing fragmentation in Greece. Biol. Conserv. 2020, 252, 108828. [Google Scholar] [CrossRef]
  84. Iliopoulos, Y.; Youlatos, D.; Sgardelis, S. Wolf pack rendezvous site selection in Greece is mainly affected by anthropogenic landscape features. Eur. J. Wildl. Res. 2014, 60, 23–34. [Google Scholar] [CrossRef]
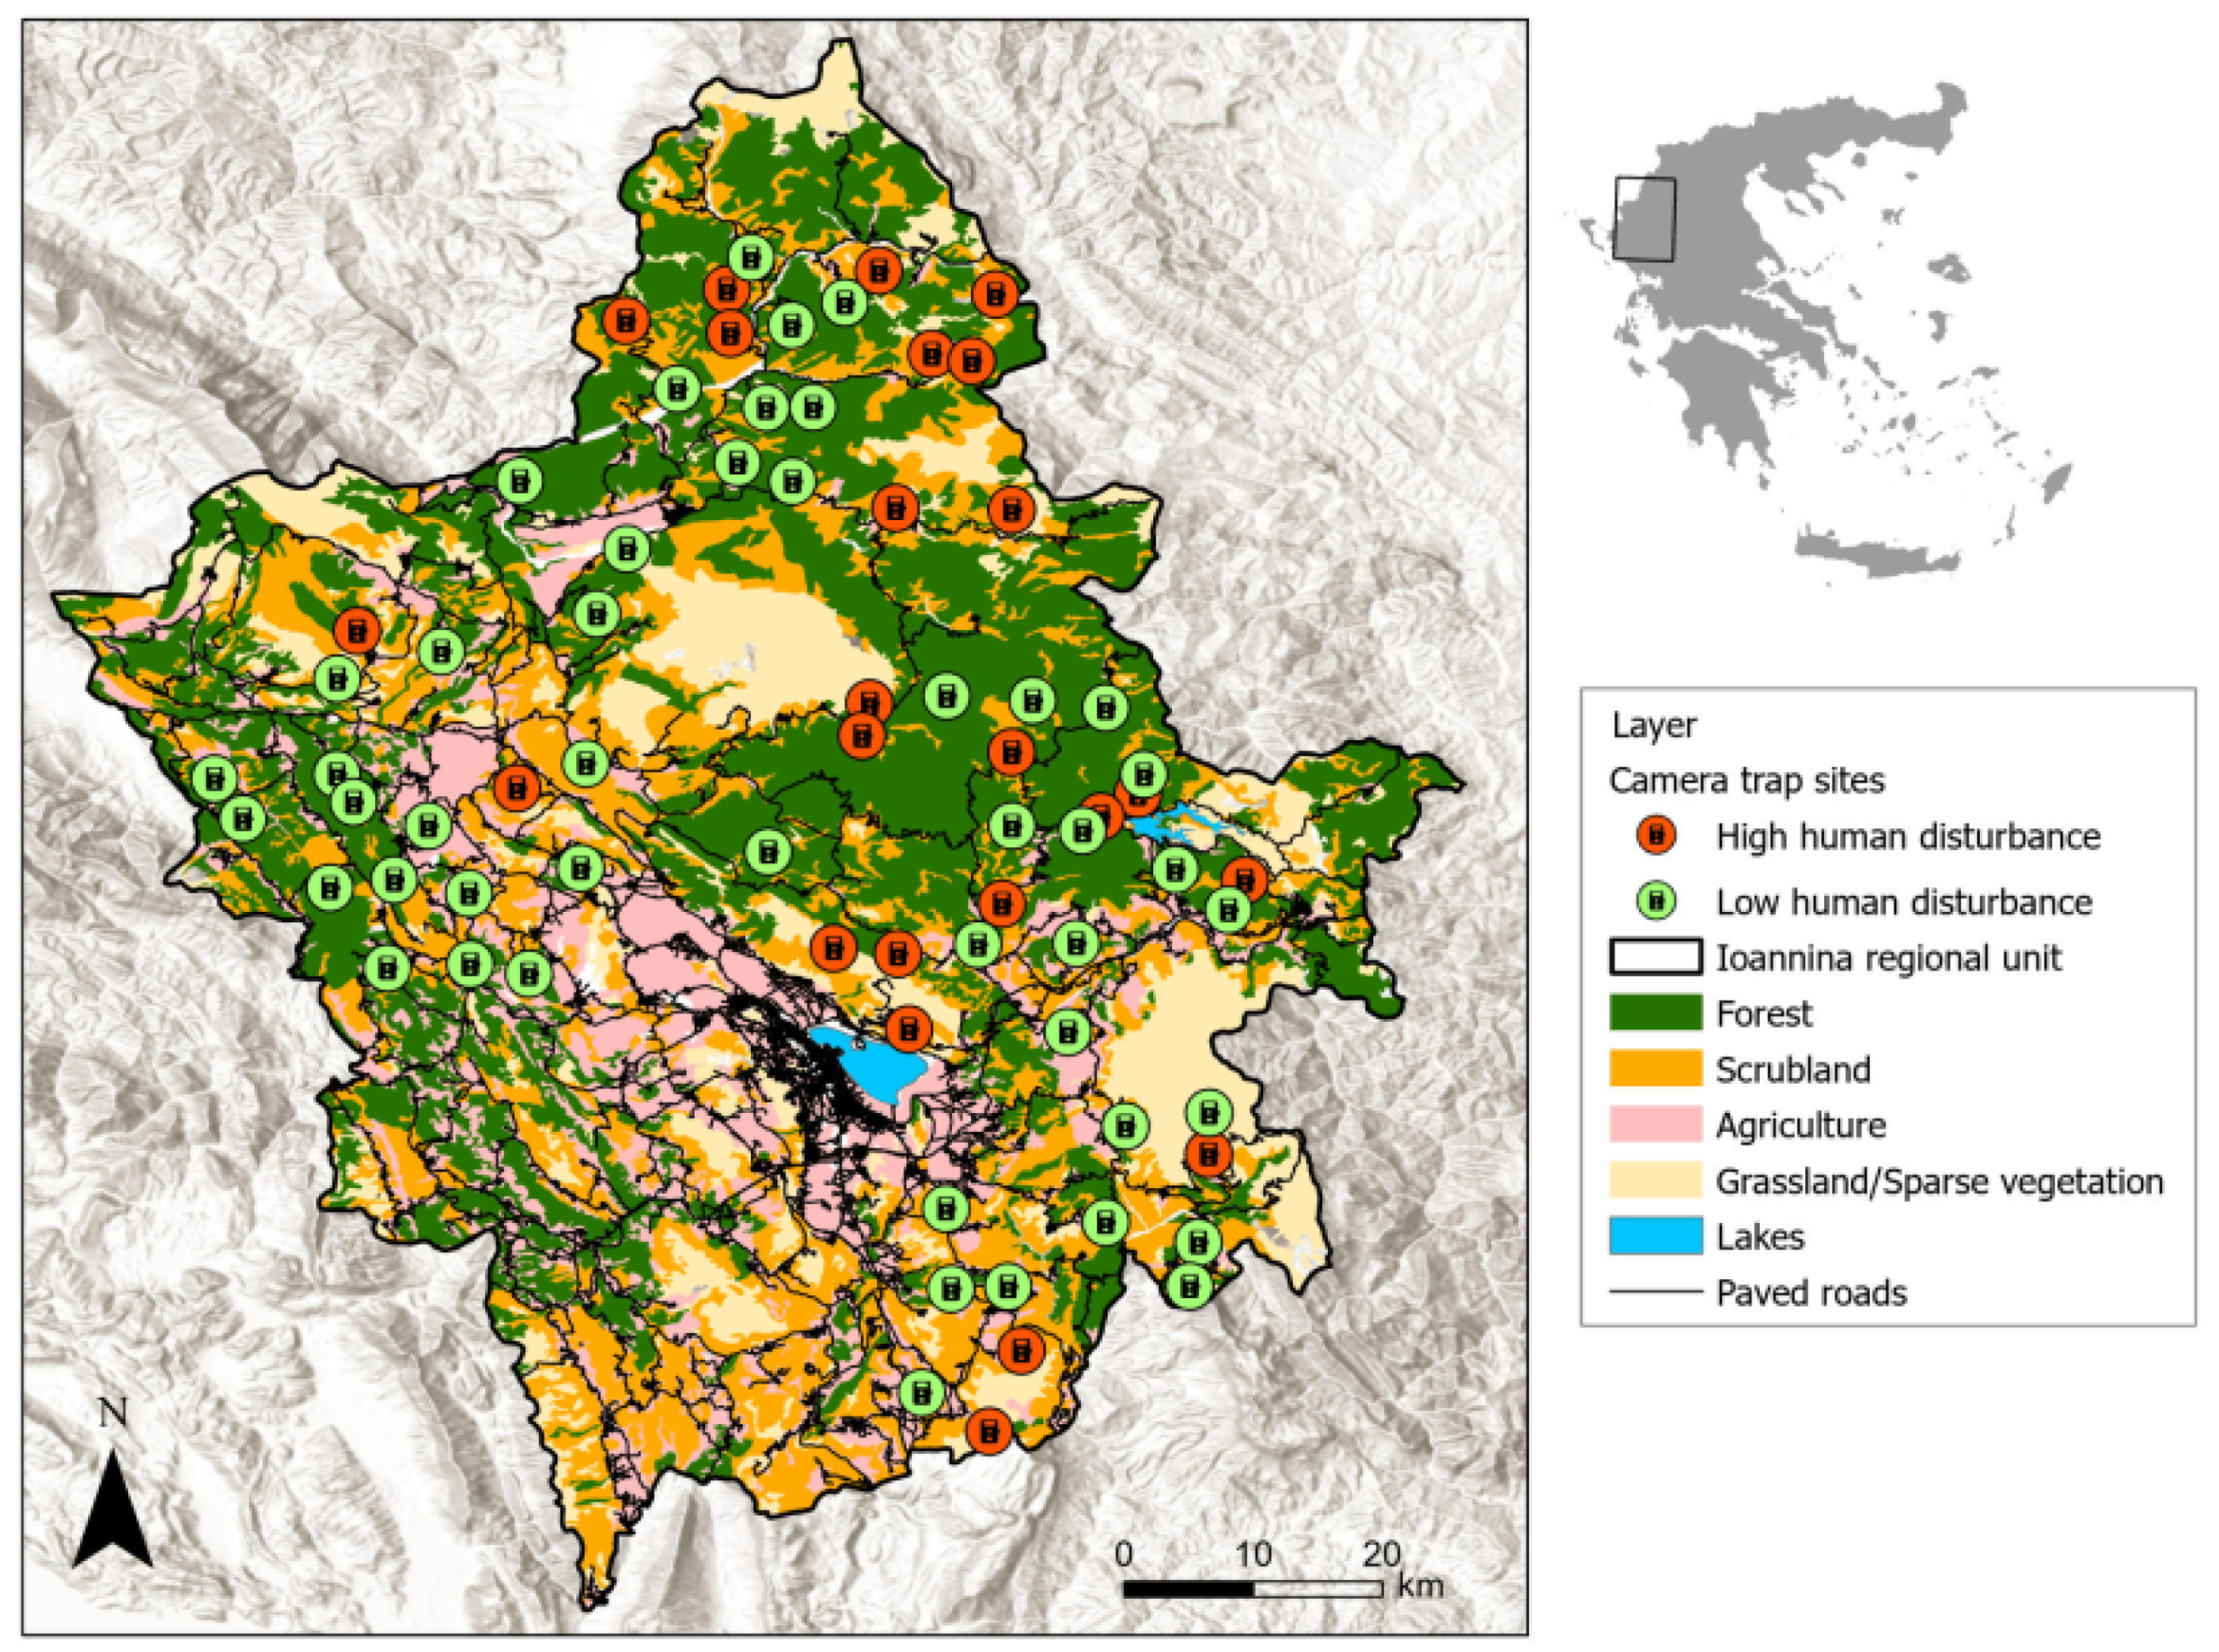
Figure 1. Map of the study area and locations of the 71 camera trap sites within the Ioannina regional unit, NW Greece, from July to October 2019 and July to November 2020. Red circles and green circles show camera stations that recorded high (n = 24) and low (n = 47) human disturbance, respectively (details in Section 2.3.3).
Diversity 15 00184 g001
Figure 2. Overlap in temporal activity pattern between wolves and other mammals in Greece, 2019–2020. Δ: percentage of overlap (95% confidence intervals in parenthesis), indicated in gray shadow. Vertical dashed lines: average sunrise (07:04) and sunset (19:32) times. Bold text: significance level of MWW test (***: p < 0.001, **: p < 0.01, *: p < 0.05, (a) 0.1 < p < 0.05).
Diversity 15 00184 g002
Figure 4. Model-averaged coefficients (β) with 95% confidence intervals (CI, bars) from predictor variables included in Generalized Linear Models used to investigate factors influencing detection rate of wild mammals in Greece, 2019–2020. Red color: negative effect (β < 0). Blue color: positive effect (β > 0). Asterisks show the significance levels corresponding to whether the 95% CI overlaps zero, which indicates no significant effect. a Marginally significant effect at the 90% CI level.
Diversity 15 00184 g004
Table 1. Summary of detections, relative abundance index (RAI), and proportion of sites where each wild mammal species and human disturbance type was detected across 71 camera traps in Greece, 2019–2020.
SpeciesDetectionsRAI% Sites
Wild mammals
Grey wolfCanis lupus1686.3179%
Brown bear Ursus arctos1505.6352%
Wild boar Sus scrofa59822.5294%
Roe deer Capreolus capreolus1596.0462%
Red fox Vulpes vulpes193772.9096%
Badger Meles meles1746.4968%
Wildcat Felis silvestris1355.0759%
Stone marten Martes foina78629.4786%
Brown hare Lepus europaeus106439.8382%
Hedgehog Erinaceus sp.702.6338%
Red squirrel Sciurus vulgaris431.6127%
Weasel Mustela nivalis60.236%
Golden jackal Canis aureus30.113%
Balkan chamois Rupicapra rupicaprabalcanica10.041%
Human disturbance
Human (non-motorized)64524.2187%
  Hunter1696.3445%
  Shepherd2077.7739%
  Tourist2107.8837%
  Resident662.4834%
Vehicle218181.8789%
Dog72727.2986%
  Livestock-guarding dog (LGD)43716.4056%
  Hunting dog2469.2358%
  Pet dog361.3510%
  Village/Stray dog170.648%
Livestock49818.6954%
  Cattle39814.9434%
  Sheep/goat712.6725%
  Horse/mule331.2411%
Total human disturbance
(Human + Vehicle + Dog + Livestock)
3379126.84100%
Disclaimer/Publisher’s Note: The statements, opinions and data contained in all publications are solely those of the individual author(s) and contributor(s) and not of MDPI and/or the editor(s). MDPI and/or the editor(s) disclaim responsibility for any injury to people or property resulting from any ideas, methods, instructions or products referred to in the content.