Review

The Grassland Fragmentation Experiment in the Swiss Jura Mountains: A Synthesis

Department of Environmental Sciences, University of Basel, Bernoullistrasse 30, 4056 Basel, Switzerland
*
Author to whom correspondence should be addressed.
Diversity 2023, 15(2), 130; https://doi.org/10.3390/d15020130
Submission received: 25 November 2022 / Revised: 13 January 2023 / Accepted: 14 January 2023 / Published: 18 January 2023
(This article belongs to the Special Issue Invertebrate Diversity in Fragmented Habitats)

Abstract

:
We synthesize findings from a 7-year fragmentation experiment in species-rich, nutrient-poor, dry calcareous grasslands in the north-western Jura mountains, Switzerland. We used a standardized approach with 48 fragments (0.25–20.25 m2) and corresponding control plots in three sites. The 5-m-wide isolation area around the fragments was maintained by frequent mowing. Fragments experienced various ecological changes, e.g., plant biomass increased along fragment edges. We examined fragmentation effects on species richness and composition, abundance, genetic diversity, functional diversity, species traits and species interactions (pollination, herbivory, parasitism, disease) in a wide array of invertebrate (gastropods, spiders, woodlice, various insect groups) and plant taxa. Responses to fragmentation differed between taxonomical groups and species. While species richness and individual density were lower in fragments in some groups, the opposite was true for other groups. Fragmentation effects were most pronounced on species interactions; however, some effects only occurred with a delay. For example, fragmentation influenced foraging patterns of bumblebees, affecting pollination, which in turn resulted in a decreased outcrossing frequency and reduced genetic diversity in a focal plant species. We highlight key findings of the experiment and emphasize their implications for grassland conservation.

1. Introduction

The current biodiversity loss due to environmental change is of great concern globally [1,2]. Habitat fragmentation is generally considered to be one of the major drivers of this loss [1,3,4,5,6]. Fragmentation reduces the total area of original habitat, changes the environmental conditions in remnants, creates isolated subpopulations, disrupts individual behavior [7], interrupts the exchange of individuals and genes among populations [8], and alters species interactions [9] and ecological processes [10]. Thus, habitat fragmentation can influence an entire suite of processes, ranging from individual behavior through population dynamics to ecosystem fluxes.
Habitat fragmentation occurs at different spatial scales [11,12]. It ranges from small breaks in otherwise homogeneous habitat to widely scattered fragments in a hostile matrix [13]. The relevant spatial scale is different for each species [14,15]. The response of a species to fragmentation depends on its dispersal ability, life history, and competitiveness, and on the type and size of the fragments, and the permeability for dispersing individuals of the matrix surrounding the fragment [4,16].
Large-scale fragmentation on the landscape level entails many challenges unfavorable to rigorous investigation. Habitat fragments in a landscape differ in size, shape, age (time since isolation), distance to large homogeneous habitat, and distance to other fragments: all of which make any proper replication of the investigation unit difficult [17]. Furthermore, corresponding control areas are frequently lacking [18]. Experimental studies with replicates and controls can, therefore, represent a valuable and complementary approach, even if they do not reach the spatial scale of the landscape [10,19].
In a global overview, Debinski and Holt [19] summarized the main features of 20 experimental fragmentation studies: 14 were conducted in grasslands or old fields and 6 in forests. The experimental studies were grouped into five broad focal issues: species richness, the interplay of connectivity versus isolation, individual species behavior, demography, and genetics [19]. However, Debinski and Holt [19] also reported gaps in their overview. For example, species interactions were relatively poorly studied, an exception being predation. Furthermore, time lags of species’ responses to fragmentation have been rarely studied.
One of the twenty experimental studies was the “Grassland fragmentation experiment in the Swiss Jura mountains” conducted by researchers from University of Basel over a period of 7 years [17]. It aimed to examine the effects of grassland fragmentation on various aspects of diversity and population dynamics in plants and various groups of invertebrates, as well as on species interactions. Nutrient-poor, dry calcareous grasslands served as the model ecosystem for this mesocosm experiment. In the north-western Jura mountains in Switzerland, nutrient-poor, dry calcareous grasslands harbor a huge variety of invertebrates and vascular plants [20,21]. This type of grassland is of high conservation importance in Europe (habitat type of the EU Habitats Directive; [22]). The sensitive habitat type has diminished dramatically during recent decades due to changes in agricultural practices, such as increased fertilization [23] or abandonment and reforestation [24,25]. For example, in the Passwang region, 24 km south of Basel, unfertilized grasslands decreased by 78% between 1950 and 1985 [26]. The rapid habitat change and fragmentation of the grasslands have resulted in significant losses of specialist plant species [23], and the same may be true for invertebrates as well [21]. In these grasslands, the majority of the plant species are perennial while many of the invertebrates have a life cycle of 1 year or even shorter, suggesting that the latter are suitable model organisms to study short-term responses to experimental habitat fragmentation. With the short generation times of most of the species in these communities, an experimental approach in grasslands potentially offers the opportunity to study patterns in mere years that would otherwise require decades to observe for organisms such as trees or large mammals in forest fragments.
Many of the findings of this 7-year field experiment have been published in various independent articles focusing on distinct aspects. However, a general overview of the main results is so far lacking. We present here for the first time a synthesis of the research conducted in the grassland fragmentation experiment in the Swiss Jura mountains. We highlight several key findings and emphasize their implications for grassland conservation. We also discuss the advantages and limits of this kind of mesocosm experiment with randomized fragments and corresponding control plots replicated over three sites.

2. A Replicated, Controlled 7-Year Fragmentation Experiment

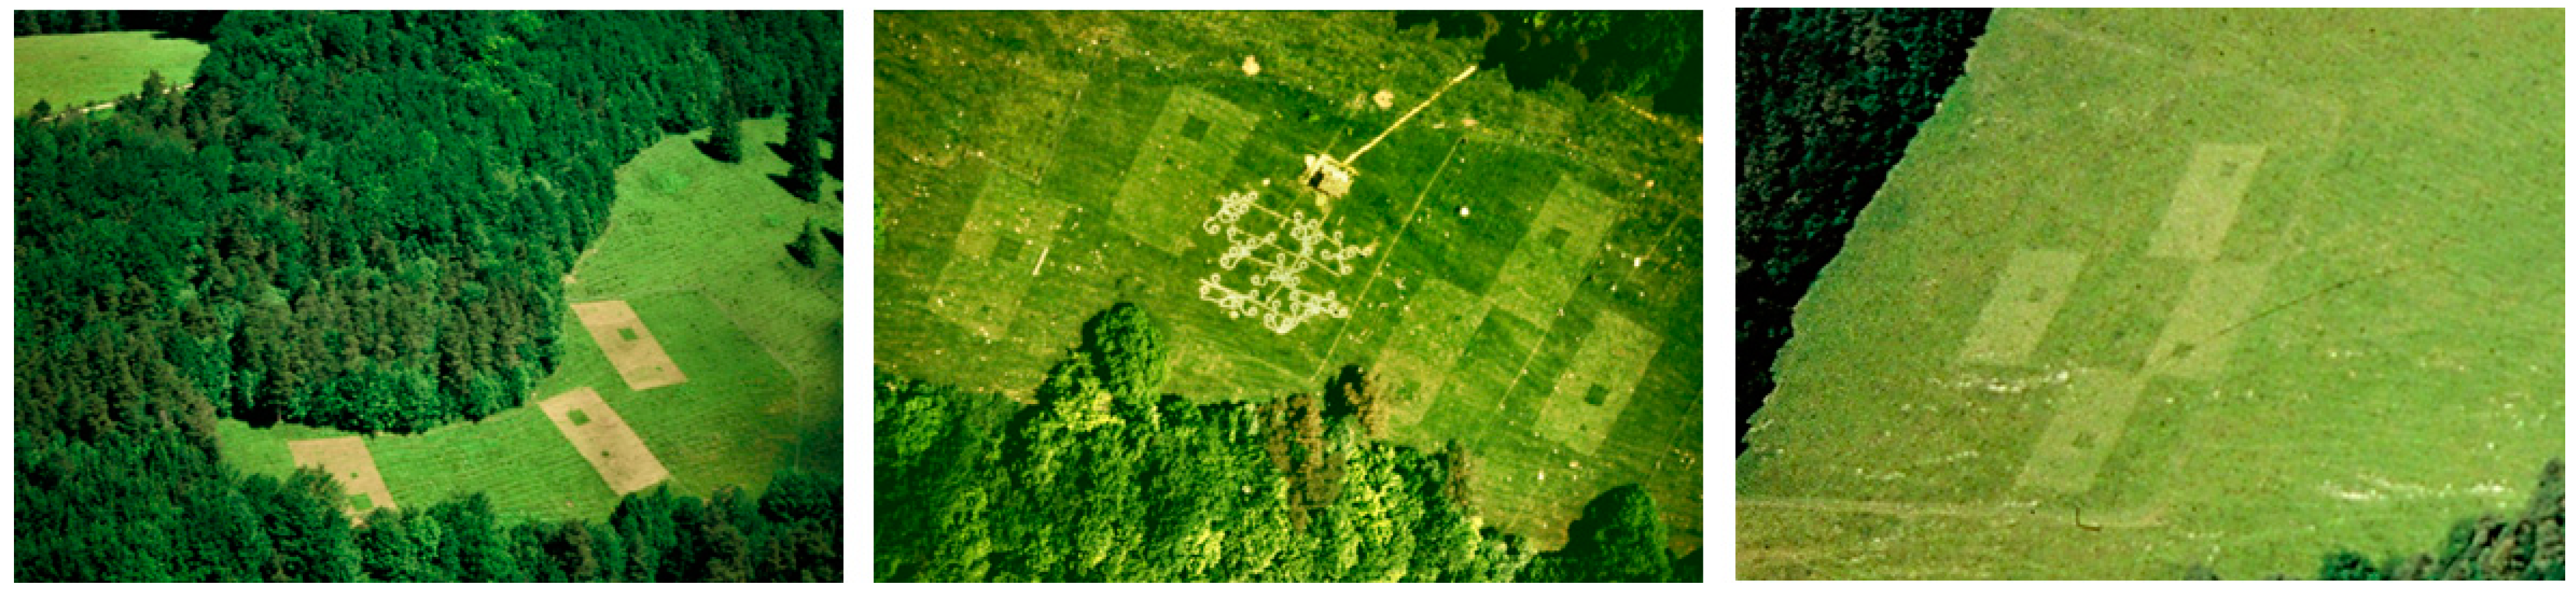
2.1. Grasslands Examined

For the fragmentation experiment, we rented c. 1.5 ha of semi-natural, nutrient-poor calcareous grassland at each of three sites in the Swiss Jura mountains: Movelier (midpoint of site: 47.413558° N, 7.323867° E, 770 m a.s.l.), Nenzlingen (47.448586° N, 7.567864° E, 510 m a.s.l.), and Vicques (47.363867° N, 7.426114° E, 590 m a.s.l.; Figure 1). We took over the management for 7 years in agreement with the owners. The rental agreement included a provision that no long-term changes in vegetation type and soil characteristics were allowed (e.g., no application of herbicides or fertilizer). We fenced the rented areas to exclude large herbivores and human disturbances and only mowed the grasslands at the end of the growing season in each year to prevent encroachment of shrubs and trees.
The distances among sites ranged from 9.5 to 18.8 km. The grassland near Movelier was situated on a SSE-facing slope with an inclination of 20–22°, the one in Nenzlingen on a SW-facing slope (19–22° inclination), and the one in Vicques on a SE-facing slope (15–27°). The three grasslands belong to the Teucrio-Mesobrometum association and were previously used as pasture for centuries [26,27]. Compared to Movelier, soil depth was shallow in Nenzlingen and Vicques, with the bedrock exposed in several places, resulting in drier conditions. Mixed deciduous forest bordered all three sites. The sites are described in detail in Baur et al. [21].

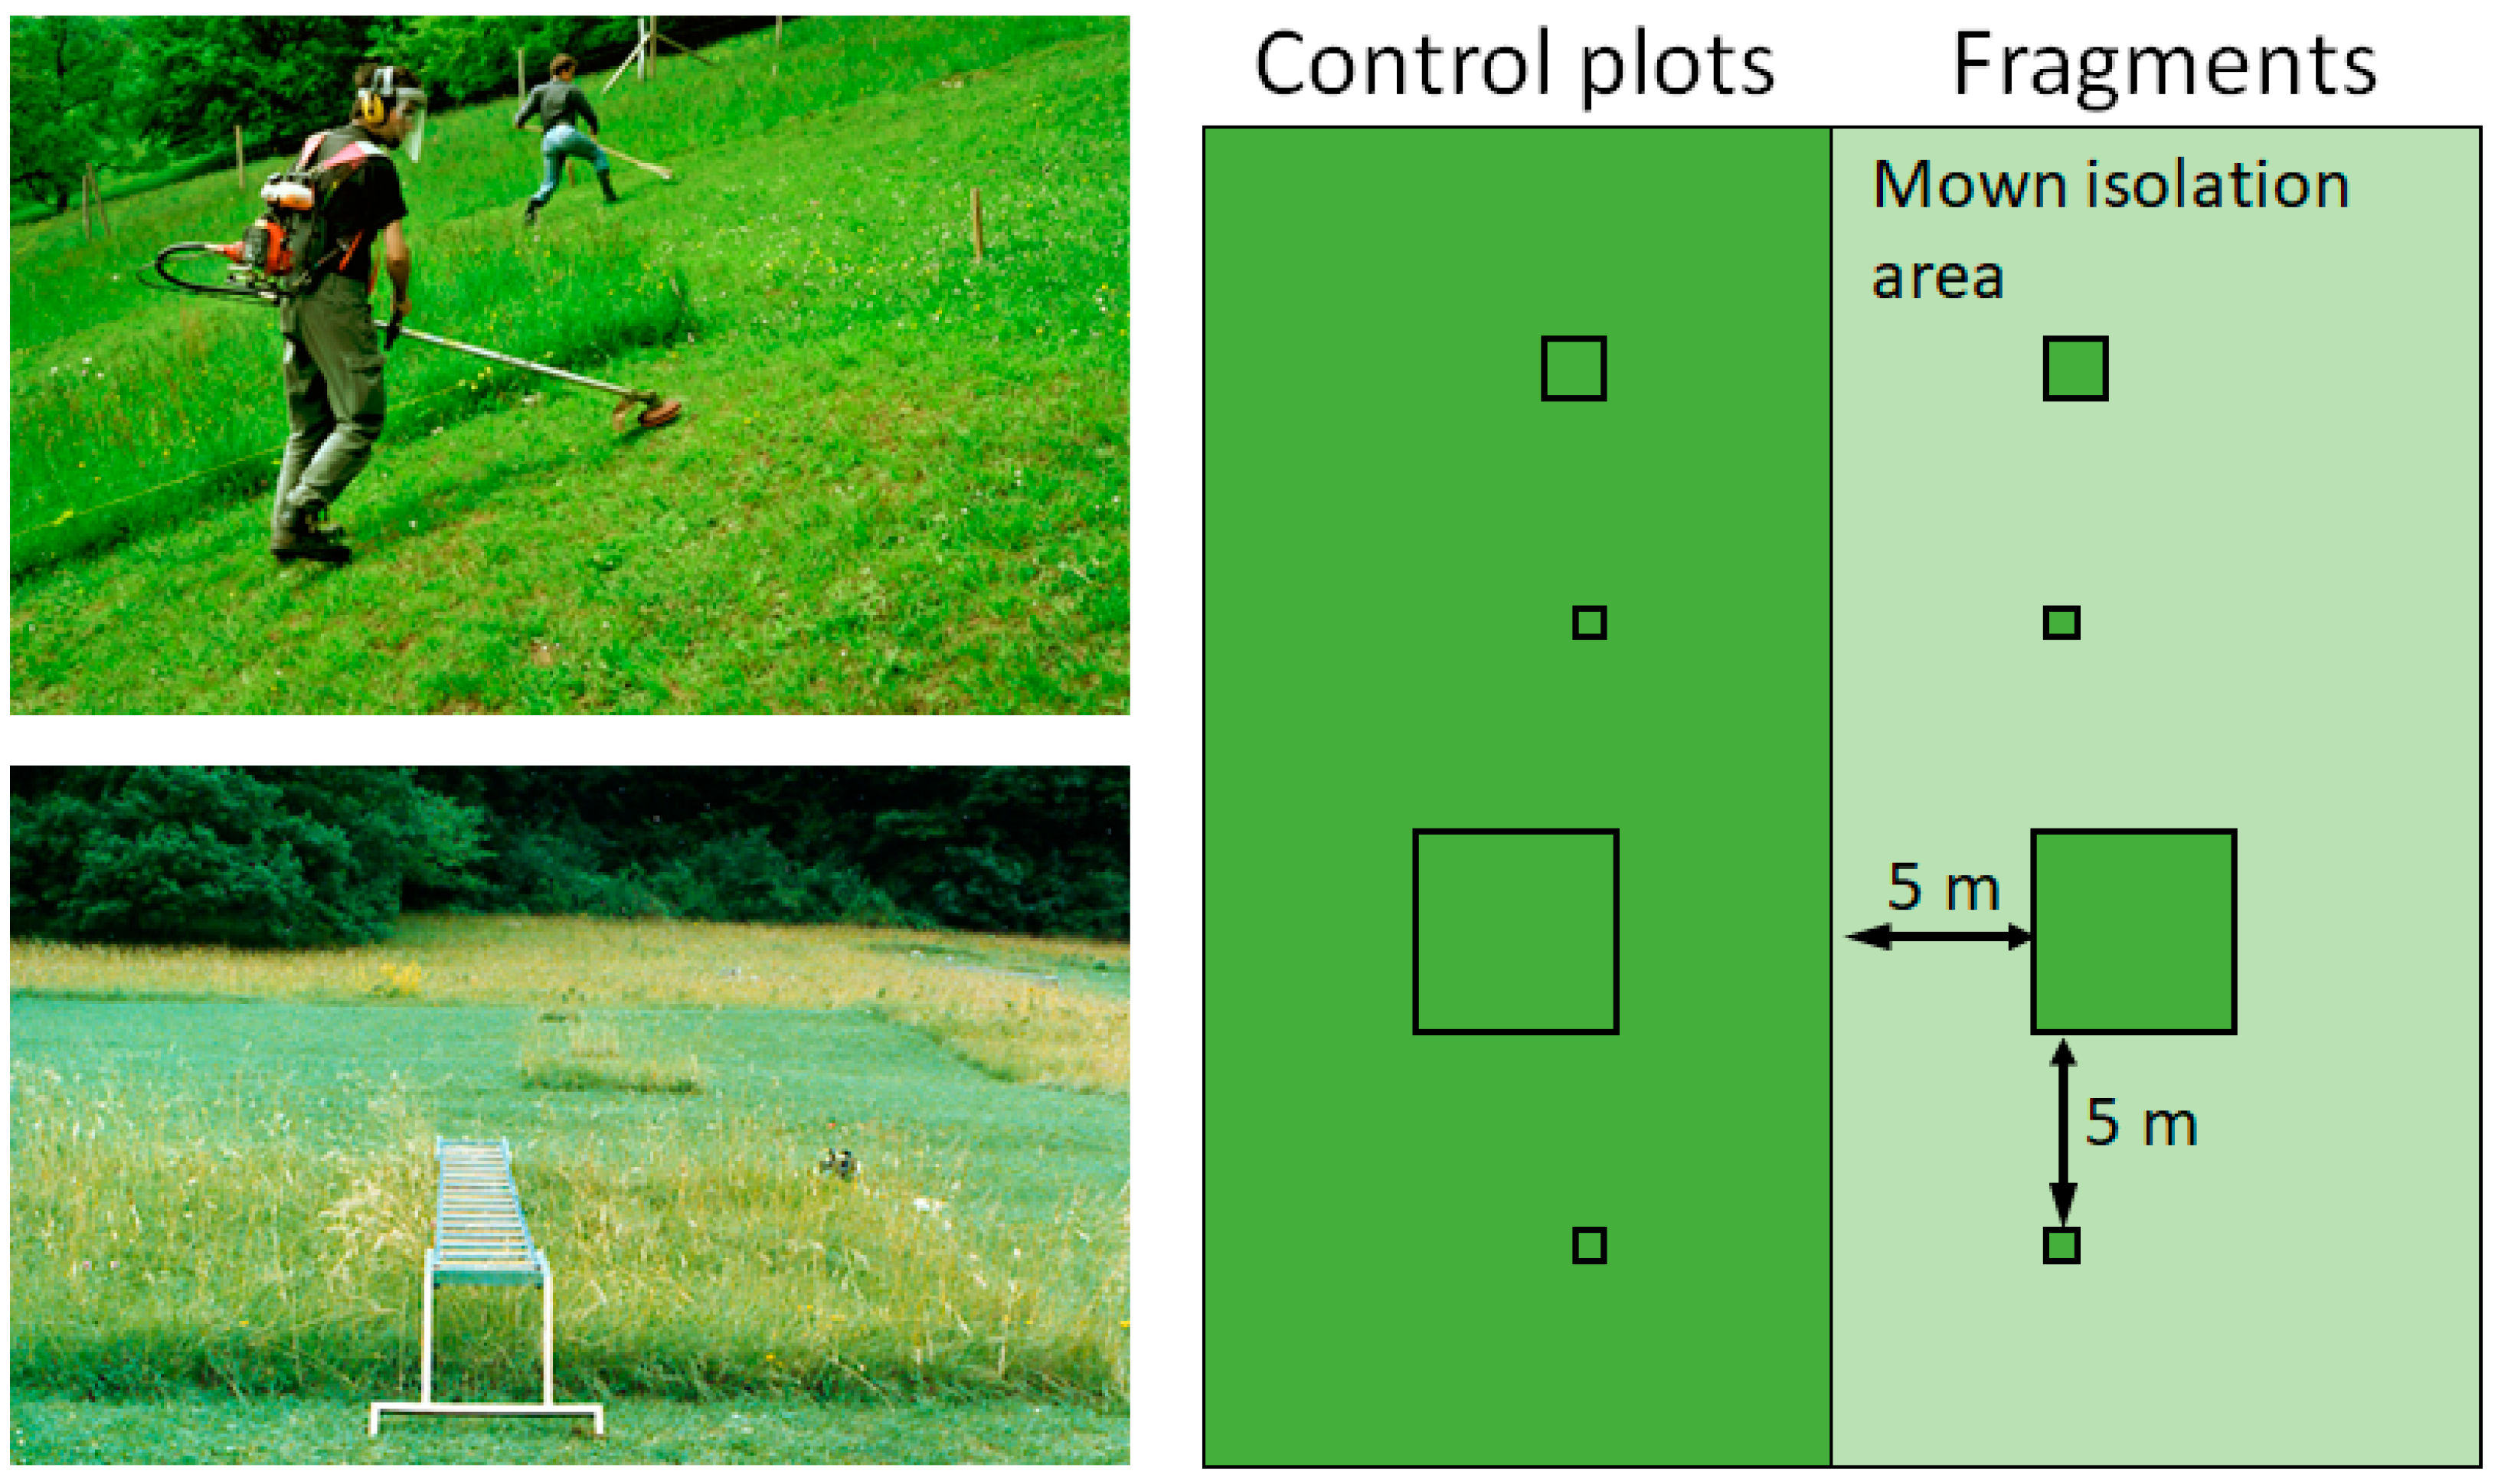
2.2. Fragmentation Experiment

The experimental design chosen considered the following points: (1) a blocked design with replicated fragments of different size with corresponding control plots nearby; (2) the positions of fragments and control plots were randomized within block halves; (3) three different grasslands of the same vegetation type with similar aspects were used to account for slightly different local species pools and varying environmental conditions.
We created experimental fragments in formerly continuous grassland by mowing the area surrounding them in May 1993 (Figure 2). We then maintained this kind of fragmentation over 7 years by frequently mowing the isolation area (hereafter matrix) surrounding the fragments (7–11 times per year) throughout the growing season. The sward height of the matrix was maintained at a few centimeters (Figure 2). Cuttings from the mowing were removed.
We used a block design in which fragments were isolated by 5 m from the nearest unmown grassland and from other fragments, a distance representative of the width of the typical road in this region. In a mirrored design, we marked corresponding control plots 5 m from the same edge within the continuous undisturbed habitat (Figure 2). Each block contained fragments of three different sizes, separated by 5 m of mown matrix: one large fragment measuring 4.5 m × 4.5 m, one small fragment (1.5 m × 1.5 m), and two tiny fragments (0.5 m × 0.5 m), and their corresponding control plots (Figure 2). We randomized the positions of the fragment–control plot pairs within a block. In total, we had a sample size of 12 large fragments, 12 small fragments, and 24 tiny fragments, with 48 corresponding control plots. However, not all experimental plots were used for all studies.
Three blocks were located in Movelier, five in Nenzlingen, and four in Vicques. Within a study site, the distances between the nearest edges of blocks ranged from 25 to 135 m. Further details on the experimental design can be found in Zschokke et al. [28].

2.3. Weather Conditions during the 7-Year Study

Annual fluctuations in weather conditions (precipitation, temperature) may affect findings from a survey in a particular year. The annual amount of precipitation (obtained from the official weather station in Delémont, 6.9 km from Movelier, 19.5 km from Nenzlingen, 5.8 km from Vicques) was 21.7% (1996) and 38.7% (1999) higher, respectively, than the long-term average (norm period 1991–2020; MeteoSwiss [29]; Table 1). In the remaining five years of the experiment, the annual precipitation was close to the long-term average. Mean annual temperature was 14.7% below long-term average in 1996 (Table 1). This was mainly due to the cold winter (Table 1). In the other years, the mean annual temperature and the mean temperature during the growing season (April to September) were both close to the long-term average (Table 1). It should be noted that the experiment was conducted before the pronounced increase in annual temperature witnessed after 2000 [29].

2.4. Methodology of the Surveys

Various survey methods were applied in the course of the 7-year study (Table 2). In choosing the adequate method to tackle a question, one needs to consider that we were not allowed to alter the habitat permanently and that we had to avoid sampling impacts on the population sizes of the various organisms in later years of the experiment. Thus, in the first six years of the experiment, we exclusively used non-invasive methods such as simple observational counts, mark-release-resight, and life traps (Table 2). Pitfall trapping was only used in the final year of the study. The main survey methods are briefly described in the following paragraphs. For further details on survey methodology, sample sizes, and statistics, see the respective papers.
To estimate the above-ground biomass, Dolt et al. [36] harvested plants by clipping them at a 5 cm height above ground level in subsamples of fragments and control plots of all sizes at the end of the growing season in the fourth to sixth year of the experiment. In the sixth year, they assessed below-ground biomass (root biomass) using soil cores in all plots in six out of the twelve blocks. The sampling design was adjusted to detect potential edge effects on plant biomass [36].
Two methods were used to survey ants [33,35]. Nest counts were considered as a proxy for the number of colonies. This survey was conducted in all fragments and control plots in the fourth year of the experiment as well as in large fragments and control plots in the final year of the study. Nests were identified by carefully searching for their entrances and by following workers returning from baits consisting of a mix of turkey meat and sugar solution. To assess forager density, ants were also counted at baits in large fragments and control plots in the final year of the experiment. In this case, baits consisted of small plastic dishes filled with sugar solution and were placed in the center of each 50 cm × 50 cm subplot of fragments and control plots. Ants were counted for 2 min, 1 h after setting a bait.
Wet sheets of cardboard attract gastropods. Therefore, to assess gastropod diversity and density, we placed cardboard sheets in the center of each 50 cm × 50 cm subplot of each fragment and control plot for one rainy autumn night from the fourth to final year of the experiment [43]. Sheets were checked for gastropods attached to them at dawn, and individuals were identified in situ. Where examination with a dissecting microscope was required, individuals were subsequently released in the plot from which they originated.
Orthopterans were surveyed twice per year in all 7 years of the experiment in each large fragment, large control plot, and an equivalent plot in the mown isolation area surrounding the fragment. The plots were carefully searched for orthopterans with the help of a bamboo rod to flush out individuals so that individuals could be counted without capturing them [39].
In the final year of the study, two pitfall traps were set in each large and small fragment, and their respective control plots [42]. Traps were 6.7 cm in diameter and partly filled with 10% glycerol solution, which is non-attractive to arthropods. Traps were emptied every 2 weeks throughout the period of highest invertebrate activity from 6 May to 12 August 1999 for a total of seven collections. For analysis, the data from both traps in each plot were averaged.
To examine fragmentation-related changes in genetic diversity in the self-compatible plant Stachys officinalis, inflorescences were harvested in small and large fragments and control plots in two study sites in the third and seventh year of fragmentation [41]. Seeds were allowed to germinate. Genetic diversity was then determined by using RAPD-PCR with DNA extracted from young leaves.

2.5. Procedure of this Synthesis

In the course of the 7-year field experiment, various MSc and PhD students used this setting to conduct a part or all of their thesis projects. They considered a wide range of ecological questions and taxonomical groups. The findings were published over a period of more than 20 years (Table 2). As a consequence, in some groups, taxonomic nomenclature changed for a significant proportion of the examined species. In this synthesis, we adjusted species names to the currently accepted names. For example, the plant Stachys officinalis, which was the focus of several papers, was previously named Betonica officinalis.
Statistical methods have been further developed in the past decades. For this synthesis, we thus used the original data to analyze species composition and functional dispersion for some taxonomical groups. Data used for these analyses are presented in the supplementary material (Tables S1–S5). In contrast to these new analyses, test statistics presented in original articles were not repeated in the synthesis.
The variety of students in this project resulted in a slightly different use of the terminology concerning plot size across the published articles (particularly in small and tiny plots). This was standardized for this synthesis (Figure 2).

3. Findings

3.1. High Species Richness in the Studied Grasslands

The various surveys of the different taxonomical groups conducted in the course of the 7-year study confirm the extraordinarily high species richness of these nutrient-poor, dry calcareous grasslands (Table 3). In this context, it is important to note that any survey just represented a snapshot, which did not capture the full species pool.

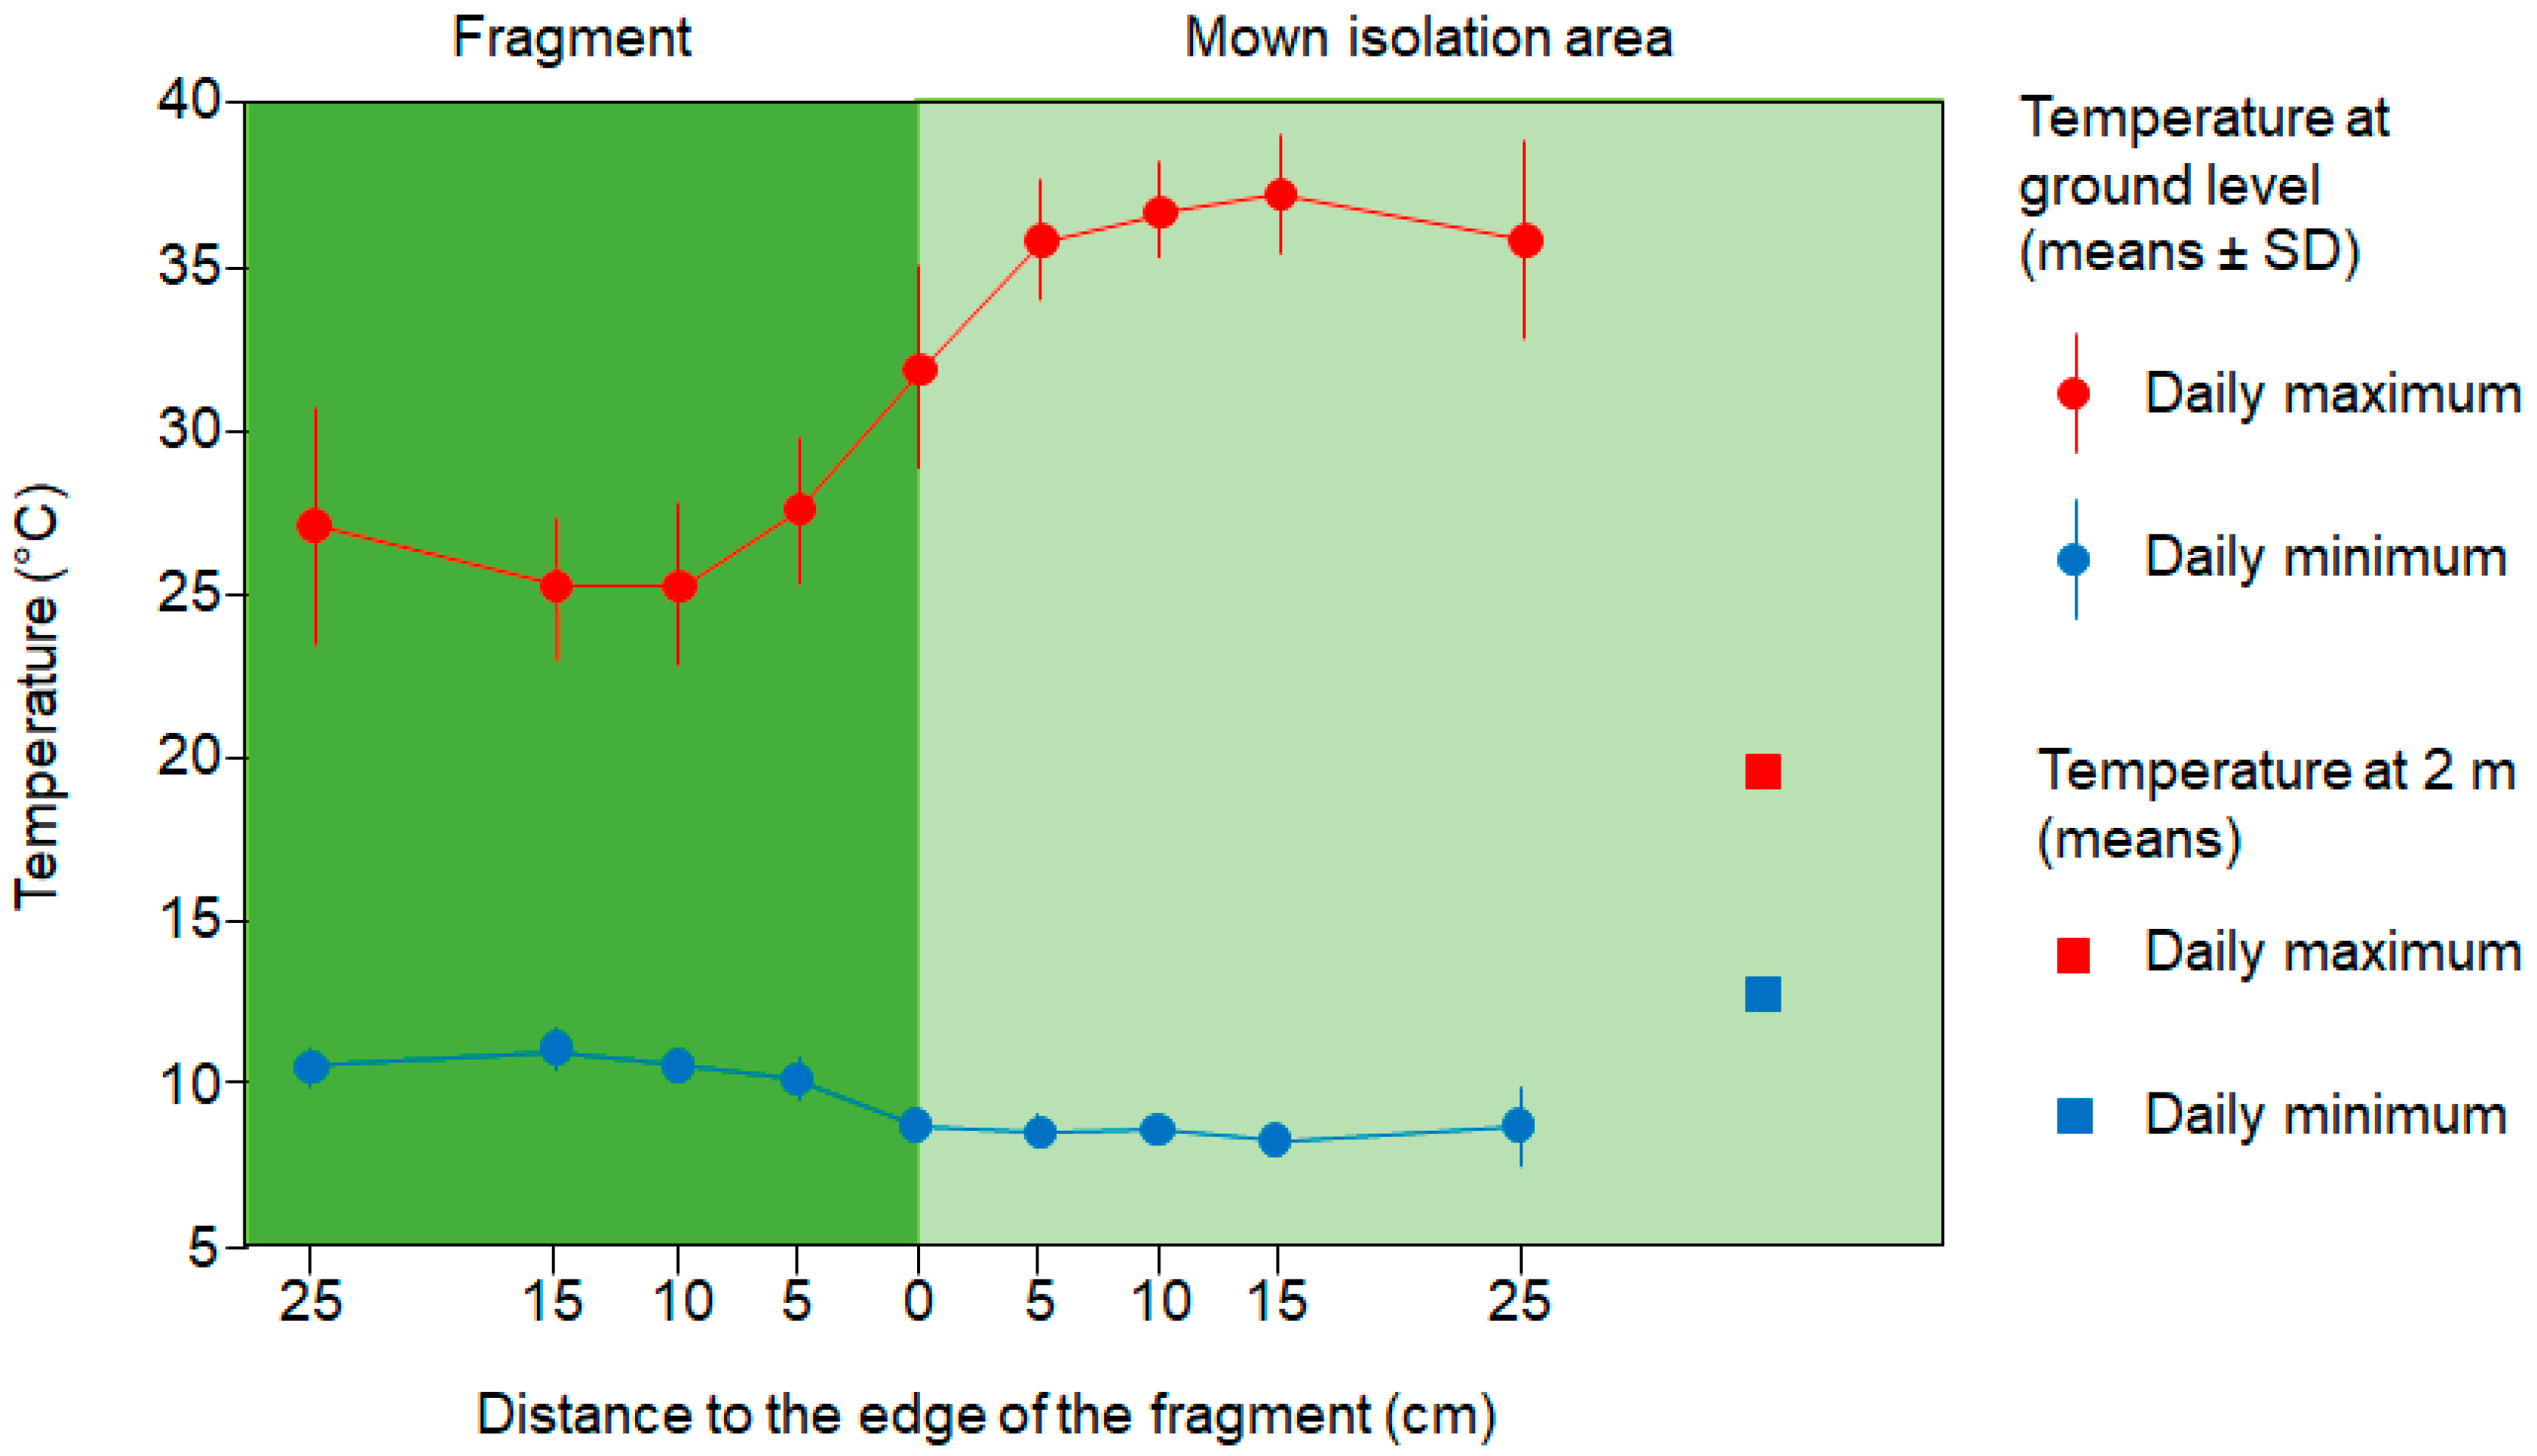
3.2. Increased Primary Productivity in the Edge Zone of Fragments

Productivity has frequently been considered as one of the most important factors determining plant diversity and ecosystem function in grasslands, with the highest diversity often at the medium level of productivity at smaller spatial scales [44,45,46]. In respect to habitat fragmentation, changes in plant productivity are assumed to influence the diversity of plants as well as that of higher trophic levels. For example, changes in plant productivity may alter the density and species composition of herbivores [34].
In our experiment, above-ground biomass was higher in fragments than in the control plots in all 3 years. However, the difference between fragments and control plots in above-ground biomass varied between years (38% higher in fragments in the fourth, 14% in the fifth, and 17% in the sixth year) and among sites [36]. Plot size influenced the above-ground biomass only in the fourth year of fragmentation. The fragmentation impact was more pronounced in tiny plots than in small and large plots indicating the importance of edge effects [36]. Thus, in contrast to many other fragmentation effects recorded in our experiment, the effect on plant biomass decreased from the fourth to the sixth year of the experiment [36], showing that some early responses may become weaker over time.
Root biomass used as a surrogate for below-ground biomass was 52% higher in fragments than in corresponding control plots [36]. In addition, the fragmentation effect on root biomass was less pronounced in small plots (15%) than in large and tiny plots (62% and 86%, respectively; [36]). Furthermore, no edge effect on below-ground biomass could be detected. Interestingly, below-ground biomass was not correlated with above-ground biomass of the same plots.
These results confirm that small-scale fragmentation can affect both the above- and below-ground plant biomass of calcareous grasslands. The biomass increase was mainly a result of a higher grass density, which might change competitive interactions among plants as well as plant species composition [36].

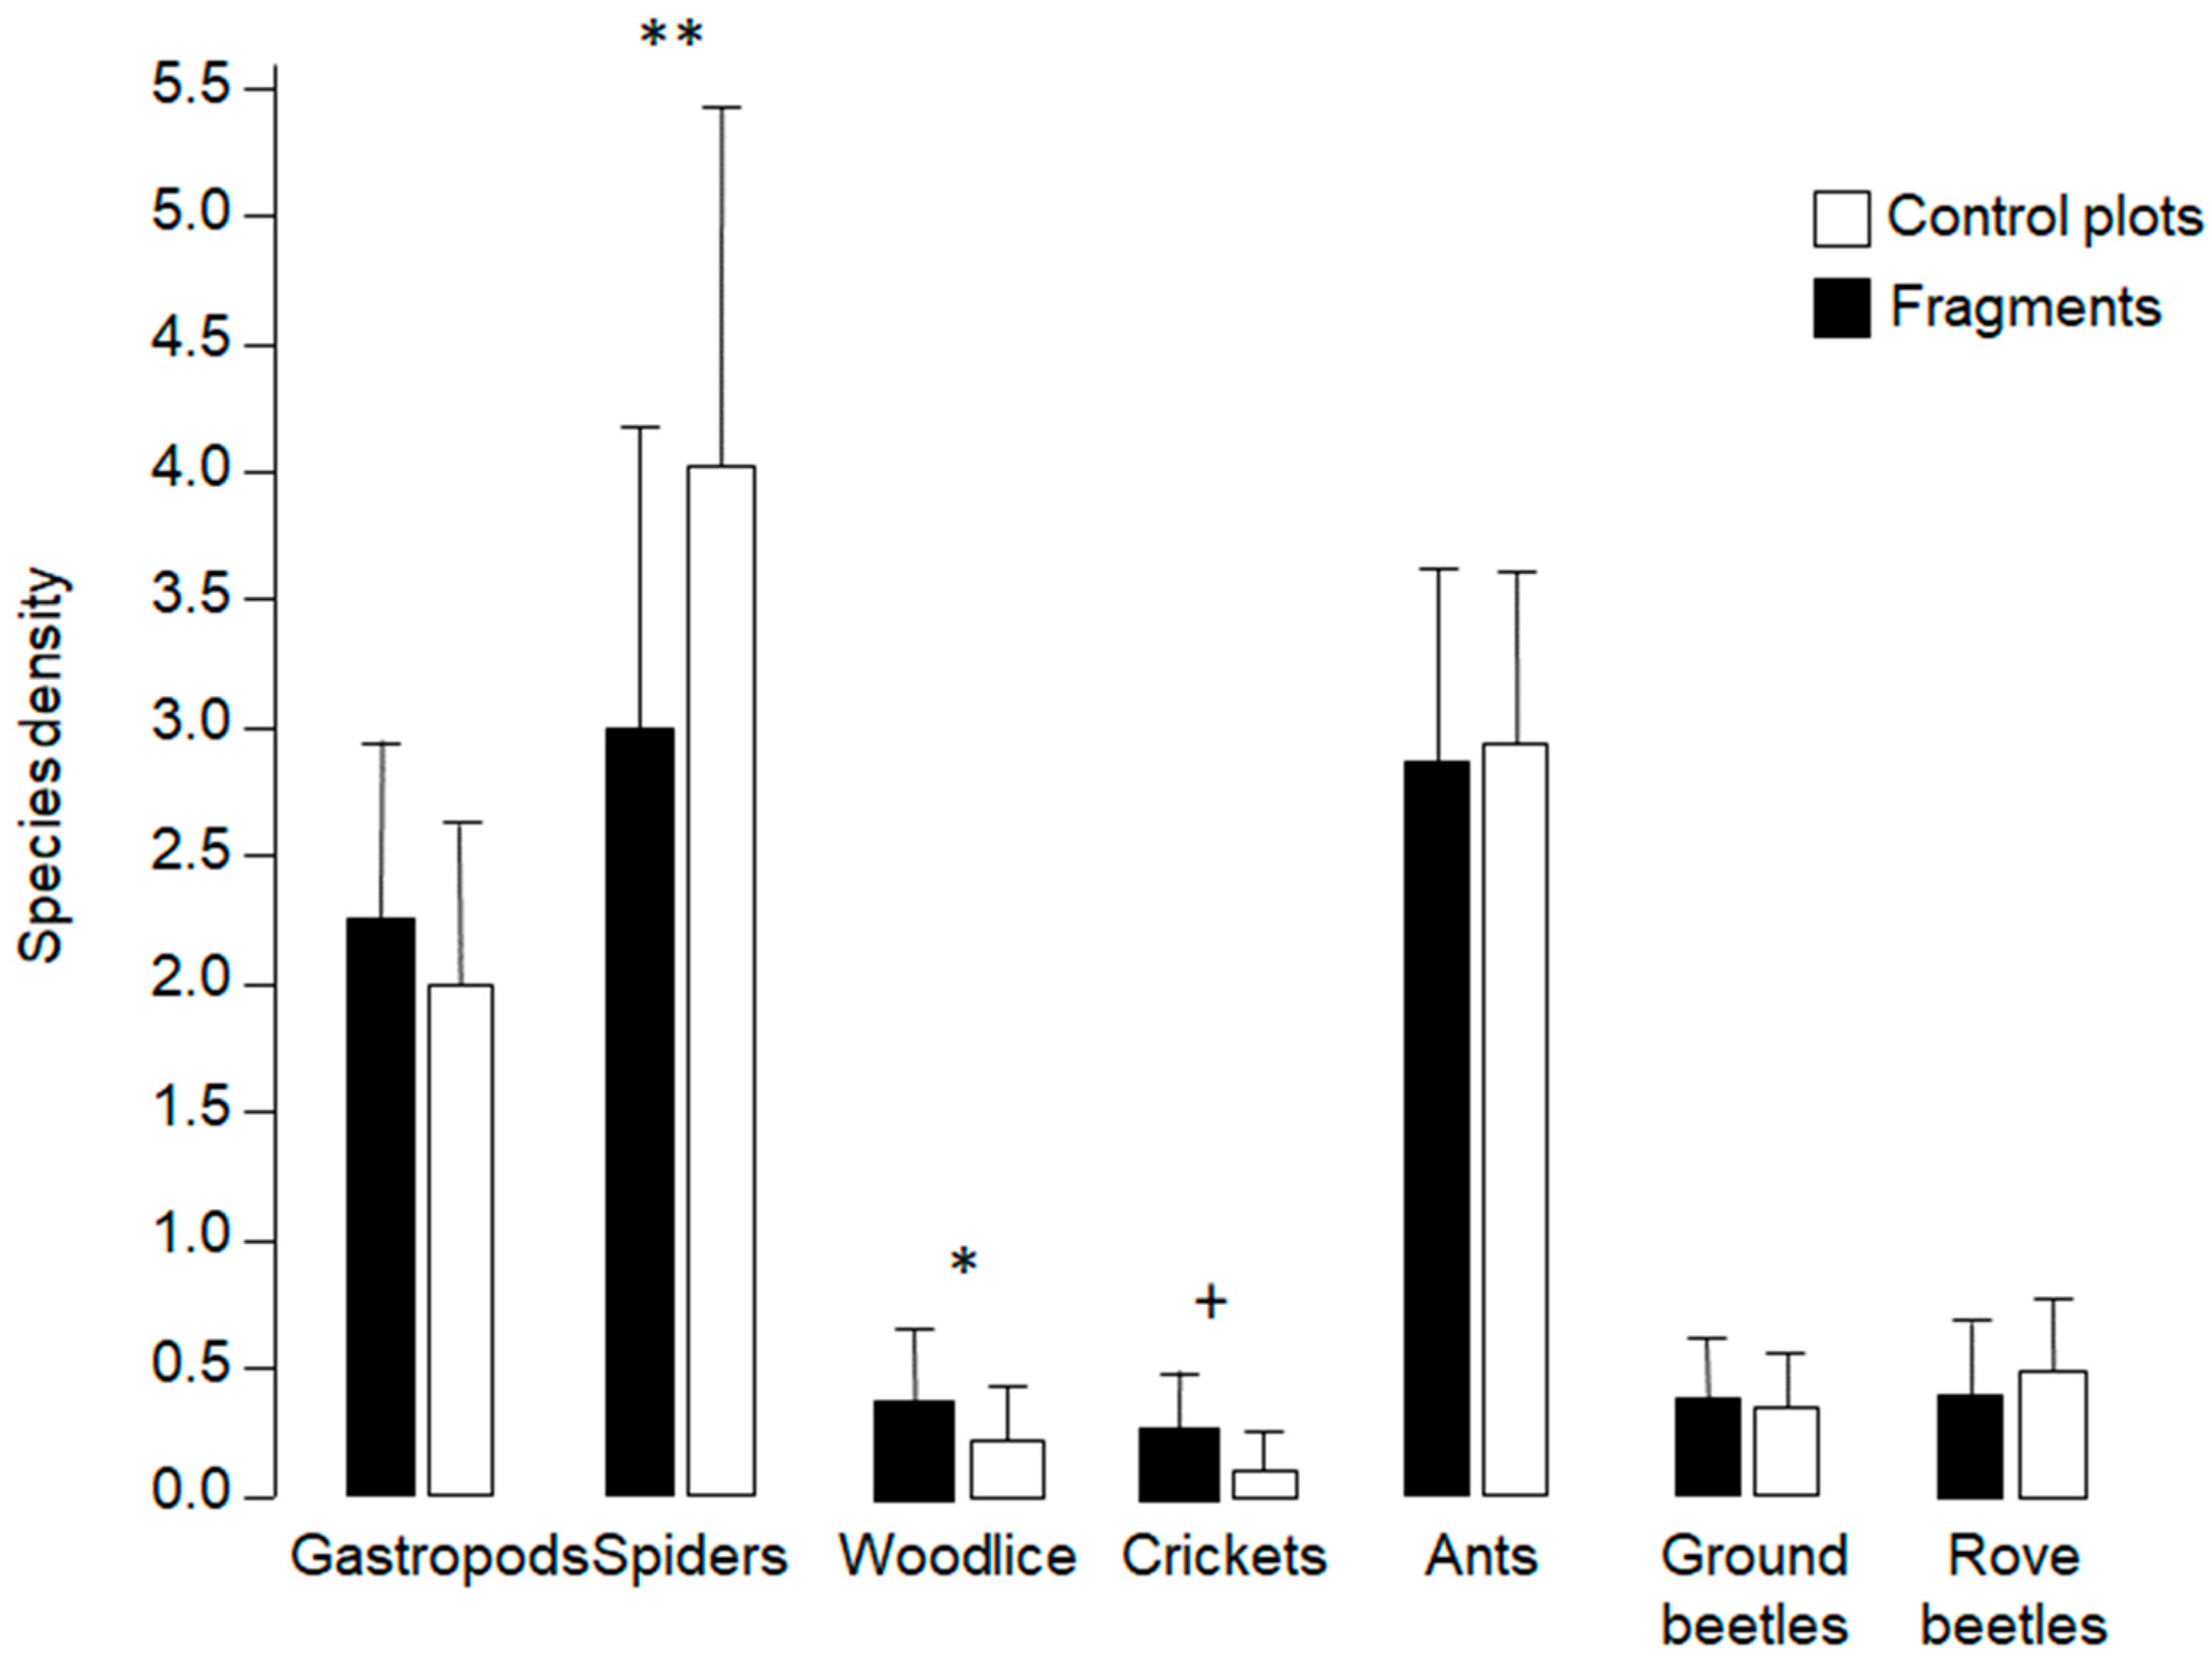
3.3. Differing Responses by Taxonomic Groups to Altered Conditions in Mown Isolation Area

The type of the surrounding area (matrix) and the extent of the difference between the matrix habitat and the fragment habitat (remnant of original habitat) affect population dynamics of many species, including their dispersal and foraging behavior [47,48,49]. From the perspective of taxa (species or groups of related species), a particular matrix is perceived in a different way, resulting in taxa-specific responses [49]. Furthermore, a large difference between the matrix and the original habitat type hinders the movement of particular species across the fragmented landscape. Thus, the matrix and its permeability are often key factors determining which species are present in fragments [48,50].
In our habitat fragmentation experiment, the matrix can be characterized by vegetation height, total cover of vegetation, and flower density. In the course of the growing season (April–September), we recorded the three vegetation characteristics on 5 days in the matrix and in the undisturbed control area of each block in the first, third, and seventh year of the study. The vegetation of the matrix changed over the course of the experiment. By the final year, vegetation height in the matrix was reduced by 50%, total vegetation cover by 34%, and flower density by 64% compared to the measures of the first year [41]. In relation to the vegetation in the undisturbed control area in the final year, vegetation height in the matrix was reduced by 95%, total vegetation cover by 40%, and flower density by 85% [51].
The mown matrix differed from the experimental fragments in air temperature close to the ground [28]. Mean ground air temperature was slightly but significantly higher in the short turf of the matrix (pooled data: 15.6 °C) than in the vegetation of the fragments (14.9 °C) in late summer (31 August to 12 September 1995). The mean daily maximum ground air temperature showed a sharp change at the edge of fragments (Figure 3). Overall, the mean daily maximum ground air temperature was higher in the matrix area (pooled data: 36.5 °C) than inside the fragments (26.2 °C; [28]). Similarly, the mean daily minimum ground air temperature changed abruptly at the fragment edge (Figure 3). The daily minimum ground air temperature was lower in the matrix (pooled data: 8.5 °C) than in the fragments (10.5 °C). The minimum temperatures measured on the ground surface in both the matrix and the fragments were lower than the minimum air temperatures recorded under standard conditions (shaded place, 2 m above ground, situated 30 m from the fragments), whereas the maximum temperatures on the ground surface were higher than those measured under standard conditions (Figure 3), indicating the large daily temperature fluctuation at the ground surface [28].
The matrix also served as temporal habitat for some invertebrate species during part of the day or season. For example, 12 out of 19 species of Orthoptera, which were recorded in the experimental blocks during repeated visual surveys in every year of the study, were also observed in the mown matrix [39]. However, both species richness and individual density were reduced in the mown matrix when compared to either fragments or control plots [39]. Considering orthopteran suborders separately, of half of the Ensifera species, no individuals were ever observed in the matrix, whereas individuals of most Caelifera species did use the matrix, even if some of those species were not abundant there [39]. This indicates that the isolation effect of the matrix differed within all taxonomic ranks from species to higher taxa.

3.4. Contrasting Effects on Species Richness and Diversity

3.4.1. Effects on Species Richness

Zschokke et al. [28] assessed the effect of grassland fragmentation on the species richness of vascular plants (grasses and forbs), ants, butterflies, grasshoppers, and gastropods in all fragments and control plots in the fourth year of the experiment. More grass species and fewer butterfly species were recorded in fragments than in the corresponding control plots. However, fragments and control plots did not differ in species richness of forbs, ants, grasshoppers, and gastropods [28].
Braschler and Baur [42] used data from pitfall traps to examine the species density (number of species per sampling unit) of several groups of invertebrates in the final year of the experiment. The experimental fragmentation affected the species density of spiders and woodlice (Figure 4). Spider species density was lower in fragments than in control plots, while woodlouse species density was higher in fragments. Species density of gastropods, ants, ground beetles, and that of rove beetles did not differ between fragments and control plots (Figure 4). The lack of a fragmentation effect on gastropod species richness matched the findings from a survey using a different trapping method (wet cardboard sheets) in four years (fourth to final year; Braschler et al. [43]). Similarly, the non-response to fragmentation by ant species was upheld by two surveys made by Braschler and Baur [35] using a different method to measure species richness (nest counts) in small and large plots in the fourth and the final year of the study. Furthermore, we found no fragmentation effect on the species richness of orthopterans in any year of the experiment [39].
Assessments of environmental change effects on biodiversity focus often on one taxonomic group whose response is assumed to reflect overall changes [52]. In our controlled experiment, however, responses to fragmentation varied widely among taxonomical groups and even among species within groups [28,42].

3.4.2. Few Effects on Shannon Diversity and Species Turnover

Both observed species richness and species density do not capture all aspects of biodiversity [53]. Another frequently used index is the Shannon diversity index [54]. In our experiment, no significant differences in the Shannon diversity index of the taxonomical groups examined (grasses, forbs, ants, butterflies, grasshoppers, and gastropods) were found between fragments and control plots in the fourth year [28].
The turnover in species composition between different communities (i.e., β-diversity) may also be affected by the experimental fragmentation. Communities in fragments may be more similar to each other than those in control plots provided the species composition in fragments is a direct consequence of the fragmentation. This is the case when always the same species suffer (become extinct) or benefit (colonize or become more abundant). Conversely, communities in fragments may be more different from each other than those in control plots. In that case, extinction and recolonization rates of species are generally higher in fragments than in control plots, but which species are affected is random [55,56].
Braschler and Baur [42] calculated βz [57] followed by PERMANOVA for invertebrate groups sampled with pitfall traps in large and small fragments and control plots in the final year of the study. β-diversity was increased in fragments for gastropods and ground beetles, while no significant fragmentation effect on β-diversity was found for ants, rove beetles, spiders, and woodlice [42]. This indicates that species assemblages in fragments did not represent a specific subset of those present in the grasslands but rather that different species changed in abundance or went extinct in different fragments.

3.5. Little Influence of Fragmentation on Species Composition but Huge Variation among Sites

Nutrient-poor, dry calcareous grasslands are generally very species rich [58,59]. However, despite belonging to the same vegetation type and being located relatively close to each other, many species occurred only in one or two of the three sites included in our experiment. For example, 98 of the 230 species of seven invertebrate groups collected with pitfall traps in the final year of the experiment (43%) only occurred in one out of the three study sites [42]. Similarly, only 6 out of 24 aphid species occurred in both sites surveyed for this group [34]. Among-site variation in species richness was not necessarily related to differences in relative densities. Vicques had lower observed and rarefied gastropod species richness than the other two sites despite similar numbers of individuals recorded [43].
Considering seven groups of invertebrates captured by pitfall traps in large and small plots in the final year of the experiment, species composition between fragments and control plots differed for all taxonomical groups analyzed combined and for spiders, ground beetles, and woodlice considered separately [42]. In contrast, no fragmentation effect was found for the species composition of gastropods, ants, and rove beetles. Similarly, using data from cardboard traps, Braschler et al. [43] found no difference in species composition between large fragments and control plots for gastropods in the fourth to the final year of the study.
For this synthesis, we reanalyzed fragmentation effects on the species composition of aphids, plants, and butterflies using NMDS and PERMANOVA (not yet done in [28,34]). Aphid species composition was not affected by grassland fragmentation in Nenzlingen and Vicques in the sixth year of the experiment. Similarly, plant and butterfly species composition were not influenced by fragmentation in the fourth year of the experiment.
Braschler et al. [39] showed that over the full duration of the experiment (7 years) species composition in orthopterans varied among sites (26.7% of explained variation in RDA model), treatment (3 levels: fragment, control plot, mown matrix, 15.4%), and to a lesser extent with the duration of the experiment (6.8%). While much of the treatment effect was due to a different species composition in the matrix, some species also differed strongly in abundance between fragments and control plots [39].

3.6. Several Species Had Higher Abundance in Fragments

We expected that the abundance of certain species responds faster to the experimental fragmentation than the species richness of the taxonomic group they belong to. Zschokke et al. [28] investigated fragmentation effects on the abundance of vascular plants (grasses and forbs), ants, butterflies, grasshoppers, and gastropods in the fourth year of the experiment. The abundances of 19 (29%) of the 65 common species examined separately were affected by fragmentation [28]. Butterflies, the most mobile animals among the invertebrates studied, responded most sensitively: foraging abundances of various butterfly species were lower in fragments than in control plots [28]. Of the few other taxonomic groups or single species that were affected by the experimental fragmentation, most had a higher abundance in fragments than in control plots. A possible explanation for this finding is that the type of fragmentation used is beneficial to some plants via decreased competition intensity along the fragment edges. Furthermore, some animals may use fragments as retreats between foraging bouts into the mown matrix.
Aphid density responded strongly to the experimental grassland fragmentation, (examined in two sites [34]). Overall aphid density was higher in fragments than in control plots in each of the three years examined (fifth to seventh year) with the fragmentation effect increasing over time [34]. One of the two most abundant aphid species had higher densities in fragments than control plots, while the density of the other common species did not differ between fragments and control plots. Several of the less common species contributed to the overall higher aphid density in fragments [34]. The increased density in fragments was a combined result of a larger number of aphid-infested plants in fragments and on average larger aphid colonies in fragments than in control plots [34].
Considering data from surveys in all 7 years of the experiment, orthopteran individual density differed among fragments, control plots, and corresponding plots in the matrix [39]. Individual density was higher in large fragments than in large control plots for the suborder Ensifera. In contrast, individual density of the suborder Caelifera did not differ between large fragments and corresponding control plots. Densities of both suborders were significantly lower in the mown matrix than in either large fragments or large control plots [39]. In addition, the overall density of orthopterans (all species combined) in our experimental blocks increased linearly over time [39]. This increase was mainly due to an increased individual number in species belonging to the suborder Caelifera, while no such directional change in density was recorded for species belonging to the suborder Ensifera [39]. All species of the suborder Ensifera together showed a strong among-year density variation, which could explain the absence of a directional change [39].
In the final year, pitfall traps were used to assess the individual density of surface-active invertebrates (expressed as individuals per 14 trap days) in large and small fragments and control plots [42]. Spider individual density was lower in fragments than in control plots, while woodlouse individual density was higher in fragments [42]. Similarly, the individual density of the only orthopteran examined, Gryllus campestris, was higher in fragments than in control plots [42]. Individual density of the other whole groups (gastropods, ants, ground beetles, and rove beetles) did not differ between fragments and control plots. However, some species within these groups differed in individual density between fragments and control plots [42].
The findings in gastropods and ants are contrasted when life traps (wet cardboard sheets for gastropods) and observational methods or baits (for ants) were used. Braschler et al. [43] found no difference in individual density of gastropods between large fragments and control plots in the fourth to final year of the study. Ant nest density, however, was higher in large fragments than in large control plots in the final year of the study [33]. This finding was supported by a higher forager density at sugar baits in large fragments than in large control plots in the same year [33], even though the individual density of ant workers in pitfall traps did not differ [42]. Nest counts in the fourth year revealed that ant nest density did not differ between fragments and control plots of all sizes [33]. There are different explanations for these contrasting findings. Firstly, a chosen method may not be very suitable for a particular organism group (e.g., pitfall trapping for gastropods). Secondly, depending on the focus of the study, different methods may be more or less adequate. For example, an assessment of ant nest density is a proxy for the number of ant colonies and thus the reproductive unit of ants, while baits and pitfall traps both measure worker activity [60]. Thirdly, depending on the prevailing conditions, a snapshot approach may capture an uncommon situation, and this may result in overlooking a potential fragmentation effect.
Weather conditions influencing invertebrate abundance also vary among years. As a consequence, most short-lived invertebrate species show huge yearly fluctuations in abundance [61,62]. This is important because the density of a species may influence whether a fragmentation effect can be demonstrated in a given year. Therefore, multi-year surveys are required to disentangle fragmentation effects from background variation. In our experiment, the relative density and rarefied species richness of gastropods increased from the fourth to seventh year of the experiment in all three study sites [43]. The increase was recorded in both snails and slugs, but was especially pronounced in slugs. The high gastropod density in the final years of the study (especially in 1999) may have been a consequence of above-average precipitation (Table 1) [43].
Abundance may vary between core and edge zones within the same fragment. For example, individuals that forage in the matrix may use the fragment as a refuge to avoid the most extreme microclimatic conditions, resulting in higher abundance in the edge zone. Furthermore, the enhanced plant productivity in the edge zone of fragments [36] and the consequently altered vegetation structure and microclimate in the edge zone [28] may be suitable for some species. Both these factors may have contributed to a higher ant nest density in the edge zone of fragments [33].

3.7. Fragmentation Affected Colonization and Extinction Rates in Some Species

Habitat fragmentation, among other effects, decreases the size of remnant animal and plant populations, which in turn leads to an increased risk of local extinctions [4]. The fate of remnant plant populations in fragments depends on fragment size, degree of isolation, the type and quality of the matrix, and on species characteristics including mating system, seed dispersal ability, and longevity [4,48]. MacArthur and Wilson [63] proposed that the colonization rate of new species will be lower and the extinction rate higher in isolated islands than in areas of continuous habitats of the same size and that both colonization and extinction rate are related to the size of the isolated islands. Similar patterns can also be expected for habitat fragments embedded in a matrix of less suitable habitat. Changes in extinction and colonization rates in fragments can also lead to shifts in community composition and decreases in species richness [63].
Joshi et al. [38] reported that the colonization rate of plant species (grasses and forbs) was 29% lower in fragments than in the corresponding control plots over the whole duration of the experiment. The extinction rate over the same period, however, was not influenced by habitat fragmentation. Therefore, the overall species turnover was 22% lower in fragments than in the corresponding control plots [38]. The same pattern of reduced colonization rate in fragments but similar extinction rate in fragments and control plots was already recorded in the period from the first to third year of the experiment and was repeated in the period from the fourth to the seventh year [38]. However, because in the latter period the extinction rate in fragments tended to be higher than in control plots in two of the three sites, the turnover rate in this latter period, if considered separately, did not differ significantly between fragments and control plots. Colonization rate and species turnover rate were influenced by plot size. Both were higher in tiny and small fragments than in the corresponding control plots. In general, habitat specialist plant species were less likely to colonize fragments than habitat generalist species; a pattern already observed in the first three years of the experiment and holding true over the whole duration of the experiment [38]. Despite reduced colonization rate and a tendency of increased extinction rate in fragments in two sites in the later period of the experiment, fragments had only marginally fewer plant species than control plots in the final year of our study.
Stoll et al. [40] used a mark-release-resight approach to assess the population sizes and extinction and recolonization frequencies of six land snail species, which ranged in adult shell size from 1.4 mm to 17.0 mm in all fragments and control plots from the second to fourth year of the experiment. Experimental grassland fragmentation influenced the population size in all snail species except Helicella itala, which is the species with the biggest shell (17.0 mm). This species is also active under mild conditions in winter, thus increasing the chances to cross the matrix [64]. Extinction frequency (disappearance from a plot) increased with time, decreasing population size, and decreasing plot size in all species [40]. The experimental fragmentation increased the probability of extinction, which also differed among snail species. The effect of plot size on extinction probability was still significant even after the effect of population size had been taken into account. Fragments and control plots did not differ in recolonization frequencies when all six species were considered. However, fragmentation influenced recolonization frequency when the two species with large shells (H. itala and Trichia plebeia [8.5 mm]) were excluded from the analysis.

3.8. Delayed Reduction in Functional Dispersion in Fragments

The response of a species to habitat fragmentation may depend on its morphological and life-history traits. It is therefore expected that species assemblages in fragments would harbor species that, on average, differ in their traits from those in control plots. Thus, functional diversity might be affected by fragmentation. Functional dispersion (FDis) is a measure of functional richness, which considers the species’ relative abundances by estimating their dispersion in a multi-dimensional trait space [65]). We expected that FDis of assemblages in fragments is smaller than that of assemblages in control plots. However, FDis of gastropods (snails and slugs) was not affected by the experimental fragmentation in large fragments and control plots in the fourth to final year of the experiment [43]. Conversely, if only snails (shelled gastropods) were considered, FDis was lower in large fragments than control plots in the final year of the experiment.
We reanalyzed data on orthopterans recorded in large fragments and control plots from Braschler et al. [39] using the dispersal mode as presented in that paper and mean body size, feeding guild, and stratum use as reported in Gossner et al. [66] and the website Orthoptera.ch [67]. FDis of orthopterans did not differ between large fragments and control plots in any year after applying Bonferroni correction to the statistical tests.

3.9. Species Interactions Responded Strongly to Fragmentation

3.9.1. Changes in Herbivore Abundance Altered Extent of Plant Damage

Habitat fragmentation influences herbivores through changes in the relative abundance of different plant species, edge effects on plant growth, and altered microclimatic conditions caused by changes in vegetation structure [19,48]: all of which was also the case in our grassland fragments [28,36]. The isolation of fragments may also lead to reduced predator and parasitoid pressures on herbivores provided that predators and parasitoids search over larger areas than that of a single fragment for their prey/host or arrive only with a delay [68]. As a consequence, herbivore populations may initially have higher growth rates in fragments than in unfragmented habitats [69].
In individually tagged leaves of Stachys officinalis, the extent of damage (% leaf area removed) increased over the vegetation period in the sixth year of the experiment [37]. Fragmentation significantly affected the extent of leaf damage in autumn but not in spring and summer [37]. Plot size also affected the extent of leaf damage in spring and autumn. Rosettes in large fragments and control plots were more severely damaged than those in small plots [37]. Gastropod density (recorded in the same year) and the extent of leaf damage in fragments were positively correlated in two of the three sites [37]. The fact that the fragmentation effect on leaf damage of S. officinalis rosettes was only significant in autumn indicates the importance of cumulative effects over the growing season.
In an approach avoiding cumulative effects, Ledergerber et al. [32] used standardized food offers (petri dishes with Trifolium repens seedlings exposed in all fragments and control plots for 2–3 days both in summer and autumn in the fourth year of the experiment) to assess grazing damage. In summer, grazing intensity (expressed as leaf biomass loss per petri dish and day) was 43% lower in fragments than in control plots [32]. Grazing intensity in summer was positively correlated with relative gastropod density (number of individuals from 12 species found per plot) but not with the relative density of grasshoppers (number of individuals from 15 species recorded per plot). In autumn, no fragmentation effect on grazing intensity was found, and grazing intensity was correlated neither with gastropod nor grasshopper density [32]. A combination of factors can explain the seasonal difference in fragmentation effect on grazing intensity using standardized food offerings. Different herbivore species are active at different seasons and/or under different environmental conditions. Furthermore, different herbivore species react differently to the type of grassland fragmentation chosen in our experiment [32]. This example shows that fragmentation effects may also vary with season.
Our experimental fragmentation also affected the abundance of sap-sucking insects. Aphids (all species combined) had more colonies in fragments than in control plots, and the mean colony size was larger in fragments, resulting in higher aphid densities in all three years examined (fifth to seventh year of the experiment; [34]). Braschler et al. [34] analyzed the infestation rates of twelve abundant host plant species in Vicques and Nenzlingen separately. In 5 out of 23 fragment–control plot comparisons (one host plant species only occurred in one site), potential hosts showed a higher infestation rate in fragments than in control plots [34]. In contrast, none of the host plant species were more frequently infested in control plots [34]. These findings were not influenced by differences in the abundance of host plant species between fragments and control plots. Some other studies have investigated the effect of habitat fragmentation on invertebrate herbivores with contrasting results. For example, different aphid species responded in different ways to fragmentation of alfalfa cropland [70]. Kareiva [68] reported more frequent aphid outbreaks in experimental fragments of goldenrod fields. Little or no effects of fragmentation on species richness and abundance were found in stem-boring insects of fragmented habitats dominated by the grass Calamagrostis epigeios [71].

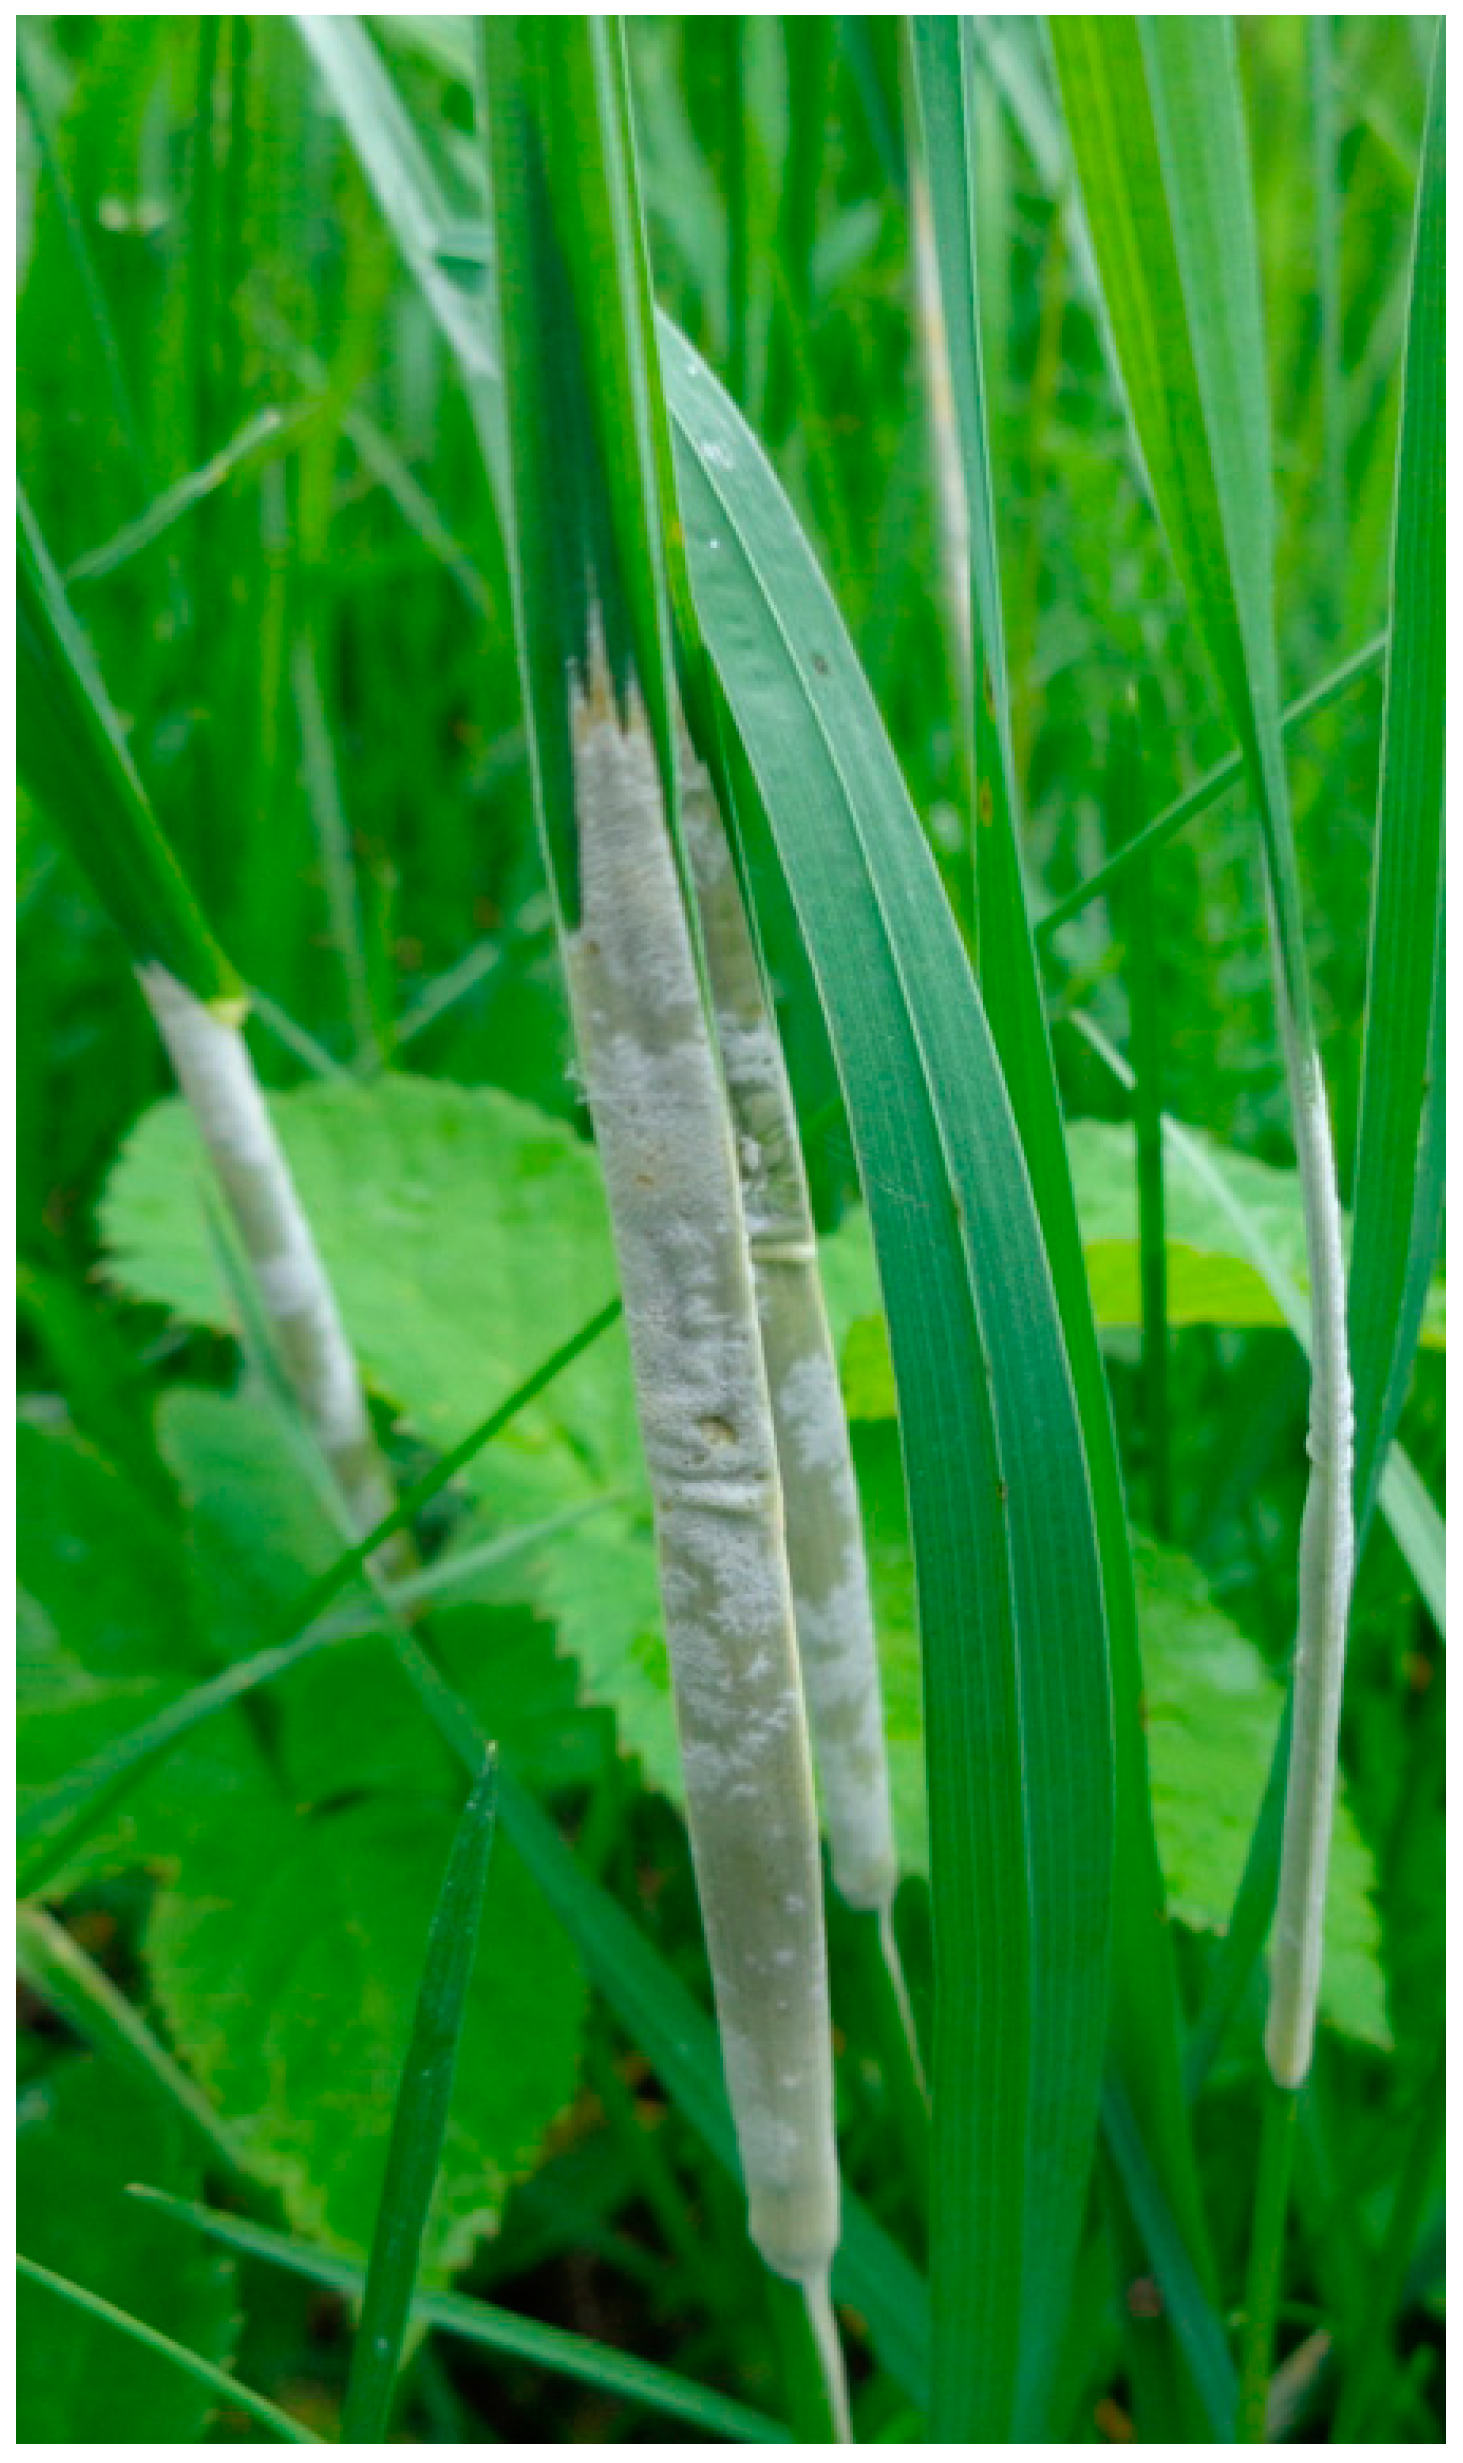
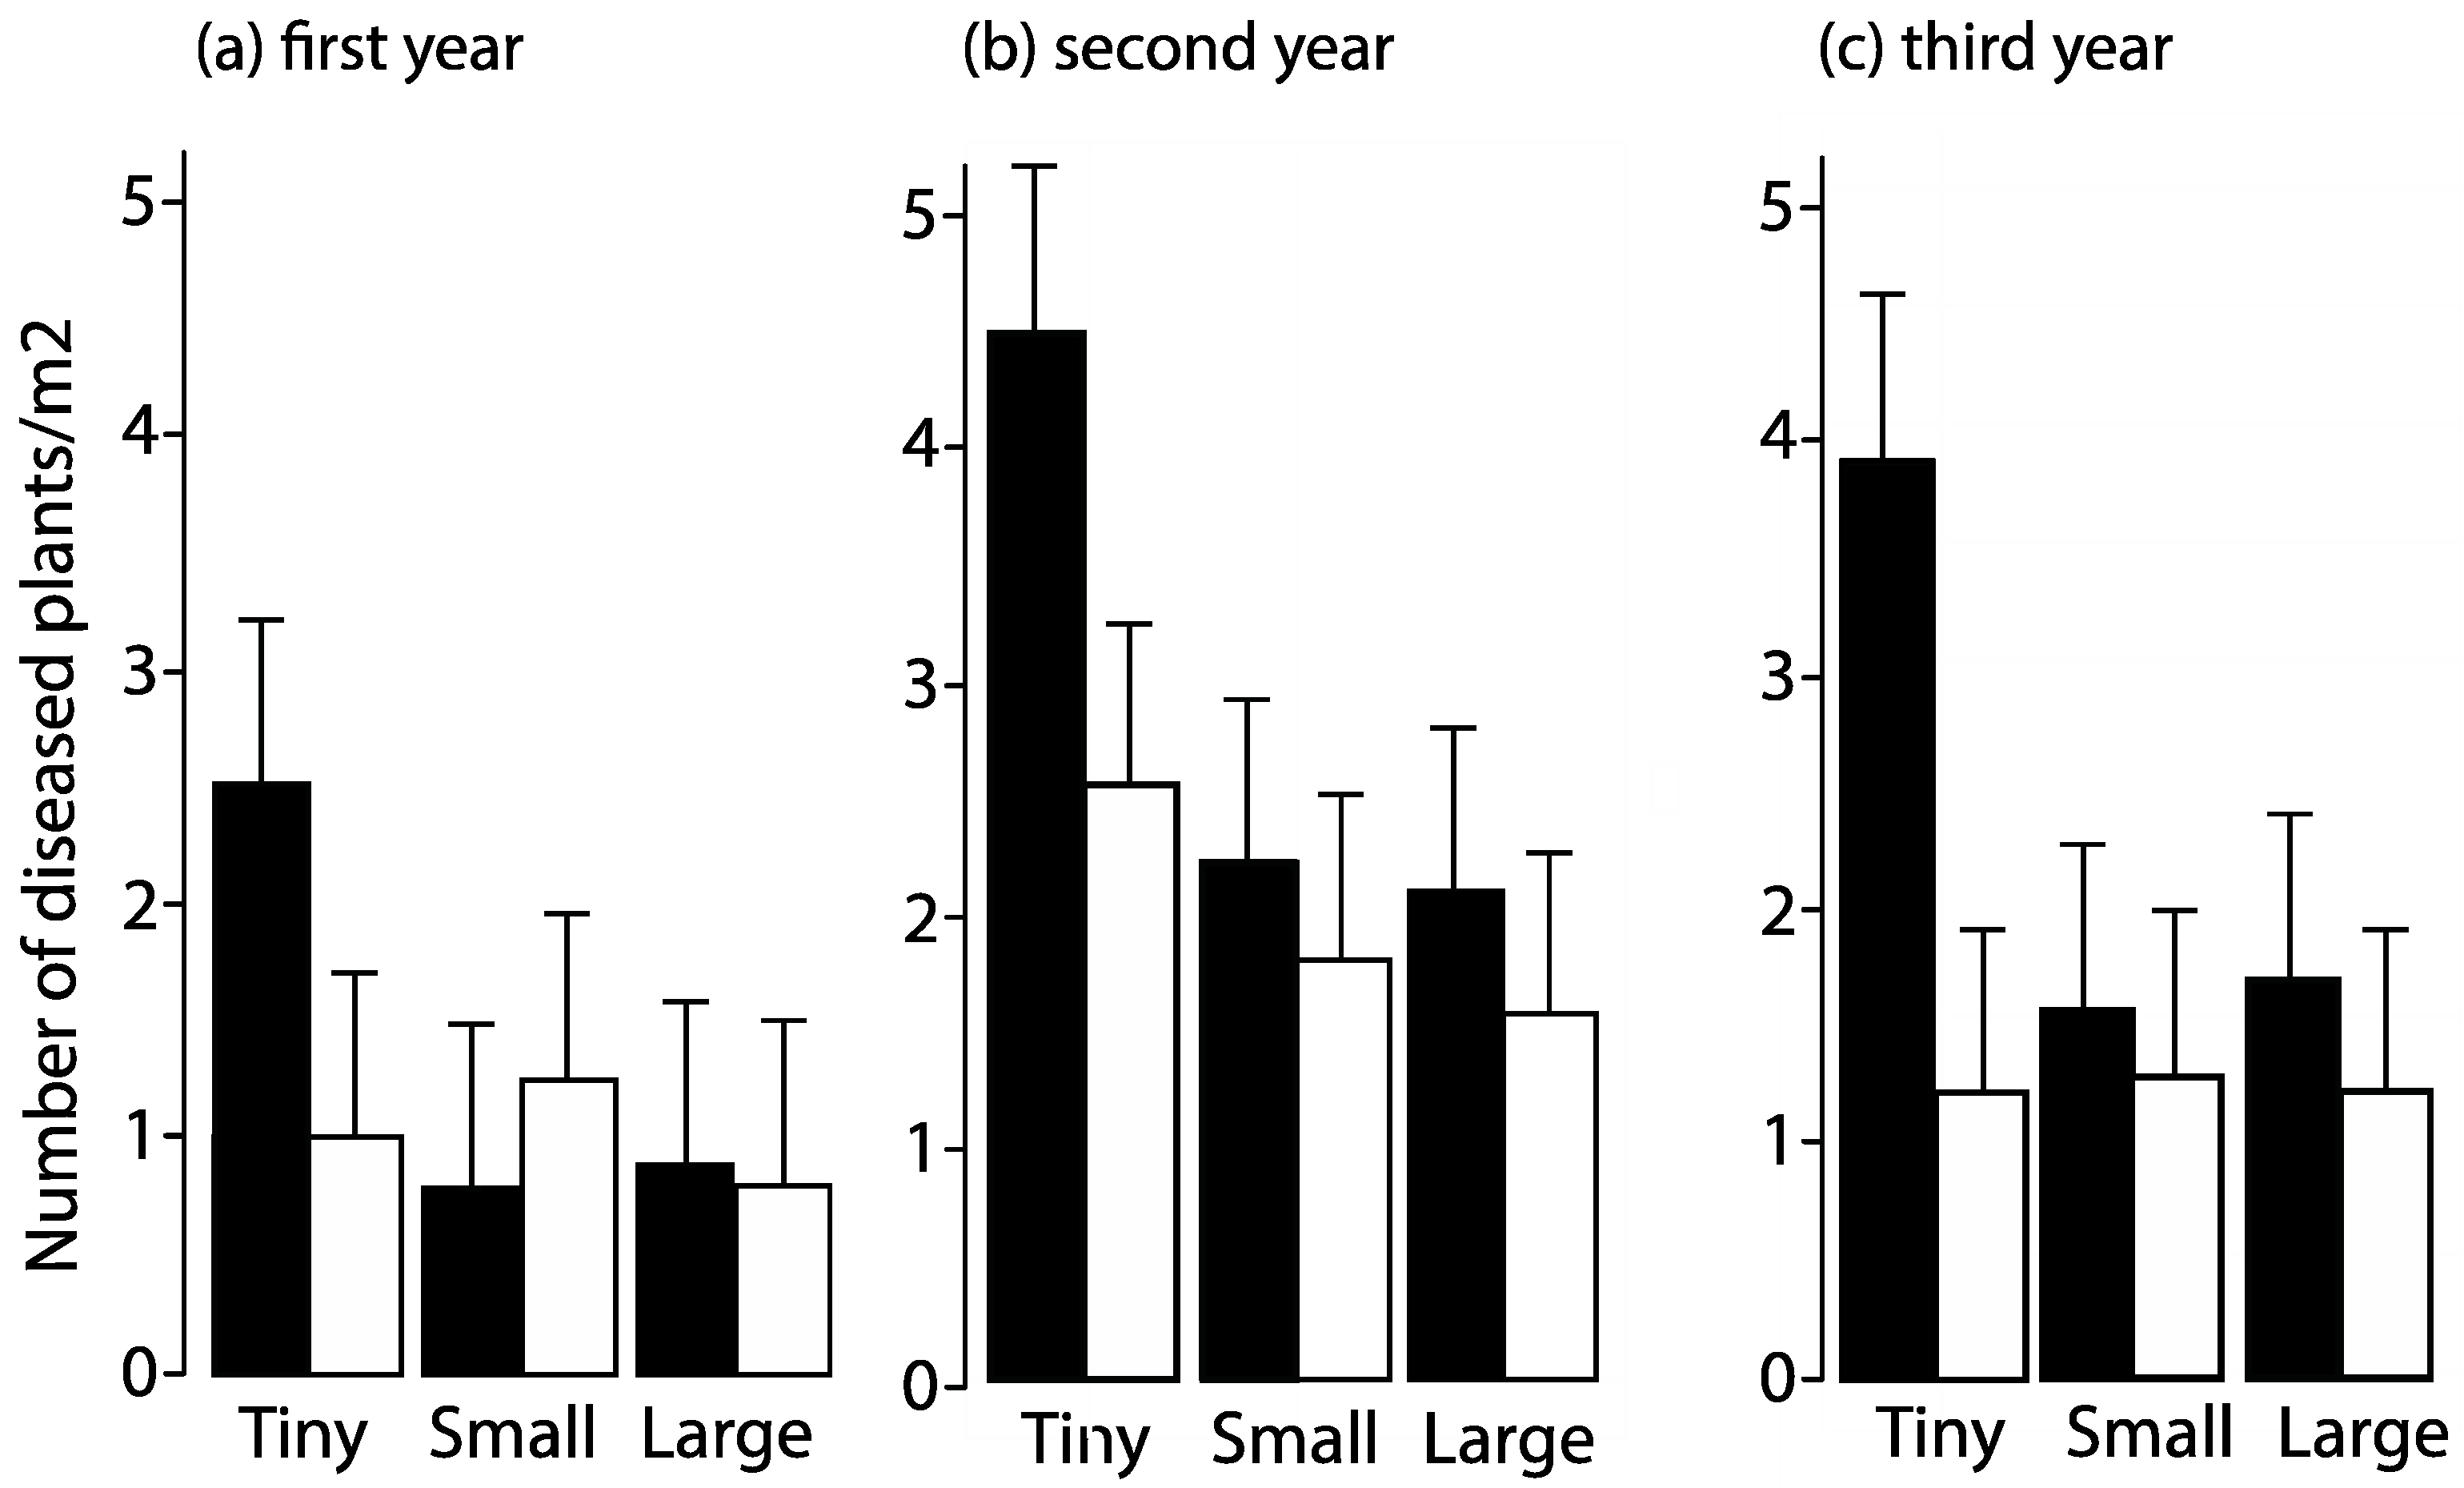
3.9.2. Fragmentation Affected the Prevalence of a Fungal Disease

Habitat fragmentation may influence parasitism rates, for example, if it takes longer for a host to be discovered in a fragmented landscape [69]. In our fragmentation experiment, however, parasitoid pressure on aphids (assessed through the proportion of mummies) was not affected [34]. This finding contrasts with those of other experiments in which hosts in habitat fragments experienced reduced parasitism pressure [69,72] or predator release [68]. Many effective parasitoid species may be themselves rare as they maintain their hosts at low density. Disruptions caused by habitat loss and fragmentation may thus have disproportional effects on these interactions [73].
Fragmentation-induced changes in biotic and abiotic factors can disturb host–pathogen interactions. Bromus erectus is the most characteristic grass species of nutrient-poor, dry calcareous grasslands in the Swiss Jura mountains [27]. This grass species is the host for the fungal pathogen Epichloë bromicola (Figure 5). The fungus infects the flowering tillers of B. erectus and causes the abortion of developing inflorescences, which can result in a total failure of sexual reproduction. In our experiment, Groppe et al. [30] found a significant increase in the number of Bromus erectus flowering tillers infected by E. bromicola in fragments in the first 3 years. The number of infected flowering tillers in fragments increased with the duration of the experiment (Figure 6). The largest increase in the number of flowering tillers with infected inflorescences was recorded in tiny fragments, followed by small and large fragments [30]. This was probably due to both a switch of genets from the asymptomatic to the symptomatic state and to increased horizontal transmission of the disease in fragments. Interestingly, however, the increase in the number of flowering tillers with infected inflorescences was outweighed by that in the number of tillers with healthy inflorescences [30]. Disease incidence was therefore decreased by fragmentation if assessed at the level of the host flowering tiller population. The effect on healthy plants was probably due to beneficial abiotic edge effects following fragmentation [30]. Significant site-to-site and year-to-year variation in the number of diseased plants and in the number of tillers with diseased inflorescences were recorded.

3.9.3. Altered Mutualistic and Competitive Interactions in Fragments

Habitat fragmentation can affect mutualistic interactions if the abundance of one or the other of the partners involved or even of alternative partners is affected [74]. Changes in mutualistic relationships may in turn influence the abundance of the partners involved [75]. Many, though not all, aphid species recorded in our experiment are ant-attended. Both aphids and ants were more abundant in large fragments than in corresponding control plots in some of the years examined (aphids in all three years examined; ants in the seventh year but not in fourth year; [34]). This may have affected the proportion of ant-attended aphid colonies, which was larger in fragments than in control plots [34]. This effect may have been further modified by the relative abundance of plant species offering alternative sugar resources, as several of the ant species visiting aphid colonies were also observed at extrafloral nectaries in the experimental plots [35].
Intra- and interspecific competitive interactions can be altered when habitat fragmentation affects species composition or the availability of resources [76,77]. Ant assemblages are frequently structured by competition [60]. In nutrient-poor, dry calcareous grasslands, most ant species are food generalists and have simple soil nests or soil nests with mounds [78]. In our experimental plots, the spatial distribution of nests was either random or overdispersed [33], the latter indicating competition among colonies [76,77,79]. However, nearest neighbor distances among nests of all species, or of nests of the numerically dominant species considered separately, were not affected by the experimental fragmentation in the fourth and the final year [33]. The species richness of other ant species decreased with the increasing density of the numerically dominant ant species Lasius paralienus in fragments but not in control plots [35]. The relationship between the nest density of L. paralienus and that of other species was U-shaped in fragments, while no relationship was observed in control plots [35]. The relationship between the total number of nests of each ant species in a plot and its habitat niche overlap with L. paralienus was hump-shaped in control plots, while no relationship was found in fragments [35]. In contrast, the overall forager density of the other species was positively related to their habitat niche overlap with L. paralienus both in fragments and control plots, and the density of foragers of the other species at sugar resources (aphids, extrafloral nectaries, and artificial sugar baits) was not significantly affected by L. paralienus forager density [35]. The experimental fragmentation resulted in an increase in natural sugar resources in fragments, which may have reduced interspecific competition for this resource [33,35].

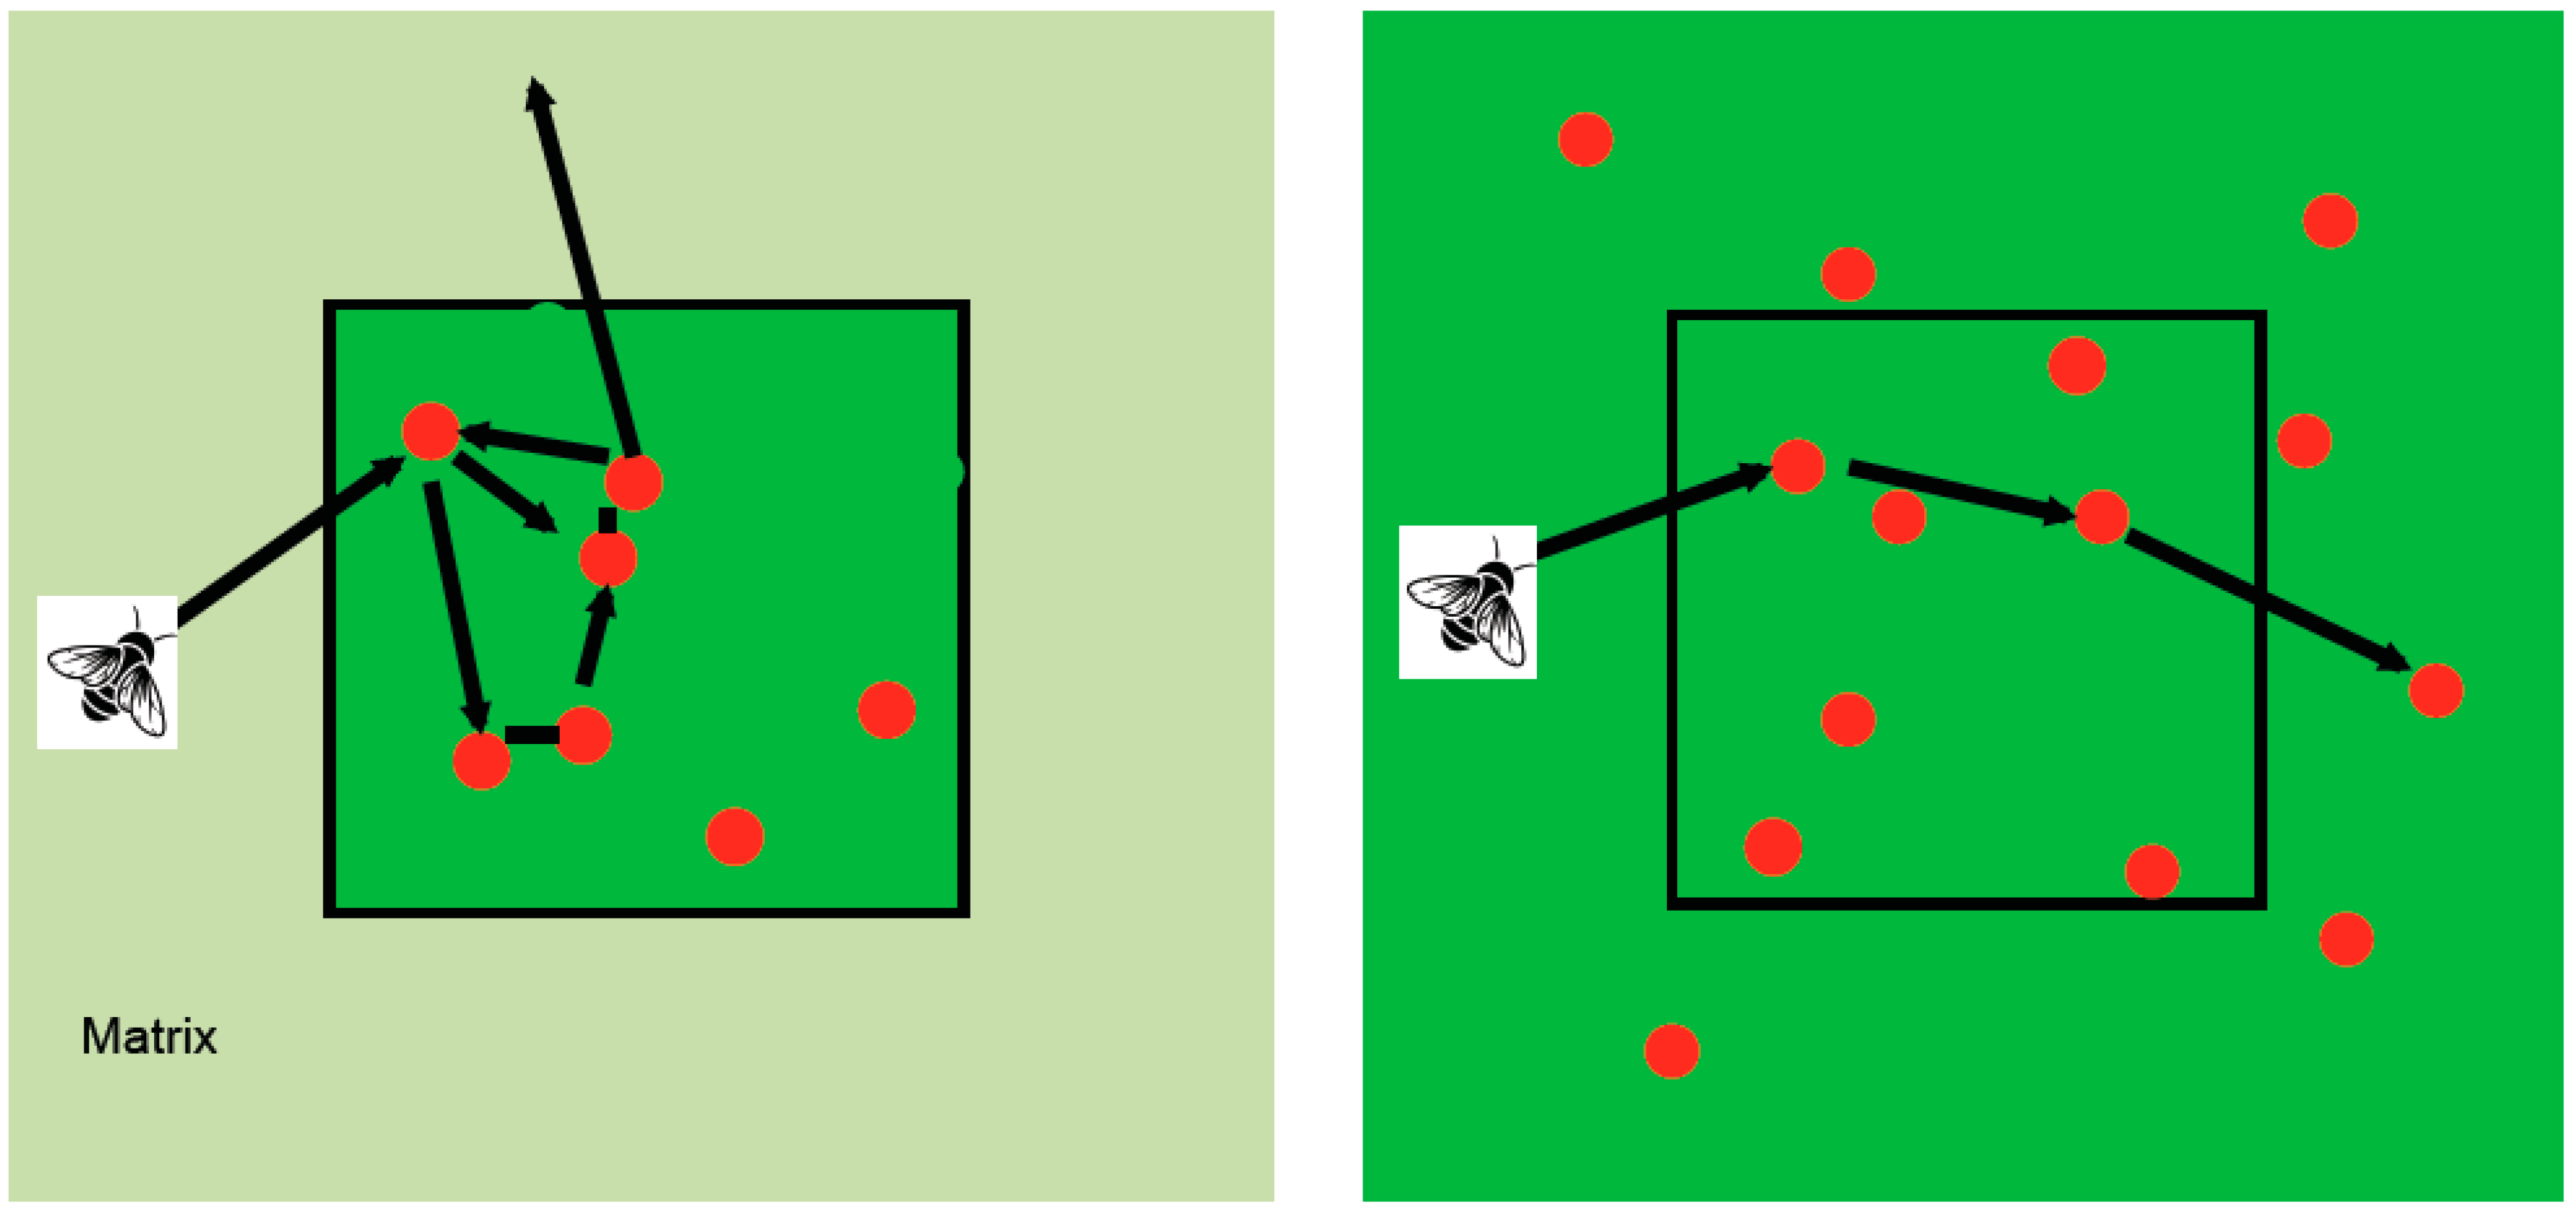
3.9.4. Fragmentation-Related Changes in Pollinator Behavior

Pollinators are of crucial importance for ecosystem functioning [80,81]. Habitat fragmentation can affect both the abundance and species composition of pollinators and thus reduce the pollination of various plant species, which may negatively influence the reproductive success and fitness of plants [82]. Animal foraging behavior may change immediately in response to habitat fragmentation, which in the case of pollination will then further affect the genetic diversity of plants.
In our experiment, Goverde et al. [31] and Rusterholz and Baur [41] examined fragmentation effects on the flower-visiting patterns of pollinators of Stachys officinalis inflorescences and the resulting fitness consequences for the plant. Goverde et al. [31] found that the bumblebee Bombus veteranus was the most frequent visitor of S. officinalis inflorescences (69%), followed in decreasing order by Zygaena spp. (13%), other Hymenoptera (11%), other Lepidoptera (4%), and Diptera (3%) in small fragments and control plots in the sixth year of the experiment. However, individuals of B. veteranus visited fragments less frequently than control plots (a reduction of 54%). Fragmentation also altered the foraging behavior of B. veteranus [51]. Bumblebees visited more S. officinalis inflorescences (frequently neighbor plants) in fragments than in control plots (Figure 7). This resulted in a slightly higher visiting time of S. officinalis inflorescences in fragments than in control plots [31,41]. This finding was not influenced by the densities of S. officinalis rosettes and inflorescences, which did not differ between fragments and control plots.
The foraging behavior of bumblebees is plastic and can easily be adjusted to changes in the environment and food resources [83,84]. The nectar reward of S. officinalis inflorescences, an important energy resource for bumblebees, was reduced in fragments [51]. Thus, the altered foraging behavior might be a result of bumblebees optimizing their net energy gain by considering all available S. officinalis inflorescences in fragments [83,85].
Rusterholz and Baur [41] reported that the inflorescence visitation rate of S. officinalis plants was not yet affected after 3 years of experimental fragmentation but significantly reduced in fragments in the final year of the study (by 25% in large fragments and by 40% in small fragments). Fragmentation-induced changes in the patchiness, size, and density of floral resources can be responsible for an alteration in flower visitation behavior [86,87]. This is not the case in our studies because the rosette and inflorescence density, as well as inflorescence length, of S. officinalis were similar in fragments and control plots [41]. Fragmentation also caused a significant shift in the composition of inflorescence visitors in the third and final year of the experiment [41].
The lower visitation rate of S. officinalis inflorescences in fragments and the altered foraging behavior of bumblebees point to a decrease in gene flow, which in turn may affect the breeding system of the plant [82]. The reproductive characteristics (seed set, seed weight, and germination rate) of S. officinalis, examined in the first, third and seventh year of the experiment, were not influenced by fragmentation [41]. Similar responses have frequently been reported for self-compatible plants such as S. officinalis with various pollinators [88,89]. However, the outcrossing frequency in S. officinalis was reduced in fragments (Figure 8). The extent of reduction increased with the duration of the experiment, from 15% in the third year to 33% in the seventh year.

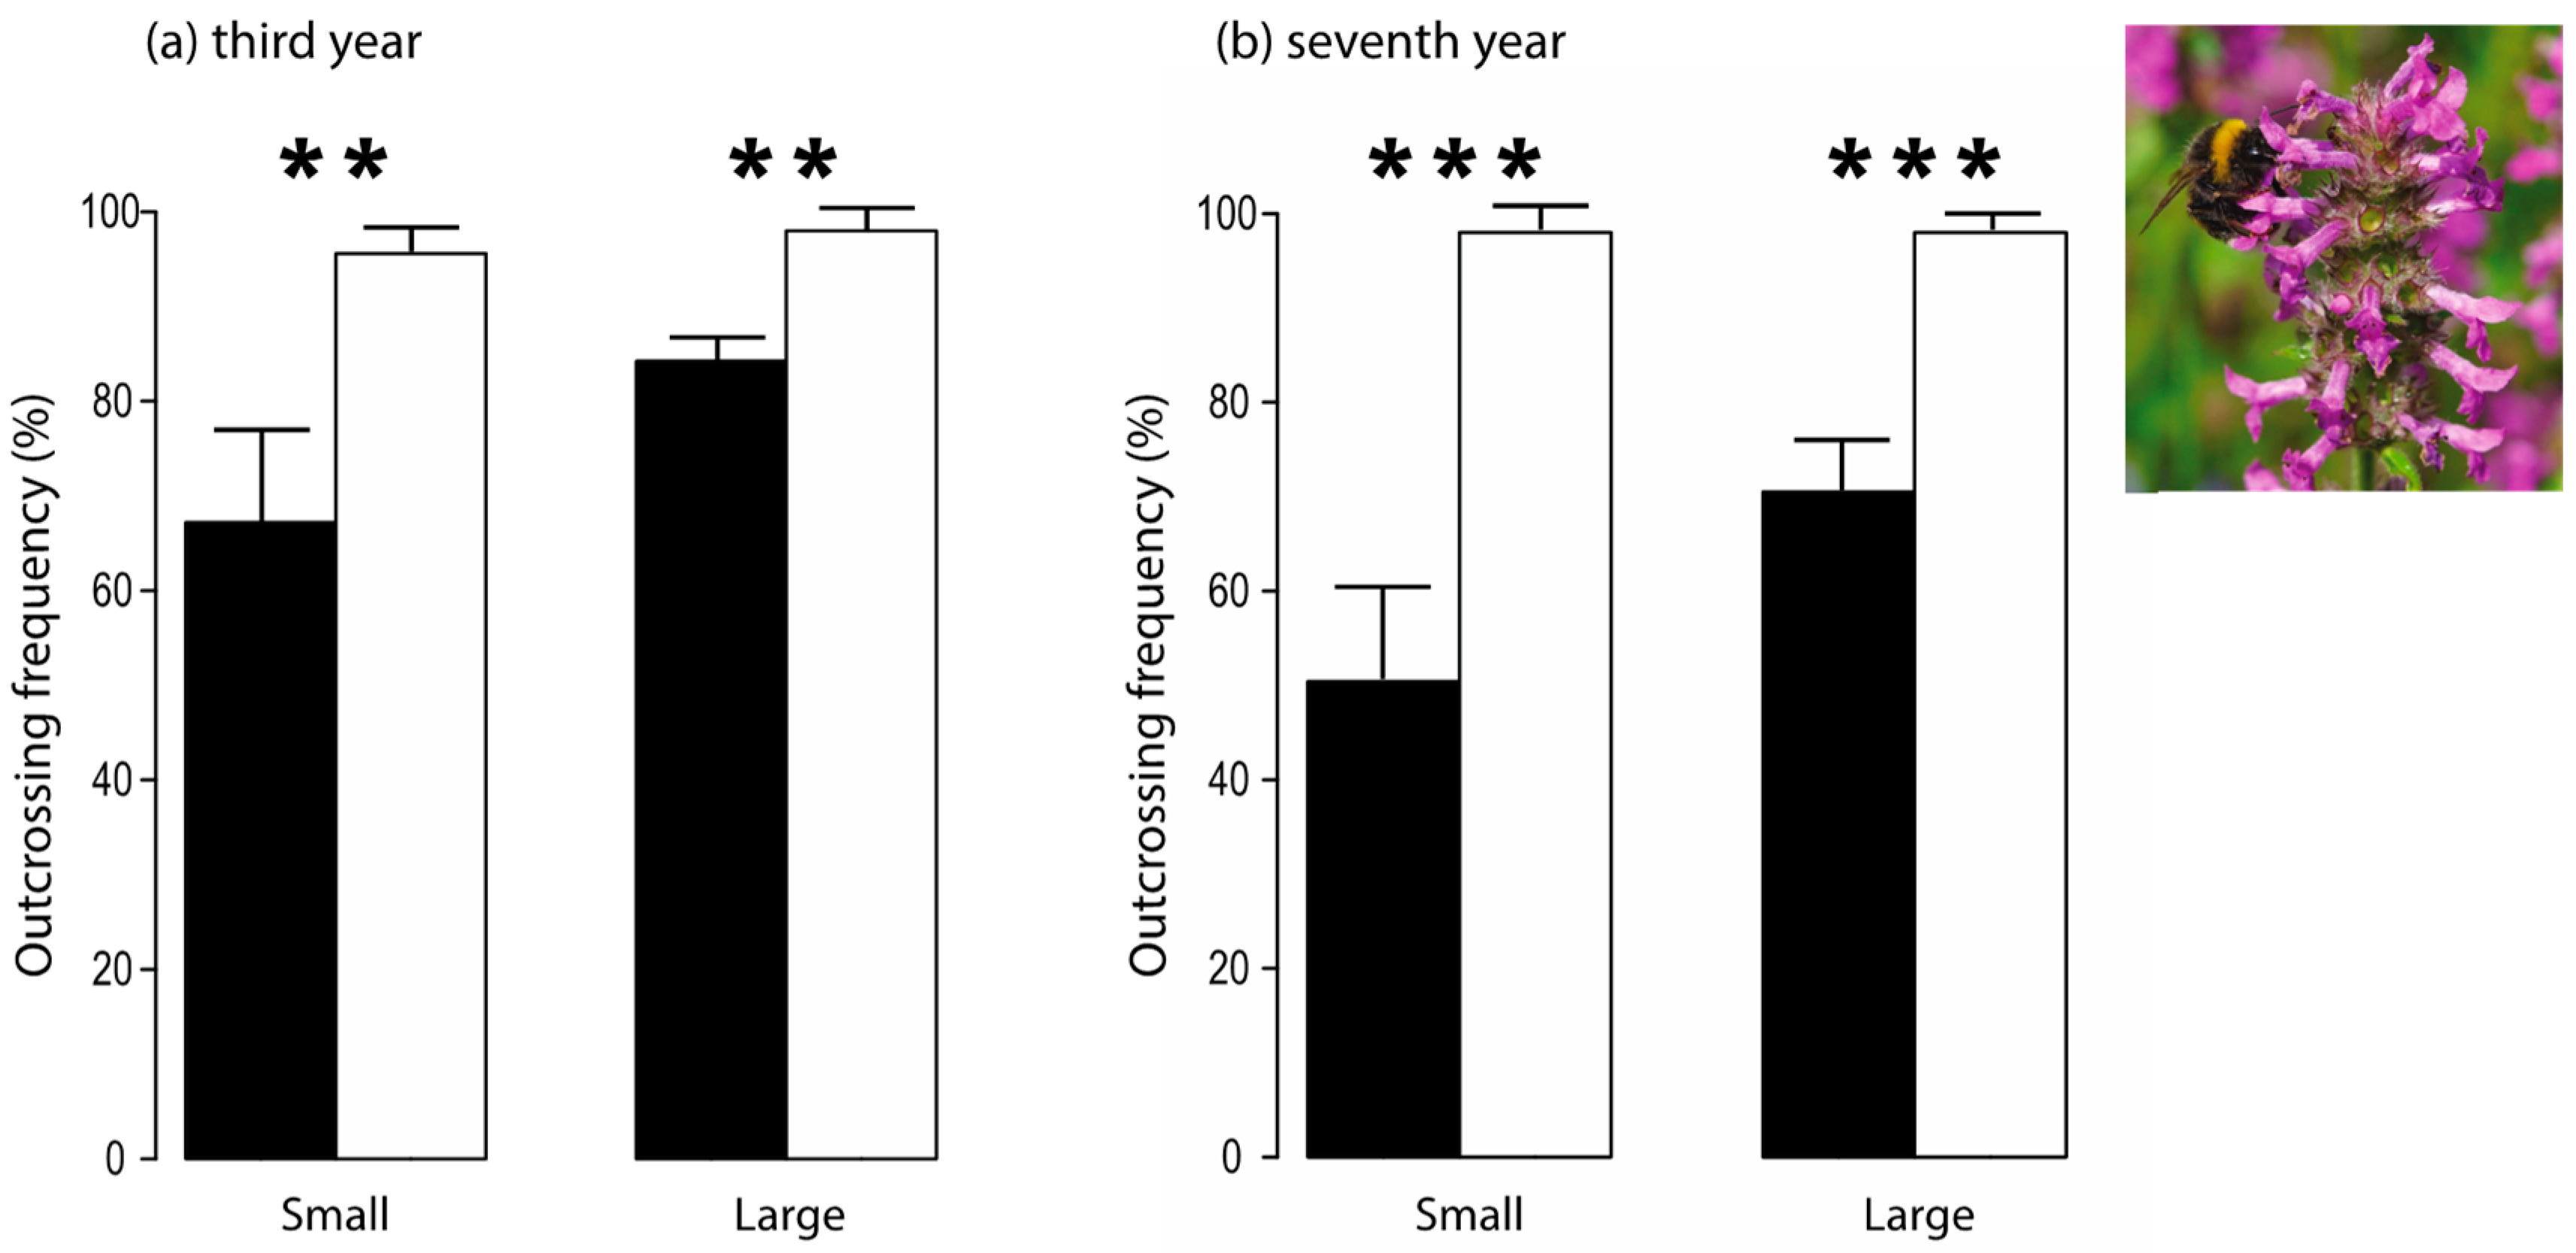
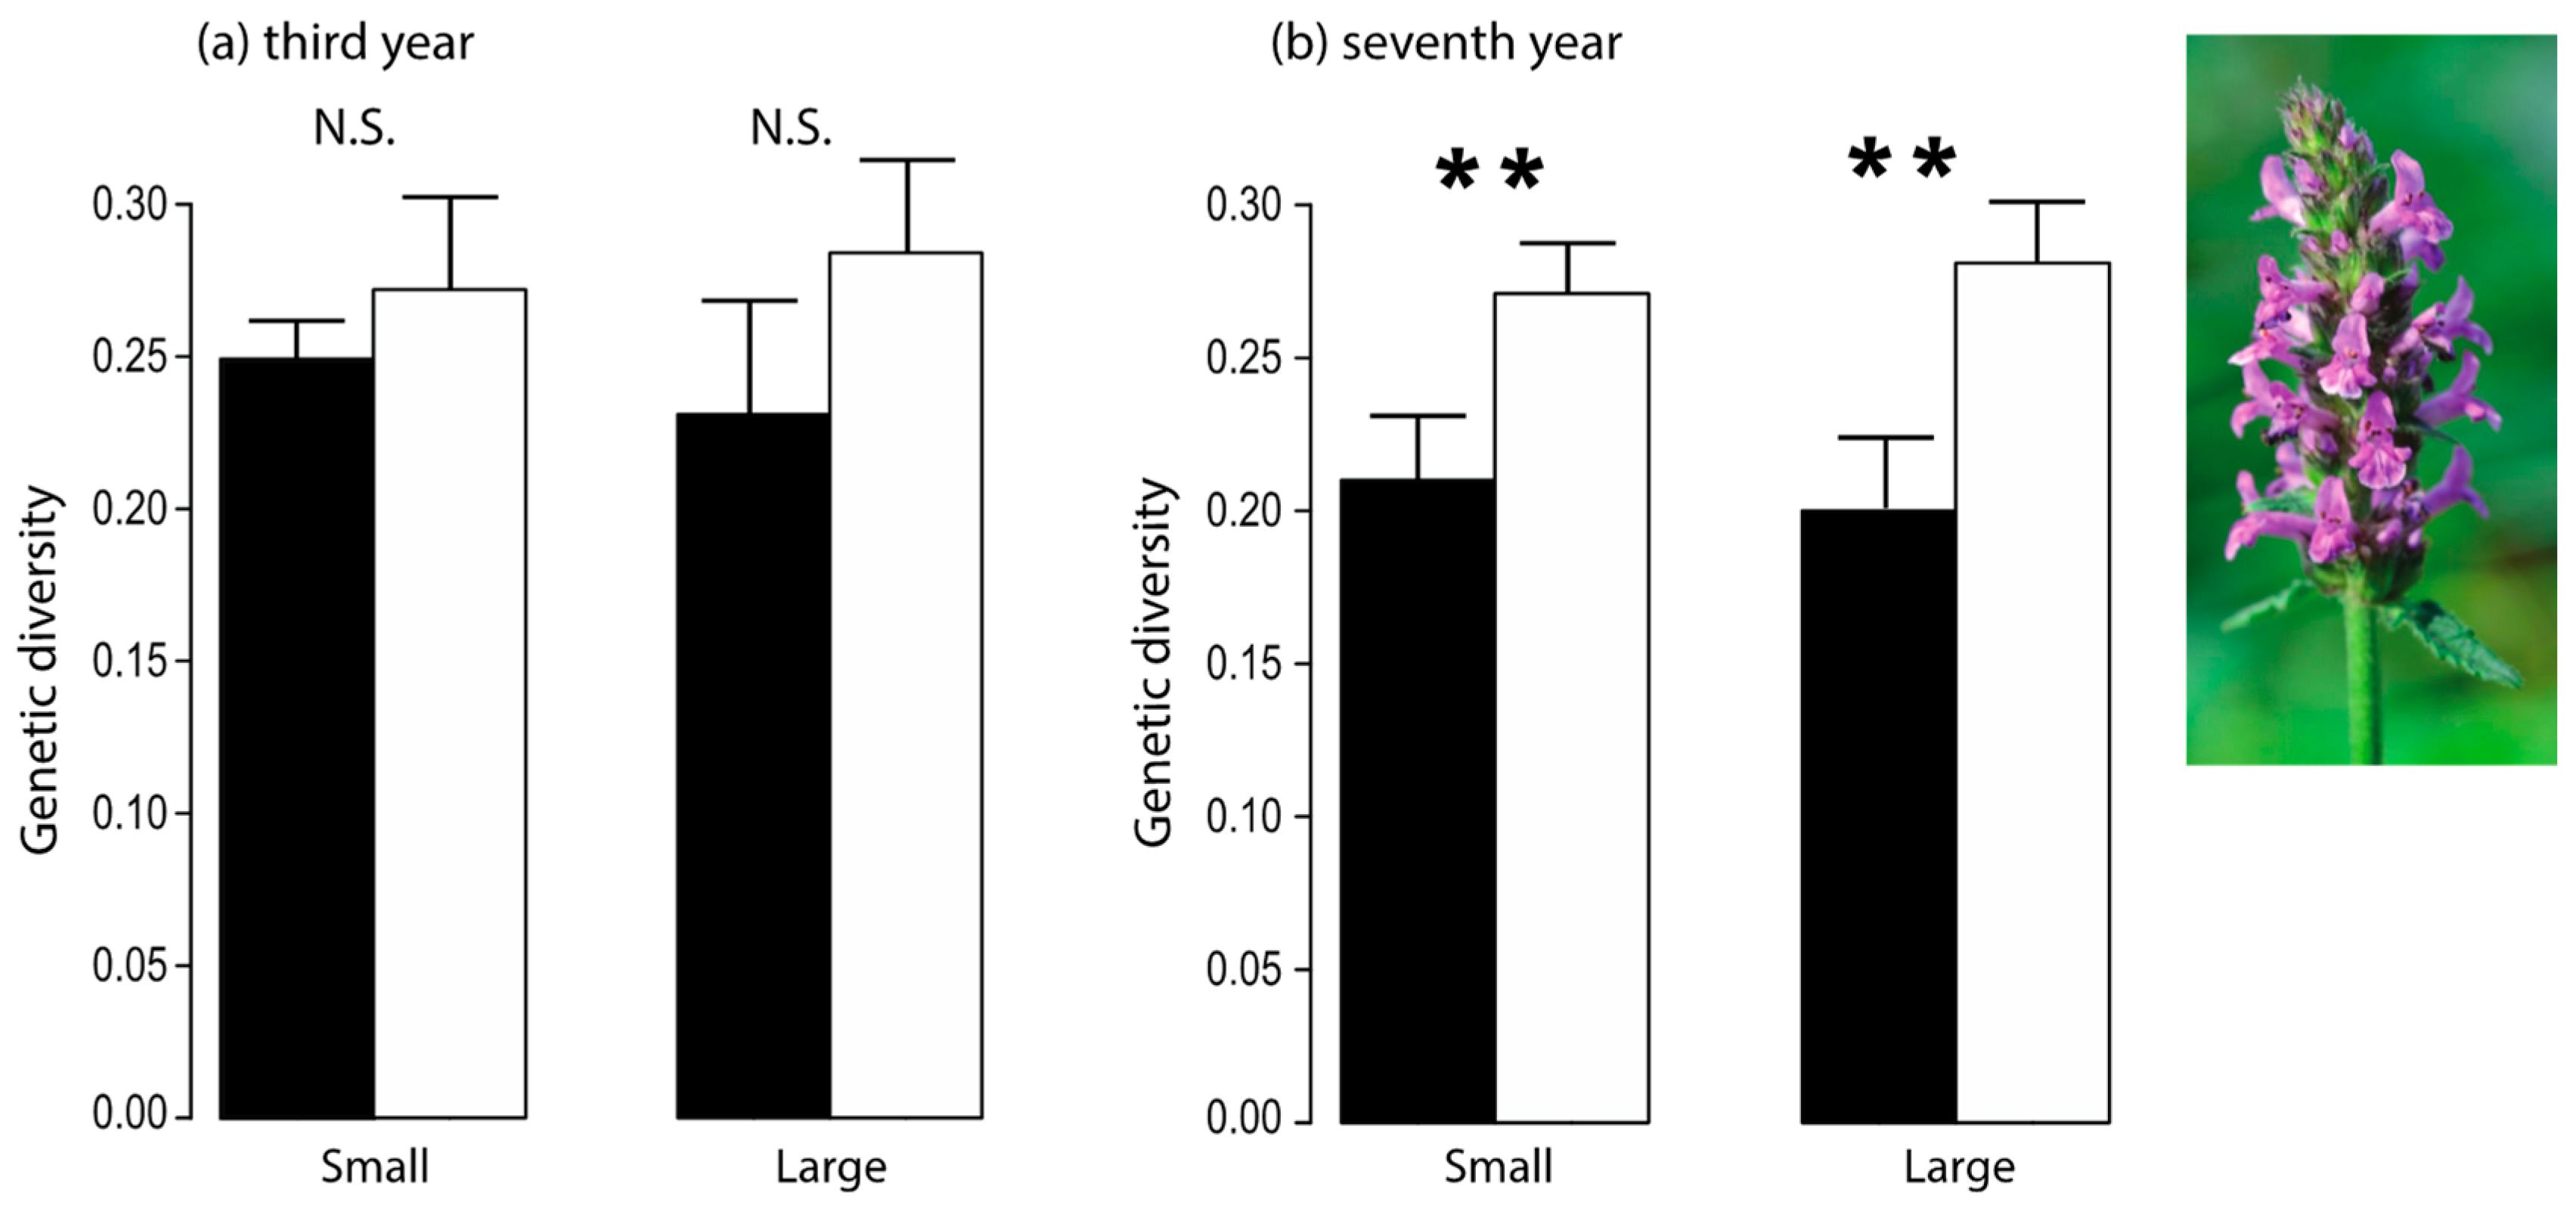
3.10. Fragmentation-Related Changes in Pollinator Behavior Led to Reduced Genetic Diversity in a Plant Species

Habitat fragmentation leads to small and isolated populations [4]. The combination of increased random genetic drift, inbreeding and reduced gene flow may substantially reduce genetic variation in remnant populations [90,91]. The loss of genetic variation in turn may negatively influence population viability and fitness in the short- and long-term [92]. In the short-term, an increase in degree of homozygosity leads to the expression of deleterious alleles, which reduce individual fitness through inbreeding depression [90,93]. In the long-term, a reduced genetic diversity decreases the potential of a species or population to adapt to changing environmental conditions [94,95].
In plants, self-incompatible species are more likely to lose genetic diversity through genetic drift than self-compatible species [96]. Besides the breeding system other life-history traits including longevity influence the genetic response to habitat fragmentation [97,98]. In our experiment, fragmentation-related changes in pollinator foraging reduced the outcrossing frequency in Stachys officinalis, which in turn led to a time-delayed decrease in genetic diversity in the self-compatible plant [41]. In the third year of the experiment, the genetic diversity of S. officinalis seedlings reared from collected seeds did not yet differ between fragments and control plots [41]. However, in the seventh year of the experiment, genetic diversity of the seedlings was significantly lower in fragments than in the control plots (Figure 9; [41]).

3.11. Differing Responses to Fragmentation Can Be Explained by Species Traits

Species- or group-specific responses to habitat fragmentation can also be explained by differences in morphological and life-history traits and/or in behavior. For example, for invertebrate species partly active during winter, the barrier effect of the mown matrix is almost absent [40].

3.11.1. Smaller Species Were More Frequently Adversely Affected by Fragmentation

Body size can influence a species’ response to fragmentation through its relationship with dispersal ability, as well as through resource and habitat size requirements [100,101]. Generally, larger species require larger home ranges, which may lead to their absence in small fragments. On the other hand, large body size is frequently related to increased dispersal ability [100,102]. Therefore, large species may be more likely to reach isolated fragments. Body size has thus been frequently considered as a factor in studies on the effects of habitat fragmentation on biodiversity but with varying findings [100].
In our experiment, Braschler and Baur [42] studied the effect of standardized adult body size on species’ responses (individual density) to fragmentation in gastropods, ants, ground beetles, rove beetles, the orthopteran Gryllus campestris, spiders, and woodlice collected with pitfall traps in the final year of the experiment. Overall, there was a significant relationship with larger species responding more positively to fragmentation (having higher densities in fragments than in control plots), while smaller species responded more negatively (lower densities in fragments than in control plots). However, considering the groups separately, the relationship was only significant for gastropods [42]. In contrast, using data from non-invasive cardboard traps, Braschler et al. [43] found no significant fragmentation effect on the mean body size of snail assemblages (shelled gastropods) in the fourth to final years of the experiment.

3.11.2. Species with Certain Life-History Traits Were More Abundant in Fragments

Many of the invertebrate species occurring in calcareous grasslands have relatively short generations. Thus, in our 7-year experiment, such species went through several generations, and we therefore expected strong responses in these species, which in turn may contribute to changes in trait distributions in species assemblages in fragments.
Large fragments harbored a higher proportion of gastropod individuals (slugs and snails combined) belonging to species with an age at sexual maturity <1 year than large control plots only in the final year of the experiment but not in the three preceding years [43]. However, fragments also had a higher proportion of gastropod species with long lifespans (>2 years) than the corresponding control plots in the final year [43]. Thus, on average, gastropods in fragments belonged to species maturing earlier but living longer than those in control plots.

3.12. Species-Specific Humidity Preferences Could Hardly Explain Fragmentation Responses

Habitat suitability for a species may be altered through fragmentation-induced changes in microclimatic conditions and vegetation structure (edge effects; see Section 3.2 and Section 3.3). These changes may be reflected in the average preference for higher or lower humidity and temperature of the species forming the assemblage in the fragment.
Experimental habitat fragmentation affected the proportion of gastropod individuals with different humidity preferences [43]. Fragments contained a higher proportion of individuals showing a preference for moist conditions (as opposed to dry or wet conditions) than control plots in the fourth and seventh year of the experiment [43]. Using pitfall trap data from the final year to examine the role of habitat preferences, no correlation between a species’ response to fragmentation (t-value for the factor fragmentation from an overall model) and its humidity preference (indicator values or ordinal scale depending on the group) was found for each of the three groups examined (gastropods, ants, and rove beetles [42]). The same approach revealed that ant species that prefer colder temperatures were relatively more abundant in fragments than in control plots [42]. Data on species-specific temperature preferences were not available for the other groups.

3.13. Habitat Specialists Were Generally More Adversely Affected by Fragmentation

Fragments may be too small for some habitat specialist species. In contrast, habitat generalist species, which are also able to use the matrix, may increase their relative abundance in fragments. We therefore expected fragments to have a relatively higher share of individuals belonging to habitat generalist species than control plots. Braschler et al. [43] found that the proportion of gastropod individuals, which belong to habitat generalist species (determined based on literature data), was higher in large fragments than in large control plots in the final 2 years of the experiment, with the difference being marginally significant in 1998 but strongly significant in 1999. In the two preceding years, there was no significant difference between fragments and control plots regarding the share of habitat generalist gastropods [43]. This indicates that the effect of the fragmentation increased over time.
Species with high occupancy in control plots can be assumed to be well adjusted to the environmental conditions of these grasslands. Conversely, these species may be more likely to respond negatively to the changed conditions in fragments than species that are less specialized for the original conditions. Indeed, in spiders, there was a negative relationship between a species’ occupancy in control plots and its response in individual density to the experimental fragmentation (expressed as t-value for the factor fragmentation from an overall model) in the final year of the experiment [42]. No such relationship was found for gastropods, ants, ground beetles, rove beetles, and woodlice [42].

3.14. Long-Term Research Allowed Serendipitous Findings

3.14.1. Extending Biological Knowledge and Testing Methods

Associated research conducted in fragments, control plots, or adjacent grassland contributed to the understanding of the ecosystem and the interpretation of the findings in the fragmentation experiment. Oggier [64] investigated the circadian and year-round activity of the land snails Candidula unifasciata and Helicella itala and found that individuals of both species are also active during warm and rainy periods in the winter months. These results were important to interpret the patterns observed in Stoll et al. [40] and Braschler et al. [43].
Not all survey methods are equally suitable to assess different groups of organisms in different habitat types [54]. Therefore, research was also conducted to develop or adjust survey methods to the grassland ecosystem. Oggier et al. [103] compared three different methods (mark-release-resight, cardboard trapping, and soil sampling) to assess the community structure of terrestrial gastropods in the grasslands. Cardboard trapping appeared to be best suited to examine population biological questions in selected species distributed over relatively large grassland areas, while stratified soil sampling might be the most reliable method to obtain complete species lists (species richness) in small grassland areas [103].
Ecological processes and interactions between species are often scale dependent [104]. Using the control plots of the experiment, we examined the grain dependence of the relationships between productivity (above-ground plant biomass), species richness of plants and herbivores (gastropods and grasshoppers), and the biomass of these consumers [45]. Significant relationships at the smallest grain size (0.5 m2) were hump-shaped, while all significant relationships at larger grain sizes were linearly decreasing [45]. This background information also helps to interpret findings from habitat fragmentation experiments at different spatial scales.
Niemelä and Baur [105] examined the among-site variation of threatened species in the three grasslands. As many as 58 (22%) of the 266 species of vascular plants, gastropods, butterflies, grasshoppers, and ground beetles collected were considered as threatened in northern Switzerland, confirming the high conservation values of these nutrient-poor, dry calcareous grasslands. The number of threatened species ranged from 27 to 49 per site, and 26 species occurred only in one of the three grasslands. The richness of threatened butterfly species correlated with that of threatened vascular plants, while those of the other groups did not covary.

3.14.2. Expanding Faunistic Knowledge

Conducting repeated surveys on different groups has the potential to add knowledge on the population dynamics, habitat associations, and distributions of lesser-known species. In our experiment, Borcard et al. [106] reported the first presence of a female of the ant tribe Dacetini in Switzerland. The dealate female (found in Vicques in 1993, the first year of our experiment) was subsequently identified by Baroni-Urbani [107] as Strumigenys baudueri, a species not formerly known from Switzerland. In the final year of the experiment, two workers of S. baudueri were captured in pitfall traps in Nenzlingen [108], proving for the first time the existence of a colony of the cryptic group in Switzerland. The mostly sub-terranean workers would have been unlikely to be found without such thorough examination of the sites. Other records of rare or new species were forwarded to the relevant authorities and organizations but not published out of conservation concerns.

4. Advantages and Limitations of Grassland Fragmentation Experiments

Our synthesis demonstrated that experimental grassland fragmentation has negative effects on various types of species interactions and the genetic diversity of plant populations. Effects on species richness and species composition were less frequently recorded. Most effects were subtle and varied over time: findings that would not have been detected in remnants of grassland, which vary in size, shape (and thus in the amount of edge), age, and degree of isolation [17,26]. This variation complicates any analysis and makes it difficult to distinguish between different factors that may influence the population dynamics of plants and animals, their interactions, and the species’ assemblages. The various sources of uncontrolled variation can be circumvented by applying an experimental approach with standardized fragments and appropriate control plots at different field sites [17].
Debinski and Holt [19] reviewed 20 habitat fragmentation experiments worldwide. Most of these experiments focused on the effects of fragmentation on species richness or on the abundance(s) of particular species, with a remarkable lack of consistency in results across studies [19]. Studies of arthropods reported the most pronounced fragmentation effects, while highly mobile taxa such as birds and mammals, long-lived species, and generalist predators did not respond to the fragmentation [19]. These findings were paralleled by those of our field experiment with less mobile taxa, short-lived, and specialized species showing the strongest responses to fragmentation.
Among the 20 fragmentation experiments reviewed, ours belonged to the ones with relatively small fragments [19]. The spatial scale chosen for our study allowed an experimental design with standardized fragment sizes, equal isolation distance, and corresponding control plots situated in equal distances in continuous habitat, arranged in a randomized block design. Furthermore, the distribution of the twelve blocks over three sites accounted for natural variation in soil properties, local climate, and species pools of nutrient-poor, dry calcareous grasslands. Few other fragmentation experiments did consider all of these aspects in their design [19].
Compared with the existing grassland remnants in the Swiss Jura mountains, the fragment sizes chosen in our experiment were small [23]. However, habitat fragmentation in the landscape occurs at different spatial scales. For each species, the relevant spatial scale is different depending on their resource needs and mobility [109,110]. Thus, choosing the appropriate taxonomical group(s) for a given landscape scale is a key issue in fragmentation studies. In our experiment, we focused on taxonomical groups and species characteristic for dry grasslands, with most of the species having limited dispersal and short generation times.
In our experiment, the isolation distance of the fragments (5 m) was chosen to represent the width of local roads as they frequently occur in the Swiss Jura mountains. This allows a comparison with findings of other studies conducted on either side of roads in real landscapes. Five-meter-wide roads crossing grasslands function as partial or even complete barriers for dispersing individuals of various invertebrate groups, as shown in land snails [111,112]. Moreover, the movements of more mobile organisms, such as wild bees, are influenced by roads. Bhattacharya et al. [113] reported alterations in foraging behavior of bumblebees in road verges, with a strongly reduced number of individuals crossing the road. Similarly, we recorded an altered foraging behavior in bumblebees in small fragments compared to control plots [31,41]. The design of our experiment allowed an examination of the consequences of this behavioral change (namely, a decrease in the genetic diversity of pollinated plants [41]). Such a stringent disentangling of cause and effect would not be possible in grassland remnants with no standardization of isolation distance and fragment size, etc. However, it is important to note that fragmentation experiments cannot replace field studies on real fragments in the landscape; rather, both complement each other.
In our experiment, some responses to habitat fragmentation became only apparent after a few years [4]. It has been reported that some species show a delayed response to altered environmental conditions [114,115]. Thus, species-specific responses can partly be explained by the time since fragmentation [114,115]. Long generations are therefore expected to cause time lags in the response of species richness to fragmentation. This may explain why ant species richness was not changed in our 7-year experiment [33,35,42] because colonies of these social insects can persist for 10 or more years. Some impacts of fragmentation on biodiversity may thus be underestimated in short-term studies. It is therefore essential to conduct fragmentation experiments or surveys over several years to assess time lags in responses [19].

5. Lessons for Conservation

5.1. Even Mild Fragmentation Results in Noticeable Effects

Our experiment used a very mild fragmentation, with the matrix being an intensively managed grassland (frequent mowing) with altered environmental characteristics. The isolation distance of 5 m matches that of a country road. While at first glance rather artificial, our experiment represents frequently occurring conditions where adjacent parcels of grasslands are managed differently by farmers. Indeed, semi-natural grasslands are frequently surrounded by intensively managed grasslands or crop fields [23,59]. Nonetheless, in our experiment the effects of the fragmentation were wide ranging, though sometimes subtle. This indicates a need to consider the consequences of relative minor breaks in initially continuous habitats that will be fragmented by infrastructure projects (e.g., new country roads). Furthermore, conservation actions should aim to increase the permeability of the matrix around grasslands of high conservation value. New corridors would be another way to mitigate the isolation of grassland remnants [116,117].

5.2. Even a Small-Scale Fragmentation Matters

We conducted a mesocosm experiment whose spatial scale was small in relation to real landscapes. Nonetheless, because of adequate control plots, we could demonstrate fragmentation effects, which are rarely investigated in real grassland remnants (e.g., changed pollinator behavior resulted in a decreased genetic diversity of plant species). These and other findings of our experiment indicate the presence of small-scale fragmentation effects, which have hitherto rarely been noticed.

5.3. Assessment Shortly after Environmental Change Underestimates Long-Term Effects

We showed that fragmentation-related behavioral alteration in a species has the potential to profoundly affect other species they interact with, even changing their population dynamics and genetic diversity. Such effects may accumulate over time as behavioral changes are likely to occur immediately after fragmentation, but their effects on other species may only become apparent in coming generations. Similarly, other fragmentation effects, such as reduced dispersal, may affect populations over time. Thus, any assessments made shortly after a disturbance-like fragmentation may be misleading as many effects become only apparent over time. Considering that many species had short generations, the experimental duration of 7 years allowed us to partly assess long-term effects. This suggests that any assessments of the success of conservation management decisions are ideally based on long-term data.

5.4. Conservation Decisions Should Not Be Based on a Single Taxonomical Group

Our experiment showed that different taxonomical groups responded differently to grassland fragmentation. The taxonomical groups studied were poor indicators of each other’s diversity. Consequently, we support the ‘shopping basket’ approach to conservation evaluation, i.e., measuring species richness, species composition, and the complementarity of several groups instead of just one [105]. It is therefore necessary to place management decisions on a broad base.

5.5. Biodiversity of a Grassland Does Not Substitute Those of Other Grasslands

We studied three grasslands belonging to the same vegetation type, managed in the same way for a long period, and situated in the same mountain range. Nonetheless, we recorded considerable variation in species composition of plants and invertebrates. Thus, none of the three sites can substitute for the others if the overall biodiversity of these grasslands is to be maintained.

Supplementary Materials

The following are available online at https://www.mdpi.com/article/10.3390/d15020130/s1, Table S1: Butterfly abundance, Table S2: Plant abundance, Table S3: Orthoptera abundance, Table S4: Orthoptera traits following [66,67,118], Table S5: Aphid abundance.

Author Contributions

Conceptualization, B.B. (Bruno Baur); methodology, B.B. (Bruno Baur), H.-P.R., and B.B. (Brigitte Braschler); validation, B.B. (Bruno Baur), H.-P.R., and B.B. (Brigitte Braschler); formal analysis, H.-P.R. and B.B. (Brigitte Braschler); investigation, B.B. (Bruno Baur), H.-P.R., and B.B. (Brigitte Braschler); resources, B.B. (Bruno Baur); data curation, H.-P.R. and B.B. (Brigitte Braschler); writing—original draft preparation, B.B. (Bruno Baur), H.-P.R., and B.B. (Brigitte Braschler); writing—review and editing, B.B. (Bruno Baur), H.-P.R., and B. Braschler; visualization, H.-P.R. and B.B. (Brigitte Braschler); supervision, B.B. (Bruno Baur) and H.-P.R.; project administration, B.B. (Bruno Baur); funding acquisition, B.B. (Bruno Baur). All authors have read and agreed to the published version of the manuscript.

Funding

The study was funded by the Swiss National Science Foundation (www.snf.ch (accessed on 5 October 2022); grants 5001-035241, 5001-044620, and 5001-058265 awarded to B. Baur).

Institutional Review Board Statement

Not applicable.

Data Availability Statement

The data presented in this study are available within the paper and its Supporting Information Files (Tables S1–S5).

Acknowledgments

We thank M. Wurtz, S. Schüpbach, and many students for their assistance and T. Boller, E. Turner, S. Zschokke, and an anonymous reviewer for their comments on the manuscript.

Conflicts of Interest

The authors declare no conflict of interest. The funders had no role in the design of the study; in the collection, analyses, or interpretation of data; in the writing of the manuscript; or in the decision to publish the results.

References

  1. Wilson, M.C.; Chen, X.-Y.; Corlett, R.T.; Didham, R.K.; Ding, P.; Holt, R.D.; Holyoak, M.; Hu, G.; Hughes, A.C.; Jiang, L.; et al. Habitat fragmentation and biodiversity conservation: Key findings and future challenges. Landsc. Ecol. 2016, 31, 219–227. [Google Scholar] [CrossRef] [Green Version]
  2. Johnson, C.; Balmford, A.; Brook, B.; Buettel, J.; Galetti, M.; Lei, G.; Wilmshurst, J. Biodiversity losses and conservation responses in the Anthropocene. Science 2017, 356, 270–275. [Google Scholar] [CrossRef] [PubMed]
  3. Quinn, J.F.; Hastings, A. Extinction in subdivided habitats. Conserv. Biol. 1987, 1, 198–208. [Google Scholar] [CrossRef]
  4. Saunders, D.A.; Hobbs, R.J.; Margules, C.R. Biological consequences of ecosystem fragmentation: A review. Conserv. Biol. 1991, 5, 18–32. [Google Scholar] [CrossRef]
  5. Margules, C.R.; Milkovits, G.A. Contrasting effects of habitat fragmentation on the scorpion Cercophonius squama and an amphipod. Ecology 1994, 75, 2033–2042. [Google Scholar] [CrossRef]
  6. Rossetti, M.R.; Tscharntke, T.; Aguilar, R.; Batáry, P. Responses of insect herbivores and herbivory to habitat fragmentation: A hierarchical meta-analysis. Ecol. Lett. 2017, 20, 264–272. [Google Scholar] [CrossRef] [Green Version]
  7. Davies, K.F.; Margules, C.R. Effects of habitat fragmentation on carabid beetles: Experimental evidence. J. Anim. Ecol. 1998, 67, 460–471. [Google Scholar] [CrossRef]
  8. Gaines, M.S.; Diffendorfer, J.E.; Tamarin, R.H.; Whittam, T.S. The effects of habitat fragmentation on the genetic structure of small mammal populations. J. Hered. 1997, 88, 294–304. [Google Scholar] [CrossRef]
  9. Lei, G.-C.; Hanski, I. Metapopulation structure of Cotesia melitaearum, a specialist parasitoid of the butterfly Melitaea cinxia. Oikos 1997, 78, 91–100. [Google Scholar] [CrossRef]
  10. Robinson, G.R.; Holt, R.D.; Gaines, M.S.; Hamburg, S.P.; Johnson, M.L.; Fitch, H.S.; Martinko, E.A. Diverse and contrasting effects of habitat fragmentation. Science 1992, 257, 524–526. [Google Scholar] [CrossRef]
  11. Simberloff, D. The contribution of population and community biology to conservation science. Annu. Rev. Ecol. Syst. 1988, 19, 473–511. [Google Scholar] [CrossRef]
  12. Kareiva, P.; Wennergren, U. Connecting landscape patterns to ecosystem and population processes. Nature 1995, 373, 299–302. [Google Scholar] [CrossRef]
  13. Wiens, J.A. Spatial scaling in ecology. Funct. Ecol. 1989, 3, 385–397. [Google Scholar] [CrossRef]
  14. Forman, R.T.T.; Godron, M. Landscape Ecology; Wiley: New York, NY, USA, 1986; p. 640. [Google Scholar]
  15. Wiens, J.A. Habitat fragmentation: Island versus landscape perspectives on bird conservation. Ibis 1994, 137, 97–104. [Google Scholar] [CrossRef]
  16. Tilman, D. Competition and biodiversity in spatially structured habitats. Ecology 1994, 75, 2–16. [Google Scholar] [CrossRef]
  17. Baur, B.; Erhardt, A. Habitat fragmentation and habitat alteration: Principal threats to most animal and plant species. GAIA 1995, 4, 221–226. [Google Scholar] [CrossRef]
  18. Schlaepfer, D.R.; Braschler, B.; Rusterholz, H.-P.; Baur, B. Genetic effects of anthropogenic habitat fragmentation on remnant animal and plant populations: A meta-analysis. Ecosphere 2018, 9, e02488. [Google Scholar] [CrossRef]
  19. Debinski, D.M.; Holt, R.D. A survey and overview of habitat fragmentation experiments. Conserv. Biol. 2000, 14, 342–355. [Google Scholar] [CrossRef]
  20. Zoller, H. Die Typen der Bromus erectus-Wiesen des Schweizer Juras, ihre Abhängigkeit von den Standortsbedingungen und wirtschaftlichen Einflüssen und ihre Beziehungen zur ursprünglichen Vegetation. In Series: Beiträge zur Geobotanischen Landesaufnahme der Schweiz, Vol. 33; Hans Huber: Bern, Switzerland, 1954; p. 309. [Google Scholar]
  21. Baur, B.; Joshi, J.; Schmid, B.; Hänggi, A.; Borcard, D.; Stary, J.; Pedroli-Christen, A.; Thommen, G.H.; Luka, H.; Rusterholz, H.-P.; et al. Variation in species richness of plants and diverse groups of invertebrates in three calcareous grasslands of the Swiss Jura mountains. Rev. Suisse Zool. 1996, 103, 801–833. [Google Scholar] [CrossRef]
  22. Veen, P.; Jefferson, R.; de Smidt, J.; van der Straaten, J. Grasslands in Europe of High Nature Value; KNNV Publishing: Zeist, The Netherlands, 2009; p. 320. [Google Scholar]
  23. Fischer, M.; Stöcklin, J. Local extinctions of plants in remnants of extensively used calcareous grasslands 1950–85. Conserv. Biol. 1997, 11, 727–737. [Google Scholar] [CrossRef]
  24. Zoller, H.; Bischof, N. Stufen der Kulturintensität und ihr Einfluss auf Artenzahl und Artengefüge der Vegetation. Phytocoenologia 1980, 7, 33–51. [Google Scholar]
  25. Boschi, C.; Baur, B. Past pasture management affects the land snail diversity in nutrient-poor calcareous grasslands. Basic Appl. Ecol. 2008, 9, 752–761. [Google Scholar] [CrossRef]
  26. Zoller, H.; Wagner, C.; Frey, V. Nutzungsbedingte Veränderungen in Mesobromion-Halbtrockenrasen in der Region Basel—Vergleich 1950–1980. Abh. Westfäl. Mus. Naturk. 1986, 48, 93–107. [Google Scholar]
  27. Zoller, H. Studien an Bromus erectus-Trockenrasengesellschaften in der Nordwestschweiz, speziell im Blauengebiet. Ber. Geobot. Inst. ETH 1947, 51–81. [Google Scholar]
  28. Zschokke, S.; Dolt, C.; Rusterholz, H.-P.; Oggier, P.; Braschler, B.; Thommen, G.H.; Lüdin, E.; Erhardt, A.; Baur, B. Short-term responses of plants and invertebrates to experimental small-scale grassland fragmentation. Oecologia 2000, 125, 559–572. [Google Scholar] [CrossRef] [PubMed]
  29. MeteoSwiss. IDAWEB 1.3.5.0. Available online: https://gate.meteoswiss.ch/idaweb/login.do (accessed on 19 July 2022).
  30. Groppe, K.; Steinger, T.; Schmid, B.; Baur, B.; Boller, T. Effects of habitat fragmentation on choke disease (Epichloë bromicola) in the grass Bromus erectus. J. Anim. Ecol. 2001, 89, 247–255. [Google Scholar] [CrossRef]
  31. Goverde, M.; Schweizer, K.; Baur, B.; Erhardt, A. Small-scale fragmentation affects pollinator behaviour: Experimental evidence from the bumblebee Bombus veteranus on calcareous grasslands. Biol. Conserv. 2002, 104, 293–299. [Google Scholar] [CrossRef]
  32. Ledergerber, S.; Dolt, C.; Zschokke, S.; Baur, B. Effects of experimental small-scale grassland fragmentation on the extent of grazing damage in Trifolium repens seedlings. Acta Oecol. 2002, 23, 329–336. [Google Scholar] [CrossRef]
  33. Braschler, B.; Baur, B. Effects of experimental small-scale grassland fragmentation on spatial distribution, density, and persistence of ant nests. Ecol. Entomol. 2003, 28, 651–658. [Google Scholar] [CrossRef]
  34. Braschler, B.; Lampel, G.; Baur, B. Experimental small-scale grassland fragmentation alters aphid population dynamics. Oikos 2003, 100, 581–591. [Google Scholar] [CrossRef] [Green Version]
  35. Braschler, B.; Baur, B. Experimental small-scale grassland fragmentation alters competitive interactions among ant species. Oecologia 2005, 143, 291–300. [Google Scholar] [CrossRef] [PubMed] [Green Version]
  36. Dolt, C.; Goverde, M.; Baur, B. Effects of experimental small-scale habitat fragmentation on above-ground and below-ground plant biomass in calcareous grasslands. Acta Oecol. 2005, 27, 49–56. [Google Scholar] [CrossRef]
  37. Stoll, P.; Dolt, C.; Goverde, M.; Baur, B. Experimental habitat fragmentation and invertebrate grazing in a herbaceous grassland species. Basic Appl. Ecol. 2006, 7, 307–319. [Google Scholar] [CrossRef]
  38. Joshi, J.; Stoll, P.; Rusterholz, H.-P.; Schmid, B.; Dolt, C.; Baur, B. Small-scale experimental habitat fragmentation reduces colonization rates in species-rich grasslands. Oecologia 2006, 148, 144–152. [Google Scholar] [CrossRef] [PubMed] [Green Version]
  39. Braschler, B.; Marini, L.; Thommen, G.H.; Baur, B. Effects of small-scale grassland fragmentation and frequent mowing on population density and species diversity of orthopterans: A long-term study. Ecol. Entomol. 2009, 34, 321–329. [Google Scholar] [CrossRef]
  40. Stoll, P.; Oggier, P.; Baur, B. Population dynamics of six land snail species in experimentally fragmented grassland. J. Anim. Ecol. 2009, 78, 236–246. [Google Scholar] [CrossRef]
  41. Rusterholz, H.-P.; Baur, B. Delayed response in a plant-pollinator system to experimental grassland fragmentation. Oecologia 2010, 163, 141–152. [Google Scholar] [CrossRef]
  42. Braschler, B.; Baur, B. Diverse effects of a seven-year experimental grassland fragmentation on major invertebrate groups. PLoS ONE 2016, 11, e0149567. [Google Scholar] [CrossRef]
  43. Braschler, B.; Oggier, P.; Baur, B. Subtle effects of experimental grassland fragmentation on density, species composition and functional dispersion of gastropods. Diversity 2022, 14, 474. [Google Scholar] [CrossRef]
  44. Tilman, D.; Reich, P.B.; Knops, J.; Wedin, D.; Mielke, T.; Lehman, C. Diversity and productivity in a long-term grassland experiment. Science 2001, 294, 843–845. [Google Scholar] [CrossRef] [Green Version]
  45. Braschler, B.; Zschokke, S.; Dolt, C.; Thommen, G.H.; Oggier, P.; Baur, B. Grain-dependent relationships between plant productivity and invertebrate species richness and biomass in calcareous grasslands. Basic Appl. Ecol. 2004, 5, 15–24. [Google Scholar] [CrossRef]
  46. Chase, J.M.; Leibold, M.A. Spatial scale dictates the productivity-biodiversity relationship. Nature 2002, 416, 427–430. [Google Scholar] [CrossRef] [PubMed]
  47. Ricketts, T.H. The matrix matters: Effective isolation in fragmented landscapes. Am. Nat. 2001, 158, 87–99. [Google Scholar] [CrossRef]
  48. Laurance, W.F.; Camargo, J.L.C.; Luizao, R.C.C.; Laurance, S.G.; Pimm, S.L.; Bruna, E.M.; Stouffer, P.C.; Willamson, G.B.; Benitez-Malvido, J.; Vasconcelos, H.L.; et al. The fate of Amazonian forest fragments: A 32-year investigation. Biol. Conserv. 2011, 144, 56–67. [Google Scholar] [CrossRef]
  49. Fahrig, L. Ecological response to habitat fragmentation per se. Annu. Rev. Ecol. Syst. 2017, 48, 1–23. [Google Scholar] [CrossRef]
  50. Gallé, R.; Tolgyesi, C.; Torma, A.; Bátori, B.; Lörinczi, G.; Szilassi, P.; Gallé-Szpisjak, N.; Kaur, H.; Makra, T.; Módra, G.; et al. Matrix quality and habitat type drive the diversity pattern of forest steppe fragments. Perspect. Ecol. Conserv. 2022, 20, 60–68. [Google Scholar] [CrossRef]
  51. Rusterholz, H.-P. Flower Densities and Bumblebee Foraging Behavior; University of Basel: Basel, Switzerland, 2010; unpublished work. [Google Scholar]
  52. Hudson, L.N.; Newbold, T.; Contu, S.; Hill, S.L.L.; Lysenko, I.; De Palma, A.; Phillips, H.R.P.; Alhusseini, T.I.; Bedford, F.E.; Bennett, D.J.; et al. The database of the PREDICTS (Projecting Responses of Ecological Diversity in Changing Terrestrial Systems) project. Ecol. Evol. 2017, 7, 145–188. [Google Scholar] [CrossRef] [Green Version]
  53. Magurran, A.E. Measuring Biological Diversity; Wiley-Blackwell: Hoboken, NJ, USA, 2013; p. 272. [Google Scholar]
  54. Southwood, T.R.E.; Henderson, P.A. Ecological Methods, 3rd ed.; Blackwell Science Ltd.: Oxford, UK, 2000; p. 575. [Google Scholar]
  55. Hanski, I. Metapopulation Ecology; Oxford University Press: Oxford, UK, 1999; p. 313. [Google Scholar]
  56. Fahrig, L. Effect of habitat fragmentation on the extinction threshold: A synthesis. Ecol. Appl. 2002, 12, 346–353. [Google Scholar]
  57. Koleff, P.; Gaston, K.J.; Lennon, J.J. Measuring beta diversity for presence-absence data. J. Anim. Ecol. 2003, 72, 367–382. [Google Scholar] [CrossRef] [Green Version]
  58. Wallis DeVries, M.F.; Poschlod, P.; Willems, J.H. Challenges for the conservation of calcareous grasslands in northwestern Europe: Integrating the requirements of flora and fauna. Biol. Conserv. 2002, 104, 265–273. [Google Scholar] [CrossRef]
  59. Poschlod, P. Geschichte der Kulturlandschaft; Ulmer Verlag: Stuttgart, Germany, 2015; p. 320. [Google Scholar]
  60. Hölldobler, B.; Wilson, E.O. The Ants; Springer: Berlin, Germany, 1990; p. 732. [Google Scholar]
  61. New, T.R. An Introduction to Invertebrate Conservation Biology; Oxford University Press: Oxford, UK, 1995; p. 194. [Google Scholar]
  62. Samways, M.J. Insect Diversity Conservation; Cambridge University Press: Cambridge, UK, 2005; p. 342. [Google Scholar]
  63. MacArthur, R.H.; Wilson, E.O. The Theory of Island Biogeography; Princeton University Press: Princeton, NJ, USA, 1967; p. 203. [Google Scholar]
  64. Oggier, P. Circadian and year-round activity of the land snails Candidula unifasciata and Helicella itala in grasslands of the Swiss Jura mountains (Gastropoda: Stylommatophora: Helicidae). Malakol. Abh. 1998, 19, 89–101. [Google Scholar]
  65. Laliberté, E.; Legendre, P. A distance-based framework for measuring functional diversity from multiple traits. Ecology 2010, 91, 299–305. [Google Scholar] [CrossRef]
  66. Gossner, M.M.; Simons, N.K.; Achtziger, R.; Blick, T.; Dorow, W.H.O.; Dziock, F.; Köhler, F.; Rabitsch, W.; Weisser, W.W. A summary of eight traits of Coleoptera, Hemiptera, Orthoptera and Araneae, occurring in grasslands in Germany. Sci. Data 2015, 2, 150013. [Google Scholar] [CrossRef] [PubMed]
  67. Orthoptera.ch. Orthoptera.ch. Available online: https://www.orthoptera.ch (accessed on 21 November 2022).
  68. Kareiva, P. Habitat fragmentation and the stability of predator-prey interactions. Nature 1987, 326, 388–390. [Google Scholar] [CrossRef]
  69. Kruess, A.; Tscharntke, T. Habitat fragmentation, species loss, and biological control. Science 1994, 264, 1581–1584. [Google Scholar] [CrossRef] [PubMed]
  70. Grez, A.A.; Zaviezo, T.; Diaz, S.; Camousseigt, B.; Cortés-Hinojosa, G.A. Effects of habitat loss and fragmentation on the abundance and species richness of aphidophageous beetles and aphids in experimental alfalfa landscapes. Eur. J. Entomol. 2008, 105, 411–420. [Google Scholar] [CrossRef] [Green Version]
  71. Dubbert, M.; Tscharntke, T.; Vidal, S. Stem-boring insects of fragmented Calamagrostis habitats: Herbivore-parasitoid community structure and the unpredictability of grass shoot abundance. Ecol. Entomol. 1998, 23, 271–280. [Google Scholar] [CrossRef]
  72. Bitters, M.E.; Meyers, J.; Resasco, J.; Sarre, S.D.; Tuff, K.T.; Davies, K.F. Experimental habitat fragmentation disrupts host-parasite interaction over decades via life-cycle bottlenecks. Ecology 2022, 103, e3758. [Google Scholar] [CrossRef]
  73. LaSalle, J.; Gauld, I.D. Parasitic hymenoptera and the biodiversity crisis. Redia 1991, 74, 315–334. [Google Scholar]
  74. Marjakangas, E.-L.; Abrego, N.; Grøtan, V.; de Lima, A.F.; Bello, C.; Bovendorp, R.S.; Culot, L.; Hasui, É.; Lima, F.; Muylaert, R.L.; et al. Fragmented tropical forests lose mutualistic plant-animal interactions. Divers. Distrib. 2019, 26, 154–168. [Google Scholar] [CrossRef] [Green Version]
  75. Albrecht, J.; Berens, D.G.; Jaroszewicz, B.; Selva, N.; Brandl, R.; Farwig, N. Correlated loss of ecosystem services in coupled mutualistic networks. Nat. Commun. 2014, 5, 3810. [Google Scholar] [CrossRef] [PubMed] [Green Version]
  76. Herbers, J.M. Seasonal structuring of a north temperate ant community. Insectes Soc. 1985, 32, 224–240. [Google Scholar] [CrossRef]
  77. Herbers, J.M. Community structure in north temperate ants: Temporal and spatial variation. Oecologia 1989, 81, 201–211. [Google Scholar] [CrossRef] [PubMed]
  78. Seifert, B. Die Ameisen Mittel- und Nordeuropas; Lutra—Verlags- und Vertriebsgemeinschaft: Tauer, Germany, 2007; p. 368. [Google Scholar]
  79. Traniello, J.F.A. Foraging strategies of ants. Ann. Rev. Entomol. 1989, 34, 191–210. [Google Scholar] [CrossRef]
  80. Potts, S.G.; Bismeijer, J.C.; Kremen, C.; Neumann, P.; Schweiger, O.; Kunin, W.E. Global pollinator declines: Trends, impacts and drivers. Trends Ecol. Evol. 2010, 6, 345–353. [Google Scholar] [CrossRef]
  81. Vanbergen, A.J. Threats to an ecosystem service: Pressures on pollinators. Front. Ecol. Environ. 2013, 11, 251–259. [Google Scholar] [CrossRef]
  82. Aguilar, R.; Cristobal-Perez, E.J.; Balvino-Olvera, F.J.; Aguilar-Aguilar, M.D.; Aquirre-Acosta, N.; Ashworth, L.; Lobo, J.A.; Marten-Rodriguez, S.; Fuchs, E.J.; Sanchez-Montoya, G.; et al. Habitat fragmentation reduces plant progeny quality: A global analysis. Ecol. Lett. 2019, 7, 1163–1173. [Google Scholar] [CrossRef] [Green Version]
  83. Zimmerman, M. Optimal foraging, plant density and the marginal value theorem. Oecologia 1981, 49, 148–153. [Google Scholar] [CrossRef]
  84. Chittka, L.; Thomson, J.D. Sensori-motor learning and its relevance for task specialization in bumble bees. Behav. Ecol. Sociobiol. 1997, 41, 385–398. [Google Scholar] [CrossRef]
  85. Cresswell, J.E. A comparison of bumblebees’ movements in uniform and aggregated distribution of their forage plant. Ecol. Entomol. 2000, 25, 19–25. [Google Scholar] [CrossRef]
  86. Jennersten, O. Pollination of Dianthus deltoides (Caryophyllaceae), effects of habitat fragmentation on visitation and seed set. Conserv. Biol. 1988, 2, 359–366. [Google Scholar] [CrossRef]
  87. Kearns, C.A.; Inouye, D.W.; Waser, N.M. Endangered mutualisms, the conservation of plant–pollinator interactions. Ann. Rev. Ecol. Syst. 1998, 29, 83–112. [Google Scholar] [CrossRef]
  88. Aizen, M.A.; Ashworth, L.; Galetto, L. Reproductive success in fragmented habitats: Do compatibility system and pollination specialization matter? J. Veg. Sci. 2002, 13, 885–892. [Google Scholar] [CrossRef]
  89. Aguilar, R.; Ashworth, L.; Galetto, L.; Aizen, M.A. Plant reproductive susceptibility to habitat fragmentation: Review and synthesis through a meta-analysis. Ecol. Lett. 2006, 9, 968–980. [Google Scholar] [CrossRef]
  90. Reed, D.; Lowe, E.; Briscoe, D.; Frankham, R. Inbreeding and extinction: Effects of rate of inbreeding. Conserv. Genet. 2003, 4, 405–410. [Google Scholar] [CrossRef]
  91. Lowe, A.J.; Boshier, D.; Ward, M.; Bacles, C.F.E.; Navarro, C. Genetic resource impacts of habitat loss and degradation; reconciling empirical evidence and predicted theory for neotropical trees. Heredity 2005, 95, 255–273. [Google Scholar] [CrossRef]
  92. Leimu, R.; Mutikainen, P.; Koricheva, J.; Fischer, M. How general are positive relationships between plant population size, fitness and genetic variation? J. Ecol. 2006, 94, 942–952. [Google Scholar] [CrossRef]
  93. Charlesworth, D.; Willis, J.H. The genetics of inbreeding depression. Nat. Rev. Genet. 2009, 10, 783–796. [Google Scholar] [CrossRef]
  94. Jump, A.S.; Marchant, R.; Penuelas, P. Environmental change and the option value of genetic diversity. Trends Plant Sci. 2009, 14, 51–58. [Google Scholar] [CrossRef]
  95. Manel, S.; Holderegger, R. Ten years of landscape genetics. Trends Ecol. Evol. 2013, 28, 614–621. [Google Scholar] [CrossRef]
  96. Gonzalez, A.V.; Gomez-Silva, V.; Ramirez, M.J.; Fonturbel, F.E. Meta-analysis of the differential effects of habitat fragmentation and degradation on plant genetic diversity. Conserv. Biol. 2020, 34, 711–720. [Google Scholar] [CrossRef] [PubMed]
  97. Aguilar, R.; Quesada, M.; Ashworth, L.; Herrerias-Diego, Y.; Lobo, A. Genetic consequences of habitat fragmentation in plant populations: Susceptible signals in plant traits and methodological approaches. Mol. Ecol. 2008, 17, 5177–5188. [Google Scholar] [CrossRef] [PubMed]
  98. Eckert, C.G.; Kalisz, S.; Geber, M.A.; Sargent, R.; Elle, E.; Cheptou, P.-O.; Goodwillie, C.; Johnston, M.O.; Kelly, J.K.; Moeller, D.A.; et al. Plant mating systems in a changing world. Trends Ecol. Evol. 2010, 25, 35–43. [Google Scholar] [CrossRef] [PubMed]
  99. Nei, M. Analysis of gene diversity in subdivided populations. Proc. Natl. Acad. Sci. USA 1973, 70, 3321–3323. [Google Scholar] [CrossRef] [PubMed] [Green Version]
  100. Tscharntke, T.; Brandl, R. Plant-insect interactions in fragmented landscapes. Annu. Rev. Entomol. 2004, 49, 405–430. [Google Scholar] [CrossRef] [PubMed]
  101. Grass, I.; Jauker, B.; Steffan-Dewenter, I.; Tscharntke, T.; Jauker, F. Past and potential future effects of habitat fragmentation on structure and stability of plant-pollinator and host-parasitoid networks. Nat. Ecol. Evol. 2018, 2, 1408–1417. [Google Scholar] [CrossRef]
  102. Greenleaf, S.S.; Williams, N.M.; Winfree, R.; Kremen, C. Bee foraging ranges and their relationship to body size. Oecologia 2007, 153, 589–596. [Google Scholar] [CrossRef]
  103. Oggier, P.; Zschokke, S.; Baur, B. A comparison of three methods for assessing the gastropod community in dry grasslands. Pedobiologia 1998, 42, 348–357. [Google Scholar]
  104. Mittelbach, G.G.; Steiner, C.F.; Scheiner, S.M.; Gross, K.L.; Reynolds, H.L.; Waide, R.B.; Willig, M.R.; Dodson, S.I.; Gough, L. What is the observed relationship between species richness and productivity. Ecology 2001, 82, 2381–2396. [Google Scholar] [CrossRef]
  105. Niemelä, J.; Baur, B. Threatened species in a vanishing habitat: Plants and invertebrates in calcareous grasslands in the Swiss Jura mountains. Biodivers. Conserv. 1998, 7, 1407–1416. [Google Scholar] [CrossRef]
  106. Borcard, Y.; Borcard, D.; Vernier, R. Epitritus argiolus Emery, 1869 (Hymenoptera, Formicidae) dans une prairie maigre du Jura. Mitt. Schweiz. Entomol. Ges. 1997, 70, 265–269. [Google Scholar]
  107. Baroni Urbani, C. Strumigenys baudueri (Emery): Espèce nouvelle pour la Suisse (Hymenoptera: Formicidae). Mitt. Schweiz. Entomol. Ges. 1998, 71, 163–164. [Google Scholar]
  108. Braschler, B. Neue Aspekte zur Verbreitung von Pyramica baudueri (Emery, 1875) (Hymenoptera, Formicidae). Mitt. Entomol. Ges. Basel 2002, 52, 139–142. [Google Scholar]
  109. Doak, D.F.; Marino, P.C.; Kareiva, P.M. Spatial scale mediates the influence of habitat fragmentation on dispersal success: Implications for conservation. Theor. Popul. Biol. 1992, 41, 315–336. [Google Scholar] [CrossRef]
  110. Cattarino, L.; McAlpine, C.A.; Rhodes, J.R. Spatial scale and movement behaviour traits control the impacts of habitat fragmentation on individual fitness. J. Anim. Ecol. 2016, 85, 168–177. [Google Scholar] [CrossRef] [PubMed]
  111. Baur, A.; Baur, B. Are roads barriers to dispersal in the land snail Arianta arbustorum? Can. J. Zool. 1990, 68, 613–617. [Google Scholar] [CrossRef]
  112. Wirth, T.; Oggier, P.; Baur, B. Effect of road width on dispersal and genetic population structure in the land snail Helicella itala. Z. Ökol. Natursch. 1999, 8, 23–29. [Google Scholar]
  113. Bhattacharya, M.; Primack, R.B.; Gerwein, J. Are roads and railroads barriers to bumblebee movement in a temperate suburban conservation area? Biol. Conserv. 2003, 109, 37–45. [Google Scholar] [CrossRef]
  114. Ferraz, G.; Russell, G.J.; Stouffer, P.C.; Bierregaard, R.O.; Pimm, S.L.; Lovejoy, T.E. Rates of species loss from Amazonian forest fragments. Proc. Natl. Acad. Sci. USA 2003, 100, 14069–14073. [Google Scholar] [CrossRef] [Green Version]
  115. Krauss, J.; Bommarco, R.; Guardiola, M.; Heikkinen, R.K.; Helm, A.; Kuussaari, M.; Lindborg, R.; Öckinger, E.; Pärtel, M.; Pino, J.; et al. Habitat fragmentation causes immediate and time-delayed biodiversity loss at different trophic levels. Ecol. Lett. 2010, 15, 597–605. [Google Scholar] [CrossRef] [Green Version]
  116. Collinge, S.K. Effects of grassland fragmentation on insect species loss, colonization, and movement patterns. Ecology 2000, 81, 2211–2226. [Google Scholar] [CrossRef]
  117. Tewksbury, J.J.; Levey, D.J.; Haddad, N.M.; Sargent, S.; Orrock, J.L.; Weldon, A.; Danielson, B.J.; Brinkerhoff, J.; Damschen, E.I.; Townsend, P. Corridors affect plants, animals, and their interactions in fragmented landscapes. Proc. Nat. Acad. Sci. USA 2002, 99, 12923–12926. [Google Scholar] [CrossRef] [PubMed] [Green Version]
  118. Reinhardt, K.; Köhler, G.; Maas, S.; Detzel, P. Low dispersal ability and habitat specificity promote extinctions in rare but not in widespread species: The Orthoptera of Germany. Ecography 2005, 28, 593–602. [Google Scholar] [CrossRef]
Figure 1. Study sites with the twelve experimental blocks photographed on 11 May 1994. Three experimental blocks were near Movelier (left), five near Nenzlingen (middle), and four near Vicques (right) in dry calcareous grasslands in the Jura mountains. Block halves containing fragments surrounded by a mown isolation area are clearly visible, while block halves with control plots are indistinguishable from the adjacent undisturbed grasslands. The study sites were fenced to exclude grazing by large herbivores. In the study site near Nenzlingen, other experiments were also conducted, and their infrastructure is visible between the blocks. Photos: M. Wurtz.
Diversity 15 00130 g001
Figure 2. Experimental design. Starting in 1993, areas of three semi-natural, dry calcareous grasslands in the Jura mountains (Switzerland) were experimentally fragmented by regular mowing around the fragments. A block (29 m × 32 m) contained one large (4.5 m × 4.5 m), one small (1.5 m × 1.5 m) and two tiny (0.5 m × 0.5 m) fragments, as well as corresponding control plots in unmown vegetation. This type of fragmentation was maintained till the end of 1999. Non-invasive methods preventing trampling and harvesting of individuals were applied except in the final year. Photos: mowing the matrix: B. Baur (upper left); fragments with a mobile working platform: B. Braschler (lower left).
Diversity 15 00130 g002
Figure 3. Temperature difference between fragments (green) and the mown isolation area (light green). Air temperature close to the ground was measured at different distances to the fragment edge both inside and outside large fragments in Vicques. Temperature was recorded every 10 min along six logger transect lines from 31 August to 12 September 1995, a period with no rain. For comparison, air temperature at 2 m above ground was measured nearby inside a shaded box. Red dots display mean daily maximum temperature (with SD), while blue dots refer to mean daily minimum temperature. Redrawn from Zschokke et al. [28].
Diversity 15 00130 g003
Figure 4. Species density of invertebrate groups in fragments and control plots in the final year of the experimental fragmentation. Species density was calculated as the mean of two pitfall traps per fragment or control plot averaged over seven 2-week collections. Only large and small plots were used. Means ± SD are shown; n = 24; + p < 0.10, * p < 0.05, ** p < 0.01. Data from [42].
Diversity 15 00130 g004
Figure 5. Tillers of the grass Bromus erectus infested with the fungal endophyte Epichloë bromicola. The fungal infection prevents the development of inflorescences in the grass species. Figure adapted from a photo published by AfroBrazilian on Wikimedia commons under a CC-BY-SA-3.0 license.
Diversity 15 00130 g005
Figure 6. Number of Bromus erectus tillers (per m2) infested with Epichloë bromicola in tiny, small, and large fragments (black bars) and in the corresponding control plots (open bars) in the first year (a), second year (b), and third year (c) of the experiment. Means ± SE are shown. Redrawn from Groppe et al. [30].
Diversity 15 00130 g006
Figure 7. Foraging behavior of bumblebees in a small fragment and control plot. Red dots represent the positions of single Stachys officinalis inflorescences. In fragments, bumblebees visited repeatedly the same inflorescences during a trip, considering almost all inflorescences. In contrast, in control plots, inflorescences were only visited once [51].
Diversity 15 00130 g007
Figure 8. Frequency of outcrossing in S. officinalis in small and large fragments (black bars) and the corresponding control plots (open bars) in the third year (a), and seventh year (b) of experimental fragmentation. Means ± SE are shown; n = 7; ** p < 0.01, *** p < 0.001. Data from Rusterholz and Baur [41].
Diversity 15 00130 g008
Figure 9. Genetic diversity [99] of S. officinalis-seedlings in small and large fragments (black bars) and the corresponding control plots (open bars) in the (a) third year and (b) seventh year of experimental fragmentation. Means ± SE are shown; n = 7; ** p < 0.01; N.S. not significant. Data from Rusterholz and Baur [41].
Diversity 15 00130 g009
Table 1. Climatic conditions in the years of the study compared with the norm conditions (mean values from 1991–2020). Data on precipitation and temperature from the weather station in Delémont close to the sites in Movelier and Vicques are presented (data obtained from MeteoSwiss [29]). Percent deviation from norm values are shown in brackets a,b.
YearAnnual Precipitation [mm; % Deviation]Mean Annual
Temperature [°C; % Deviation]
Mean Temperature
in Apr–Sept [°C; % Deviation]
Min Temperature
in Apr–Sept [°C]
Max Temperature
in Apr–Sept [°C]
1993881.0 (−4.2)9.2 (−6.5)14.6 (−4.8)−1.633.4
1994936.8 (+1.9)10.7 (+8.7)15.5 (+0.5)−2.634.6
19951118.9 (+21.7)9.5 (−3.5)14.4 (−6.2)−1.134.2
1996832.9 (−9.4)8.4 (−14.7)13.9 (−9.3)−3.830.9
1997815.1 (−11.3)9.3 (−5.5)14.6 (−5.1)−4.830.2
1998925.0 (+0.6)9.2 (−6.5)14.8 (−3.8)−3.035.4
19991275.3 (+38.7)9.8 (−0.4)15.7 (+2.3)−0.432.8
Norm a919.4 a9.8 a15.4 a−6.4 b37.7 b
a Norm values for annual precipitation, annual mean temperature, and mean temperature of the active season Apr–Sept were calculated as means from annual totals (precipitation), annual means (annual temperature), and monthly means from Apr–Sept for the years 1991–2020. b Lowest and highest temperature, respectively, measured for the years 1991–2020.
Table 2. Overview of publications presenting findings of the grassland fragmentation experiment in the Swiss Jura mountains.
PublicationIssue(s) AddressedYear(s) of Experiment aOrganism Group(s)Method(s) Applied b
Zschokke et al. 2000 [28]Assessing species richness and species diversity in several taxonomical groups, recording the relative abundance of the 65 most common species4Grasses, forbs, ants, butterflies, grasshoppers, and gastropodsClassical plant survey, nest counting in ants, direct census of butterflies and grasshoppers, wet cardboard sheets as traps for gastropods
Groppe et al. 2001 [30]Temporal and among-site variation in fungal infestation of a grass species1–3Target species: Bromus erectus; Fungus: Epichloë bromicolaMapping Bromus erectus inflorescences and assessing the fungal infestation of the inflorescences
Goverde et al. 2002 [31]Flower visitation rate, taxonomic composition of flower visitors, and bumblebee foraging behavior6Target species: Stachys officinalis; Pollinator: mainly Bombus veteranus but also other flower visitorsMapping the spatial distribution of S. officinalis plants in small fragments and control plots, recording frequency of different flower visitors, and foraging behavior of B. veteranus in three blocks at two study sites
Ledergerber et al. 2002 [32]Quantifying the extent of grazing damage to an herb4Target species: Trifolium repens, potential grazers: 12 gastropod species, 15 grasshopper speciesProvision of standardized food (seedlings of Trifolium repens) in two short periods
Braschler & Baur 2003 [33]Inter- and intraspecific competition; edge effects4, 7Ants (all species; Lasius paralienus separately)Spatial distribution of ant nests
Braschler et al. 2003 [34]Infestation rates and abundances of aphids; parasitism rates of aphids; ant-tending rates5−7Aphids (all species present); plant species infested by aphids; ant species tending aphidsCounting aphids and aphid mummies, only two study sites
Braschler & Baur 2005 [35]Interspecific competition and dominance4, 7Ants (all species; Lasius paralienus separately)Counting ants at baits and natural sugar resources; pitfall traps; ant nest density, only small and large fragments
Dolt et al. 2005 [36]Quantifying above- and below-ground plant biomass4−6Above-ground biomass of grasses and herbs, and overall below-ground plant biomassHarvesting of plant biomass above a height of 5 cm in 3 years; harvesting of root-biomass using soil cores in the 6th year
Stoll et al. 2006 [37]Extent of grazing damage on leaves6Target species: Stachys officinalis; potential grazers: gastropods, grasshoppers Assessment of leaf area consumed in spring, summer, and autumn; two small and large fragments each in two randomly chosen blocks per site
Joshi et al. 2006 [38] Colonization and extinction rate of plants 1, 2, 3, 4, 7 Vascular plants Standardized vegetation survey
Braschler et al. 2009 [39] Effects of fragmentation and frequent mowing on orthopteran species richness, density, and species composition 1−7 Orthopterans, also the suborders Ensifera and Caelifera separately Visual survey in large fragments and control plots, and corresponding plots in the mown matrix; surveys several times per season in each year
Stoll et al. 2009 [40] Quantifying the population dynamics (population sizes, extinction, and recolonization frequencies) of six land snail species 2−4 Six gastropod species (Cochlicopa lubrica, Vertigo pygmaea, Pupilla muscorum, Punctum pygmaeum, Helicella itala, and Trichia plebeia) Mark-release-resight approach
Rusterholz & Baur 2010 [41] Flower visitation rate, foraging behavior of pollinators, plant reproductive characteristics, outcrossing frequency, genetic diversity 1, 4, 7 Target species: Stachys officinalis; flower visiting insects, bumblebee species Counting the number of insects visiting S. officinalis inflorescences; recording the foraging behavior of bumblebees; assessing seed characteristics; determining of outcrossing frequency and genetic diversity of seedlings using RAPD in the fourth and seventh year.
Braschler & Baur 2016 [42] Species richness, density, species composition, body size, and habitat preferences 7 Gastropods, ants, ground beetles, rove beetles, Orthoptera, spiders, woodlice Two pitfall traps per large and small fragment and control plot, emptied every 2 weeks for a total of seven collections from late spring to late summer
Braschler et al. 2022 [43] Temporal and among-site variation in species richness, individual density, species composition, functional dispersion, morphological and life-history traits, and habitat preferences 4−7 Gastropods (all gastropods or snails only) 81 cardboard traps, one night per year in autumn in large plots
a 1: 1993 (initiation of the experiment) to 7: 1999 (final year of the experiment). b if not otherwise stated all fragments and control plots were surveyed.
Table 3. Number of species recorded in various taxonomical groups in the three study sites (and overall). Some taxonomical groups were surveyed at different times during the experiment using different methods and are thus listed more than once. In a few groups, the number of species recorded was not reported in publications. In these cases, the figures are based on the raw data from those surveys.
Taxonomic Group MovelierNenzlingenVicquesOverall Year and Sampling Effort
Vascular plants 11611196143 1993 and 1994; all fragments and control plots [21]
Gastropods 16211522 1994; all fragments and control plots [21]
Gastropods 15141019 1996–1999; cardboard traps in all large fragments and control plots [43]
Gastropods 18181022 1999; 2 pitfall traps each in all small and large fragments and control plots exposed for 14 weeks [42]
Spiders 636066108 1994; 9 pitfall traps per site in the surroundings of blocks [21]
Spiders 52765899 1999; 2 pitfall traps each in all small and large fragments and control plots exposed for 14 weeks [42]
Woodlice 3435 1999; 2 pitfall traps each in all small and large fragments and control plots exposed for 14 weeks [42]
Orthopterans 16131017 1994; all fragments and control plots [21]
Orthopterans 21171219 1993–1999; 2 surveys per year in large fragments and control plots and a comparable plot of mown matrix in each block [39]
Aphids NA a131724 1998; vouchers were collected from all aphid colonies in tiny fragments and control plots and subsamples in small and large fragments and control plots in Nenzlingen and Vicques [34]
Ants 1211714 1996; nest counts assisted by following foragers attracted to sugar baits [28]
Ants 16201524 1999; 2 pitfall traps each in all small and large fragments and control plots exposed for 14 weeks [42]
Butterflies 46324046 1993 and 1994; three 10 m x 10 m plots per site adjacent to the blocks [21]
Butterflies 26192029 1996; 13 × 30 min observation per block [28]
Ground beetles 19192138 1994; 9 pitfall traps per site in the surroundings of blocks [21]
Ground beetles 19201833 1999; 2 pitfall traps each in all small and large fragments and control plots exposed for 14 weeks [42]
Rove beetles 14251635 1999; 2 pitfall traps each in all small and large fragments and control plots exposed for 14 weeks [42]
a NA, not assessed
Disclaimer/Publisher’s Note: The statements, opinions and data contained in all publications are solely those of the individual author(s) and contributor(s) and not of MDPI and/or the editor(s). MDPI and/or the editor(s) disclaim responsibility for any injury to people or property resulting from any ideas, methods, instructions or products referred to in the content.

