Abstract
Phytoplankton are sensitive to the change in hydrological environment and can effectively reflect the health status of water, so they are often used for water quality assessment. To understand the recovery process of phytoplankton community structure characteristics and water quality conditions, two methods of phytoplankton classification functional group (FG) and morphology-based functional group (MBFG) were compared based on morphological differences and applicability. In this study, we investigated the changes in the aquatic environmental conditions and phytoplankton functional groups in the saline wetland of Dagangzipao during the restoration process of the Songnen Plain. The functional group division method suitable for saline-alkali wetlands was also determined. The results showed that there were 86 species belonging to 47 genera and seven phyla. The average phytoplankton biomass range in 2020 is 0.37 mg/L–3.59 mg/L, and the average phytoplankton biomass range in 2021 is 0.01 mg/L–1.44 mg/L. The Q-index showed that the water quality was in a good state. The redundancy analysis showed that the characteristics of phytoplankton functional groups showed a good indication of the habitat characteristics of saline-alkali wetlands, and the environmental interpretation of the MBFG was higher than that of the FG. The results provide a reference for the sustainable development of saline wetland water environment protection and ecological restoration.
1. Introduction
Wetlands are ecosystems with unique hydrological, soil, vegetation and biological characteristics on the Earth’s surface, playing an irreplaceable role in water conservation, water purification, biodiversity maintenance, flood water storage, climate regulation, carbon sequestration and storage [1,2,3,4]. In recent years, the degradation of wetland ecosystems has become more severe due to factors such as agricultural reclamation and climate change [5,6]. With the degradation of wetlands, water quality is polluted, biodiversity is reduced, and ecological functions are severely impaired. Aquatic ecosystems are an important part of wetlands and play an important role in maintaining their ecological functions. Therefore, it is necessary to analyse the health of wetland aquatic environments [7,8].
As one of the major biological groups in wetland aquatic ecosystems, phytoplankton play an important role in maintaining the stability and integrity of aquatic ecosystems [9,10]. The abundance, biomass and diversity indices of phytoplankton communities are often used to diagnose the condition of the aquatic environment due to their small size, relatively simple cell structure, short life cycle and sensitivity to changes in the water environment [11,12,13]. In contrast to traditional phytoplankton classification, Reynolds et al. [14] proposed the concept of ‘functional groups’ based on a combination of phytoplankton ecology and physiology. Compared with the traditional method of phytoplankton community classification, functional group classification can better reflect the characteristics of the aquatic environment [15]. Based on this, Padisak et al. [16] proposed the Q-index, which uses phytoplankton functional groups and their biomass to better evaluate the trophic status of water bodies [17].
Phytoplankton functional groups are classified according to morphological, physiological and ecological characteristics of phytoplankton, and each functional group contains species that share similar habitat characteristics. FG and morphology-based functional group (MBFG) methods are often used to assess the ecological health of water bodies [18]. The FG method has a higher number of functional groups and may have a higher degree of interpretation of environmental factors than the MBFG method [19]. However, Kruk et al. [20] suggested that the functional groups delineated by MBFG could provide a better explanation of the environment. Saline wetlands, as a kind of wetland, are characterised by high pH value and high salt content, which indirectly affect the growth of phytoplankton to a certain extent. However, little research has been reported on which of the two functional group classification methods, FG and MBFG, is more suitable for saline wetlands.
The Songnen Plain is located in northeastern China, where the unique climate, geomorphology and hydrology have created large areas of marsh wetlands that not only provide important breeding grounds and migratory resting places for rare and endangered waterfowl but also play an important role in preventing land salinization, desertification, and flood storage [21]. In recent years, due to natural and human-induced factors such as climatic extremes and agricultural and pastoral activities [22], wetlands have gradually shrunk in size, and their original habitat conditions have been severely damaged. The deterioration of the water environment has been accompanied by significant changes in the structure of the phytoplankton community. With the increasing emphasis on environmental protection and awareness of the importance of wetlands, large-scale wetland restoration work has been carried out in the Songnen Plain. Therefore, the typical restored wetlands of the Songnen Plain were used as the study area. The study aims were to identify key drivers of changes in the dominant functional groups of phytoplankton communities, identify functional group classification methods applicable to saline wetlands, perform water quality assessments based on functional groups and propose recommendations for water quality improvement. This was carried out through analysis of the water quality and functional group characteristics of phytoplankton communities during wetland restoration. This study provides the necessary information to understand the changes in phytoplankton due to alterations in the elements of the aquatic environment during wetland restoration. Additionally, it will provide support in the selection of functional group classification methods for phytoplankton in saline wetlands.
2. Materials and Methods
2.1. Overview of the Study Area
The study area is located in the Dagangzipao Wetland in the Songnen Plain of China (Figure 1), with a semiarid continental temperate monsoon climate and precipitation mainly concentrated in summer (June–August). The average annual temperature is about 4.2 °C, the annual precipitation is about 392 mm, and the average annual evaporation is about 1472 mm [21]; farming and herding are the main agricultural activities in the area. The Dagangzipao Wetland had a water surface area of 3.14 km2 in April 2020, which increased to 6.18 km2 by October 2021 through ecological replenishment in the last two years. Due to the sparse vegetation, incorporating principles of restoration ecology, the research group planted Phragmites australis, Suaeda glauca and other plants in May 2020, and also carried out soil improvement around the sampling site. In August 2021, the average vegetation coverage rate was 44.0%, and the average vegetation aboveground biomass was 169.73 g/m2, which was the result of ecological restoration.
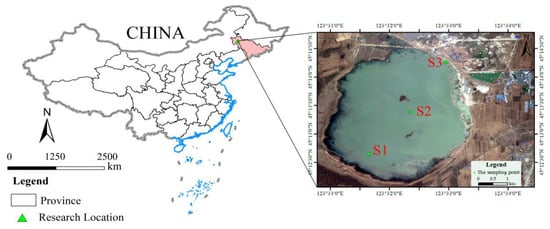
Figure 1.
Location of study area and distribution of sampling points.
2.2. Field Survey and Sampling
According to the ecological environment and hydrological characteristics of the Dagangzipao Wetland, three water quality sampling points were selected, which were near the water inlet (S1), the central area (S2) and the northeastern marginal area (S3). It covers the functional areas and representative terrain of the Dagangzipao Wetland. Monthly sampling was carried out from June (we started wetland restoration in June, so sampling was performed in June) to October 2020 and from April to October 2021. Samples to assess phytoplankton life characteristics were taken between 09:00 and 12:00.
One qualitative sample and three quantitative samples of phytoplankton were collected from each sampling site every month. Qualitative phytoplankton samples were collected using a phytoplankton net (Ø25 cm) 0.5 m below the surface of the water and were immediately fixed in 15 mL of Lugol’s iodine (neutral) reagent at a concentration of 1.5%.
2.3. Measurement Indicators
2.3.1. Phytoplankton
Quantitative phytoplankton samples were collected: 1 L of water was collected 0.5 m below the water surface using a Plexiglas water collector and fixed in a wide-mouth bottle. After 48 h of precipitation, it was concentrated to 50 mL with a siphon and added to 4% formaldehyde solution for storage. A total of 0.1 mL of the sample was placed in a 0.1 mL phytoplankton counting frame, and the phytoplankton were counted under a 400× magnification microscope using the field of view method [23]; each sample was averaged over 2 counts and if the result of 2 counts showed an error greater than 15%, a third count was performed. The biomass (wet) of the phytoplankton was also estimated from the geometry of the phytoplankton entities [24]. Phytoplankton were identified by reference to the Phytoplankton Manual [25] and the Chinese Freshwater Algae—Systems, Taxonomy and Ecology [26].
2.3.2. Water Quality
Water quality indicators were measured: water temperature (WT), electrical conductivity (EC), total dissolved solids (TDS), dissolved oxygen (DO), pH and salinity (Sal) indicators. These parameters were measured directly using a portable multiparameter water quality analyser (YSI650, USA). TN were determined by UV spectrophotometry using alkaline potassium persulfate digestion [27], TP by ammonium molybdate spectrophotometry [28], BOD5 by dilution inoculation [29], and CODCr by the potassium dichromate standard method [30].
2.4. Data Analysis
The FG classifies the phytoplankton species that are consistent with a specific living environment type and have similar sensitivity into the same functional group. This classification method believes that the water condition can be reflected by judging the living environment type adapted by the dominant functional group. MBFG is a functional group classification method commonly used in phytoplankton ecological research. According to the morphological characteristics of phytoplankton such as size, pseudovoid, flagellum, silicon wall and specific surface area, algae species with similar morphology were divided into the same group, which was divided into 7 functional groups.
The phytoplankton dominance functional group dominance (Y) was calculated as follows:
where is the frequency of occurrence of the ith functional group and is the proportion of the biomass of the ith functional group to the total biomass. The biomass of a phytoplankton functional group is obtained by summing the biomass of each representative algae (genus/species) in that functional group [31]. The dominant functional group is Y ≥ 0.02 [32].
The Q-index is calculated as follows [16]:
where n is the number of phytoplankton functional groups, Bi is the proportion of the biomass of the ith functional group to the total biomass, and the factor Fi is the assigned value of the ith functional group. A Q-index from 0 to 5 represents different water quality statuses: 0–1 is poor, 1–2 is tolerant, 2–3 is moderate, 3–4 is good, and 4–5 is very good.
Data analysis was conducted using SPSS 26.0 (Chicago, IL, USA) and Canoco 5.0 (Ithaca, NY, USA). Statistical analysis and ANOVA were used to test whether there were significant differences in water environment variables during wetland restoration. Pearson correlation analysis was applied to explore the correlation between phytoplankton dominant functional group characteristics and the aquatic environment, with p < 0.05 indicating that the differences and correlations were statistically significant. Prior to the analysis, data related to phytoplankton functional groups and environmental variables (except pH) were log (x + 1) transformed to meet the normal distribution. Redundancy analysis (RDA) was chosen to investigate the relationship between environmental variables and phytoplankton functional groups; firstly, detrended correspondence analysis (DCA) is performed on the plankton data and the water environment factor data to obtain single-peak response values (gradient SD). In this study, the SD did not exceed more than 4, so the RDA was selected for analysis. The significance of physicochemical variables in the interpretation of CCA phytoplankton biomass data was verified using Monte Carlo simulation methods for 499 alignments.
3. Results
3.1. Changes in Water Environment Indicators during the Restoration of Saline Wetlands
The monthly average variations in water environmental indicators for the Dagangzipao Wetland are shown in Figure 2 and Figure 3. The WT ranged from 6.58 °C to 32.35 °C. The EC ranged from 615.45 μs/cm to 13,126.15 μs/cm, with a wide monthly variation, and the maximum value occurred in June in 2020. The EC was relatively stable in 2021 compared to 2020. The TDS ranged between 622.50 mg/L and 7485.50 mg/L, with a wide monthly variation, and the maximum value occurred in June in 2020. The DO ranged from 6.11 mg/L to 11.34 mg/L, and the maximum value occurred in October in 2020. The pH had a range of 8.01–9.37, and the maximum value occurred in July in 2020, showing an overall downwards trend. Salinity ranged from 0.08 ppt to 0.53 ppt, and the maximum value occurred in June in 2020, also showing an overall downwards trend. The TN ranged from 0.75 mg/L to 5.84 mg/L, and the maximum value occurred in June in 2020, with a large monthly variation. The BOD5 ranged from 0.30 mg/L to 7.38 mg/L, and the maximum content appeared in July in 2020 and was higher in summer than at other times. The CODCr ranged from 23.88 mg/L to 150.19 mg/L, the maximum value appeared in June in 2020, and the content in summer was higher than that in other times. With the restoration of the wetland, the EC, TDS, Sal, DO, pH, TN, BOD5 and CODCr decreased in 2021 compared to 2020 (see Table 1).
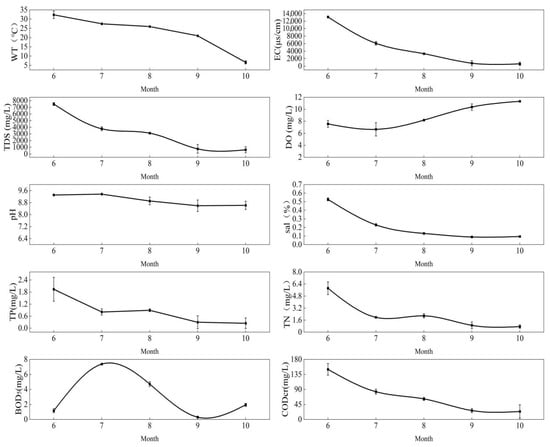
Figure 2.
Monthly changes in water environment indicators in 2020.
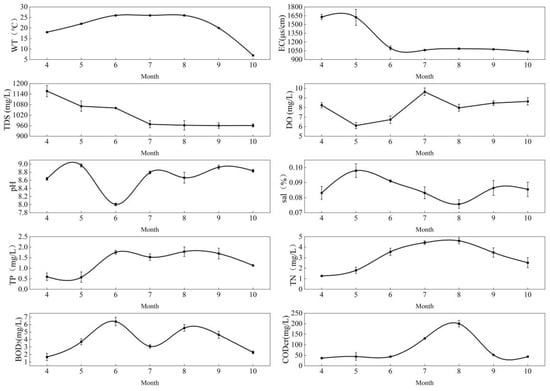
Figure 3.
Monthly changes in water environment indicators in 2021.

Table 1.
Annual changes in water environmental factors in the restoration process of the Dagangzipao Wetland (mean ± SE).
3.2. Changes in Phytoplankton Species Composition and Biomass during the Restoration of Saline Wetlands
A total of seven phyla and 86 species (refer to Table S1) were identified during the study, including 31 species of Chlorophyta, 30 species of Bacillariophyta, 15 species of Euglenophyta, 4 species of Cyanophyta, 3 species of Cryptophyta, 2 species of Pyrrophyta and 1 species of Chrysophyta. Among them, Chlorophyta and Bacillariophyta were the most abundant, accounting for 36.0% and 34.9% of the total number of species (Figure 4). The average phytoplankton biomass range in 2020 is 0.37 mg/L–3.59 mg/L, and the average phytoplankton biomass range in 2021 is 0.01 mg/L–1.44 mg/L, both reaching the maximum in August. Overall, with the continuation of wetland ecological restoration, phytoplankton biomass in 2021 was lower than that in 2020. (Figure 5 and Figure 6).
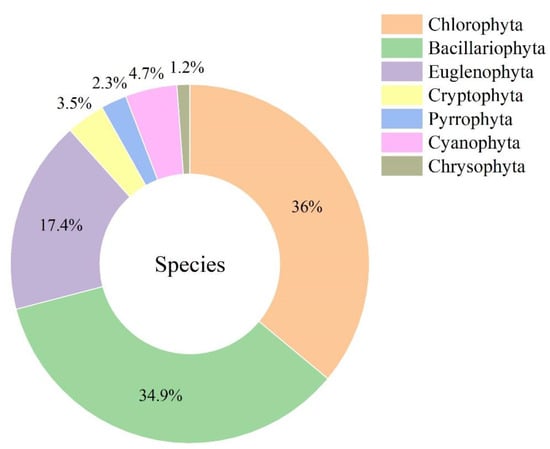
Figure 4.
Phytoplankton species composition during wetland restoration.
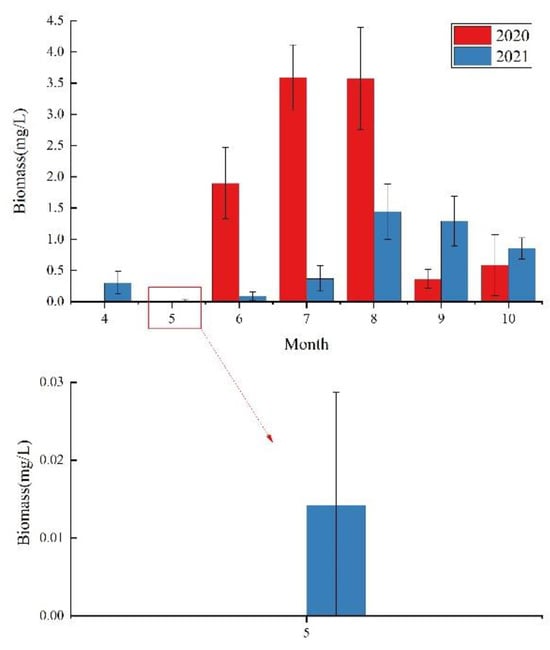
Figure 5.
Monthly mean biomass during wetland restoration.
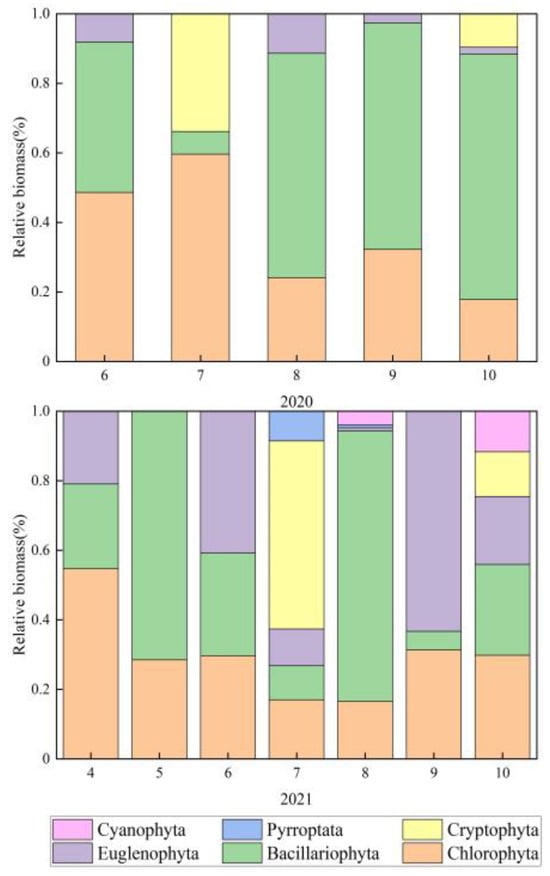
Figure 6.
Changes in the relative biomass of phytoplankton during wetland restoration.
3.3. Changes in the Dominant Functional Group of Phytoplankton during the Restoration of Saline Wetlands
According to the FG phytoplankton classification method (Table 2), in 2020, the phytoplankton could be classified into 18 functional groups, namely, B, D, M, MP, N, P, T, TB, X1, X3, Y, F, G, J, H1, Lo, W1, and W2, with the dominant functional groups being B, D, F, J, MP, W1 and X1. In 2021, phytoplankton can be classified into 17 functional groups, namely, B, D, M, MP, N, P, TB, X1, X3, Y, F, G, J, Lo, W1 and W2, respectively, with the dominant functional groups being B, D, J, MP, T and W1. Meanwhile, compared to 2020, with the continued restoration of the Dagangzipao Wetland, there was a decrease in the meso- to eutrophic indicator functional groups (such as F and X1 functional groups); functional groups B, D, J, MP, and W1 biomass all decreased (Figure 7).

Table 2.
Composition, habitat characteristics and dominance of FG in the Dagangzipao Wetland.
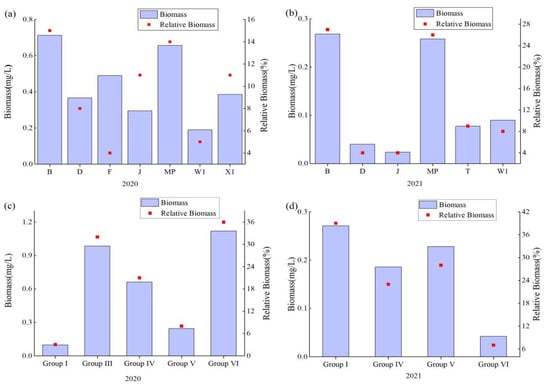
Figure 7.
Trends of biomass and relative biomass of dominant functional groups of FG and MBFG during wetland restoration. ((a). FG dominant functional group biomass in 2020; (b). FG dominant functional group biomass in 2021; (c). MBFG dominant functional group biomass in 2020; (d). MBFG dominant functional group biomass in 2021).
According to the MBFG classification method (Table 3), the dominant phytoplankton functional groups in 2020 were Groups I, III, IV, V, and VI. The dominant functional groups in 2021 were Groups I, IV, V, and VI. The biomass of functional groups including Groups IV, V and VI all decreased (Figure 7).

Table 3.
Composition, morphological description and dominance of the MBFG in the Dagangzipao Wetland.
3.4. Relationships between Phytoplankton and Aquatic Environmental Factors in Saline Wetlands
3.4.1. Correlation Coefficients between the Characteristics of Functional Groups of Aquatic Plants and Aquatic Environmental Factors
The Pearson analysis (Figure 8) showed that based on the FG classification method, functional group D was significantly positively correlated with TN (0.507, p < 0.01); functional group B was significantly positively correlated with TP (0.482, p < 0.05) and TN (0.521, p < 0.01); and functional group X1 was significantly negatively correlated with pH (−0.405, p < 0.05). Based on the MBFG classification method (Figure 9), Group I was highly significantly positively correlated with CODCr (0.613, p < 0.01); Group IV was highly significantly positively correlated with TP (0.511, p < 0.01); Group VI was significantly positively correlated with TDS (0.399, p < 0.05).
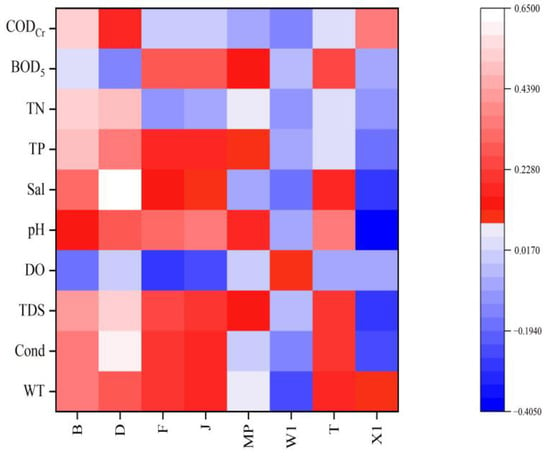
Figure 8.
Heat map of correlation between FG and water environmental factors.
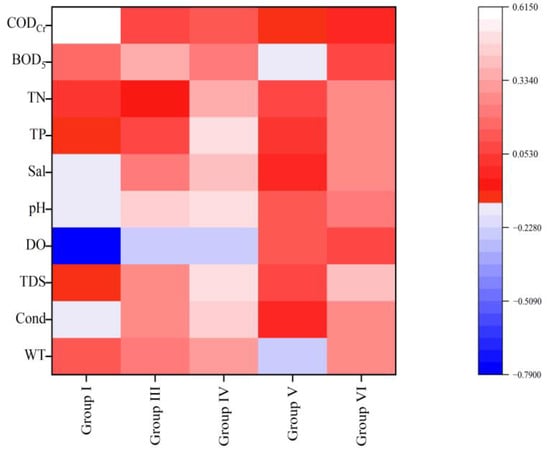
Figure 9.
Heat map of correlation between MBFG and water environmental factors.
3.4.2. Redundancy Analysis between Phytoplankton Functional Group Characteristics and Aquatic Environmental Factors
The correlation between the biomass of FGs and environmental factors in the Dagangzipao Wetland was high (Table 4), with correlation coefficients of 0.9251 and 0.9167 for axis 1 and axis 2, respectively. Axis 1 and 2 show 25.26% and 12.66% of the cumulative rate of change in the species data; the first two axes explain 37.92% of the cumulative rate of change in species data and explain 63.19% of the cumulative fitted variation, respectively, indicating that the first two axes are able to partially explain the distribution of the FGs. The correlation between environmental factors and the biomass of the MBFGs was lower than that of the FGs (Table 4), with correlation coefficients of 0.8807 and 0.8076 for the first two axes, respectively. Axis 1 explained 29.67% of the cumulative rate of change in species, and axis 2 explained 15.88% of the cumulative rate of change in species data; the first two axes explain 45.55% of the cumulative rate of change in species data and explain 78.56% of the cumulative fitted variation, indicating that the first two axes explained the distribution of a larger proportion of MBFGs. The results of the RDA analysis show that the MBFG has a higher degree of environmental interpretation than the FG in the saline wetlands of Dagangzipao, and the MBFG is more responsive to habitat. Therefore, the MBFG classification method is more applicable to saline wetlands than the FG method.

Table 4.
RDA results of biomass and environmental factors of different phytoplankton functional groups in the Dagangzipao Wetland.
The RDA results show (Figure 10) that, the key aquatic environmental factor affecting the dominant functional group B of FG was TP, the key aquatic environmental factor affecting the dominant functional group X1 was CODCr, and the key aquatic environmental factor affecting the dominant functional groups MP, J and F was TDS. The RDA results show (Figure 11) the key water environment factor affecting the MBFG Group I functional group is CODCr, the key water environment factor affecting the dominant Group III functional group is pH, the key water environment factor affecting the dominant Group IV functional group is TP and the key water environment factor affecting the dominant Group VI functional group is TDS.
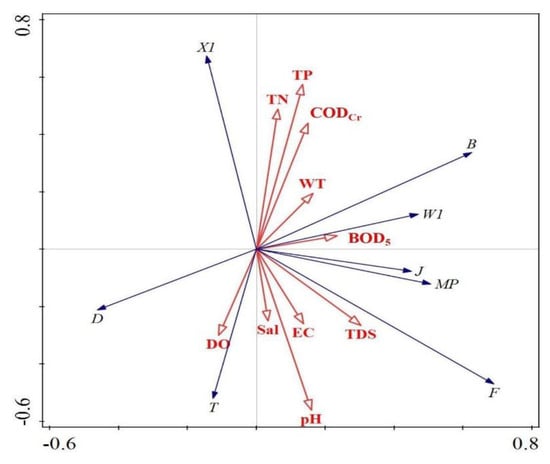
Figure 10.
Redundancy analysis of FG biomass and water environmental factors.
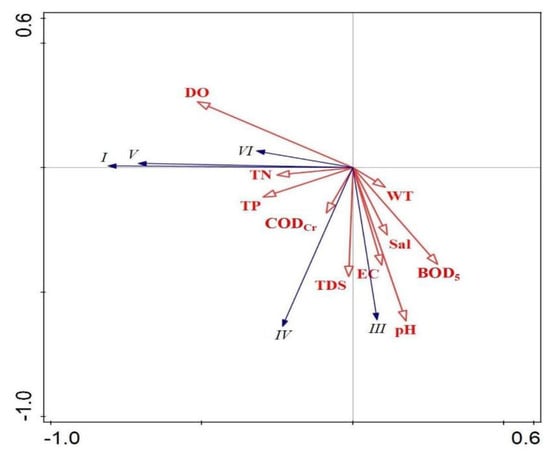
Figure 11.
Redundancy analysis of MBFG biomass and water environmental factors.
3.5. Water Quality Assessment of Saline-Alkali Wetlands
The F values were assigned with reference to the relevant Chinese literature [32], considering the distribution characteristics and status of phytoplankton in Chinese wetlands. The F values for each functional group in the water bodies of the Dagangzipao Wetland are shown in Table 2. The results of the Q-index evaluation for 2020 and 2021 are shown in Figure 12. In 2020, the Q-index of the wetland ranged from 2.051 to 3.839, with an average value of 3.238 and moderate to good water quality. In 2021, the Q-index ranged from 2.255 to 4.202, with an average value of 3.303, and the water quality was moderate to very good. In 2021, the Q-index average value was slightly higher than that in 2020, indicating that the water environment of the wetland improved over the recovery period.
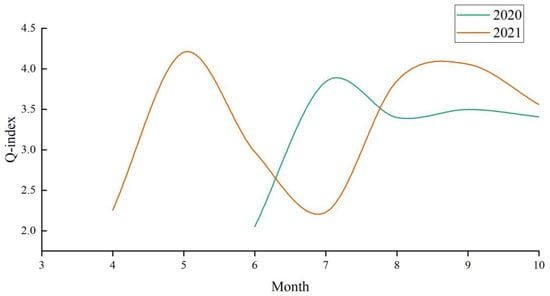
Figure 12.
Monthly variation in the Q-index during wetland restoration.
4. Discussion
4.1. Influence of Water Environment Indicators on Phytoplankton
Nitrogen and phosphorus are essential nutrients for phytoplankton growth and appropriate concentrations can have a positive impact on phytoplankton survival. Excess nitrogen and phosphorus from human activities can increase phytoplankton biomass, as has been demonstrated in parts of Indian waters [33]. Heavy summer rainfall in the Dagangzipao Wetland region agitates and transfers agriculturally produced nutrients and pollutants, which then enter the water body through surface or subsurface runoff. Wetland plant reeds cleanse N and P pollution. However, the limited cleaning capacity of wetland plants will result in a significant increase in N and P in the water when the pollution load exceeds the self-purification capacity. This will result in the growth of highly (temperature and nutrient) tolerant species, such as Chlorella, which will gradually become dominant [34]. Consequently, the phytoplankton biomass in the water column of the wetland was high in the summer season and was high in the early stages of wetland restoration. As ecological recharge proceeds and pollution sources are reduced, the water environment improves after summer, and Bacillariophyta, which are adapted to colder temperatures, tend to become the dominant species [35]. The change in water temperature also creates favourable conditions for the growth and reproduction of various phytoplankton species [36]. Sommer et al. [37] suggested that Cryptophytes and Bacillariophyta dominate in winter and spring, Chlorophyta in summer, and Bacillariophyta in autumn, which is similar to the results of this study.
The use of Q-index to monitor and assess the ecological status of aquatic systems requires an understanding of taxonomy in addition to ecological information about different phytoplankton taxa [38]. The results of the Q-index show that the water in Dagangzipao Wetland is in a good state most of the time, and the Q-index has good applicability in the water body of the Dagangzipao Wetland. It can not only directly respond to the water body by using the functional groups of phytoplankton in the water body, but can also predict the Cyanophyta bloom. For example, before the outbreak of Cyanophyta bloom, the Q-index will decrease sharply [39].
During wetland restoration, restoration measures provided rich habitat for phytoplankton in the saline wetland ecosystem of Dagangzipao Wetland, as well as increased plankton diversity.
4.2. Phytoplankton Community Composition during Wetland Recovery
In the process of wetland ecosystem restoration, usually there are more phytoplankton species, the number and the dominance degree of the dominant species of phytoplankton is lower, the structure of the phytoplankton community is more stable and the water quality is better [40]. During the restoration process of the saline wetland in Dagangzipao, the dominance degree of the main dominant species of phytoplankton was lower in the early stage of restoration than in the recent stage; therefore, it also reflects that the community structure of phytoplankton is relatively stable in the early recovery period. In addition, the reed-dominated aquatic plants in the water body of the saline wetland in the early stage of recovery played a certain role in the purification of the water body. In the early stage of restoration, the community composition had some similarity with that in the natural state, and with the extension of the restoration time, the phytoplankton community was relatively stable.
The composition of phytoplankton species reflects the results of adaptation to the water body environment. At different stages of wetland restoration, the environment is also changing, which may lead to different changes in phytoplankton species composition and quantity. During the restoration of the Dagangzipao Wetland, most of the indicator species of poor mesotrophication were found in the early stage of restoration, and in the middle and recent stages of restoration, the number of species of diatoms and Chlorophyta was higher, but the number of Chlorophyta dominated, which indicated that the environment of the water body improved with the continuation of restoration [41]. According to the indicative phytoplankton dominant species, the main dominant species in the early and middle stages of restoration of saline wetland in Dagangzipao were Chlorella and Microcystis meso-eutrophication indicator species, which may be related to the surrounding small-scale fish aquaculture, fish excreta and food residues that can easily cause the nutrient salts concentration in the water body to increase; this will also lead to the reproduction of a large number of Chlorophyta, which will gradually become the dominant species [41]. Recovery of the recent phytoplankton dominant species mainly consisted of mesotrophic indicator species such as pinniped algae, which might be related to the fact that the environment of the newly formed water body was insufficient to maintain the growth and reproduction of the existing species, and therefore the mesotrophic indicator species such as diatoms, which were able to adapt to the environment, gained the growth and competitive advantage, and became the dominant species.
4.3. Habitat Response Characteristics of FG- and MBFG-Dominant Functional Groups
Changes in the functional groups of phytoplankton are predominantly influenced by the nutrient content of the water column, the efficiency of nutrient uptake and use and the ability to capture light energy [42]. Specific functional groups correspond to the state of the water environment and their tolerance characteristics [42]. Functional group classification methods can better describe changes in the dominant phytoplankton species in water and can also better assess the response of phytoplankton to changes in the water environment [43].
In spring, the thawing temperature of the Dagangzipao Wetland was relatively low, which was not conducive to the survival of most phytoplankton. The cold-tolerant functional groups of D and MP may dominate in resource competition and population adaptation and gradually become the dominant taxa [44]. The heavy summer rainfall in the Dagangzipao Wetland causes surface runoff to flow through nearby farmland, carrying nutrients and increasing the nutrient content of the wetland water [45], which may allow phytoplankton to have a high biomass in the summer. Therefore, functional group B (which is suitable for mesotrophic environments), functional group J (which prefers eutrophic water habitats), and functional group W1 (which is suitable for moderate to eutrophic conditions) will become dominant during this period. This study found that by 2021, functional group X1 (dominated by Chlorophyta) had been replaced by functional group T, which is suited for a mixed homogeneous water environment. This indicates an improvement in the environmental water conditions of the wetland. Additionally, it may also be related to the local release of filter-feeding fish, which could weaken the dominance of functional group X1.
The Group I functional group is usually composed of Chlorella with high surface-to-volume ratios, which have fast growth rates, can tolerate some predation pressure and are suitable for growth in high pH, small to medium-sized shallow waters [46]. The Group III functional group is predominantly composed of Oscillatoria and Planctonema (filamentous algae with air sacs) and is suitable for growth in turbid waters, with high concentrations of pollutants and a high degree of sunlight. The biomass of this dominant functional group decreased in 2021, reflecting the improved environmental conditions in the Dagangzipao Wetland [46]. The Group V functional group consists of medium to large Euglena and Trachelomonas, which are highly competitive for resources and tolerant of resource stress, owing to their unique morphological characteristics [46], and therefore will be the dominant functional group. The dominance of Group VI (siliceous shell and no flagellated algae) in the wetland varied considerably over the two-year period. The high water temperature is not suitable for the phytoplankton in this functional group, which may have led to changes in its distribution, generally, in response to other functional groups.
4.4. Comparison of FG and MBFG Functional Grouping Methods
The results of the RDA (Table 4) showed that the functional grouping methods of MBFG were more environmentally interpreted than those of FG in the Dagangzipao Wetland ecosystem, with a high degree of habitat responsiveness. The MBFGs are based on morphological traits of individual phytoplankton and are primarily focused on community stability [46]. Hu et al. [18] showed that FGs are more accurately classified and provide a better explanation of the environment than MBFGs [18]. The precipitation in the Songnen Plain is characterized by strong phases and great changes. However, due to the differences in water supply and drainage methods and regional environment, the salt content in water bodies is also very different [47], resulting in salt and alkali being the basic characteristics of the water environment in the Songnen Plain. Where salinities and alkalinities fluctuate, interspecific differences in tolerance of salinity and alkalinity of algae play a major role in structuring algae communities [48]. For example, Cyclotella meneghiniana can continue to survive in a higher saline water environment and has a certain tolerance to salt and alkali to a certain extent. Some of the hydrochemical parameters related to nutrient concentrations show changes within the saline-base gradient, which is related to the mineralization and depletion processes of the biota [49]. An increase in salinity and alkalinity will result in a decrease in the growth rate and cell number of some freshwater or brackish water algae due to osmotic stress [48]. However, as phytoplankton are lower-order plants in the ecosystem, their adaptation to the environment partially depends on morphological traits [20]. The changes in the aquatic environment with the restoration of the saline-alkali wetland may have amplified the differences in phytoplankton morphological characteristics, highlighting the advantages of the MBFG in terms of habitat response. Consequently, the MBFG is a better interpreter of the environment than the FG. Therefore, the MBFG delineation method is more applicable to saline wetlands in the restoration period.
5. Conclusions
Phytoplankton functional group characteristics can reflect both the quality of the water environment of a water body and indicate the health of an aquatic ecosystem. The results of this study showed that the environmental water conditions improved during the restoration of the saline-alkali wetland, in which EC, TDS, DO, pH, Sal, TN, BOD5 and CODCr all decreased. The water quality assessment, based on phytoplankton functional groups, showed that the water quality of the Dagangzipao Wetland is at a moderate to good level. The results of the RDA showed that the environmental factors affecting the dominant FG were BOD5, TDS, and TP, and the environmental factors affecting the dominant MBFG were TP, CODCr, pH and TDS. The habitat responsiveness of the MBFGs in the Dagangzipao Wetland ecosystem was better than that of the FG classification method. To avoid the deterioration of the water environment, the use and management of pesticides and fertilizers should be strengthened to reduce the residues of pesticides and fertilizers in water bodies.
Supplementary Materials
The following supporting information can be downloaded at: https://www.mdpi.com/article/10.3390/d15121175/s1, Table S1: List of 86 species of phytoplankton in the Dagangzipao Wetland.
Author Contributions
G.C. and S.T. contributed to the study conception and design. Material preparation, data collection and analysis were performed by T.S., M.Z., Y.A., P.Z., B.S. and Z.Z. The first draft of the manuscript was written by Z.Z. and T.S. All authors have read and agreed to the published version of the manuscript.
Funding
This work was financially supported by the Key Project for Science and Technology Development of Jilin Province (20230303005SF), the Jilin Provincial Department of Science and Technology (20230508127RC), the National Key Research and Development Program of China (2022YFF1300903), the National Natural Science Foundation of China (42201113), the Natural Science Foundation Project of Jilin Province (20230101310JC), and Jilin Province Science and Technology Development Plan Project Academician Workstation (YDZJ202203CGZH023).
Institutional Review Board Statement
Not applicable.
Data Availability Statement
The datasets used and/or analysed during the current study are available from the corresponding author on reasonable request. The data are not publicly available due to privacy restriction.
Acknowledgments
We want to thank the teachers and students of the Wetland Ecology Engineering Group and the team members of the Wetland Research Center of Yanbian University for their contributions to sample collection and analysis.
Conflicts of Interest
The authors declare no conflict of interest.
References
- Pinckney, J.L.; Zingmark, R.G. Modelling the annual production of intertidal benthic microalgae in estuarine ecosystems. J. Phycol. 1993, 29, 396–407. [Google Scholar] [CrossRef]
- Moreno-Mateos, D.; Power, M.E.; Comin, F.A.; Yockteng, R. Structural and functional loss in restored wetland ecosystems. PLoS Biol. 2012, 10, e1001247. [Google Scholar] [CrossRef] [PubMed]
- Singh, S.; Bhardwaj, A.; Verma, V.K. Remote sensing and GIS based analysis of temporal land use/land cover and water quality changes in Harike wetland ecosystem, Punjab, India. J. Environ. Manag. 2020, 262, 110355. [Google Scholar] [CrossRef] [PubMed]
- Zhou, Y.; Liu, T.; Duan, L.; Wang, Y.; Li, X.; Li, M. Driving force analysis and landscape pattern evolution in the up stream valley of Xilin River Basin. Arid. Zone Res. 2020, 37, 580–590. [Google Scholar]
- Macreadie, P.I.; Anton, A.; Raven, J.A.; Beaumont, N.; Connolly, R.M.; Friess, D.A.; Kelleway, J.J.; Kennedy, H.; Kuwae, T.; Lavery, P.S. The future of Blue Carbon science. Nat. Commun. 2019, 10, 3998. [Google Scholar] [CrossRef] [PubMed]
- Xi, Y.; Peng, S.; Ciais, P.; Chen, Y. Future impacts of climate change on inland Ramsar wetlands. Nat. Clim. Chang. 2020, 11, 45–51. [Google Scholar] [CrossRef]
- Zhang, N.N.; Zang, S.Y. Characteristics of phytoplankton distribution for assessment of water quality in the Zhalong Wetland, China. Int. J. Environ. Sci. Technol. 2015, 12, 3657–3664. [Google Scholar] [CrossRef]
- Reid, A.J.; Carlson, A.K.; Creed, I.F.; Eliason, E.J.; Gell, P.A.; Johnson, P.T.; Kidd, K.A.; MacCormack, T.J.; Olden, J.D.; Ormerod, S.J. Emerging threats and persistent conservation challenges for freshwater biodiversity. Biol. Rev. 2019, 94, 849–873. [Google Scholar] [CrossRef]
- Van Rensburg, S.J.; Barnard, S.; Booyens, S. Comparison of phytoplankton assemblages in two differentially polluted streams in the Middle Vaal Catchment, South Africa. S. Afr. J. Bot. 2019, 125, 234–243. [Google Scholar] [CrossRef]
- Barton, S.; Jenkins, J.; Buckling, A.; Schaum, C.-E.; Smirnoff, N.; Raven, J.A.; Yvon-Durocher, G. Evolutionary temperature compensation of carbon fixation in marine phytoplankton. Ecol. Lett. 2020, 23, 722–733. [Google Scholar] [CrossRef]
- Sañé, E.; Valente, A.; Fatela, F.; Cabral, M.; Beltrán, C.; Drago, T. Assessment of sedimentary pigments and phytoplankton determined by chemtax analysis as biomarkers of unusual upwelling conditions in summer 2014 off the SE coast of Algarve. J. Sea Res. 2019, 146, 33–45. [Google Scholar] [CrossRef]
- Sim, D.Z.H.; Mowe, M.A.D.; Song, Y.; Lu, J.; Tan, H.T.; Mitrovic, S.M.; Roelke, D.L.; Yeo, D.C. Tropical macrophytes promote phytoplankton community shifts in lake mesocosms: Relevance for lake restoration in warm climates. Hydrobiologia 2021, 848, 4861–4884. [Google Scholar] [CrossRef]
- Zhong, Q.; Xue, B.; Noman, M.A.; Wei, Y.; Liu, H.; Liu, H.; Zheng, L.; Jing, H.; Sun, J. Effect of river plume on phytoplankton community structure in Zhujiang River estuary. J. Oceanol. Limnol. 2021, 39, 550–565. [Google Scholar] [CrossRef]
- Reynolds, C.S.; Huszar, V.; Carla, K.; Naselli-Flores, L.; Melo, S. Towards a functional classification of the freshwater phytoplankton. J. Plankton Res. 2002, 24, 417–428. [Google Scholar] [CrossRef]
- Hu, R.; Lan, Y.Q.; Xiao, L.J.; Han, B. The concepts, classification and application of freshwater phytoplankton functional groups. J. Lake Sci. 2015, 27, 11–23. (In Chinese) [Google Scholar]
- Padisák, J.; Borics, G.; Grigorszky, I.; Soróczki-Pintér, É. Use of phytoplankton assemblages for monitoring ecological status of lakes within the Water Framework Directive: The assemblage index. Hydrobiologia 2006, 553, 1–14. [Google Scholar] [CrossRef]
- Becker, V.; Caputo, L.; Ordóñez, J.; Marcé, R.; Armengol, J.; Crossetti, L.O.; Huszar, V.L. Driving factors of the phytoplankton functional groups in a deep Mediterranean reservoir. Water Res. 2010, 44, 3345–3354. [Google Scholar] [CrossRef]
- Hu, R.; Han, B.P.; Naselli-Flores, L. Comparing biological classifications of freshwater phytoplankton: A case study from South China. Hydrobiologia 2013, 701, 219–233. [Google Scholar] [CrossRef]
- Xiao, L.J.; Zhu, Y.Q.; Yang, Y.; Lin, Q.; Han, B.P.; Padisák, J. Species-based classification reveals spatial processes of phytoplankton meta-communities better than functional group approaches: A case study from three freshwater lake regions in China. Hydrobiologia 2018, 811, 313–324. [Google Scholar] [CrossRef]
- Kruk, C.; Huszar, V.L.M.; Peeters, E.T.H.M.; Bonilla, S.; Costa, L.; Lürling, M.; Reynolds, C.S.; Scheffer, M. A morphological classification capturing functional variation in phytoplankton. Freshw. Biol. 2010, 55, 614–627. [Google Scholar] [CrossRef]
- Song, T.J.; An, Y.; Wen, B.L.; Tong, S.Z.; Jiang, L. Very fine roots contribute to improved soil water storage capacity in semiarid wetlands in Northeast China. Catena 2022, 211, 105966. [Google Scholar] [CrossRef]
- Jiang, M.; Lv, X.; Xu, L.S.; Tong, S.Z. Perturbation Factors and Feedback of Wetland Ecosystem in the Songnen Plain. Resour. Sci. 2005, 27, 125–131. (In Chinese) [Google Scholar]
- Hu, H.J.; Wei, Y.X. Freshwater Algae in China—System, Classification and Ecology; Science Press: Beijing, China, 2006. (In Chinese) [Google Scholar]
- Long, S.; Zhang, T.; Fan, J.; Li, C.; Xiong, K. Responses of phytoplankton functional groups to environmental factors in the Pearl River, South China. Environ. Sci. Pollut. Res. Int. 2020, 27, 42242–42253. [Google Scholar] [CrossRef] [PubMed]
- Sournia, A. Phytoplankton Manual. In Monographs on Oceanographic Methodology; UNESCO: Paris, France, 1978; Volume 6, p. 337. [Google Scholar]
- Lin, K.; Pei, J.; Li, P.; Ma, J.; Li, Q.; Yuan, D. Simultaneous determination of total dissolved nitrogen and total dissolved phosphorus in natural waters with an on-line UV and thermal digestion. Talanta 2018, 185, 419–426. [Google Scholar] [CrossRef] [PubMed]
- Chen, G.M. Ammonium molybdate spectrophotometric method for determination of total phosphorus in municipal sewage sludge. China Water Wastewater 2006, 22, 85–86. [Google Scholar]
- Jouanneau, S.; Recoules, L.; Durand, M.; Boukabache, A.; Picot, V.; Primault, Y.; Lakel, A.; Sengelin, M.; Barillon, B.; Thouand, G. Methods for assessing biochemical oxygen demand (BOD): A review. Water Res. 2014, 49, 62–82. [Google Scholar] [CrossRef] [PubMed]
- Dyomin, V.; Davydova, A.; Morgalev, Y.; Olshukov, A.; Polovtsev, I.; Morgaleva, T.; Morgalev, S. Planktonic response to light as a pollution indicator. J. Great Lakes Res. 2020, 46, 41–47. [Google Scholar] [CrossRef]
- Zhang, M.; Yu, Y.; Yang, Z.; Kong, F. Deterministic diversity changes in freshwater phytoplankton in the Yunnan-Guizhou Plateau lakes in China. Ecol. Indic. 2016, 63, 273–281. [Google Scholar] [CrossRef]
- Ge, Y.; Zhou, Y.F.; Wang, C.H.; You, Y. Succession patterns of phytoplankton functional groups in western area of Yangcheng Lake and their relationship with environmental factors. China Environ. Sci. 2019, 39, 3027–3039. (In Chinese) [Google Scholar]
- Pan, C.M.; Liu, Y.; An, R.Z.; Ba, S. Phytoplankton in the Medika Wetland of Tibet—2. Characteristics of functional groups and their relationship with environmental factors. J. Lake Sci. 2022, 34, 1115–1126. (In Chinese) [Google Scholar]
- Gogoi, P.; Kumari, S.; Sarkar, U.K.; Lianthuamluaia, L.; Puthiyottil, M.; Bhattacharjya, B.K.; Das, B.K. Dynamics of phytoplankton community in seasonally open and closed wetlands in the Teesta-Torsa basin, India, and management implications for sustainable utilization. Env. Monit. Assess. 2021, 193, 810. [Google Scholar] [CrossRef] [PubMed]
- Tao, M.; Yue, X.J.; Luo, J.L.; Guo, T.; Wang, Y.M.; Liu, G.; Li, B. Seasonal succession characteristics and driving factors of phytoplankton functional groups in reservoirs in hilly areas of Sichuan Province. Chin. J. Hydrobiol. 2021, 45, 826–837. (In Chinese) [Google Scholar]
- Zhang, Y.; Peng, C.; Wang, J.; Huang, S.; Hu, Y.; Zhang, J.; Li, D. Temperature and Silicate Are Significant Driving Factors for the SeasonalShift of Dominant Diatoms in a Drinking Water Reservoir. J. Oceanol. Limnol. 2019, 37, 568–579. [Google Scholar] [CrossRef]
- Zhao, W.X.; Li, Y.Y.; Jiao, Y.J.; Zhou, B.; Vogt, R.D.; Liu, H.L.; Ji, M.; Ma, Z.; Li, A.D.; Zhou, B.H.; et al. Spatial and Temporal Variations in Environmental Variables in Relation to Phytoplankton Community Structure in a Eutrophic River-Type Reservoir. Water 2017, 9, 754. [Google Scholar] [CrossRef]
- Sommer, U.; Gliwicz, Z.M.; Lampert, W.; Duncan, A. The Peg-Model of Seasonal Succession of Planktonic Events In Fresh Waters. Archiv. Fur. Hydrobiol. 1986, 106, 433–471. [Google Scholar] [CrossRef]
- Sevindik, T.O.; Tunca, H.; Gonulol, A.; Gönülol, A.; Gürsoy, N.; Küçükkaya, Ş.N.; Kinali, Z. Phytoplankton dynamics and structure, and ecological status estimation by the Q assemblage index: A comparative analysis in two shallow Mediterranean lakes. Turk. J. Bot. 2017, 41, 25–36. [Google Scholar] [CrossRef]
- Istvánovics, V.; Clement, A.; Somlyódy, L.; Specziár, A.; G.-Tóth, L.; Padisák, J. Updating water quality targets for shallow Lake Balaton (Hungary), recovering from eutrophication. Hydrobiologia 2007, 581, 305–318. [Google Scholar] [CrossRef]
- Liu, D.Y.; Zhao, J.F.; Zhang, Y.L.; Yang, Y.C. Characteristics of phytoplankton community in eutrophic water bioremediation. Chin. J. Aquat. Biol. 2005, 2, 177–183. (In Chinese) [Google Scholar]
- Bohuslav, F.; Trans Luo, D.A. Algology; Shanghai Science and Technology Press: Shanghai, China, 1980. [Google Scholar]
- Reynolds, C.S. The Ecology of Phytoplankton; Cambridge University Press: New York, NY, USA, 2006. [Google Scholar]
- Salmaso, N.; Naselli-Flores, L.; Padisak, J. Functional Classifications and Their Application in Phytoplankton Ecology. Freshw. Biol. 2015, 60, 603–619. [Google Scholar] [CrossRef]
- O’Sullivan, P.E.; Reynolds, C.S. The Lakes Handbook, Volume 1: Limnology and Limnetic Ecology; John Wiley & Sons: New York, NY, USA, 2008. [Google Scholar]
- Jia, J.J.; Gao, Y.; Song, X.W.; Chen, S.B. Characteristics of phytoplankton community and water net primary productivity response to the nutrient status of the Poyang Lake and Gan River, China. Ecohydrology 2019, 12, 7679. [Google Scholar] [CrossRef]
- Rangel, L.M.; Soares, M.C.S.; Paiva, R.; Silva, L.H.S. Morphology-based functional groups as effective indicators of phytoplankton dynamics in a tropical cyanobacteria-dominated transitional river reservoir system. Ecol. Indic. 2016, 64, 217–227. [Google Scholar] [CrossRef]
- Deng, W.; He, Y.; Song, X.S.; Yan, B.Y. Hydrochemical characteristics of salt marsh wetlands in western Songnen Plain. J. Geogr. Sci. 2001, 11, 217–223. [Google Scholar]
- Kirst, G.O. Salinity Tolerance of Eukaryotic Marine Algae. Annu. Rev. Plant Physiol. Plant Mol. Biol. 1990, 41, 21–53. [Google Scholar] [CrossRef]
- Schubert, H.; Feuerpfeil, P.; Marquardt, R.; Telesh, I.; Skarlato, S. Macroalgal diversity along the Baltic Seasalinity gradient challenges Remane’s species-minimum concept. Mar. Pollut. Bull. 2011, 62, 1948–1956. [Google Scholar] [CrossRef]
Disclaimer/Publisher’s Note: The statements, opinions and data contained in all publications are solely those of the individual author(s) and contributor(s) and not of MDPI and/or the editor(s). MDPI and/or the editor(s) disclaim responsibility for any injury to people or property resulting from any ideas, methods, instructions or products referred to in the content. |
© 2023 by the authors. Licensee MDPI, Basel, Switzerland. This article is an open access article distributed under the terms and conditions of the Creative Commons Attribution (CC BY) license (https://creativecommons.org/licenses/by/4.0/).