Article

Multi-Locus Sequence Analysis Reveals the Genetic Diversity and Population Differentiation of Candidatus Liberibacter Asiaticus in China

1
School of Life Science, Gannan Normal University, Ganzhou 341000, China
2
National Navel Orange Engineering Research Center, Ganzhou 341000, China
3
South China Botanical Garden, Chinese Academy of Sciences, Guangzhou 510650, China
*
Author to whom correspondence should be addressed.
Diversity 2023, 15(12), 1161; https://doi.org/10.3390/d15121161
Submission received: 16 October 2023 / Revised: 17 November 2023 / Accepted: 19 November 2023 / Published: 22 November 2023

Abstract

:
Huanglongbing (HLB) is a devastating citrus disease caused by Candidatus Liberibacter asiaticus (CLas). Since its initial outbreak in Guangdong Province, China, it has spread to 10 provinces and caused significant economic losses. Hence, assessing CLas genetic diversity and demographic history is crucial for HLB epidemic prevention and control. In this study, we collected 500 leaf samples of CLas-infected plants from 10 provinces. We performed multi-loci sequence analysis on four gene fragments (omp, DnaA, GroEL, and SDE1) to explore the genetic differentiation and diversity of CLas in China. Our results indicated low nucleotide diversity (0.00005 ± 0.00001) in CLas, with the absence of significant systematic geographic structure in its distribution. Molecular variance analysis revealed predominant (81.7%) genetic variations within the population, with a minor variation (18.3%) occurring between populations as well as Yunnan provinces. In the Fujian population, significant gene exchange occurred with the other nine populations. Significant negative values in Tajima’s D and Fu’s FS neutrality tests indicated historical population expansions. The nucleotide mismatch distribution curve exhibits a single peak pattern, further supporting the expansion events. Our findings hold potential for advancing epidemiological research and providing suggestions for effective strategies to mitigate the spread of CLas and control HLB.

1. Introduction

Huanglongbing (HLB) is a globally significant and devastating citrus disease [1,2]. Three strains of phloem-limited bacteria cause the disease: Candidatus Liberibacter asiaticus (CLas), Candidatus Liberibacter africanus (CLaf), and Candidatus Liberibacter americanus (CLam) [3,4,5]. Research conducted in China has demonstrated that HLB is only associated with CLas [6]. HLB spreads to healthy plants through grafting and the Asian citrus psyllid (Diaphorina citri), which is the primary vector of CLas [7,8]. CLas resides within the body of the Asian citrus psyllid after feeding on infected plants. When infected psyllids feed on healthy citrus trees, they transmit CLas into the trees through salivary gland secretions. Once inside the citrus trees, CLas establishes, replicates, and spreads [9,10]. It infects various citrus plant tissues and fruits. HLB symptoms in citrus leaves include mottled yellowing, vein corking, and blotchy, chlorotic patterns, while on citrus fruits, HLB manifests as premature fruit drop, asymmetric yellowing, and bitter, misshapen fruit. Subsequently, the citrus tree undergoes a progressive decline in vitality, leading to metabolic disorders, compromised fruit quality, and, ultimately, plant death [11,12]. Currently, the absence of resistant cultivars to HLB poses a significant challenge for the sustainable production of citrus [13].
In China, HLB was initially detected in 1920 in the Chaoshan area in Guangdong Province, located in the southern region of the country [14]. Despite a century-long history of proactive measures aimed at controlling HLB, the disease has proliferated extensively across over 300 counties in 10 provinces within mainland China, including major citrus-growing regions [15,16]. This widespread dispersal has caused significant economic loss. Climate change has expanded suitable habitats for Asian citrus psyllids, leading to a yearly northward range extension. This phenomenon has further intensified the spread of HLB. It reported the invasion of HLB into the northern regions of China, thereby presenting heightened challenges for the prevention and control of CLas [17].
Systematic geography and population genetics research elucidate the spatial distribution and genetic diversity evolution within species [18,19]. In systematic geographical studies, combining multiple molecular markers has become a standard practice for capturing the complete lineage history of species [20,21]. Analyzing multi-locus sequences using molecular phylogenetics provides a robust method for studying bacterial population structure and plays a crucial role in disease epidemiology [22,23,24]. Multi-locus sequence analysis has the potential to provide insights into the genetic diversity and transmission dynamics of CLas. Consequently, strategies can be developed for limiting the dispersal of CLas and mitigating the impacts of HLB on the sustainable production of citrus fruits.
Several studies have used prophage typing as a tool for differentiating CLas populations in mainland China to gain a comprehensive understanding of their population structure and diversity [25]. This approach has revealed multiple origins and the spread of HLB through at least two distinct pathways, with potential influence from geographical altitude factors on the CLas population [23]. However, further confirmation is required, primarily due to the absence of historical literature and molecular evidence. Studies on the diversity of CLas in China have revealed distinct regional populations with prominent concentrations in Guangdong and Yunnan provinces [26]. These observations coincide with significant geographical variations in these regions. Recently, a study utilized four hypervariable genomic regions to examine the genetic diversity of CLas in the Fujian and Guangxi provinces of China. Notably, the results indicated that the genetic diversity of CLas appeared to be unaffected by geographical location, citrus varieties, and HLB symptoms [27]. Nevertheless, these studies do not provide comprehensive information on the epidemiology and distribution of HLB in other regions of mainland China, and there is limited knowledge about the demographic history.
This study analyzed 500 CLas leaf samples from 10 major citrus-growing provinces across China. We selected four conserved protein-coding loci fragments from the CLas genome (PSY26, GenBank accession number: CP001677.5) for sequencing and analysis: the coat protein gene (omp), the initiation protein gene (DnaA), the chaperone protein gene (GroEL), and the Sec-delivered effector 1 gene (SDE1) [28,29,30,31,32]. Our research aims to elucidate the genetic diversity and evolutionary relationships of CLas populations across varied geographical regions of China. We have observed that migration and selection potentially influence the diversity and genetic structure of regional populations. The results provide a scientific foundation for developing more effective prevention and control strategies to combat HLB, ultimately ensuring the sustainable production of the citrus crop.

2. Materials and Methods

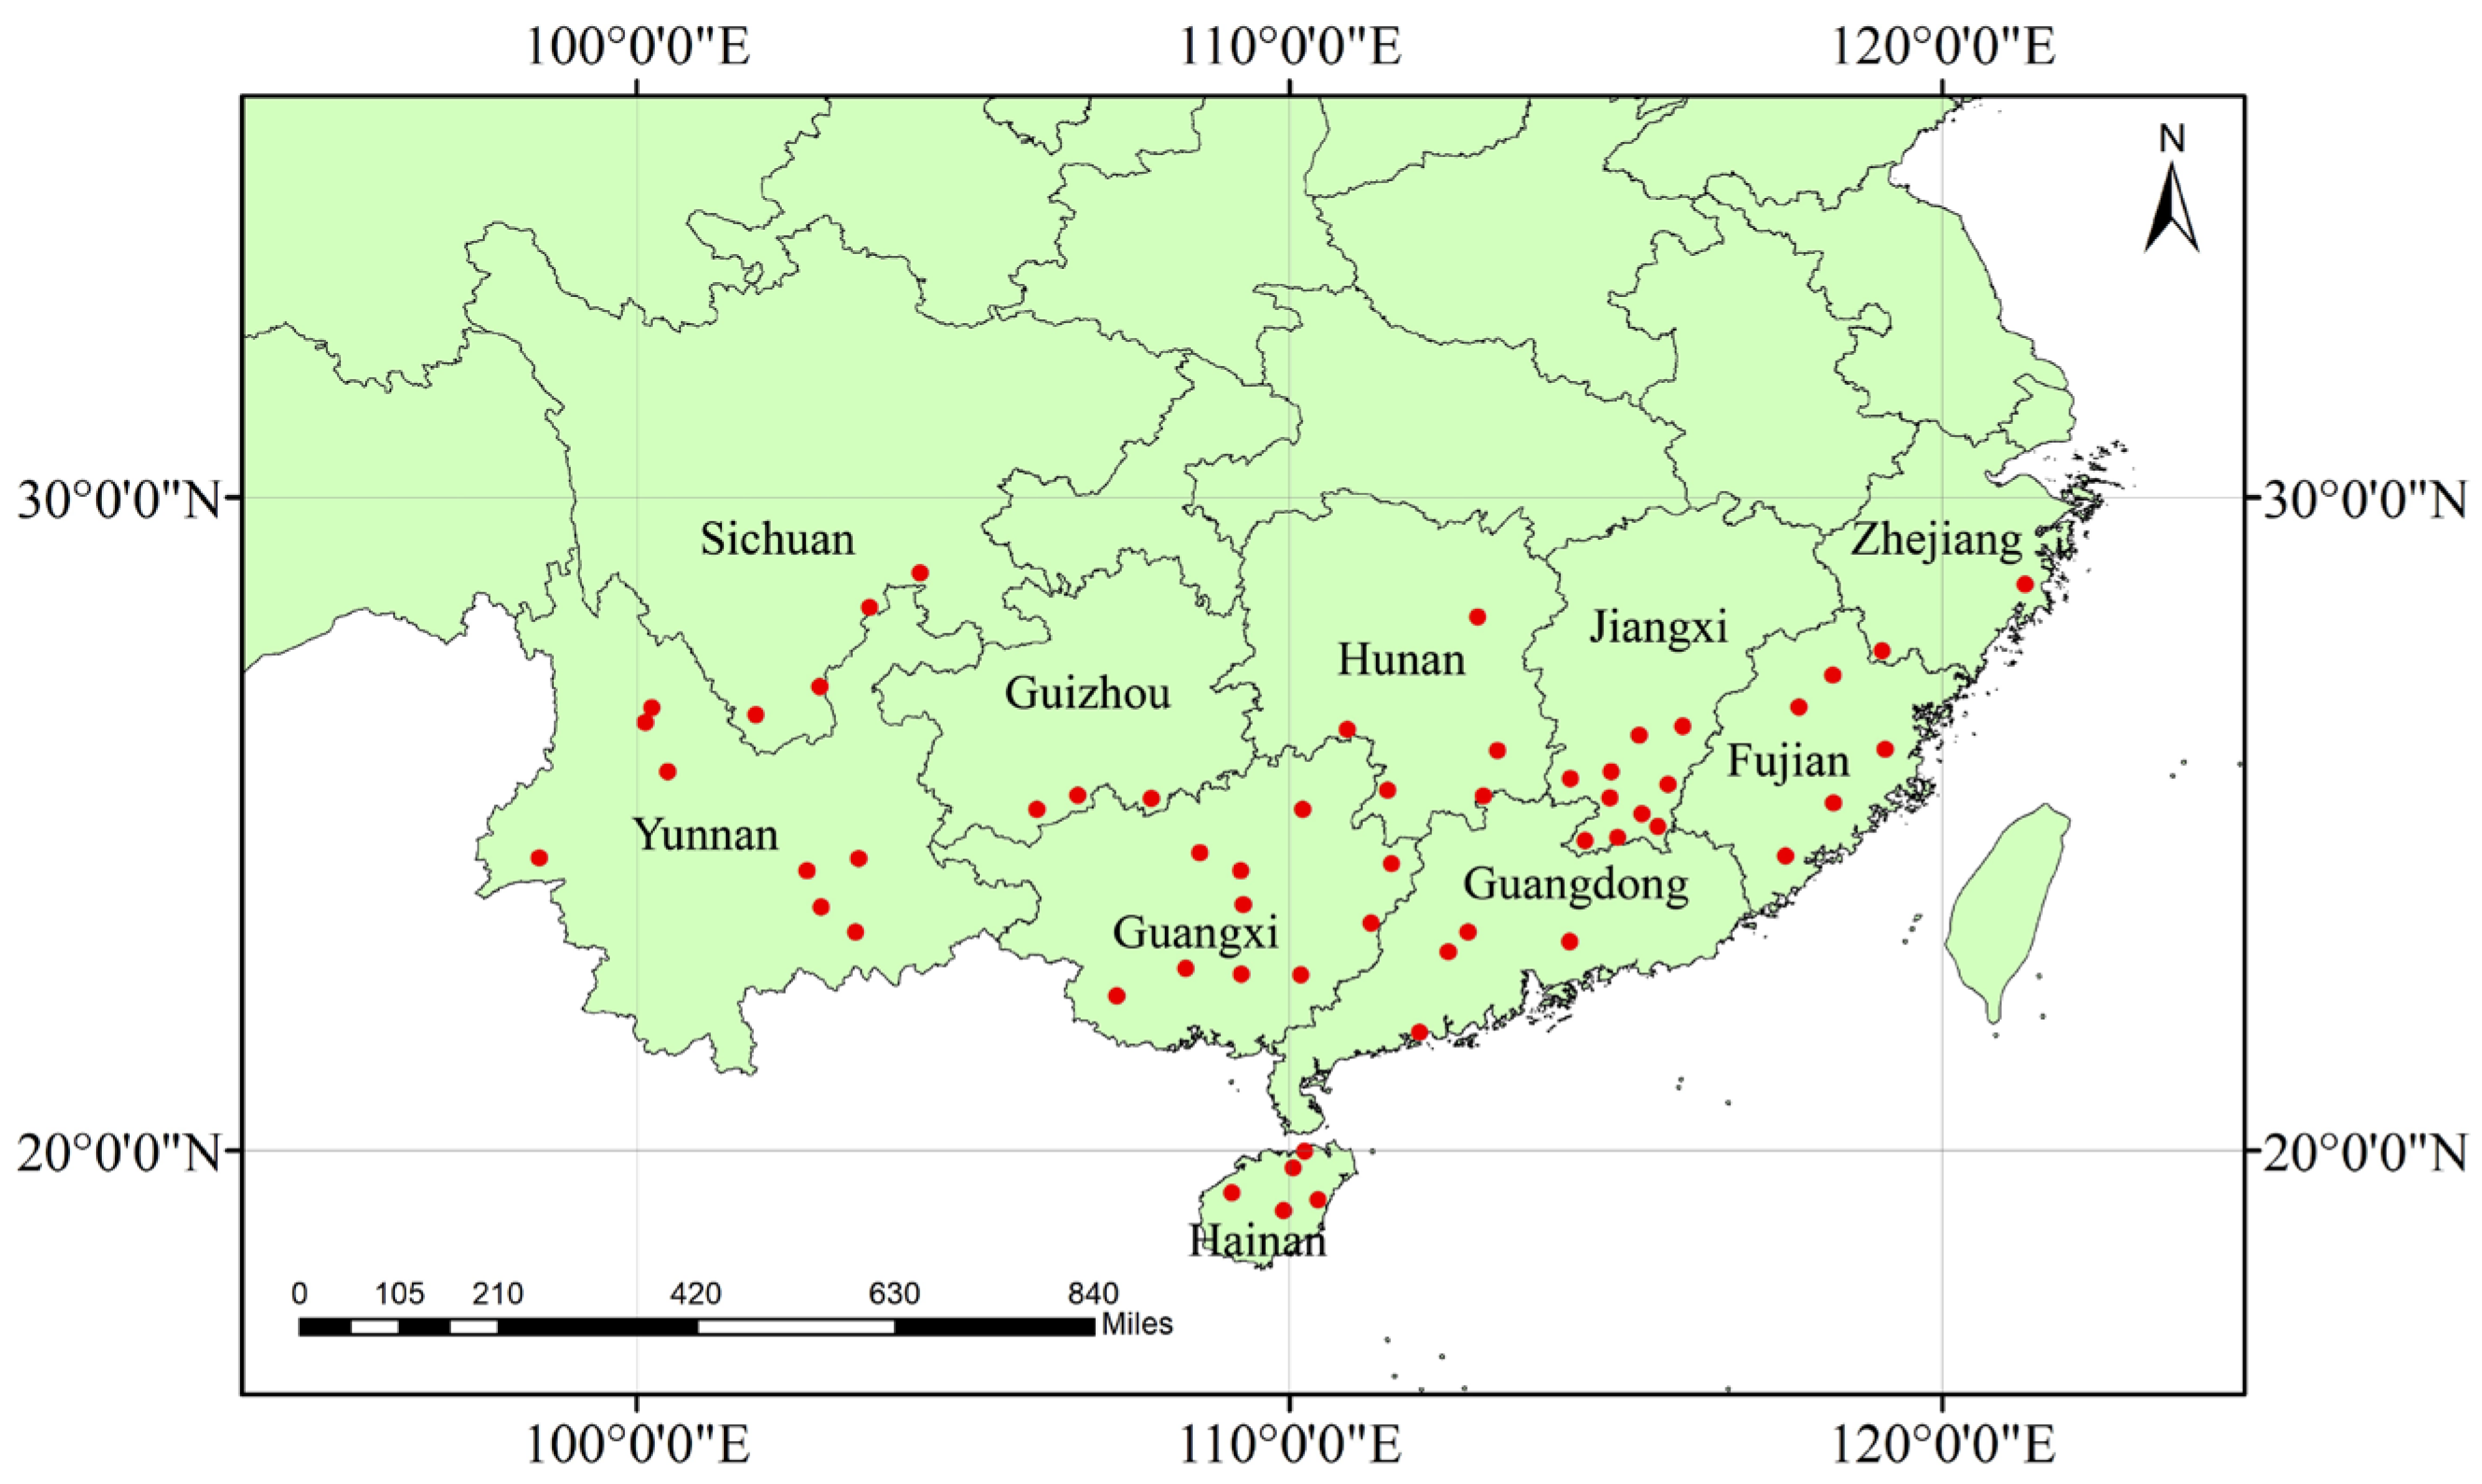
2.1. Sample Collection and DNA Extraction

We collected citrus leaf samples exhibiting suspected HLB symptoms from 10 provinces over the course of five years, from 2017 to 2023. We collected samples from the following provinces: Hainan, Yunnan, Sichuan, Guangxi, Guangdong, Fujian, Zhejiang, Guizhou, Hunan, and Jiangxi provinces (Figure 1 and Table S1). These symptoms included visual observation of the yellowing of new shoots, mottled leaves, and fruit deformity. We extracted genomic DNA from the midvein of fresh leaves using the CTAB method. A spectrophotometer (NanoDrop 2000, Thermo Fisher Scientific, New York, NY, USA) was used to measure the DNA concentration in each sample. Subsequently, the 16S ribosomal DNA fragment was amplified by PCR using the HLB pathogen-specific primer set OI1/OI2c [33]. Following that, CLas infection rates were determined by electrophoresis on agarose gels using a 2000 bp DNA marker. A total of 50 positive CLas samples were obtained from each province, considering samples from each province as a distinct geographical population. The DNA solution was stored at −20 °C for long-term preservation.

2.2. Amplification and Purification of PCR Products

We amplified four protein-coding gene fragments (omp, DnaA, GroEL, and SDE1) using PCR with specific primers and annealing temperatures, as indicated in Table 1. The primers were designed using the Primer3 online website (https://bioinfo.ut.ee/primer3) (accessed on 20 September 2021) and synthesized by Sangon Biotech Co., Ltd. (Shanghai, China). The reaction mixture consisted of 1 μL genomic DNA, 0.5 μL forward and reverse primers, 10 μL 2×Taq PCR mix (Tiangen Biotech Co., Ltd., Beijing, China), and 8 μL ddH2O. The PCR reaction was performed on the ProFlex™ PCR System (Thermo Fisher Scientific, New York, NY, USA) according to the following protocol: an initial pre-denaturation step at 94 °C for 5 min, followed by 35 cycles of denaturation at 94 °C for 45 s, annealing at 45–56 °C for 30 s, and extension at 72 °C for 60–90 s. A final extension step was carried out at 72 °C for 10 min. We separated the PCR products in a 1.5% agarose gel containing 0.5 μg/mL ethidium bromide and visualized them using a Bio-Rad gel documentation system (Bio-Rad Laboratories, Inc., Hercules, CA, USA). Subsequently, the PCR products were purified using a Tiangel Purification Kit (Tiangen Biotech Co., Ltd., Beijing, China). Bidirectional sequencing was conducted for all amplified products using the Sanger method at Sangon Biotech Co., Ltd. (Shanghai, China), with the same primers used for amplification and purification.

2.3. Sequence Assembly, Alignment, and Editing

We used the SeqMan 2.0 version for sequence assembly and editing. The MAFFT program was employed with default settings for sequence alignment, and manual adjustments were applied when necessary to eliminate poorly aligned regions and ambiguous, highly variable regions [34]. Sequences corresponding to representative haplotypes have been registered in GenBank under accession numbers OR531099-OR531106 and OR584140-OR584145. To analyze recombination, we employed RDP 4.0 on our dataset, but no recombination signal was detected [35]. Consequently, we integrated these four gene sequences for subsequent analysis.

2.4. Analysis of Genetic Diversity and Population Differentiation

We used DnaSP 6.0 to calculate genetic differentiation indices, including the genetic diversity index (FST) and genetic diversity metrics such as nucleotide diversity (Pi), haplotype diversity (Hd), number of haplotypes (H), and the count of the polymorphic site (S) [36]. Genetic differentiation between populations was examined through analyses of molecular variance (AMOVA) with 1023 permutations conducted via Arlequin 3.5 [37]. The PERMUT 2.0 software was used to evaluate whether the distribution of CLas exhibited significant systematic geographic structure by employing two metrics for assessing genetic differentiation: GST, a coefficient primarily dependent on haplotype frequencies, and NST, a coefficient influenced by both haplotype frequencies and the genetic distances between haplotypes. A significantly higher NST value relative to GST suggests the presence of phylogeographic structure [38]. Gene flow (Nm) between populations was calculated from the paired FST values using the equation: Nm = (1 − FST)/4 FST [39].
The degree of differentiation was classified as non-significant (FST < 0.05), moderately significant (0.05 < FST < 0.15), significant (0.15 < FST < 0.25), or highly significant (FST > 0.25). The gene flow values (Nm values) indicated the presence of gene flow (Nm < 1) or the absence of gene flow (Nm > 1) [39,40]. To infer the evolutionary relationship between haplotypes, haplotype networks were constructed using the TCS algorithm in PopArt 1.7 [41]. Our analysis treated continuous insertion and deletions as a single mutation event. The phylogenetic tree of haplotypes was constructed following the method of maximum likelihood and the Hasegawa-Kishino-Yano model. The bootstrap consensus tree, inferred from 1000 replicates, represents the evolutionary history of the analyzed taxonomic group.
We employed the Mega X to compute the synonymous substitution rate (dN) and non-synonymous substitution rate (dS) [42]. A dN/dS ratio of less than 1 suggests purifying selection, while a dN/dS ratio equal to 1 indicates neutral evolution. Conversely, a dN/dS ratio greater than 1 signifies positive selection [43].

2.5. Analysis of Demographic History

To investigate the demographic changes within each population of CLas, we conducted neutrality tests and mismatch distribution analyses using Arlequin 3.5 and DnaSP 6.0. Specifically, we applied two neutrality tests, Tajima’s D and Fu’s FS, to assess historical demographic expansion [44,45,46]. Tajima’s D and Fu’s FS are both widely used neutrality indices in molecular analysis to determine whether populations have recently undergone expansion. Tajima’s D test relies on mutation frequencies, whereas Fu’s FS test is derived from haplotype distribution. If population sizes remain stable, both values are expected to be near zero. Significant negative values indicate recent population expansion, while positive values suggest a population bottleneck. Particularly when a population has undergone expansion or continuous growth in the past, its mismatch distribution curve follows a unimodal Poisson distribution. In contrast, when the population size remains stable, the mismatch distribution curve displays a multi-modal distribution, and neutrality tests show positive values or do not reveal statistically significant deviations.

3. Results

3.1. Genetic Diversity and Population Differentiation

We obtained a sequence with a total length of 3841 bp, including four gene sequence fragments (omp-DnaA-GroEL-SDE1). Among these fragments, omp had a length of 929 bp, DnaA of 850 bp, GroEL of 1263 bp, and SDE1 of 439 bp. We conducted a recombination signal test using RDP 4.0 and found no evidence of recombination among the samples.
We identified a total of 12 polymorphism sites (S). Haplotype diversity (Hd) and nucleotide diversity (Pi) were calculated as 0.169 ± 0.022 and 0.00005 ± 0.00001, respectively. Within the sampled provinces, Yunnan and Sichuan exhibited higher levels of haplotype diversity (0.460 ± 0.078 and 0.490 ± 0.031) and nucleotide diversity (0.00015 ± 0.00003 and 0.00014 ± 0.00001). No mutations or insertions/deletions were detected in the samples collected from Guizhou and Jiangxi provinces. Furthermore, our analysis revealed that Yunnan and Zhejiang harbored the most significant number of haplotypes within their respective populations, each having four haplotypes (Table 2). Furthermore, upon examination of the four selected genes, no variation was detected in the DnaA gene sequence. In contrast, the SDE1 gene sequence exhibited the highest levels of nucleotide diversity (0.00031 ± 0.00005) and haplotype diversity (0.136 ± 0.00042). Notably, the dN/dS ratios of the GroEL and OMP genes were both less than 1, indicating that these two genes are undergoing purifying selection. Conversely, no mutations were detected in the DnaA gene, suggesting its stability. Furthermore, our analysis of SDE1 revealed that only non-synonymous substitutions occurred, while no synonymous substitutions were observed (Table 3).
AMOVA of multi-loci sequences in ten populations of CLas revealed that 18.3% of the genetic variation was attributed to differences among populations, while 81.7% of the variation was found within populations (Table 4). A fixed index (FST) value of 0.18693 implies a significant level of genetic differentiation among the 10 populations. Specifically, we observed significant genetic differentiation between Sichuan Province and the remaining nine provinces, as indicated by an FST value greater than 0.05. This pattern was also observed between Sichuan Province and its neighboring province, Yunnan. Furthermore, individuals from Sichuan and Hunan, as well as Sichuan and Guangdong populations, exhibited the highest FST value (Table S2) of 0.39629, suggesting a relatively high degree of genetic differentiation between these populations. Intriguingly, apart from Sichuan and Yunnan provinces, Zhejiang Province did not exhibit significant genetic differentiation with the other seven provinces, as reflected by an FST value below 0.05.

3.2. Identification and Distribution of Haplotypes

We identified a total of 11 haplotypes designated as H1 to H11 by analyzing 12 polymorphic loci within the multi-loci joint sequences. Among these haplotypes, H1 is the most widely distributed and is found in all sampled provinces. Other haplotypes are derived from the H1 haplotype, suggesting that H1 may be the ancestral haplotype. The second most common haplotype is H2, which is located in the Yunnan and Sichuan populations. The third common haplotype, H3, is found in the Fujian and Zhejiang populations. Furthermore, unique haplotypes were found in six geographical populations: Hunan population (H6), Guangdong population (H7), Guangxi population (H11), Yunnan population (H9, H10), Zhejiang population (H3, H4), and Hainan population (H5).
We constructed a minimum-span haplotype network using PopART. Figure 2 illustrates the genetic lineage of the haplotypes. Observations indicate that haplotypes H2-H10 originated from a single mutation within the H1 haplotype, whereas H11 diverged from three mutations within the H1 haplotype. Figure 3 depicts the evolutionary relationship between haplotypes, and the clustering of this phylogenetic tree can reveal connections between different haplotypes. The bootstrap value associated with the tree is significantly low. Despite this limitation, the clustering of the tree can still provide insights into the evolutionary relationships between haplotypes. The haplotypes in the first branch are predominantly found in Fujian, Zhejiang, Hunan, Guangdong, and Hainan. The haplotypes in the second branch are found in Sichuan and Yunnan, while the third branch represents Guangxi and the shared haplotype H1.

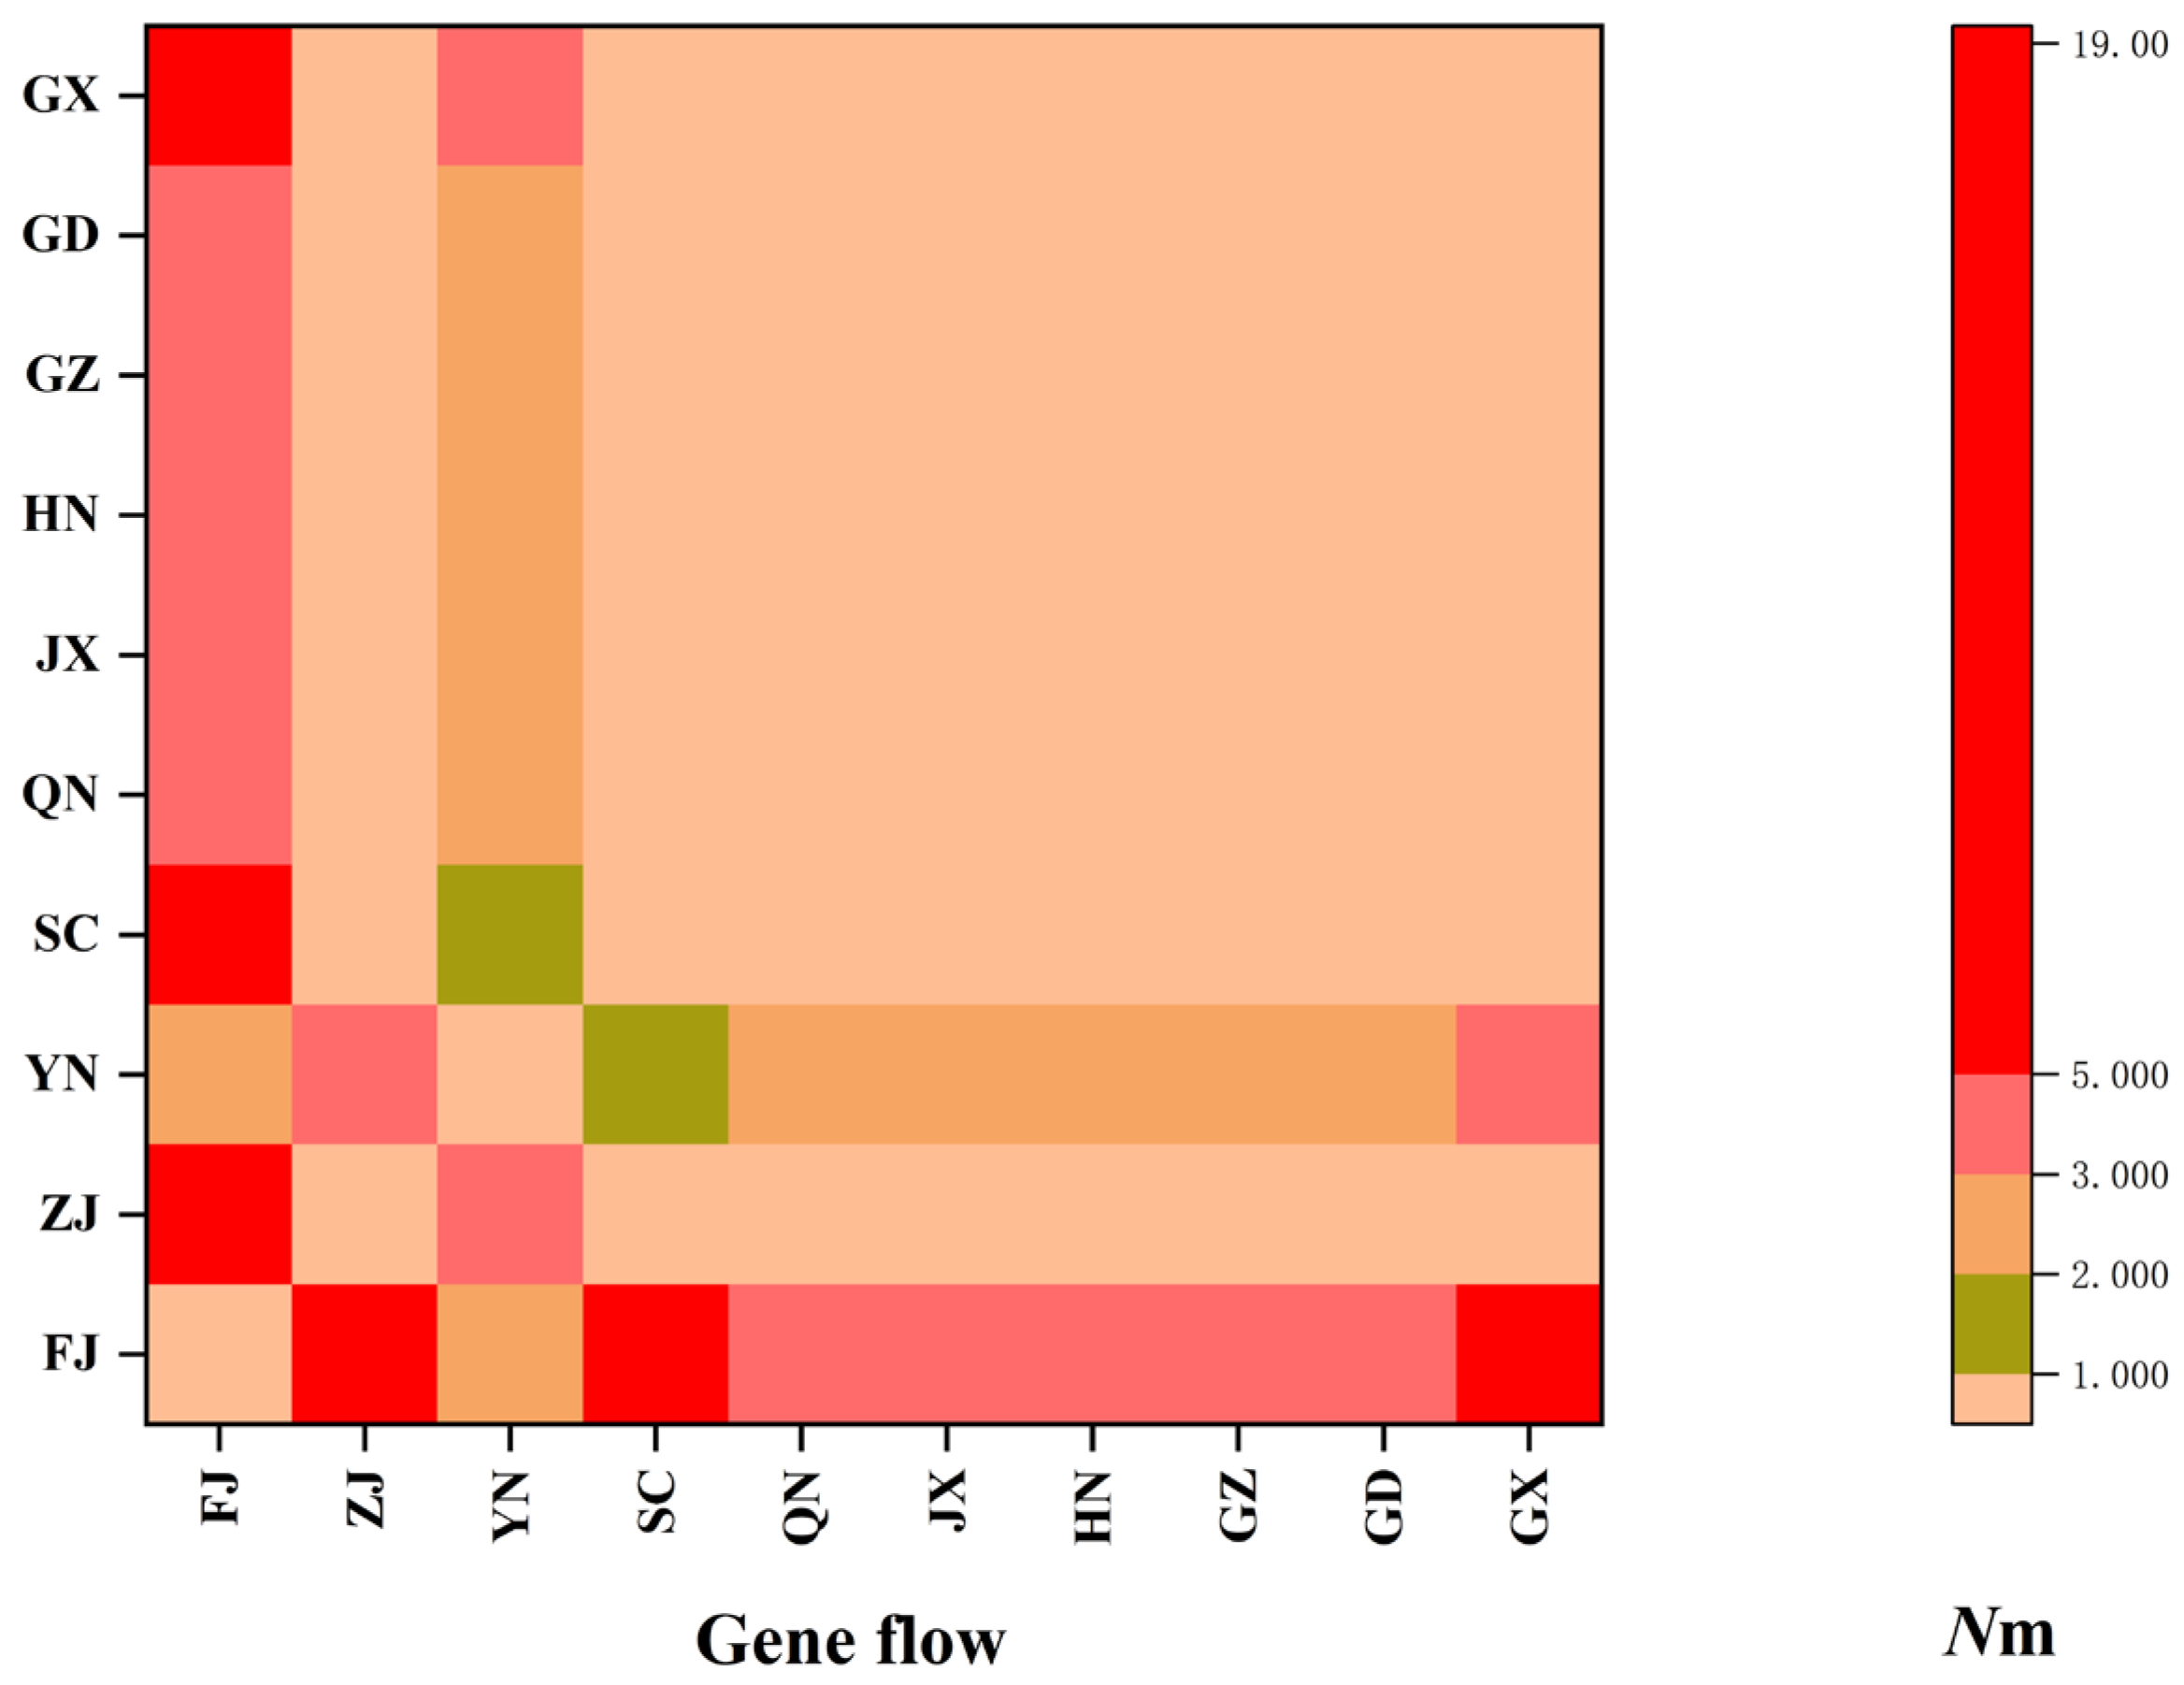
3.3. Gene Flow and Demographic History

The neutrality test results indicated statistical significance, as Tajima’s D (−1.98492, p < 0.05) and Fu’s FS (−15.17394, p < 0.05) both yielded values below 0 (Table 5). The observed curve in the mismatch distribution analysis demonstrated a characteristic unimodal distribution pattern (Figure 4), indicative of population expansion. Due to the absence of variation in the sample sequences collected in Guizhou and Jiangxi provinces, the neutrality test results are unavailable. It is noteworthy that the Tajima’s D and Fu’s FS values in Sichuan Province are greater than 0, yet not statistically significant, suggesting that the province may be in a state of stability or contraction (Table 5). We observed that gene flow between populations at the species level, denoted as Nm = 1.09, exceeds 1, signifying a high frequency of gene exchange among populations. Moreover, our gene flow analysis revealed that the Nm values between the Fujian geographical population and the other nine geographical populations consistently exceeded 1 (Figure 5, Table S3). A parallel trend was likewise observed between the Yunnan geographical population and the other nine geographical populations.

4. Discussion

The citrus industry in China encompasses a diverse array of regions, comprising subtropical and tropical areas in the south, alongside temperate regions in the north, and extending over 2.5 million hectares of cultivated land [47]. HLB was first reported in Guangdong. It is reasonable to conclude that HLB was either introduced from outside of China or is endogenous [48]. However, comprehensive scientific investigations are required to establish conclusive evidence. The causative agent, CLas, is a gram-negative bacterium that has not yet been successfully cultured in vitro. This limitation poses significant challenges to studying its biological characteristics and developing sustainable management strategies aimed at mitigating economic loss [49]. CLas has proliferated extensively throughout the majority of citrus cultivation regions in mainland China, impacting over 300 counties spanning ten provinces and inflicting substantial losses to the citrus crops [16].
The significant impact of the CLas pathogen in China underscores the paramount significance of analyzing its genetic diversity and population differentiation. Researchers have suggested that limitations arise when estimating the genetic diversity and population structure of CLas in various regions using a single locus [23,50]. Different selection pressures during evolution may lead to varying degrees of variation at each locus [51]. Previous reports have indicated that certain genetic regions in CLas isolates, such as the rplKAJL-rpoBC operon, 16S rRNA gene, and 16S/23S rRNA intergenic region, exhibit high conservation and may not fully reflect the differences between CLas isolates [52,53,54]. Subsequent studies have attempted to assess the variations between CLas populations in Guangdong and Yunnan provinces using a bacteriophage molecular marker (CLIBASIA_05610) [55]. However, the observed sequence variations were too subtle to differentiate between the two populations. To elucidate the genetic structure, differentiation, and diversity of CLas with greater precision, we collected 500 CLas samples from 10 provinces and conducted sequencing on four protein-coding gene fragments. This effort produced a 3481 bp sequence of DNA.
We identified a total of 12 mutation sites and 11 haplotypes, indicating the relative stability of each gene across diverse geographical populations. Although only 11 haplotypes were found, the haplotype network exhibited a perceptible and structured pattern. Yunnan and Sichuan provinces exhibited more identical haplotypes H2. In contrast, Fujian and Zhejiang provinces had a higher occurrence of identical haplotypes H3, which may be two unique lineages. This suggests a closer genetic relationship between Yunnan and Sichuan, as well as between Fujian and Zhejiang, potentially attributed to their close proximity. This may be due to similar environmental conditions or shared practices in cultivation and transportation [56,57]. The presence of distinct haplotypes in the sampled provinces can be attributed to adaptive variations of CLas in different environments, which aligns with the fundamental principle of natural selection: genetic variation within a population directly correlates with its adaptability to the environment [58,59].
Population differentiation is generally associated with geographic distance [60,61]. Some studies have utilized bacteriophage genotyping to explore the population structure of CLas in different regions, suggesting a potential correlation between the population structure of CLas and altitude [23,56]. Nonetheless, our study did not reveal a clear systematic geographic structure in the different populations of the combined multi-locus sequence, as indicated by GST > NST. This absence of structure could be attributed to the widespread commercial cultivation of citrus in recent years. According to the algorithm of the software, when GST exceeds NST, it is indicative of an absence of geographical structure, and we hypothesize that large-scale planting practices may contribute to this outcome. Furthermore, the reduced genetic diversity (Pi = 0.00005 ± 0.00001) observed within populations may elucidate the absence of a distinct geographic pattern. Low genetic diversity indicates comparatively minor genetic distinctions among individuals within the population, potentially attributable to genetic drift or other influencing factors [27,62].
The Yunnan population exhibits the highest level of genetic diversity among the 10 geographical populations studied, which has also been partly confirmed by other studies [29]. This can be attributed to the pivotal role of Yunnan Province as a central hub, facilitating significant gene flow with the other nine provinces. Relevant literature has suggested that Yunnan may serve as a potential hub for transmission due to its close proximity to Thailand [63]. However, our data provides empirical evidence indicating that Yunnan exhibits gene flow with nine other provinces, corresponding to preexisting observations. According to existing literature and historical records, Guangdong Province was the first region in China to detect CLas and is considered a potential center of origin for the HLB [6]. However, our study did not detect any mutations within the Guangdong population, a phenomenon potentially attributable to sampling limitations. Nevertheless, we have identified evidence of gene flow between the Fujian population, located adjacent to Guangdong, and the other nine geographical populations. Historical records indicate that HLB was discovered earlier in Taiwan in comparison to its presence in Guangdong [16]. Therefore, we speculate that Fujian may be one of the origins of CLas in mainland China, as it is closer to Taiwan Province and has frequent trade exchanges. A study examining the genetic diversity of CLas in various geographic regions and citrus varieties in Brazil suggested that citrus genotypes might be driving factors for CLas genetic diversity [64]. However, a recent study investigated the genetic diversity of CLas in Fujian and Guangxi provinces using four highly variable genomic regions and found no correlation between CLas genetic diversity and geographical location or citrus varieties [29,52]. Our study indicates significant gene flow between Guangxi and Fujian, which could help explain these findings. However, the lack of variety records in our study limited the analysis of CLas genetic diversity among host varieties.
AMOVA results revealed that 81.7% of the variation occurred within the population, while 18.3% occurred among populations. This pattern may be due to differences in individual adaptability and survival competitiveness in specific environments that promote the accumulation of variation within the population. The limited quantity of variation observed among populations may indicate an insignificant degree of differentiation between species. Despite some gene exchange, it remains insufficient to induce substantial interpopulation differences, possibly due to the masking effects of population expansion on the influences of natural selection and genetic drift [65,66].
The results of the neutral test analysis demonstrated that Tajima’s D value and Fu’s FS value showed negative values, both reaching a significant level (p < 0.05). This pattern may indicate historical population expansion events. The distribution of nucleotide mismatch points followed a unimodal curve, further supporting the hypothesis of the expansion process. The transportation of citrus germplasm resources between major citrus production regions may have facilitated the spread of the psyllid carrying the CLas and citrus seedlings [2,67]. However, we detected insignificant positive values in Sichuan Province, indicating that the province has experienced a population bottleneck. This may be due to the positive effects of Sichuan Province’s active use of interception measures to prevent and control HLB [16,17]. Consequently, long-distance human-assisted dispersal may have significant implications for the genetic structure of CLas.
In this study, we calculated the divergence index and gene flow of CLas by sequencing SNP sites and constructed a haplotype network diagram to illustrate the relationships between various populations, encompassing all endemic provinces in China. This comprehensive analysis provides valuable insights into the demographic history and genetic diversity of CLas for HLB epidemic prevention and control in the citrus industry. However, the relatively high conservation of the selected four genes resulted in minimal sequence variation between different CLas groups, thus limiting a comprehensive geographical analysis of Clas [23,68]. To gain a deeper understanding of the tracking and migration history of CLas, future research is recommended to prioritize the expansion of the sample size and conduct analyses targeting different varieties or using genomic data. This approach will contribute to a more comprehensive understanding of genetic variation and population dynamics within CLas.

5. Conclusions

This study analyzed the genetic diversity and differentiation of four conserved protein-coding genes, specifically omp, DnaA, GroEL, and SDE1, in the genome of the CLas population through sequencing. We confirmed the minimal nucleotide diversity of CLas, and most genetic variations occurred within the population (81.7%), while a minor portion occurred between populations (18.3%). We also observed that Yunnan and Sichuan share the same haplotype H2, while Fujian and Zhejiang share the same haplotype H3, indicating that Yunnan and Sichuan, as well as Fujian and Zhejiang, are unique lineages. Neutrality testing demonstrates a population expansion event in China for CLas, and we propose that long-distance human-assisted dispersal may have significant implications for the genetic structure of CLas. The findings of this study may contribute to epidemiology research and the development of an efficient strategy for controlling HLB.

Supplementary Materials

The following supporting information can be downloaded at: https://www.mdpi.com/article/10.3390/d15121161/s1, Table S1: The location and numbers of different populations of CLas; Table S2: The pairwise FST value between different populations; Table S3: Nm values of CLas populations in China.

Author Contributions

Conceptualization, P.Y., M.B. and L.Y.; methodology, P.Y., J.Z. and L.Y.; software, P.Y., J.Y. and S.F.; investigation, J.Y. and S.F.; formal analysis, P.Y., M.B.A., M.B., J.Z. and L.Y.; data curation, P.Y., M.B. and J.Z.; supervision and funding acquisition, L.Y.; writing—original draft preparation, P.Y. and M.B.A.; writing—review and editing, P.Y., M.B.A. and L.Y. All authors have read and agreed to the published version of the manuscript.

Funding

This research was supported by the National Natural Science Foundation of China (32160625), the Science and Technology Project of Jiangxi Province (20225BCJ22005), and the National Key Research and Development Program of China (2021YFD1400805).

Institutional Review Board Statement

Not applicable.

Data Availability Statement

The data presented in this study are available in an article or Supplementary Material.

Conflicts of Interest

The authors declare no conflict of interest.

References

  1. Bové, J.M.; Barros, A.P.D. Huanglongbing: A destructive, newly emerging, century-old disease of citrus. J. Plant Pathol. 2006, 88, 7–37. [Google Scholar]
  2. Morelli, M.; Takayassu, F.H.; Pacheco, C.D.; da Conceiçao, P.M.; Della Coletta, H.; de Azevedo, F.A. Impact of HLB on the physiological quality of citrus rootstock seeds and non-vertical ‘Candidatus Liberibacter asiaticus’ transmission. Trop. Plant Pathol. 2020, 45, 620–625. [Google Scholar] [CrossRef]
  3. Lu, J.M.; Delatte, H.; Reynaud, B.; Beattie, G.A.C.; Holford, P.; Cen, Y.J.; Wang, Y.J. Genome Sequence Resource of ‘Candidatus Liberibacter asiaticus’ from Diaphorina citri Kuwayama (Hemiptera: Liviidae) from La Reunion. Plant Dis. 2021, 105, 1171–1173. [Google Scholar] [CrossRef]
  4. Lin, H.; Pietersen, G.; Han, C.; Read, D.A.; Lou, B.; Gupta, G.; Civerolo, E.L. Complete Genome Sequence of “Candidatus Liberibacter africanus,” a Bacterium Associated with Citrus Huanglongbing. Genome Announc. 2015, 3, e00733-15. [Google Scholar] [CrossRef]
  5. Lin, H.; Coletta-Filho, H.D.; Han, C.S.; Lou, B.; Civerolo, E.L.; Machado, M.A.; Gupta, G. Draft Genome Sequence of “Candidatus Liberibacter americanus” Bacterium Associated with Citrus Huanglongbing in Brazil. Genome Announc. 2013, 1, e00275-13. [Google Scholar] [CrossRef]
  6. Yu, S.S.; Zhu, A.N.; Song, W.W.; Yan, W. Molecular Identification and Characterization of Two Groups of Phytoplasma and Candidatus Liberibacter Asiaticus in Single or Mixed Infection of Citrus maxima on Hainan Island of China. Biology 2022, 11, 869. [Google Scholar] [CrossRef]
  7. Blaustein, R.A.; Lorca, G.L.; Teplitski, M. Challenges for Managing Candidatus Liberibacter spp. (Huanglongbing Disease Pathogen): Current Control Measures and Future Directions. Phytopathology 2018, 108, 424–435. [Google Scholar] [CrossRef]
  8. Xie, Z.; Zhao, K.; Long, J.H.; Zhen, L.; Zou, X.P.; Chen, S.C. Comparative analysis of Wanjincheng orange leaf and root responses to ‘ Candidatus liberibacter asiaticus’ infection using leaf-disc grafting. Hortic. Plant J. 2021, 7, 401–410. [Google Scholar] [CrossRef]
  9. Hosseinzadeh, S.; Shams-Bakhsh, M.; Mann, M.; Fattah-Hosseini, S.; Bagheri, A.; Mehrabadi, M.; Heck, M. Distribution and Variation of Bacterial Endosymbiont and “Candidatus Liberibacter asiaticus” Titer in the Huanglongbing Insect Vector, Diaphorina citri Kuwayama. Microb. Ecol. 2019, 78, 206–222. [Google Scholar] [CrossRef]
  10. Pelz-Stelinski, K.S.; Brlansky, R.H.; Ebert, T.A.; Rogers, M.E. Transmission parameters for Candidatus liberibacter asiaticus by Asian citrus psyllid (Hemiptera: Psyllidae). J. Econ. Entomol. 2010, 103, 1531–1541. [Google Scholar] [CrossRef]
  11. Yang, C.Y.; Ancona, V. An Overview of the Mechanisms Against “Candidatus Liberibacter asiaticus”: Virulence Targets, Citrus Defenses, and Microbiome. Front. Microbiol. 2022, 13, 15. [Google Scholar] [CrossRef]
  12. Alquézar, B.; Carmona, L.; Bennici, S.; Peña, L. Engineering of citrus to obtain huanglongbing resistance. Curr. Opin. Biotechnol. 2021, 70, 196–203. [Google Scholar] [CrossRef]
  13. Alves, M.N.; Cifuentes-Arenas, J.C.; Raiol, L.L.; Ferro, J.A.; Peña, L. Early Population Dynamics of “Candidatus Liberibacter asiaticus” in Susceptible and Resistant Genotypes After Inoculation with Infected Diaphorina citri Feeding on Young Shoots. Front. Microbiol. 2021, 12, 683923. [Google Scholar] [CrossRef]
  14. Deng, X.L.; Gao, Y.D.; Chen, J.C.; Pu, X.L.; Kong, W.W.; Li, H.P. Curent Situation of “Candidatus Liberibacter asiaticus” in Guangdong, China, Where Citrus Huanglongbing Was First Described. J. Integr. Agric. 2012, 11, 424–429. [Google Scholar] [CrossRef]
  15. Hu, B.; Rao, M.J.; Deng, X.X.; Pandey, S.S.; Hendrich, C.; Ding, F.; Wang, N.; Xu, Q. Molecular signatures between citrus and Candidatus Liberibacter asiaticus. PLoS Pathog. 2021, 17, 22. [Google Scholar] [CrossRef]
  16. Zhou, C.Y. Status Citrus Huanglongbing China. Trop. Plant Pathol. 2020, 45, 279–284. [Google Scholar] [CrossRef]
  17. Cui, X.J.; Liu, K.H.; Huang, J.; Fu, S.M.; Chen, Q.D.; Liu, X.; Zhou, C.Y.; Wang, X.F. Population Diversity of ‘Candidatus Liberibacter asiaticus’ and Diaphorina citri in Sichuan: A Case Study for Huanglongbing Monitoring and Interception. Plant Dis. 2022, 106, 1632–1638. [Google Scholar] [CrossRef]
  18. Li, J.; Jin, Q.; Zhu, G.P.; Jiang, C.; Zhang, A.B. Phylogeography of Dendrolimus punctatus (Lepidoptera: Lasiocampidae): Population differentiation and last glacial maximum survival. Ecol. Evol. 2019, 9, 7480–7496. [Google Scholar] [CrossRef]
  19. Gao, F.L.; Chen, C.S.; Li, B.J.; Weng, Q.Y.; Chen, Q.H. The Gene Flow Direction of Geographically Distinct Phytophthora infestans Populations in China Corresponds with the Route of Seed Potato Exchange. Front. Microbiol. 2020, 11, 12. [Google Scholar] [CrossRef]
  20. Garrick, R.C.; Bonatelli, I.A.S.; Hyseni, C.; Morales, A.; Pelletier, T.A.; Perez, M.F.; Rice, E.; Satler, J.D.; Symula, R.E.; Thomé, M.T.C.; et al. The evolution of phylogeographic data sets. Mol. Ecol. 2015, 24, 1164–1171. [Google Scholar] [CrossRef]
  21. Card, D.C.; Schield, D.R.; Adams, R.H.; Corbin, A.B.; Perry, B.W.; Andrew, A.L.; Pasquesi, G.I.M.; Smith, E.N.; Jezkova, T.; Boback, S.M.; et al. Phylogeographic and population genetic analyses reveal multiple species of Boa and independent origins of insular dwarfism. Mol. Phylogenetics Evol. 2016, 102, 104–116. [Google Scholar] [CrossRef]
  22. Alam, M.A.; Li, H.X.; Hossain, A.; Li, M.J. Genetic Diversity of Wheat Stripe Rust Fungus Puccinia striiformis f. sp. tritici in Yunnan, China. Plants 2021, 10, 1735. [Google Scholar] [CrossRef]
  23. Zheng, Y.Q.; Huang, H.X.; Huang, Z.H.; Deng, X.L.; Zheng, Z.; Xu, M.R. Prophage region and short tandem repeats of “Candidatus Liberibacter asiaticus” reveal significant population structure in China. Plant Pathol. 2021, 70, 959–969. [Google Scholar] [CrossRef]
  24. Khanal, S.; Antony-Babu, S.; Gaire, S.P.; Zhou, X.G. Multi-Locus Sequence Analysis Reveals Diversity of the Rice Kernel Smut Populations in the United States. Front. Microbiol. 2022, 13, 12. [Google Scholar] [CrossRef]
  25. Das, A.K.; Chichghare, S.A.; Sharma, S.K.; Kumar, J.P.T.; Singh, S.; Baranwal, V.K.; Kumar, A.; Nerkar, S. Genetic diversity and population structure of ‘Candidatus Liberibacter asiaticus’ associated with citrus Huanglongbing in India based on the prophage types. World J. Microbiol. Biotechnol. 2021, 37, 14. [Google Scholar] [CrossRef]
  26. Zheng, Y.Q.; Zhang, J.X.; Li, Y.; Liu, Y.X.; Liang, J.Y.; Wang, C.; Fang, F.; Deng, X.L.; Zheng, Z. Pathogenicity and Transcriptomic Analyses of Two “Candidatus Liberibacter asiaticus” Strains Harboring Different Types of Phages. Microbiol. Spectr. 2023, 11, 16. [Google Scholar] [CrossRef]
  27. Gao, F.L.; Wu, B.; Zou, C.W.; Bao, Y.X.; Li, D.A.; Yao, W.; Powell, C.A.; Zhang, M.Q. Genetic Diversity of “Candidatus Liberibacter asiaticus” Based on Four Hypervariable Genomic Regions in China. Microbiol. Spectr. 2022, 10, 13. [Google Scholar] [CrossRef]
  28. Duan, Y.; Zhou, L.; Hall, D.G.; Li, W.; Doddapaneni, H.; Lin, H.; Liu, L.; Vahling, C.M.; Gabriel, D.W.; Williams, K.P.; et al. Complete genome sequence of citrus huanglongbing bacterium, ‘Candidatus Liberibacter asiaticus’ obtained through metagenomics. Mol. Plant Microbe Interact. 2009, 22, 1011–1020. [Google Scholar] [CrossRef]
  29. Hu, W.Z.; Wang, X.E.; Zhou, Y.; Li, Z.A.; Tang, K.Z.; Zhou, C.Y. Diversity of the omp gene in Candidatus Liberibacter asiaticus in China. J. Plant Pathol. 2011, 93, 211–214. [Google Scholar]
  30. Donnua, S.; Paradornuwat, A.; Chowpongpang, S.; Thaveechai, N. Genetic diversity of Candidatus Liberibacter asiaticus, the causal agent of citrus huanglongbing disease in Thailand using markers of dnaA, lpxD and zmpA genes. Thai J. Agric. Sci. 2012, 45, 171–180. [Google Scholar]
  31. Loto, F.; Coyle, J.F.; Padgett, K.A.; Pagliai, F.A.; Gardner, C.L.; Lorca, G.L.; Gonzalez, C.F. Functional characterization of LotP from Liberibacter asiaticus. Microb. Biotechnol. 2017, 10, 642–656. [Google Scholar] [CrossRef]
  32. Clark, K.J.; Pang, Z.Q.; Trinh, J.; Wang, N.; Ma, W.B. Sec-Delivered Effector 1 (SDE1) of ‘Candidatus Liberibacter asiaticus’ Promotes Citrus Huanglongbing. Mol. Plant-Microbe Interact. 2020, 33, 1394–1404. [Google Scholar] [CrossRef]
  33. Jagoueix, S.; Bové, J.M.; Garnier, M. PCR detection of the two ‘Candidatus’ liberobacter species associated with greening disease of citrus. Mol. Cell. Probes 1996, 10, 43–50. [Google Scholar] [CrossRef]
  34. Katoh, K.; Standley, D.M. MAFFT Multiple Sequence Alignment Software Version 7: Improvements in Performance and Usability. Mol. Biol. Evol. 2013, 30, 772–780. [Google Scholar] [CrossRef]
  35. Martin, D.P.; Murrell, B.; Golden, M.; Khoosal, A. RDP4: Detection and analysis of recombination patterns in virus genomes. Virus Evol. 2015, 1, vev003. [Google Scholar] [CrossRef]
  36. Rozas, J.; Ferrer-Mata, A.; Sánchez-DelBarrio, J.C.; Guirao-Rico, S.; Librado, P.; Ramos-Onsins, S.E.; Sánchez-Gracia, A. DnaSP 6: DNA Sequence Polymorphism Analysis of Large Data Sets. Mol. Biol. Evol. 2017, 34, 3299–3302. [Google Scholar] [CrossRef]
  37. Excoffier, L.; Lischer, H.E.L. Arlequin suite ver 3.5: A new series of programs to perform population genetics analyses under Linux and Windows. Mol. Ecol. Resour. 2010, 10, 564–567. [Google Scholar] [CrossRef]
  38. Pons, O.; Petit, R.J. Measuring and testing genetic differentiation with ordered versus unordered alleles. Genetics 1996, 144, 1237–1245. [Google Scholar] [CrossRef]
  39. Wright, S. Genetical structure of populations. Nature 1950, 166, 247–249. [Google Scholar] [CrossRef]
  40. Balloux, F.; Lugon-Moulin, N. The estimation of population differentiation with microsatellite markers. Mol. Ecol. 2002, 11, 155–165. [Google Scholar] [CrossRef]
  41. Leigh, J.W.; Bryant, D. POPART: Full-feature software for haplotype network construction. Methods Ecol. Evol. 2015, 6, 1110–1116. [Google Scholar] [CrossRef]
  42. Kumar, S.; Stecher, G.; Li, M.; Knyaz, C.; Tamura, K. MEGA X: Molecular Evolutionary Genetics Analysis across Computing Platforms. Mol. Biol. Evol. 2018, 35, 1547–1549. [Google Scholar] [CrossRef]
  43. Li, W.H. Unbiased estimation of the rates of synonymous and nonsynonymous substitution. J. Mol. Evol. 1993, 36, 96–99. [Google Scholar] [CrossRef]
  44. Tajima, F. DNA polymorphism in a subdivided population: The expected number of segregating sites in the two-subpopulation model. Genetics 1989, 123, 229–240. [Google Scholar] [CrossRef]
  45. Fu, Y.X. Statistical tests of neutrality of mutations against population growth, hitchhiking and background selection. Genetics 1997, 147, 915–925. [Google Scholar] [CrossRef]
  46. Fu, Y.X.; Li, W.H. Statistical tests of neutrality of mutations. Genetics 1993, 133, 693–709. [Google Scholar] [CrossRef]
  47. Yang, Z.; Zhang, L.; Zhao, J.F.; Zhang, X.K.; Wang, Y.; Li, T.S.; Zhang, W.; Zhou, Y. New geographic distribution and molecular diversity of Citrus chlorotic dwarf-associated virus in China. J. Integr. Agric. 2022, 21, 293–298. [Google Scholar] [CrossRef]
  48. Zheng, Z.; Chen, J.C.; Deng, X.L. Historical Perspectives, Management, and Current Research of Citrus HLB in Guangdong Province of China, Where the Disease has been Endemic for Over a Hundred Years. Phytopathology 2018, 108, 1224–1236. [Google Scholar] [CrossRef]
  49. Cai, L.; Jain, M.; Munoz-Bodnar, A.; Huguet-Tapia, J.C.; Gabriel, D.W. A synthetic ‘essentialome’ for axenic culturing of ‘Candidatus Liberibacter asiaticus’. BMC Res. Notes 2022, 15, 125. [Google Scholar] [CrossRef]
  50. Katoh, H.; Subandiyah, S.; Tomimura, K.; Okuda, M.; Su, H.J.; Iwanami, T. Differentiation of “Candidatus Liberibacter asiaticus” Isolates by Variable-Number Tandem-Repeat Analysis. Appl. Environ. Microbiol. 2011, 77, 1910–1917. [Google Scholar] [CrossRef]
  51. Wu, J.Y.; Zhou, D.Y.; Zhang, Y.; Mi, F.; Xu, J.P. Analyses of the Global Multilocus Genotypes of the Human Pathogenic Yeast Candida tropicalis. Front. Microbiol. 2019, 10, 14. [Google Scholar] [CrossRef]
  52. Tomimura, K.; Miyata, S.-I.; Furuya, N.; Kubota, K.; Okuda, M.; Subandiyah, S.; Hung, T.-H.; Su, H.-J.; Iwanami, T. Evaluation of genetic diversity among ‘Candidatus Liberibacter asiaticus’ isolates collected in Southeast Asia. Phytopathology 2009, 99, 1062–1069. [Google Scholar] [CrossRef]
  53. Jagoueix, S.; Bove, J.M.; Garnier, M. Comparison of the 16S/23S ribosomal intergenic regions of “Candidatus Liberobacter asiaticum” and “Candidatus Liberobacter africanum,” the two species associated with citrus huanglongbing (greening) disease. Int. J. Syst. Bacteriol. 1997, 47, 224–227. [Google Scholar] [CrossRef]
  54. Planet, P.; Jagoueix, S.; Bove, J.M.; Garnier, M. Detection and characterization of the African citrus greening liberobacter by amplification, cloning, and sequencing of the rplKAJL-rpoBC operon. Curr. Microbiol. 1995, 30, 137–141. [Google Scholar] [CrossRef]
  55. Liu, R.; Zhang, P.; Pu, X.L.; Xing, X.Q.; Chen, J.C.; Deng, X.L. Analysis of a Prophage Gene Frequency Revealed Population Variation of ‘Candidatus Liberibacter asiaticus’ from Two Citrus-Growing Provinces in China. Plant Dis. 2011, 95, 431–435. [Google Scholar] [CrossRef]
  56. Fu, S.; Bai, Z.; Su, H.; Liu, J.; Hartung, J.S.; Zhou, C.; Wang, X. Occurrence of prophage and historical perspectives associated with the dissemination of huanglongbing in mainland China. Plant Pathol. 2020, 69, 132–138. [Google Scholar] [CrossRef]
  57. Widyawan, A.; Ibrahim, Y.E.; Komy, M.H.E.; Dhafer, H.M.A.; Brown, J.K.; Al-Saleh, M.A. Differentiation of ‘Candidatus Liberibacter asiaticus’ in Saudi Arabia based on tandem repeat variability in genomic locus. J. King Saud Univ. Sci. 2023, 35, 8. [Google Scholar] [CrossRef]
  58. Ghosh, D.K.; Bhose, S.; Motghare, M.; Warghane, A.; Mukherjee, K.; Ghosh, D.K.; Sharma, A.K.; Ladaniya, M.S.; Gowda, S. Genetic Diversity of the Indian Populations of ‘Candidatus Liberibacter asiaticus’ Based on the Tandem Repeat Variability in a Genomic Locus. Phytopathology 2015, 105, 1043–1049. [Google Scholar] [CrossRef]
  59. Ma, W.; Liang, M.; Guan, L.; Xu, M.; Wen, X.; Deng, X.; Chen, J. Population Structures of ‘Candidatus Liberibacter asiaticus’ in Southern China. Phytopathology 2014, 104, 158–162. [Google Scholar] [CrossRef]
  60. Trubenová, B.; Hager, R. Social Selection and Indirect Genetic Effects in Structured populations. Evol. Biol. 2014, 41, 123–133. [Google Scholar] [CrossRef]
  61. Luebert, F.; Jacobs, P.; Hilger, H.H.; Muller, L.A.H. Evidence for nonallopatric speciation among closely related sympatric Heliotropium species in the Atacama Desert. Ecol. Evol. 2014, 4, 266–275. [Google Scholar] [CrossRef]
  62. Lenart, P.; Bienertova-Vasku, J.; Berec, L. Learning mitigates genetic drift. Sci. Rep. 2022, 12, 10. [Google Scholar] [CrossRef]
  63. Puttamuk, T.; Zhou, L.J.; Thaveechai, N.; Zhang, S.A.; Armstrong, C.M.; Duan, Y.P. Genetic Diversity of Candidatus Liberibacter asiaticus Based on Two Hypervariable Effector Genes in Thailand. PLoS ONE 2014, 9, 20. [Google Scholar] [CrossRef]
  64. de Paula, L.B.; Lin, H.; Stuchi, E.S.; Francisco, C.S.; Safady, N.G.; Coletta, H.D. Genetic diversity of ‘Candidatus Liberibacter asiaticus’ in Brazil analyzed in different geographic regions and citrus varieties. Eur. J. Plant Pathol. 2019, 154, 863–872. [Google Scholar] [CrossRef]
  65. Signor, S.A.; Abbasi, M.; Marjoram, P.; Nuzhdin, S.V. Social effects for locomotion vary between environments in Drosophila melanogaster females. Evolution 2017, 71, 1765–1775. [Google Scholar] [CrossRef]
  66. Chen, L.; Luo, J.Y.; Jin, M.L.; Yang, N.; Liu, X.G.; Peng, Y.; Li, W.Q.; Phillips, A.; Cameron, B.; Bernal, J.S.; et al. Genome sequencing reveals evidence of adaptive variation in the genus Zea. Nat. Genet. 2022, 54, 1736–1745. [Google Scholar] [CrossRef]
  67. Wu, F.N.; Jiang, H.Y.; Beattie, G.A.C.; Holford, P.; Chen, J.C.; Wallis, C.M.; Zheng, Z.; Deng, X.L.; Cen, Y.J. Population diversity of Diaphorina citri (Hemiptera: Liviidae) in China based on whole mitochondrial genome sequences. Pest Manag. Sci. 2018, 74, 2569–2577. [Google Scholar] [CrossRef]
  68. Zhou, L.J.; Powell, C.A.; Hoffman, M.T.; Li, W.B.; Fan, G.C.; Liu, B.; Lin, H.; Duan, Y.P. Diversity and Plasticity of the Intracellular Plant Pathogen and Insect Symbiont “Candidatus Liberibacter asiaticus” as Revealed by Hypervariable Prophage Genes with Intragenic Tandem Repeats. Appl. Environ. Microbiol. 2011, 77, 6663–6673. [Google Scholar] [CrossRef]
Figure 1. The geographical distribution of the collected CLas population. The red dots represent the sampling location specified in Table S1.
Diversity 15 01161 g001
Figure 2. The minimum-spanning haplotype network was constructed based on the multi-loci sequences of CLas in China. Each sampling location is represented by a unique color, and the size of the circles in the network corresponds to the frequencies of the haplotypes in the populations.
Diversity 15 01161 g002
Figure 3. Phylogenetic tree between haplotypes based on maximum likelihood method.
Diversity 15 01161 g003
Figure 4. Mismatch distributions of CLas populations in China.
Diversity 15 01161 g004
Figure 5. Gene flow among CLas populations in China. Nm < 1 indicates limited gene flow between populations.
Diversity 15 01161 g005
Table 1. The information of gene regions and primer pairs used in the current study.
LocusPrimersSequence (5′–3′)Tm (°C)Target RegionReference
CLIBASIA_02570FAACAGCCTCTTCACCTTCGA55DnaAThis study
RTGGCGAGGTCTTACAACAGT
CLIBASIA_05315FAGGAAATATCGTGCGTAAAA45SDE1[32]
RGCTCCAACATTTTTCTATGG
CLIBASIA_03315FGAGGTGCCACGAATGTAGGT55OMPThis study
RTGGCAATTGCGAAATATTGA
CLIBASIA_03720FCCTCGCGTTACTAAGGATGG56GroELThis study
RCCTCGCGTTACTAAGGATGG
Table 2. Polymorphism and diversity data of each province.
POPSPiKHHd
Total120.00005 ± 0.000010.182110.169 ± 0.022
Fujian (FJ)10.00004 ± 0.000020.1520.150 ± 0.065
Guangdong (GD)10.00001 ± 0.000010.0420.040 ± 0.038
Guangxi (GX)40.00002 ± 0.000220.0830.040 ± 0.027
Guizhou (GZ)00010
Hunan (HN)10.00001 ± 0.000010.0420.040 ± 0.038
Jiangxi (JX)00010
Hainan (QN)10.00001 ± 0.000010.0420.040 ± 0.038
Sichuan (SC)10.00014 ± 0.000010.4920.490 ± 0.031
Yunnan (YN)30.00015 ± 0.000030.50840.460 ± 0.078
Zhejiang (ZJ)30.00003 ± 0.000190.1240.118 ± 0.062
Acronyms used: S: number of polymorphic sites; Hd: haplotype diversity; Pi: nucleotide diversity; H: number of haplotypes; K: average number of pairwise nucleotide differences.
Table 3. Polymorphism and diversity data of each gene.
GENESSPiKHHddNdS
omp50.00004 ± 0.000020.03640.028 ± 0.0101.80 × 10−61.40 × 10⁻⁵
DnaA0001000
GroEL20.000000633 ± 0.000000.00830.008 ± 0.000034.31 × 10−61.40 × 10⁻⁵
SDE150.00031 ± 0.000050.13860.136 ± 0.0004204.38 × 10−4
Acronyms used: S: number of polymorphic sites; Hd: haplotype diversity; Pi: nucleotide diversity; H: number of haplotypes; K: average number of pairwise nucleotide differences; dN: synonymous substitution rate; dS: non-synonymous substitution rate.
Table 4. AMOVA of multi-loci sequences in 10 populations of CLas.
LocusSource of Variationd.f.Sum of SquaresVariance ComponentsPercentage of Variation %FST
ompAmong populations90.5400.00082 Va4.080.04082
Within populations4909.4000.01918 Vb95.92
Total4999.9400.02000100.00
DnaAAmong populations90.0000.00000 Va0.000.00000
Within populations4900.0000.0000 Vb0.00
Total4990.0000.00000.00
GroELAmong populations90.0360.00000 Va0.000.00000
Within populations4901.9600.00400 Vb100.00
Total4991.9960.00400100.00
SDE1Among populations97.9200.01652 Va23.350.23354
Within populations49026.5600.05420 Vb76.65
Total49934.4800.07072100.00
Multi-locusAmong populations98.4960.01733 Va18.300.18296
Within populations49037.9200.07739 Vb81.70
Total49946.4160.09472100.00
Table 5. The neutrality test results with negative values in populations.
PopulationNNeutrality Test
Tajima’s DFu’s FS
Total500−1.98492 *−15.17394 *
FJ50−0.4396−0.07635
ZJ50−1.69603 *−4.30079 *
YN50−0.49979−0.79565
SC501.604011.89461
QN50−1.1028−1.63631 *
JX50NANA
HN50−1.1028−1.63631 *
GZ50NANA
GD50−1.1028−1.63631 *
GX50−1.69603 *0.00841
Significance: asterisks represent * p < 0.05, with significant differences; NA means not available. Abbreviation used: N: number of samples.
Disclaimer/Publisher’s Note: The statements, opinions and data contained in all publications are solely those of the individual author(s) and contributor(s) and not of MDPI and/or the editor(s). MDPI and/or the editor(s) disclaim responsibility for any injury to people or property resulting from any ideas, methods, instructions or products referred to in the content.

