

The Influence of Grazing Systems on Bird Species Richness and Density in the Nebraska Sandhills


Abstract
:1. Introduction
2. Materials and Methods
2.1. Study Area
2.2. Sampling Methods
2.2.1. Bird Surveys
2.2.2. Vegetation Surveys
2002 Vegetation
2003–2004 Vegetation
2.3. Statistical Analysis
2.3.1. Species Richness Estimates
2.3.2. Density Estimates
3. Results
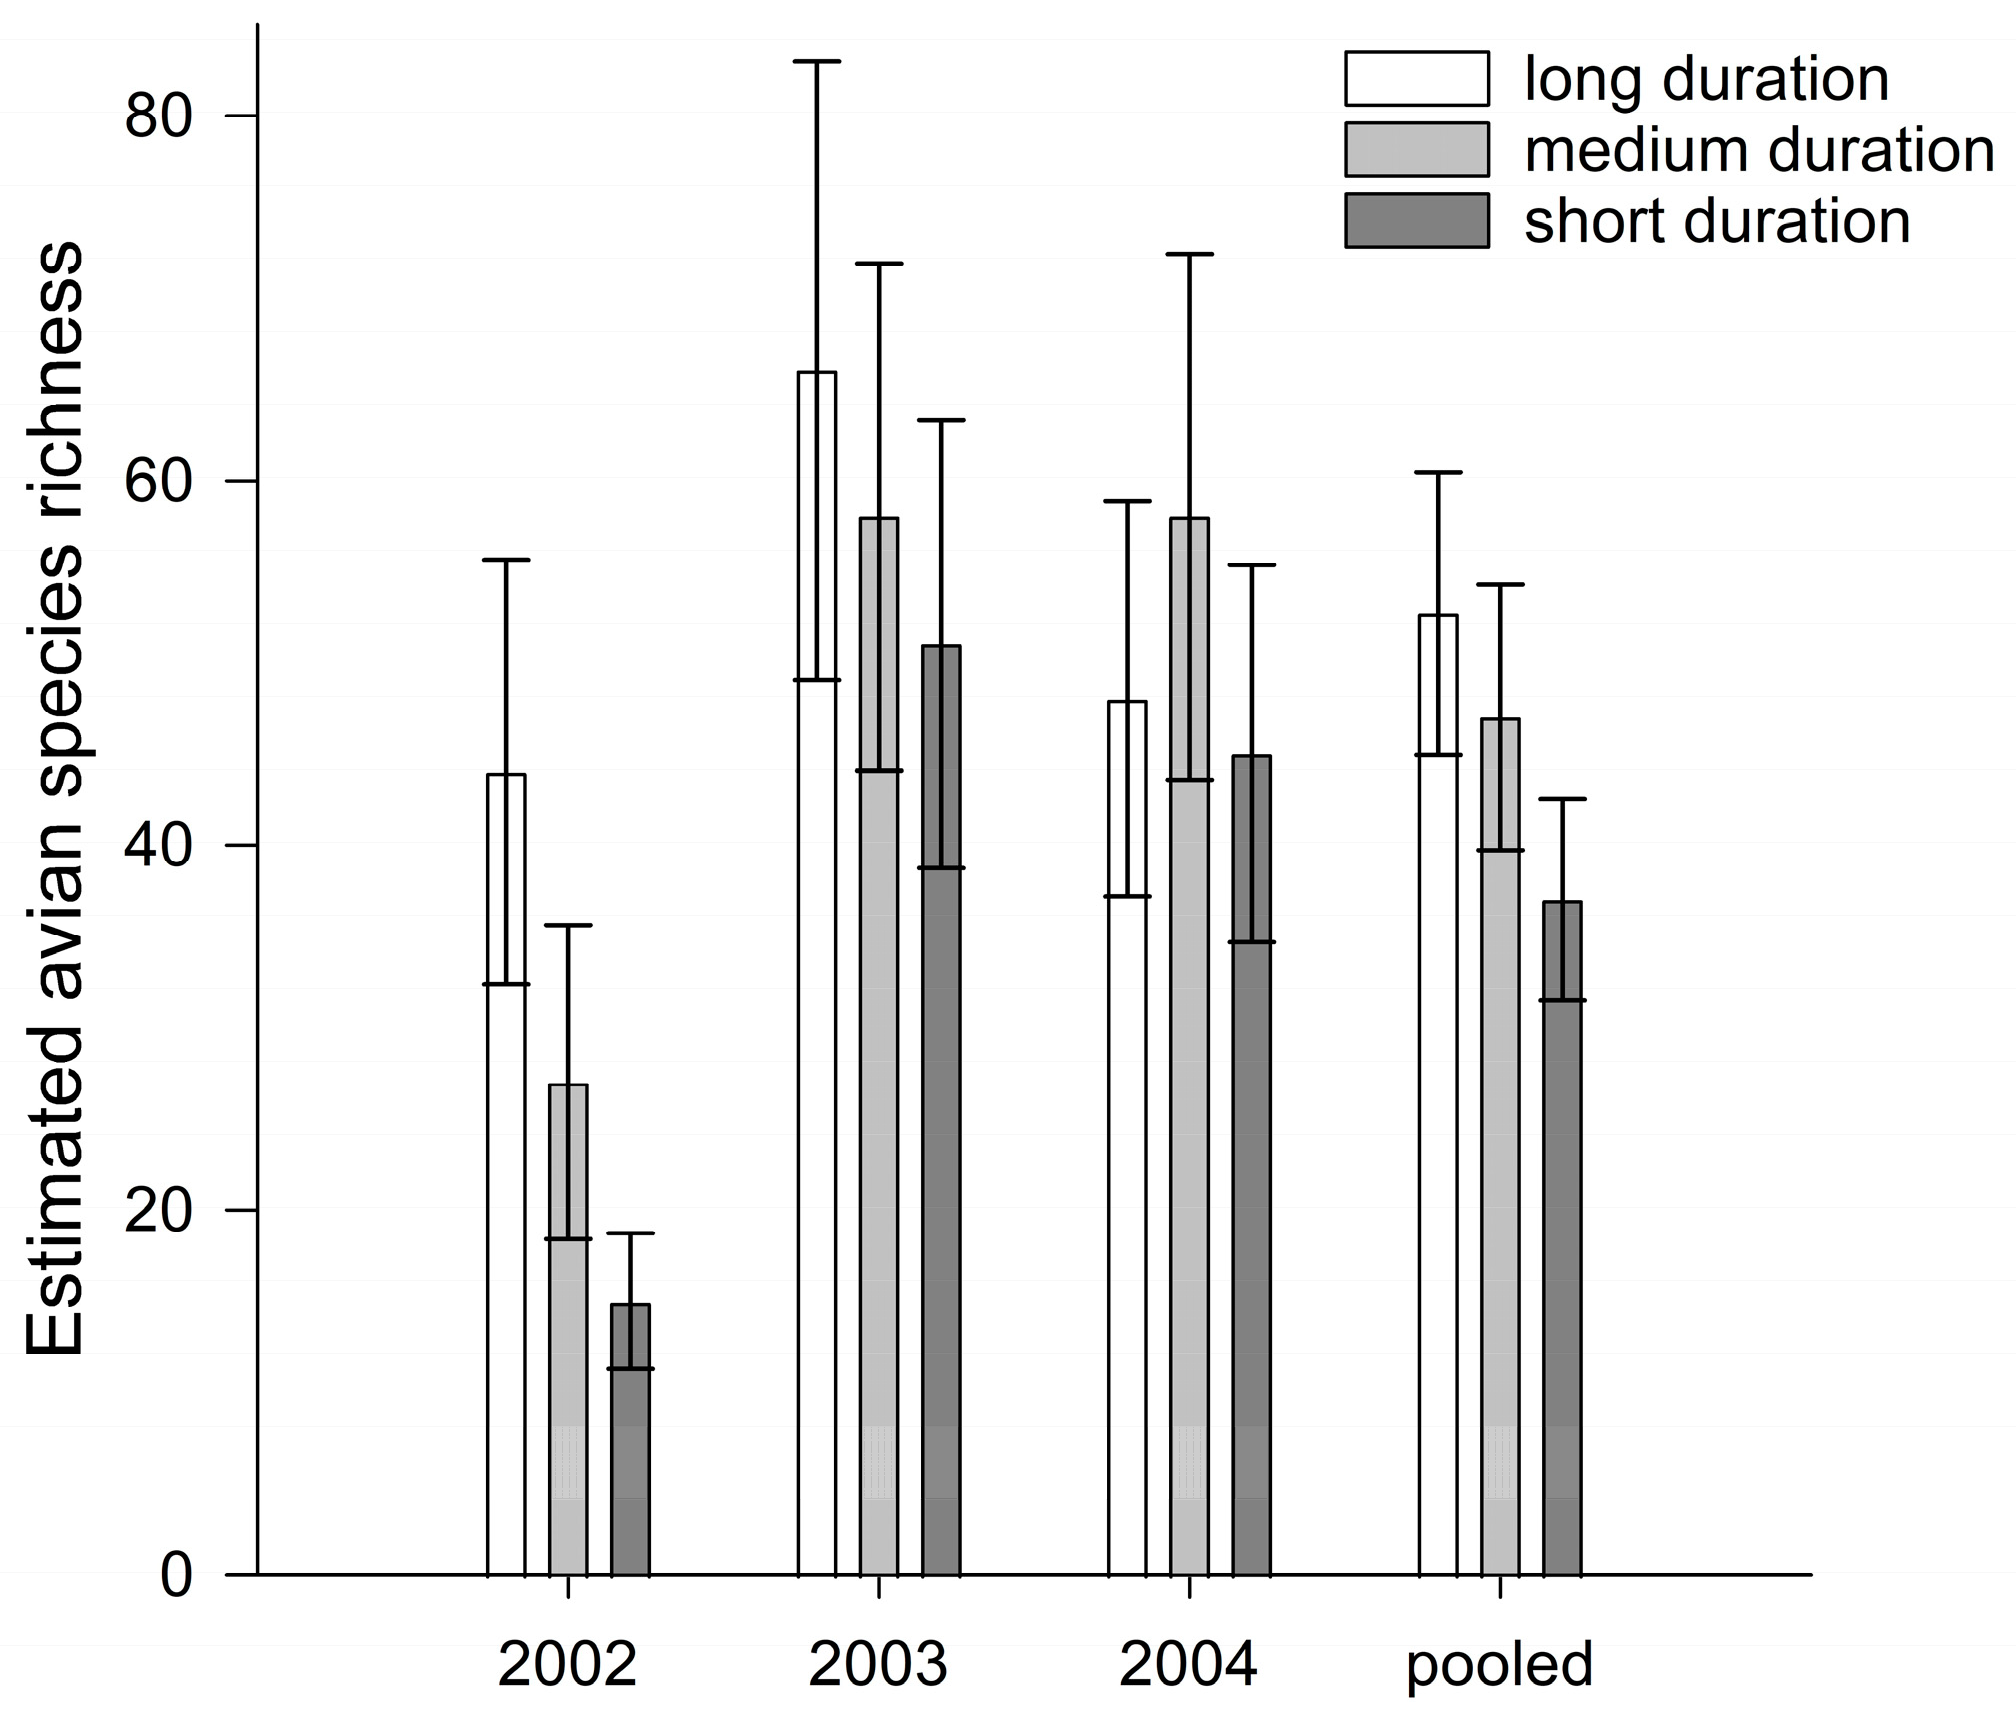
3.1. Species Richness
3.2. Abundance and Density
4. Discussion
4.1. Grazing Systems
4.2. Critical Vegetation
5. Conclusions
Author Contributions
Funding
Institutional Review Board Statement
Data Availability Statement
Acknowledgments
Conflicts of Interest
References
- Knopf, F.L. Avian assemblages on altered grasslands. Stud. Avian Biol. 1994, 15, 247–257. [Google Scholar]
- Peterjohn, B.G.; Sauer, J.R. Population status of North American grassland birds from the North American Breeding Bird Survey, 1966–1996. Stud. Avian Biol. 1999, 19, 27–44. [Google Scholar]
- Askins, R.A.; Chavez-Ramirez, F.; Dale, B.C.; Haas, C.A.; Herkert, J.R.; Knopf, F.L.; Vickery, P.D. Conservation of grassland birds in North America: Understanding ecological processes in different regions. Ornithol. Monogr. 2007, 64, 1–46. [Google Scholar]
- Sauer, J.R.; Pardieck, K.L.; Ziolkowski, D.J., Jr.; Smith, A.C.; Hudson, M.-A.R.; Rodriguez, V.; Berlanga, H.; Niven, D.K.; Link, W.A. The first 50 years of the North American Breeding Bird Survey. Condor 2017, 119, 576–593. [Google Scholar] [CrossRef]
- Rosenberg, K.V.; Dokter, A.M.; Blancher, P.J.; Sauer, J.R.; Smith, A.C.; Smith, P.A.; Stanton, J.C.; Panjabi, A.; Helft, L.; Parr, M. Decline of the North American avifauna. Science 2019, 366, 120–124. [Google Scholar] [CrossRef]
- Brennan, L.A.; Kuvlesky, W.P., Jr. North American grassland birds: An unfolding conservation crisis? J. Wildl. Manag. 2005, 69, 1–13. [Google Scholar] [CrossRef]
- Mengel, R.M. The North American Central Plains as an isolating agent in bird speciation. In Pleistocene and Recent Environments of the Central Great Plains; Dort, W., Jones, J.K., Eds.; University of Kansas Press: Lawrence, KS, USA, 1970; pp. 280–340. [Google Scholar]
- Stanton, R.L.; Morrissey, C.A.; Clark, R.G. Analysis of trends and agricultural drivers of farmland bBdeclines in North America: A Review. Agric. Ecosyst. Environ. 2018, 254, 244–254. [Google Scholar] [CrossRef]
- Hoekstra, J.M.; Boucher, T.M.; Ricketts, T.H.; Roberts, C. Confronting a biome crisis: Global disparities of habitat loss and protection. Ecol. Lett. 2005, 8, 23–29. [Google Scholar] [CrossRef]
- Powell, L.A. Common–interest community agreements on private lands provide opportunity and scale for wildlife management. Anim. Biodivers. Conserv. 2012, 35, 295–306. [Google Scholar] [CrossRef]
- Augustine, D.; Davidson, A.; Dickinson, K.; Van Pelt, B. Thinking like a grassland: Challenges and opportunities for biodiversity conservation in the Great Plains of North America. Rangel. Ecol. Manag. 2021, 78, 281–295. [Google Scholar] [CrossRef]
- Samson, F.B.; Knopf, F.L. Prairie conservation in North America. BioScience 1994, 44, 418–421. [Google Scholar] [CrossRef]
- Wimberly, M.C.; Janssen, L.L.; Hennessy, D.A.; Luri, M.; Chowdhury, N.M.; Feng, H. Cropland expansion and grassland loss in the eastern Dakotas: New insights from a farm-level survey. Land Use Policy 2017, 63, 160–173. [Google Scholar] [CrossRef]
- Bragg, T.B.; Steuter, A.A. Prairie ecology—The mixedgrass prairie. In Prairie Conservation; Samson, F.B., Knopf, F.L., Eds.; Island Press: Washington, DC, USA, 1996; pp. 53–66. [Google Scholar]
- Clark, R.T.; Coady, S.A. Ranch Management Practices in the Sandhills of Nebraska: Managing Production; Agriculture Research Division, Institute of Agriculture and Natural Resources, University of Nebraska: Lincoln, NE, USA, 1993. [Google Scholar]
- Martin, S.C. Grazing systems—What can they accomplish? Rangeman’s J. 1978, 5, 14–16. [Google Scholar]
- Samson, F.B.; Knopf, F.L.; Ostlie, W. Great Plains ecosystems: Past, present and future. Wildl. Soc. Bull. 2004, 32, 6–15. [Google Scholar] [CrossRef]
- Strömberg, C.A.E.; Staver, A.C. The history and challenge of grassy biomes. Science 2022, 377, 592–593. [Google Scholar] [CrossRef]
- Krausman, P.R.; Naugle, D.E.; Frisina, M.R.; Northrup, R.; Bleich, V.C.; Block, W.M.; Wallace, M.C.; Wright, J.D. Livestock grazing, wildlife habitat, and rangeland values. Rangelands 2009, 31, 15–19. [Google Scholar] [CrossRef]
- Barzan, F.R.; Bellis, L.M.; Dardanelli, S. Livestock grazing constrains bird abundance and species richness: A global meta-analysis. Basic Appl. Ecol. 2021, 56, 289–298. [Google Scholar] [CrossRef]
- Sliwinski, M.; Powell, L.; Schacht, W. Grazing systems do not affect bird habitat on a Sandhills landscape. Rangel. Ecol. Manag. 2019, 72, 136–144. [Google Scholar] [CrossRef]
- Wilhite, D.; Hubbard, K.G. Climate. In An Atlas of the Sand Hills; Bleed, A.S., Flowerday, C.A., Eds.; Conservation and Survey Division, University of Nebraska: Lincoln, NE, USA, 1998; pp. 17–28. [Google Scholar]
- Lewis, D.T.; Kuzila, M. Soils. In An Atlas of the Sand Hills; Bleed, A.S., Flowerday, C.A., Eds.; Conservation and Survey Division, University of Nebraska: Lincoln, NE, USA, 1998; pp. 57–66. [Google Scholar]
- Kempema, S.L.F. The Influence of Grazing Systems on Grassland Bird Density, Productivity, and Species Richness on Private Rangeland in the Nebraska Sandhills. Master’s Thesis, University of Nebraska-Lincoln, Lincoln, NE, USA, 2007. [Google Scholar]
- Buckland, S.T.; Anderson, D.R.; Burnham, K.P.; Laake, J.L.; Borchers, D.L.; Thomas, L. Introduction to Distance Sampling; Oxford University Press: New York, NY, USA, 2001. [Google Scholar]
- Anderson, D.R.; Laake, J.L.; Crain, B.R.; Burnham, K.P. Guidelines for line transect sampling of biological populations. J. Wildl. Manag. 1979, 43, 70–78. [Google Scholar] [CrossRef]
- Powell, L. Data Supporting: The Influence of Grazing Systems on Bird Species Richness and Density in the Nebraska Sandhills; University of Nebraska-Lincoln: Lincoln, NE, USA, 2023. [Google Scholar] [CrossRef]
- Robel, R.J.; Briggs, J.N.; Dayton, A.D.; Hulbert, L.C. Relationships between visual obstruction measurements and weight of grassland vegetation. J. Range Manag. 1970, 23, 295–297. [Google Scholar] [CrossRef]
- Daubenmire, R. A canopy-coverage method of vegetational analysis. Northwest Sci. 1959, 33, 43–64. [Google Scholar]
- Wiens, J.A. Habitat heterogeneity and avian community structure in North American grasslands. Am. Midl. Nat. 1974, 91, 195–213. [Google Scholar] [CrossRef]
- White, G.C.; Burnham, K.P.; Otis, D.L.; Anderson, D.R. Users Manual for Program CAPTURE; Utah State University Press: Logan, UT, USA, 1978. [Google Scholar]
- Rexstad, E.; Burnham, K.P. User’s Guide for Interactive Program CAPTURE; Colorado Cooperative Fish & Wildlife Research Unit, Colorado State University: Fort Collins, CO, USA, 1991. [Google Scholar]
- Powell, L.A. Approximating variance of demographic parameters using the delta method: A reference for avian biologists. Condor 2007, 109, 949–954. [Google Scholar] [CrossRef]
- Burnham, K.P.; Anderson, D.R. Model Selection and Multimodel Inference: A Practical Information-Theoretic Approach; Springer: New York, NY, USA, 2010. [Google Scholar]
- SAS Institute. SAS Version 9.1.3; SAS Institute: Cary, NC, USA, 2002–2004. [Google Scholar]
- Ahlering, M.A.; Merkord, C.L. Cattle grazing and grassland birds in the northern tallgrass prairie. J. Wildl. Manag. 2016, 80, 643–654. [Google Scholar] [CrossRef]
- Sliwinski, M.S.; Powell, L.A.; Schacht, W.H. Similar bird communities across grazing systems in the Nebraska Sandhills. J. Wildl. Manag. 2020, 84, 802–812. [Google Scholar] [CrossRef]
- Schneider, N.A. Passerine Use of Grasslands Managed with Two Grazing Regimes on the Missouri Coteau in North Dakota. Master’s Thesis, South Dakota State University, Brookings, SD, USA, 1998. [Google Scholar]
- Messmer, T.A. Effects of Specialized Grazing Systems on Upland Nesting Birds in Southcentral North Dakota. Master’s Thesis, North Dakota State University, Fargo, ND, USA, 1985. [Google Scholar]
- Anderson, J.O. Upland Territorial Breeding Birds and Cattle Grazing Regimes in Nebraska Sandhills Prairie. Master’s Thesis, University of Nebraska, Omaha, NE, USA, 1992. [Google Scholar]
- Saab, V.A.; Bock, C.E.; Rich, T.D.; Dobkin, D.S. Livestock grazing effects in western North America. In Ecology and Management of Neotropical Migratory Birds; Martin, T.E., Finch, D.M., Eds.; Oxford University Press: New York, NY, USA, 1995; pp. 311–353. [Google Scholar]
- Kantrud, H.A.; Kologiski, R.L. Effects of Soils and Grazing on Breeding Birds of Uncultivated Upland Grasslands of the Northern Great Plains; U.S. Fish and Wildlife Service Wildlife Research Report 15; U.S. Fish and Wildlife Service: Washington, DC, USA, 1982. [Google Scholar]
- Salo, E.D.; Higgins, K.F.; Patton, B.D.; Bakker, K.K.; Barker, W.T.; Kreft, B.; Nyren, P.E. Grazing intensity effects on vegetation, livestock, and non-game birds in North Dakota mixed-grass prairie. Proc. N. Am. Prairie Conf. 2004, 19, 205–215. [Google Scholar]
- Wiens, J.A.; Dyer, M.I. Rangeland avifaunas: Their composition, energetics, and role in the ecosystem. In Symposium on the Management of Forest and Range Habitats for Nongame Birds; Smith, D.R., Ed.; General Technical Report WO-1; U.S. Forest Service: Washington, DC, USA, 1975; pp. 146–182. [Google Scholar]
- Kirsch, L.M.; Duebbert, H.F.; Kruse, A.D. Grazing and haying effects on habitats of upland nesting birds. Trans. N. Am. Wildl. Nat. Resour. Conf. 1978, 43, 486–497. [Google Scholar]
- Sliwinski, M.; Burbach, M.; Powell, L.; Schacht, W. Ranchers’ perceptions of vegetation heterogeneity in the northern Great Plains. Great Plains Res. 2018, 28, 185–198. [Google Scholar] [CrossRef]
- Cody, M.L. Habitat selection in grassland and open-country birds. In Habitat Selection in Birds; Cody, M.L., Ed.; Academic Press, Inc.: Orlando, FL, USA, 1985; pp. 191–226. [Google Scholar]
- Rotenberry, J.T.; Wiens, J.A. Habitat structure, patchiness, and avian communities in North American steppe vegetation: A multivariate analysis. Ecology 1980, 61, 1228–1250. [Google Scholar] [CrossRef]
- Bock, C.E.; Saab, V.A.; Rich, T.D.; Dobkin, D.S. Effects of Livestock Grazing on Neotropical Migratory Landbirds in Western North America; U.S. Forest Service General Technical Report RM-229; U.S. Forest Service: Fort Collins, CO, USA, 1993. [Google Scholar]
- Shaffer, J.A.; Igl, L.D.; Johnson, D.H.; Dinkins, M.F.; Goldade, C.M.; Parkin, B.D.; Euliss, B.R. The effects of management practices on grassland birds—Upland Sandpiper (Bartramia longicauda). In The Effects of Management Practices on Grassland Birds; Johnson, D.H., Igl, L.D., Shaffer, J.A., DeLong, J.P., Eds.; U.S. Geological Survey Professional Paper 1842; U.S. Geological Survey: Reston, VA, USA, 2019; p. 20. [Google Scholar] [CrossRef]
- Shaffer, J.A.; Igl, L.D.; Johnson, D.H.; Sondreal, M.L.; Goldade, C.M.; Nenneman, M.P.; Wooten, T.L.; Euliss, B.R. The effects of management practices on grassland birds—Grasshopper Sparrow (Ammodramus savannarum), ver. 1.1, May 2023. In The Effects of Management Practices on Grassland Birds; Johnson, D.H., Igl, L.D., Shaffer, J.A., DeLong, J.P., Eds.; U.S. Geological Survey Professional Paper 1842; U.S. Geological Survey: Reston, VA, USA, 2021; p. 59. [Google Scholar] [CrossRef]
- Martin, J.W.; Parrish, J.R. Lark Sparrow (Chondestes grammacus), version 1.0. In Birds of the World; Poole, A.F., Gill, F.B., Eds.; Cornell Lab of Ornithology: Ithaca, NY, USA, 2020. [Google Scholar]
- Shaffer, J.A.; Igl, L.D.; Johnson, D.H.; Sondreal, M.L.; Goldade, C.M.; Parkin, B.D.; Euliss, B.R. The effects of management practices on grassland birds—Lark Sparrow (Chondestes grammacus). In The Effects of Management Practices on Grassland Birds; Johnson, D.H., Igl, L.D., Shaffer, J.A., DeLong, J.P., Eds.; U.S. Geological Survey Professional Paper 1842; U.S. Geological Survey: Reston, VA, USA, 2021; p. 16. [Google Scholar]
- Dechant, J.A.; Sondreal, M.L.; Johnson, D.H.; Igl, L.D.; Goldade, C.M.; Zimmerman, A.L.; Euliss, B.R. Effects of Management Practices on Grassland Birds: Western Meadowlark; Northern Prairie Wildlife Research Center: Jamestown, ND, USA, 1999; revised 2001; p. 37. [Google Scholar]
- Johnson, D.H.; Schwartz, M.D. The Conservation Reserve Program: Habitat for grassland birds. Great Plains Res. 1993, 3, 273–295. [Google Scholar] [CrossRef]
- Lusk, J.J.; Suedkamp Wells, K.; Guthery, F.S.; Fuhlendorf, S.D. Lark sparrow nest-site selection and success in a mixed-grass prairie. Auk 2003, 120, 120–129. [Google Scholar] [CrossRef]
- Scholtz, R.; Twidwell, D. The last continuous grasslands on Earth: Identification and conservation importance. Conserv. Sci. Pract. 2022, 4, e626. [Google Scholar] [CrossRef]
- Fuhlendorf, S.D.; Engle, D.M. Restoring heterogeneity on rangelands—Ecosystem management based on evolutionary grazing patterns. BioScience 2001, 51, 625–632. [Google Scholar] [CrossRef]
- Fuhlendorf, S.D.; Fynn, F.W.S.; McGranahan, D.A.; Twidwell, D. Heterogeneity as the basis for rangeland management. In Rangeland Systems—Processes, Management and Challenges; Briske, D.D., Ed.; Springer Nature: New York, NY, USA, 2017; pp. 169–196. [Google Scholar] [CrossRef]


| Descriptor | Long | Medium | Short | |||
|---|---|---|---|---|---|---|
| Mean | SD | Mean | SD | Mean | SD | |
| Duration (days) | 78 | 26 | 23 | 23 | 3 | 2 |
| Stocking rate (AUM/ha) | 1.4 | 0.96 | 1.32 | 0.68 | 1.42 | 1.27 |
| Stocking density | 0.6 | 0.26 | 2.5 | 2.1 | 11 | 6.3 |
| Herd size | 158 | 47 | 196 | 101 | 626 | 295 |
| Pasture size (ha) | 574 | 239 | 196 | 134 | 82 | 33 |
| Common Name | Scientific Name |
|---|---|
| American crow | Corvus brachyrhynchos |
| American goldfinch | Carduelis tristis |
| Bell’s vireo | Vireo bellii |
| Brown-headed cowbird * | Molothrus ater |
| Brown thrasher | Toxostoma rufum |
| Common nighthawk | Chordeiles minor |
| Dickcissel | Spiza americana |
| Eastern kingbird | Tyrannus tyrannus |
| Field sparrow | Spizella pusilla |
| Greater prairie-chicken | Tympanuchus cupido |
| Grasshopper sparrow * | Ammodramus savannarum |
| Horned lark | Eremophila alpestris |
| Killdeer | Charadrius vociferus |
| Lark bunting | Calamospiza melanocorys |
| Lark sparrow * | Chondestes grammacus |
| Long-billed curlew | Numenius americanus |
| Mallard | Anas platyrhynchos |
| Mourning dove * | Zenaida macroura |
| Northern harrier | Circus hudsonius |
| Orchard oriole | Icterus spurius |
| Ring-necked pheasant | Phasianus colchicus |
| Red-winged blackbird | Agelaius phoeniceus |
| Spotted towhee | Pipilo maculatus |
| Sharp-tailed grouse | Tympanuchus phasianellus |
| Upland sandpiper * | Bartramia longicauda |
| Western kingbird | Tyrannus verticalis |
| Western meadowlark * | Sturnella neglecta |
| Willet | Catoptrophorus semipalmatus |
| Grazing System | |||||
|---|---|---|---|---|---|
| Species | Long | Medium | Short | Pooled | p-Value |
| Brown-headed cowbird | 22.2 | 6.2 | 33.4 | 20.6 | 0.111 |
| Grasshopper sparrow | 57.0 | 114.6 | 97.3 | 89.7 | 0.047 |
| Lark sparrow | 24.2 | 12.6 | 17.6 | 18.1 | 0.151 |
| Mourning dove | 6.4 | 3.7 | 6.8 | 5.6 | 0.010 |
| Upland sandpiper | 5.7 | 5.2 | 5.5 | 5.5 | 0.899 |
| Western meadowlark | 29.1 | 39.3 | 42.0 | 36.8 | 0.065 |
| Species | Model a | AICc | ΔAICc | wi | β | SE |
|---|---|---|---|---|---|---|
| Brown-headed | Tallest plant | 235.3 | 0.0 | 0.611 | −1.15 | 1.48 |
| cowbird | Bunchgrass cover | 236.2 | 0.9 | 0.389 | −0.04 | 1.30 |
| Null | 333.4 | 98.1 | 0.000 | - | - | |
| Grasshopper | Shrub cover | 246.1 | 0.0 | 0.646 | 4.11 | 6.47 |
| Sparrow | Large-scale heterogeneity (early season) | 247.3 | 1.2 | 0.354 | −0.75 | 0.31 |
| Null | 354.6 | 108.5 | 0.000 | - | - | |
| Lark sparrow | Shrub cover | 192.5 | 0.0 | 0.917 | 1.63 | 1.91 |
| Litter cover | 197.3 | 4.8 | 0.083 | −0.57 | 0.24 | |
| Null | 268.6 | 76.1 | 0.000 | - | - | |
| Mourning dove | Grazing system | 154.7 | 0.0 | 0.996 | - | - |
| Null | 167.9 | 13.2 | 0.001 | - | - | |
| Upland sandpiper | Shrub cover | 133.3 | 0.0 | 0.973 | −1.06 | 0.47 |
| Null | 186.2 | 52.9 | 0.000 | - | - | |
| Western | Bunchgrass cover | 195.2 | 0.0 | 0.731 | 1.52 | 0.59 |
| meadowlark | Shrub cover | 198.4 | 3.2 | 0.148 | 0.26 | 1.99 |
| Large-scale heterogeneity (late season) | 198.8 | 3.6 | 0.121 | −0.27 | 0.11 | |
| Null | 274.3 | 79.1 | 0.000 | - | - |
Disclaimer/Publisher’s Note: The statements, opinions and data contained in all publications are solely those of the individual author(s) and contributor(s) and not of MDPI and/or the editor(s). MDPI and/or the editor(s) disclaim responsibility for any injury to people or property resulting from any ideas, methods, instructions or products referred to in the content. |
© 2023 by the authors. Licensee MDPI, Basel, Switzerland. This article is an open access article distributed under the terms and conditions of the Creative Commons Attribution (CC BY) license (https://creativecommons.org/licenses/by/4.0/).
Share and Cite
Kempema, S.L.F.; Schacht, W.H.; Powell, L.A. The Influence of Grazing Systems on Bird Species Richness and Density in the Nebraska Sandhills. Diversity 2023, 15, 1160. https://doi.org/10.3390/d15121160
Kempema SLF, Schacht WH, Powell LA. The Influence of Grazing Systems on Bird Species Richness and Density in the Nebraska Sandhills. Diversity. 2023; 15(12):1160. https://doi.org/10.3390/d15121160
Chicago/Turabian StyleKempema, Silka L. F., Walter H. Schacht, and Larkin A. Powell. 2023. "The Influence of Grazing Systems on Bird Species Richness and Density in the Nebraska Sandhills" Diversity 15, no. 12: 1160. https://doi.org/10.3390/d15121160
APA StyleKempema, S. L. F., Schacht, W. H., & Powell, L. A. (2023). The Influence of Grazing Systems on Bird Species Richness and Density in the Nebraska Sandhills. Diversity, 15(12), 1160. https://doi.org/10.3390/d15121160