Article

Differences in the Composition of Akkermansia Species and Families of Christensenellaceae and Ruminococcaceae Bacteria in the Gut Microbiota of Healthy Polish Women following a Typical Western Diet

1
Department of Clinical Biochemistry, Jagiellonian University Medical College, 31-066 Cracow, Poland
2
2nd Department of General Surgery, Jagiellonian University Medical College, 30-688 Cracow, Poland
3
Department of Gynecological Endocrinology and Gynecology, Jagiellonian University Medical College, 31-501 Cracow, Poland
*
Author to whom correspondence should be addressed.
Diversity 2023, 15(10), 1103; https://doi.org/10.3390/d15101103
Submission received: 6 September 2023 / Revised: 13 October 2023 / Accepted: 16 October 2023 / Published: 23 October 2023

Abstract

:
The gastrointestinal microbiota consists of trillions of microorganisms that live symbiotically in the human body. The main factor influencing the formation of the gastrointestinal microbiota is lifestyle, particularly the diet of people from different geographic regions. As described in several reports, the gut microbiota composition of healthy adults can be stable for years. However, the relative abundance of each microbe fluctuates over time, and it varies between individuals and within individuals over the course of their lives depending on many factors such as diet and gender. The study aimed to define the basic profile of the oral and gut microbiota in healthy people of Polish ethnicity under the Western diet, showing the stability under one type of diet and dependence on gender. The study group included 144 healthy adults. The research materials were swabs and stool samples. The KomPAN questionnaire was used to examine eating habits. Bacterial 16S rRNA genes were sequenced using the next-generation sequencing (NGS) technology. The respondents followed a typical Western diet. There were no statistically significant differences in alpha species diversity in the oral and gut microbiota between the female and male groups. Statistically significant differences were found in the beta diversity between gut microbiota composition in women and men (p < 0.048). The oral microbiota was dominated by Firmicutes and Proteobacteria, and Firmicutes dominated the gut microbiota. According to the received results, it was found that in healthy adults of Polish origin, there is a basic profile of the oral and gut microbiota ensuring good health condition.

1. Introduction

The human gut ecosystem performs important and beneficial functions, such as the synthesis of necessary vitamins and amino acids, decomposition of complex polysaccharides, and the fermentation of dietary fibers into short-chain fatty acids (SCFAs), which account for 2–10% of total energy intake in humans. The gut commensal bacteria participate in maintaining the integrity of the epithelial lining, immunomodulation, stimulation of intestinal angiogenesis, protection against pathogenic bacteria, metabolism of pharmaceuticals, and other processes related to metabolism [1,2]. Colonization with a single strain of commensal bacteria has been shown to be sufficient to influence the expression of genes engaged in the activity of the immune system [3].
An imbalance or change in the composition and activity of microorganisms is the so-called dysbiosis of the gut microbiota [4]. Dysbiosis can be caused by a decrease in beneficial microorganisms, an unwarranted increase in potentially harmful microbes, or a reduced overall microbial diversity [5]. The immunity of the intestinal mucosa is strongly dependent on the gut microbiota [6]. Microbiome dysbiosis has been associated with the pathogenesis of many diseases, ranging from inflammatory bowel disease (IBD), through irritable bowel syndrome (IBS), celiac disease, allergies, asthma, hypertension, obesity, diabetes, metabolic-associated fatty liver disease (MAFLD), autism, Alzheimer’s, Parkinson’s, Huntington’s, multiple sclerosis (SM), amyotrophic lateral sclerosis (ALS), coronavirus disease 2019 (COVID-19), to cancers, such as stomach cancer or colorectal cancer [3,7,8,9,10,11,12,13,14,15,16]. Moreover, the data collected in studies on mice confirm the hypothesis that human microbiome disturbances relate to the pathogenesis of several already mentioned diseases: autoimmune, metabolic, neurodegenerative, infectious, cancer, and aging [3]. A balanced interaction between the immune system and the gut microbiome is necessary for inhibiting inflammation and maintaining homeostasis [6].
The gut microbiota of a pregnant woman and its metabolites, mainly SCFAs produced by the fermentation of carbohydrates and having a positive effect on health, affect the mother’s energy metabolism as well as the infant’s immune system. Infant dysbiosis caused by a high-fat diet during pregnancy is associated with obesity and chronic inflammatory diseases. In addition, obesity in the lactating mother changes the composition of the breast milk microbiota, which leads to dysbiosis in infants and contributes to obesity later in life. Infant studies have shown that obese children have lower amounts of bacteria of the genus Bacteroides and Bifidobacterium that produce SCFAs compared to non-obese children [17].
Elderly age, in turn, is characterized by a higher level of pro-inflammatory bacteria of the genera Fusobacterium, Streptococcus, Staphylococcus, and bacteria of the Enterobacteriaceae family, a decline in bacterial diversity, and a lower level of immunostimulating bacteria, such as butyric acid-producing bacteria [18]. A decrease in the richness of some symbiotic bacteria, mainly belonging to the Ruminococcaceae, Lachnospiraceae, and Bacteroidaceae families, was found to correlate with age. People over the age of 65 also had lower levels of Bacteroides, Bifidobacterium, and Faecalibacterium, as well as Blautia coccoides, which correlated with lower fecal SCFA levels [19].
Understanding the variability of the healthy microbiome has been a significant challenge in research dating back at least 60 years, continued through, among others, the Human Microbiome Project (HMP), and continues to the present day. Early research aimed to identify a basic set of microorganisms commonly found in healthy people without disease symptoms, if the absence of specific microorganisms would indicate dysbiosis. However, further research revealed a significant variation in the microbiome composition among healthy people, which led to the exclusion of the hypothesis that a healthy microbiome has an ideal set of specific microorganisms [7].
It is hypothesized that the so-called healthy functional core, which is a set of microorganisms, not necessarily the same in different people, properly functions in a specific environment’s metabolic and molecular functions [7]. A healthy microbiome is also relatively stable over time, for instance, Faith et al. proved that in American adults for up to 5 years on average, 60% of the microbiome composition was stable [20,21]. The stability of the gut microbiota, achieved at the age of three and lasting until adulthood, should show a specific resistance to changes determined by external factors, for example, related to the diet or medications, or internal ones, resulting from the functioning of the whole organism. Therefore, the properties characterizing a healthy microbiome include its resistance to stress and any changes, and the ability to later return to a healthy functional profile [7,22]. Among healthy people, it is suggested to replace the term “healthy” with “health-related” microbiota, as the composition of the microbiota itself cannot be related to health or disease. Investigating metagenomic functions may provide a better understanding of the proper metabolic activity of the gut microbiota and the influence of microbial functions on human physiology [21].
Studies conducted among healthy adults and people with specific disease states have led to establishing typical ranges for the proportion of microorganisms in the microbiota composition for some populations, for example, obesity and inflammatory bowel disease were associated with low gut diversity [23,24]. Gram-positive bacteria, such as Firmicutes, Bacteroidetes, and Actinobacteria, dominate the oral cavity of healthy people [25,26]. In addition, the Proteobacteria phylum has significant participation [27]. A total of 96% of the species detected in the oral microbiota are the types of bacteria mentioned above, together with Spirochaetes and Fusobacteria [28]. It has also been proven that the healthy gut microbiota consists mainly of bacteria of the Bacteroidetes, Firmicutes, Proteobacteria, Actinobacteria, Fusobacteria, and Verrucomicrobia phylum, where Bacteroides species and Firmicutes phylum bacteria constitute as much as 90% of the composition of all microorganisms. In contrast, the remaining types are less represented [4]. Anaerobes, such as Bacteroides, Fusobacteria, Bifidobacteria, and Peptostreptococci, predominate in the small intestine [16].
Moreover, individual factors, such as ethnicity, that determine microbiome variability have been specified [23]. The composition of the digestive tract microbiota in healthy people is also influenced by genetic and environmental factors, including the previously mentioned diet, dietary supplements, physical activity, age, gender, diseases, and stress, as well as depression, medications, surgeries, smoking, and geographical location [9,22,29]. Genetics explain up to 10% of the bacterial variability, highlighting the considerable importance of environmental factors. Xie et al. compared the microbiota compositions between monozygotic and dizygotic twin sisters. It has been shown that there is a greater similarity in terms of microbiota composition between monozygotic twins than dizygotic twins [9,30]. In turn, geographic factors comprise both the genetic and cultural factors of various populations around the world [18].
The diet can change the gut microbiota composition in just a few days, which means that diet is a powerful modulator of the gut microbiome [31,32]. Food polymers such as fats, carbohydrates, including dietary fiber, proteins, or polyphenols are involved in the main metabolic pathways of the gut microbiota [4]. In recent decades, there has been an increase in the consumption of Western-type diets consisting of highly processed foods, fast food, ready-to-eat products, sweet and salty snacks, sugary drinks, high in animal protein and fat, and deficient in dietary fiber, vitamins, and minerals [31,33]. These types of food products spread very quickly from high-income to poorer countries. At the same time, there was an increase in the incidence of diet-related diseases. Long-lasting consumption of the Western diet contributes to weight gain, changes in lipid and carbohydrate metabolism, and immune system activation, which affects physiology and overall health [33]. In addition, it has been shown that the composition of the gut microbiota, which is potentially unfavorable to health, is associated with the Western diet, rich in simple sugars and low in dietary fiber, while the potentially beneficial composition of the gut microbiota relates to a high intake of dietary fiber, for instance, from fruits and vegetables [34]. Several studies have proven that the Western diet led to a decrease in beneficial bacteria of the genera Bifidobacterium and Eubacterium, as well as a decrease in total bacterial counts. In addition, the Western diet has been shown to be associated with the production of nitrosamines, which promote cancer [31].
The high intake of saturated fatty acids (SFAs) has a negative impact on the gut microbiome [35]. A diet high in SFAs has been shown to increase the pathogenic delta-Proteobacteria, in particular Bilophila wadsworthia [36]. In addition, saturated fats of animal origin cause an increase in Firmicutes bacteria and a decrease in Bifidobacterium spp., which can cause inflammation, leading progressively to metabolic disorders [4]. A high-fat diet leads to a significant decrease in Roseburia spp., generating dysbiosis [36]. It also causes a decrease in the number of Faecalibacterium prausnitzii and bacteria of the Blautia genus, and therefore contributes to the reduction in butyric acid-producing bacteria [35]. The gut microbiota by anaerobic fermentation of carbohydrates produces metabolites, such as butyrate, acetate, and propionate, which belong to the group of SCFAs. These metabolites are used by colonocytes as a source of carbon and energy [37,38]. In addition, they have a positive effect on metabolic processes, appetite regulation, intestinal barrier integrity, and modulation of inflammation [37,39]. Propionic acid is a precursor for gluconeogenesis. Lactate produced by lactic acid bacteria (LAB) and Bifidobacterium also contributes to the formation of butyric acid. In turn, acetic and butyric acids are precursors for long-chain fatty acids and cholesterol synthesis. SCFAs, especially acetic and propionic acid, affect intestinal epithelial cells, causing stimulation of the secretion of important intestinal hormones such as peptide YY (PYY) and glucagon-like peptide 1 (GLP-1), which are involved in the secretion of insulin and leptin, thereby regulating food consumption and energy use. Butyric acid inhibits the production of pro-inflammatory genes in the cells of the microvascular endothelium of adipose tissue induced by lipopolysaccharide (LPS) and promotes histone acetylation [17]. Butyric acid is the favored energy source for colonocytes as it has a valid anti-inflammatory function and controls colonocyte proliferation, differentiation, and apoptosis. Moreover, it reinforces the protective barrier of the colon by stimulating mucin and antimicrobial peptide production by reducing the permeability of the intestinal epithelium and enhancing the tight junction’s protein expression [40].
Whereas carbohydrate fermentation metabolites are beneficial for health, eating large amounts of meat has been shown to increase the risk of colon cancer due to the production of harmful compounds such as ammonia, phenolic compounds, and hydrogen disulfide during protein digestion [38]. Protein of animal origin contributes to the increase in the number of bile-tolerant anaerobes of the Bacteroides, Alistipes, and Bilophila genera [41]. In addition, animal protein causes a decrease in the beneficial bacteria Eubacterium rectale, Lactobacillus spp., and Roseburia spp. [4]. It has been proven that eating red meat regularly is responsible for a high concentration of Bacteroides bacteria [36]. It has also been shown that eating a large amount of beef causes a decrease in the number of Bifidobacterium adolescentis and an increase in the number of bacteria of the genus Clostridium compared to a meat-free diet. In addition, a diet rich in animal protein causes an increase in the occurrence of Streptococcus spp., Enterococcus spp., Shigella spp., and Escherichia coli, and a reduction in beneficial bacteria F. prausnitzii and Ruminococcus spp., thus reducing the production of butyric acid [41]. Moreover, a mouse study revealed that high consumption of animal protein is associated with cardiovascular disease, because it changes the composition of the gut microbiota, contributing to the proatherogenic metabolite production, which is trimethylamine N-oxide [4].
Diets high in complex carbohydrates and dietary fiber promote the production of SCFAs, providing several health benefits. In turn, high consumption of refined carbohydrates and sugars is associated with the occurrence of type 2 diabetes and metabolic syndrome [38]. A high consumption of refined sugars causes the multiplication of pathogenic bacteria, such as Clostridium perfringens and Clostridioides difficile, and leads to a decrease in the diversity of gut microbiota [42]. In turn, a high-fiber diet is associated with the growth of Lactobacillus spp. and Bifidobacterium spp., that is lactic acid bacteria that inhibit the bacterial pathogens’ invasion and growth, protecting the human gut barrier [4]. It has also been shown that the consumption of large amounts of soluble fiber in the diet leads to the growth of Clostridium leptum, E. rectale, and Bacteroides spp. The first two species also belong to the butyric acid-producing bacteria [36]. Studies have shown that feeding the mouse with a high-fiber diet resulted in an increase in butyric acid-producing bacteria from the Lachnospiraceae family and a decrease in the amounts of proinflammatory bacteria such as Bacteroides acidifaciens, Ruminococcus gnavus, Clostridium cocleatum, and E. coli [42].
The microbiome is an essential element for human health because, as it is well known, dysbiosis is associated with different diseases, such as inflammatory bowel disease, obesity or coronary artery disease [43,44,45]. The first and fundamental step to identifying and modifying the microbiota composition associated with a disease is to identify the sets of microbiota traits that ensure proper health conditions and establish the correct ranges for these traits in healthy populations [7]. There is a very high risk of misinterpreting a single microbiome test without reference standards. Therefore, there is a strong need to define a healthy microbiome’s desired or expected traits in different populations. In the future, this will allow for the translation of diagnostics and therapies based on microorganisms into clinical medicine [22]. To date, no attempt has been made to characterize healthy microbiota in the Polish population. Therefore, there is a need to accurately characterize the health-related features of the microbiota and the correct ranges of these features among healthy people of Polish origin. This study aimed to characterize the core microbiome profile in healthy people on the Western diet. Diet, ethnicity, age, antibiotics therapy, stress, psychological factors, environmental factors, and physical exercises, are well-known factors influencing microbiota composition. Besides these well-known factors, the association between gender and microbiota was ignored in many studies and the results are inconsistent. Only a few animal and human studies have shown gender-related differences in gut microbiota. This study focuses on gender differences in the gut microbiota in a group of volunteers of Polish ethnicity on the same Western diet. We hypothesized that gender-dependent hormonal regulation may influence gender-specific differences in gut microbiota composition.

2. Material and Methods

2.1. Participants and Biological Material

A cross-sectional study was conducted in 2019–2022. One hundred and forty four healthy volunteers of Polish origin, living in central and southern Poland, aged 22 to 56, participated in the study. The volunteers were recruited via project advertisements at the official website of the University, and a face-to-face interception technique. Women constituted 53% (n = 77) in this group, while the remainder were men 47% (n = 67). The inclusion criteria were informed consent to participate in the study, good health condition, no chronic diseases and obesity, no medications or dietary supplements, without any addictions, without genetic disease in the family, not pregnant and not breastfeeding, in the case of women, and at the age of 18–65. Exclusion criteria included antibiotic treatment within 6 months and probiotics within 30 days before biological sample collection, gastrointestinal infections, IBD, thyroid disease, history of cancer, immunodeficiency, and other chronic diseases.
The Questionnaire for Dietary Habits, Lifestyle and Nutrition Knowledge Assessment (KomPAN®) used in this study is an improved and extended version of the Questionnaire of Eating Behavior (QEB), which is its prototype. The KomPAN® questionnaire contains four separate parts with thematically grouped questions:
-
part A: Eating habits;
-
part B: Frequency of food consumption;
-
part C: Views on food and nutrition;
-
part D: Lifestyle and personal data.
The researcher can use any questions of the questionnaire according to the purpose of the research and interests. We used the “minimum set of questions” of version 1.2 of the KomPAN® questionnaire to be completed by the respondents themselves, as recommended by the authors, which provides a basic scope for assessing eating habits and frequency of food consumption [46,47]. The reproducibility of the KomPAN® questionnaire was investigated by Kowalkowska et al. and moderate to very good reproducibility was shown. The KomPAN® questionnaire is the first comprehensive tool developed in Poland to assess lifestyle, eating habits, and nutritional knowledge [48]. Body mass index (BMI) [kg/m2] was calculated and interpreted based on the BMI classification for adults approved by the World Health Organization (WHO), using the height and current weight, from the formula: body weight [kg]/height [m]2 (Table 1) [49].
The study protocol was approved by the Jagiellonian University Medical College Ethics Committee. From all study participants, fecal samples were collected using the provided fecal sample collection containers. Oral samples were obtained with BactiSwab™ NPG Collection and Transport System (ThermoFisher Scientific, Horsham and Loughborough, UK). Both the stools and oral samples were collected at the participant’s homes and frozen immediately (−20 °C), then the frozen samples were transported to the laboratory and transferred to a −80 °C freezer, until the next study procedures. Bacterial genomic DNA was extracted from buccal swabs using QIAamp BiOstic Bacteremia DNA Kit (QIAGEN, Hilden, Germany), and from 250 mg of homogenized feces using QIAamp PowerFecal Pro DNA Kit (QIAGEN). All steps during the extraction were performed according to the manufacturer’s instructions. The extracted DNA was quantified and qualified using a spectrophotometer NanoDrop ND-1000 (Thermo Electron Corporation, US, Waltham, MA, USA) and fluorometer Qubit 4 (Invitrogen, Oxford, UK). Then, all DNA samples were stored at −20 °C until further analysis.

2.2. Genetic Library Construction

A sequencing library of the 16S rRNA gene V3 and V4 regions was constructed using gene-specific primers, which were adapted from the Klindworth et al. publication [50]. The libraries were prepared by the protocol for Preparing 16S Ribosomal RNA Gene Amplicons for the Illumina MiSeq System. The PCR-based amplification was performed using KAPA HiFi HotStart ReadyMix (ROCHE, Basel, Switzerland) according to the manufacturer’s recommendations. Before sequencing, the integrity and size (~630 bp) of amplicons were determined on Qubit 4.0 Fluorometer (Invitrogen) and Bioanalyzer (Agilent, US, Santa Clara, CA, USA) using Bioanalyzer DNA 1000 chips. Then, amplicons were pooled in equimolar concentrations and sequenced on a MiSeq instrument (Illumina) using a 300 × 2 V3 Kit and PhiX Control V3 from Illumina.

2.3. Statistical Analysis

The raw reads of 16S rRNA gene sequences generated as FASTQ formats were filtered using the Illumina16S Metagenomics workflow to obtain high-quality reads. Then, the high-quality sequences were clustered into operational taxonomic units (OTUs) at 99.9% identity based on the Greengenes Database and the algorithm with the high-performance implementation of the Ribosomal Database Project (RDP) classifier, which was described by Wang Q. et al. in 2007 [51]. Alpha and beta diversity were calculated using QIIME 2.0 software with Python scripts [52]. The richness was calculated as the number of unique OTUs found in each sample and presented as observed OTUs and the count of unobserved species based on low-abundance OTUs, which was presented as ACE, Chao1, Shannon, Simpson, and Phylogenetic Diversity ACE and Chao1 indices. Principal coordinate analysis (PCoA) with Jensen–Shannon divergence distance matrices were used to evaluate beta diversity, using the PKSSU4.0 version database. Linear discriminant analysis (LDA) effect size (LEfSe) was used to identify biologically and statistically significant differences in the OTU relative abundance. The comparative Microbiome Taxonomic Profile Analyzer was used to characterize the microbial profiles of study participants. Differences based on beta diversity of the whole microbiome structure among groups were calculated using a permutational multivariate analysis of variance (PERMANOVA).

2.4. Ethical Considerations

The research was conducted in compliance with the highest ethical standards of our department, national guidelines, and the Helsinki Declaration. All protocols for the study were approved by the Ethics Committee of Jagiellonian University Medical College (approvement number 1072.6120.267.2019), and written informed consent was obtained from each subject before enrollment.

3. Results

3.1. Participants

The respondents ranged from 22 to 56 years, and the average age was 39.90. The study participants’ characteristic parameters are shown in Table 2. The survey showed that Polish people more often choose refined grain products than whole grains, rich in fiber. In addition, they often consume dairy products, especially in the form of cheese and fermented milk drinks, and meat delicatessen products, such as cold cuts, sausages, and wieners. In addition, most of the respondents admitted that they add sugar to hot drinks. To sum up, the respondents followed a typical Western diet, the most common in Poland, and led a moderately active lifestyle (Table 3).

3.2. Alpha and Beta Biodiversity

Biodiversity was determined at the level of alpha (α) diversity and beta (β) diversity. To assess the alpha differentiation of bacterial communities, we calculated the species richness by the Abundance Coverage Estimate (ACE) Chao1 method, while diversity indexes were calculated by Shannon and Simpson index. Principal coordinate analysis (PCoA) with Jensen–Shannon divergence distance matrices were used to evaluate beta diversity. The phylogenetic differences between species were measured based on the Phylogenetic diversity index.
Table 4 shows the run parameters for stool samples and oral swabs. No statistically significant differences in alpha diversity were found in either the gut or oral microbiota (Table 5).
Statistically significant differences were found in beta diversity in the gut microbiota only (Figure 1). Figure 2 and Figure 3 show the bacteria groups that produce lactic acids as a result of fermentation in the gut and oral microbiota. No statistically significant differences in Bacteroidetes to Firmicutes and Firmicutes to Bacteroidetes ratios were found in both the gut and oral microbiota, but the abundance of Bacteroidetes was higher in the gut microbiota of females and in the oral microbiota of males. Statistically significant differences in the gut microbiota are shown in Figure 4, Figure 5 and Figure 6.

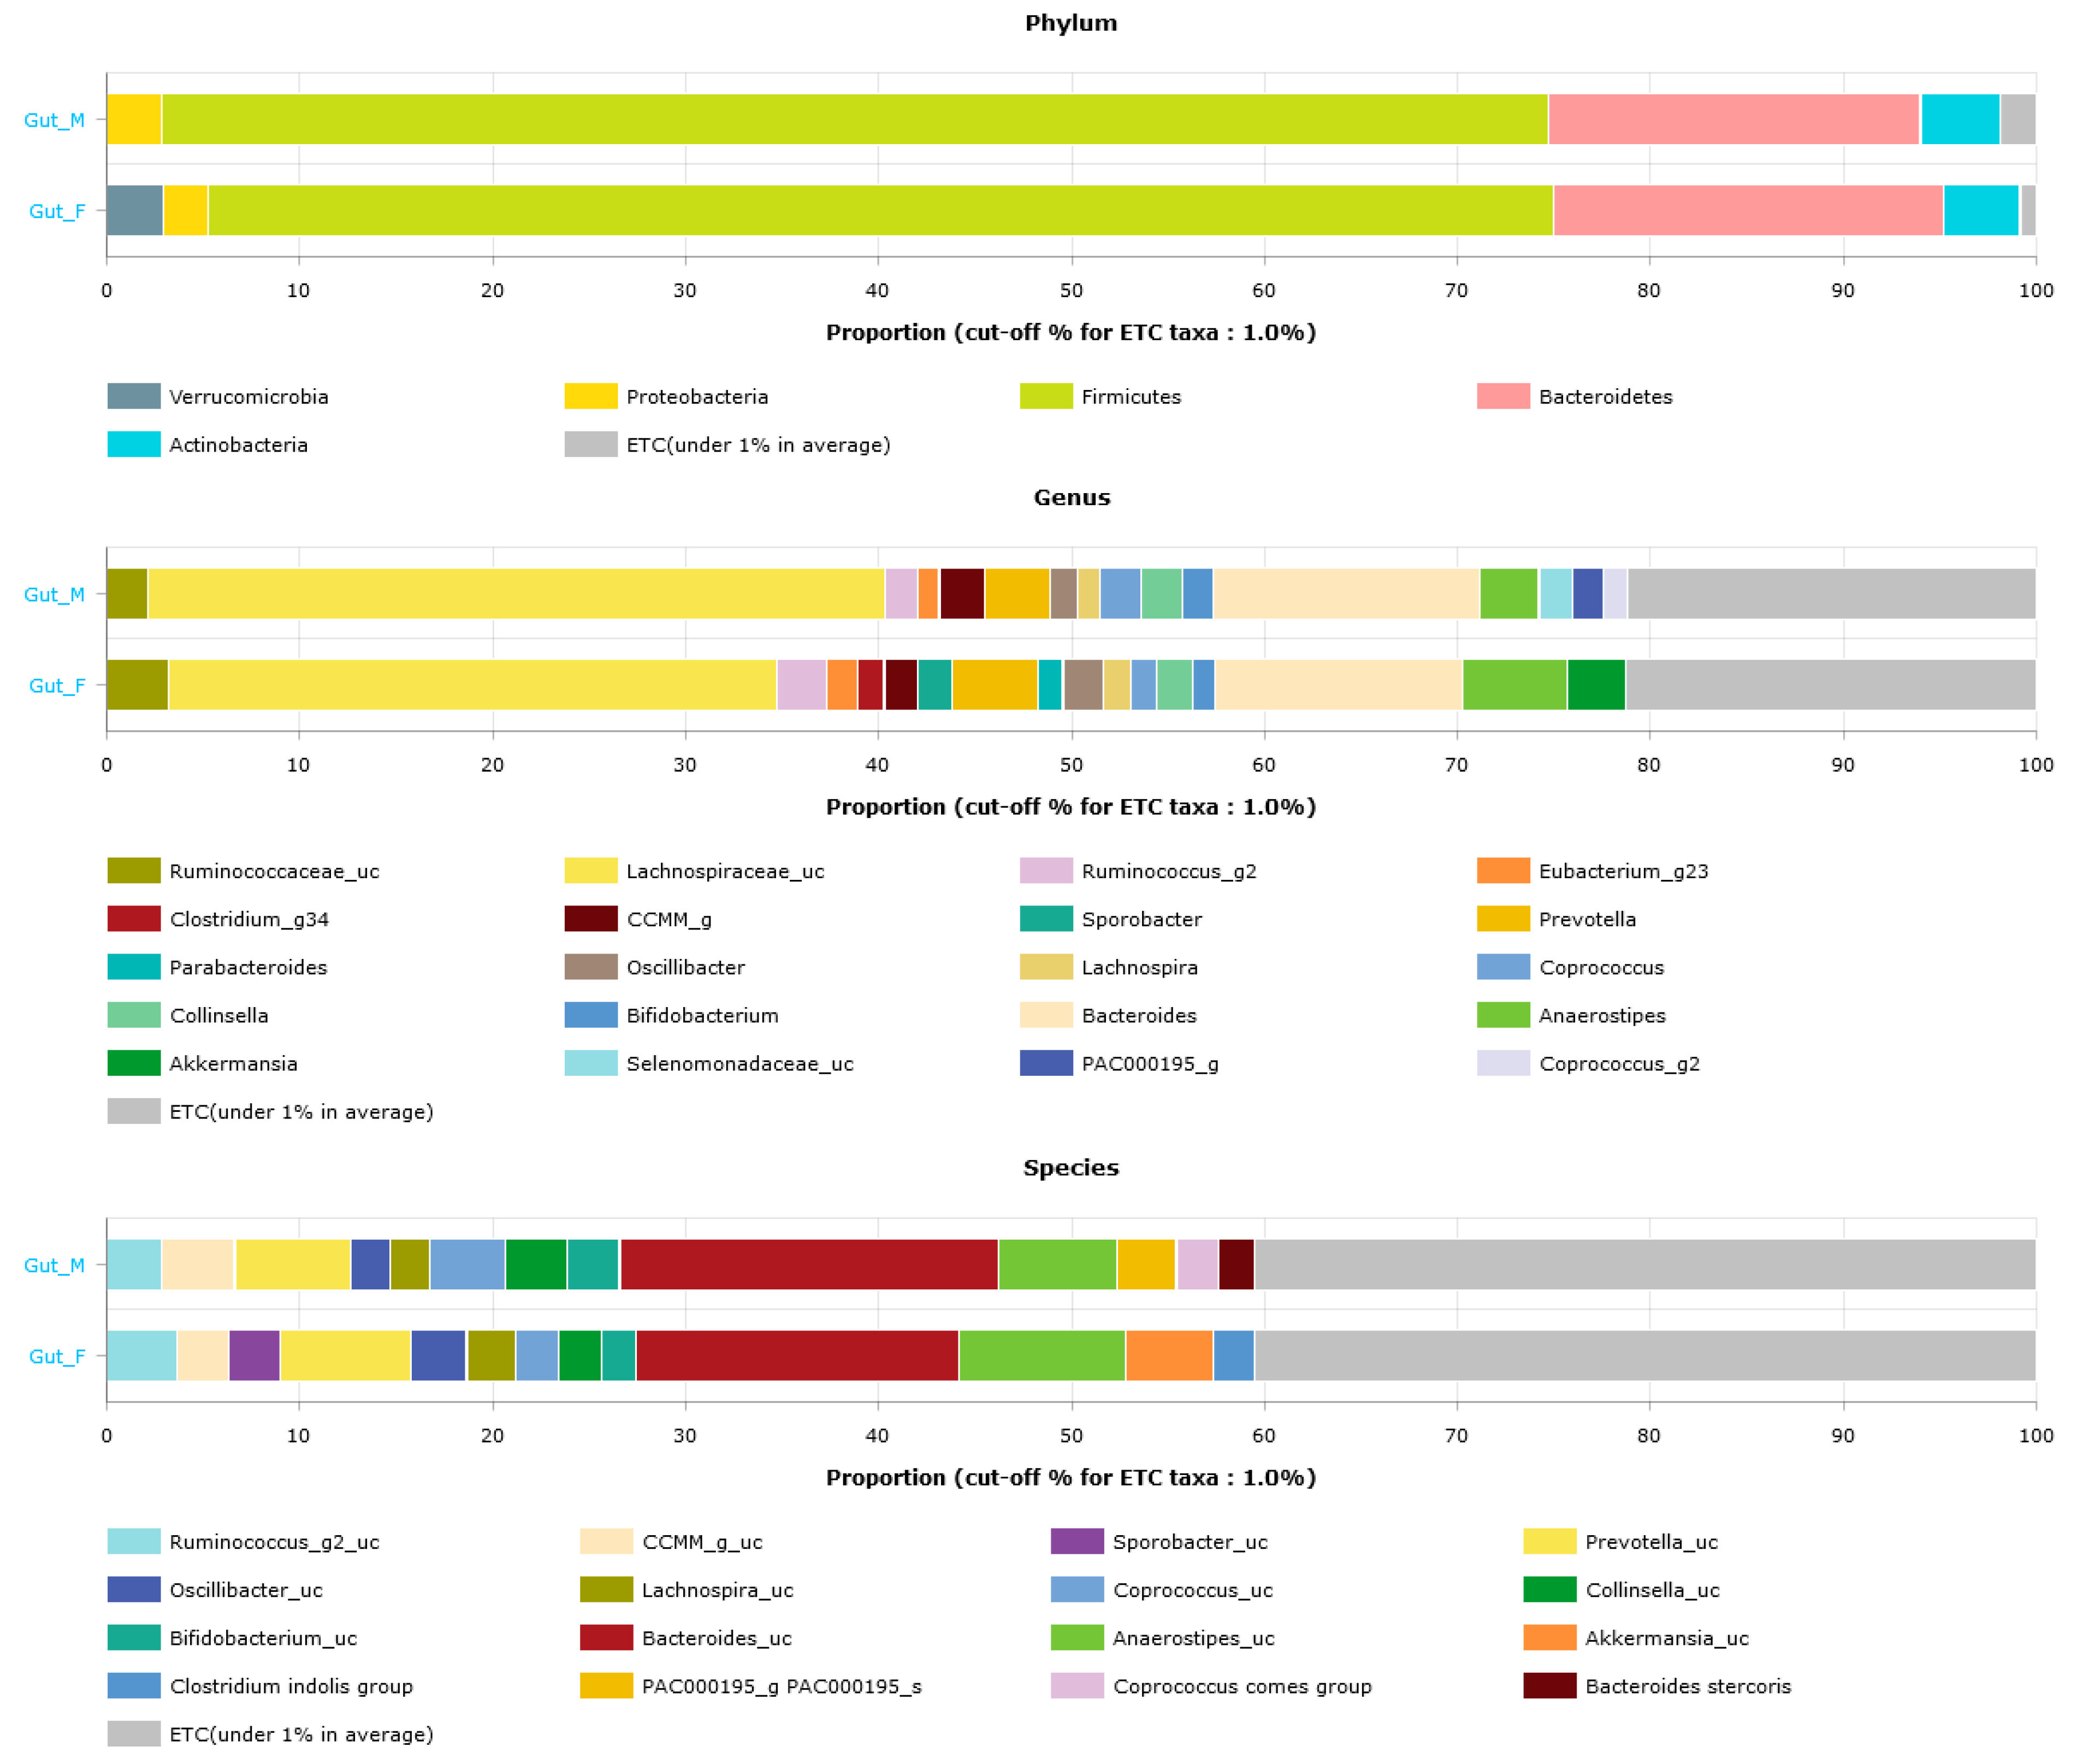
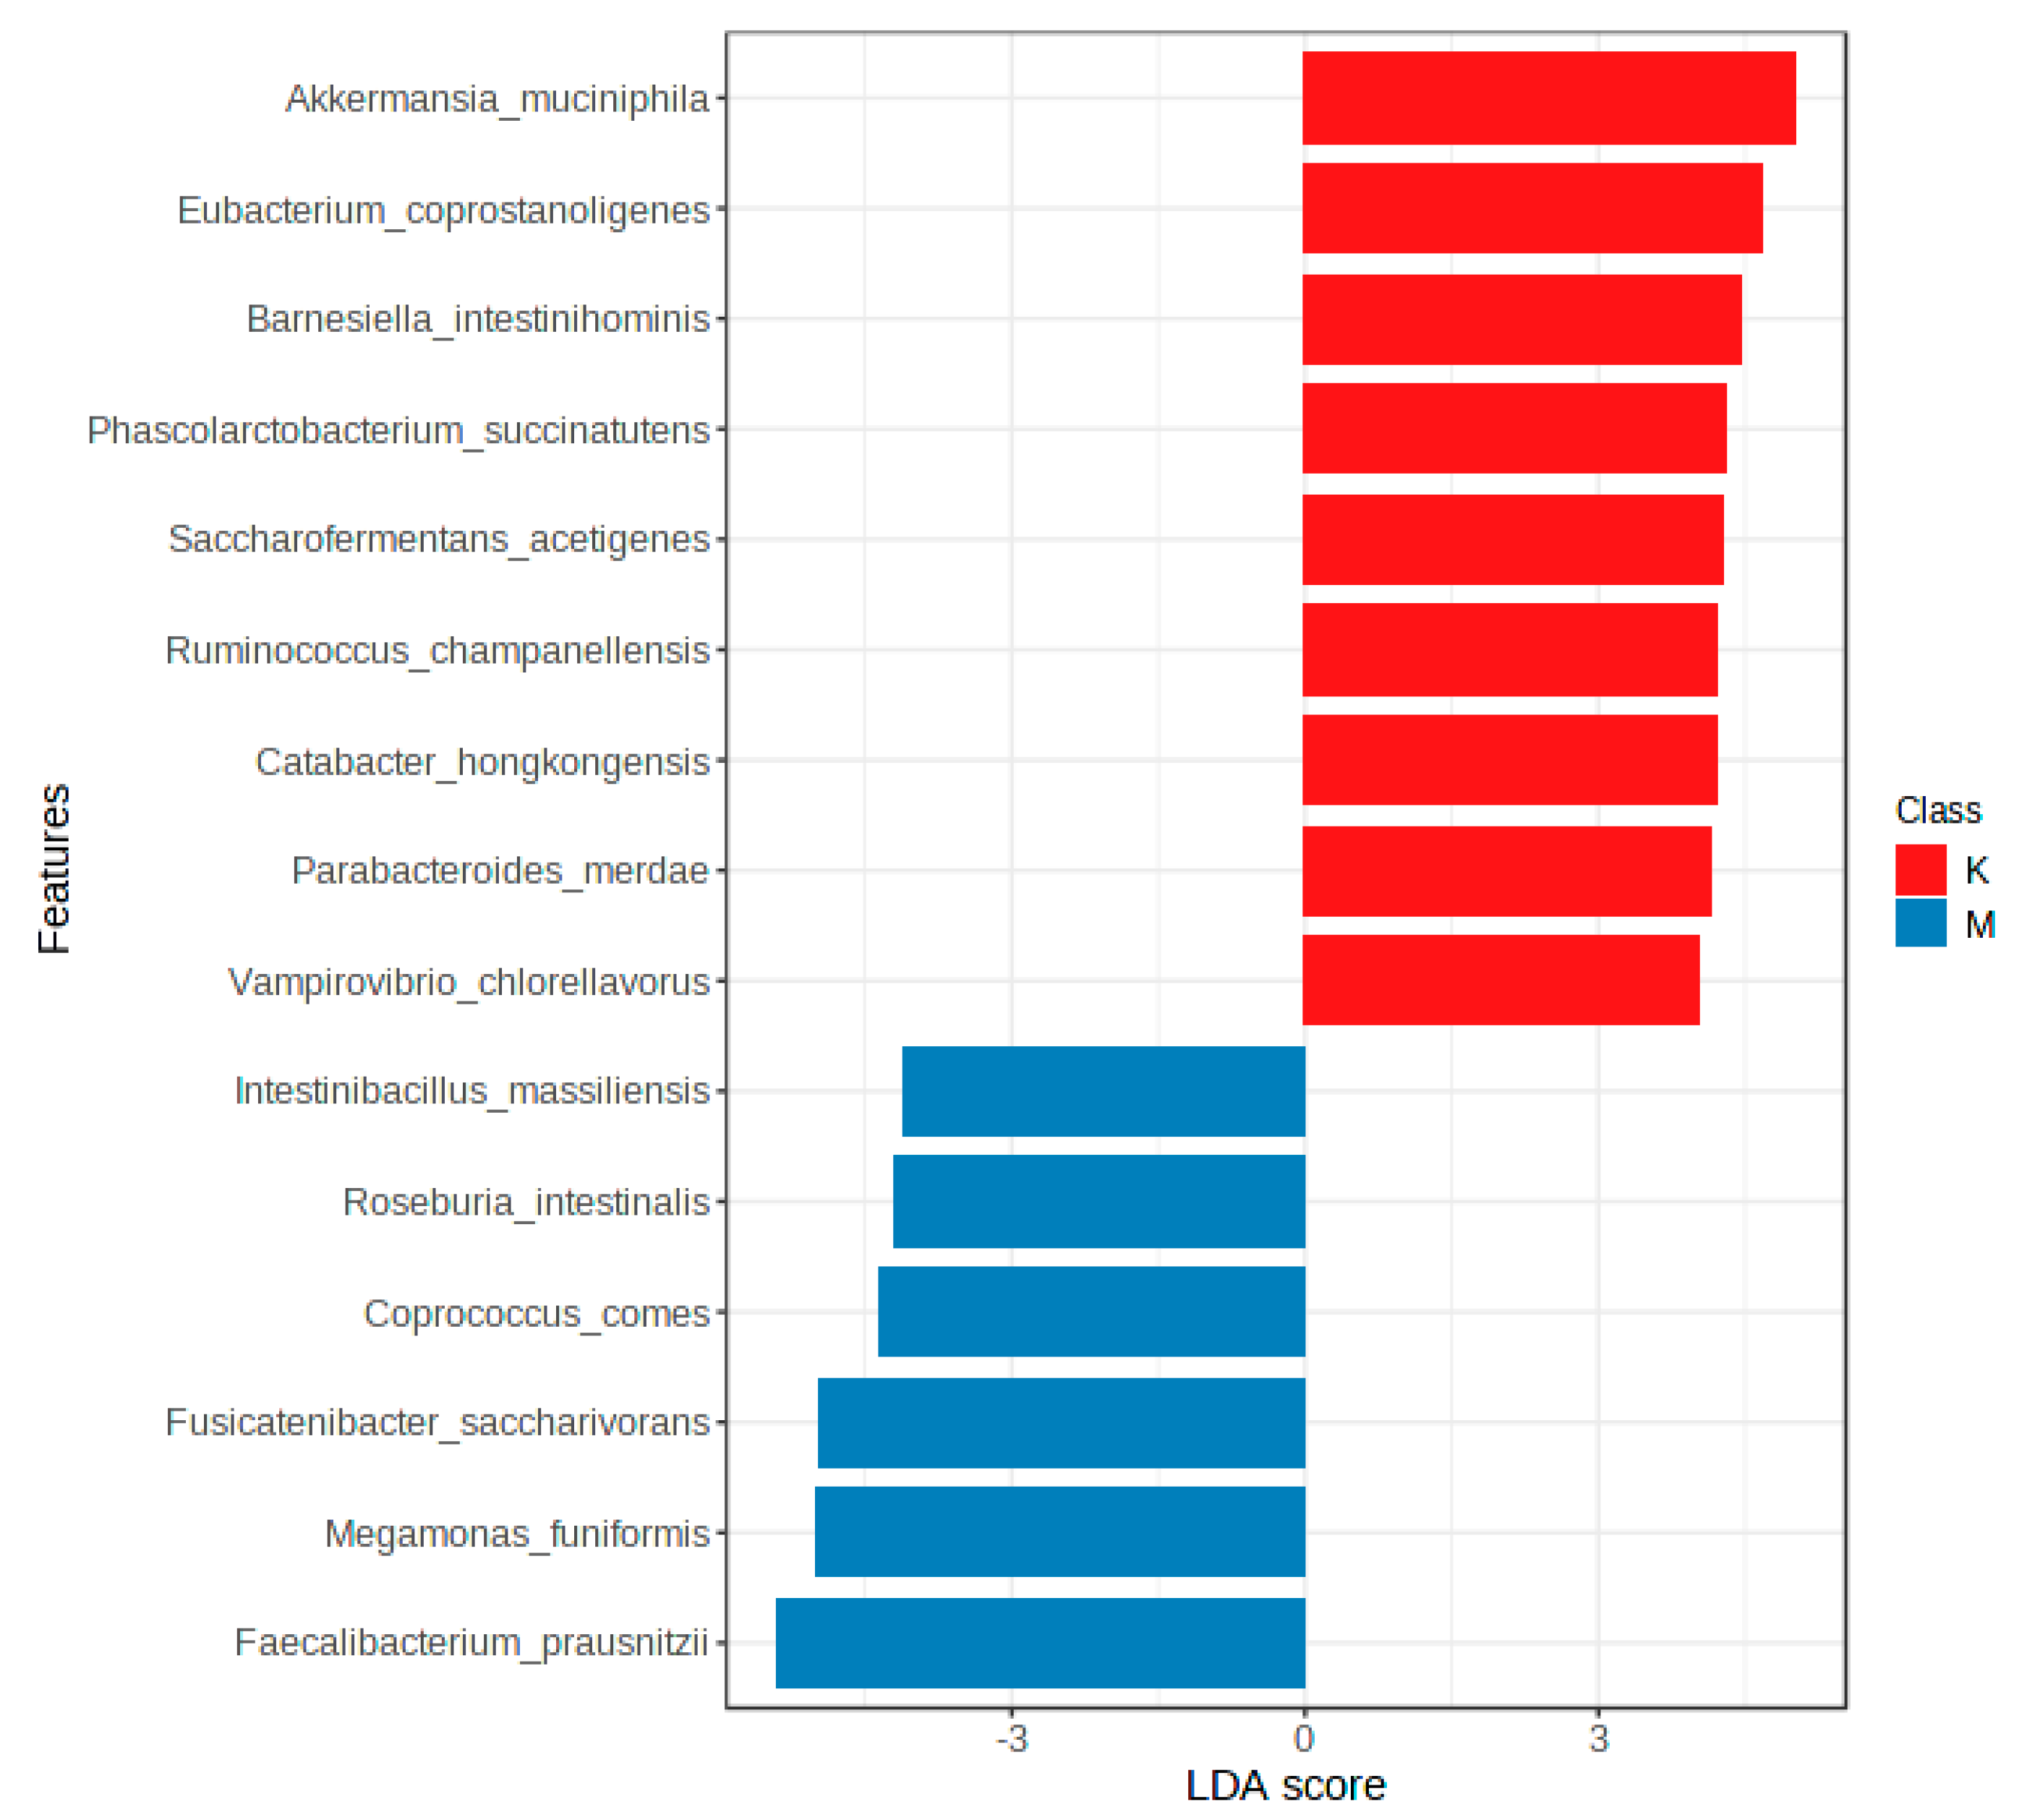
3.3. Gut Microbiota Profiles

Firmicutes and Bacteroidetes types together accounted for 91.5% of the gut microbiota in males and 90% in females. At the genus level, the largest part of the gut microbiota was bacteria from the Lachnospiraceae family—38.5% in males, 31.5% in females—and bacteria of the Bacteroides genus—about 13% in males and females. Moreover, in both males and females, Bacteroides spp. and Anaerostipes spp. together accounted for about 25%. Prevotella spp. was the third most abundant genus of bacteria in the gut microbiota and accounted for about 6% of males and 7% of females (Figure 7).
The permutational analysis of variance (PERMANOVA) was used to estimate the statistical significance of differences in the observed community composition at species level between males and females. In the gut samples, we identified 15 taxa that showed significantly different abundances between men and women (Figure 8). The largest differences were attributed to Akkermansia muciniphila with the highest abundance in females’ group, and Faecalibacterium prausnitzii with the elevated level in males’ group. In Figure 8, many other co-varying species that were identified in both groups are presented.

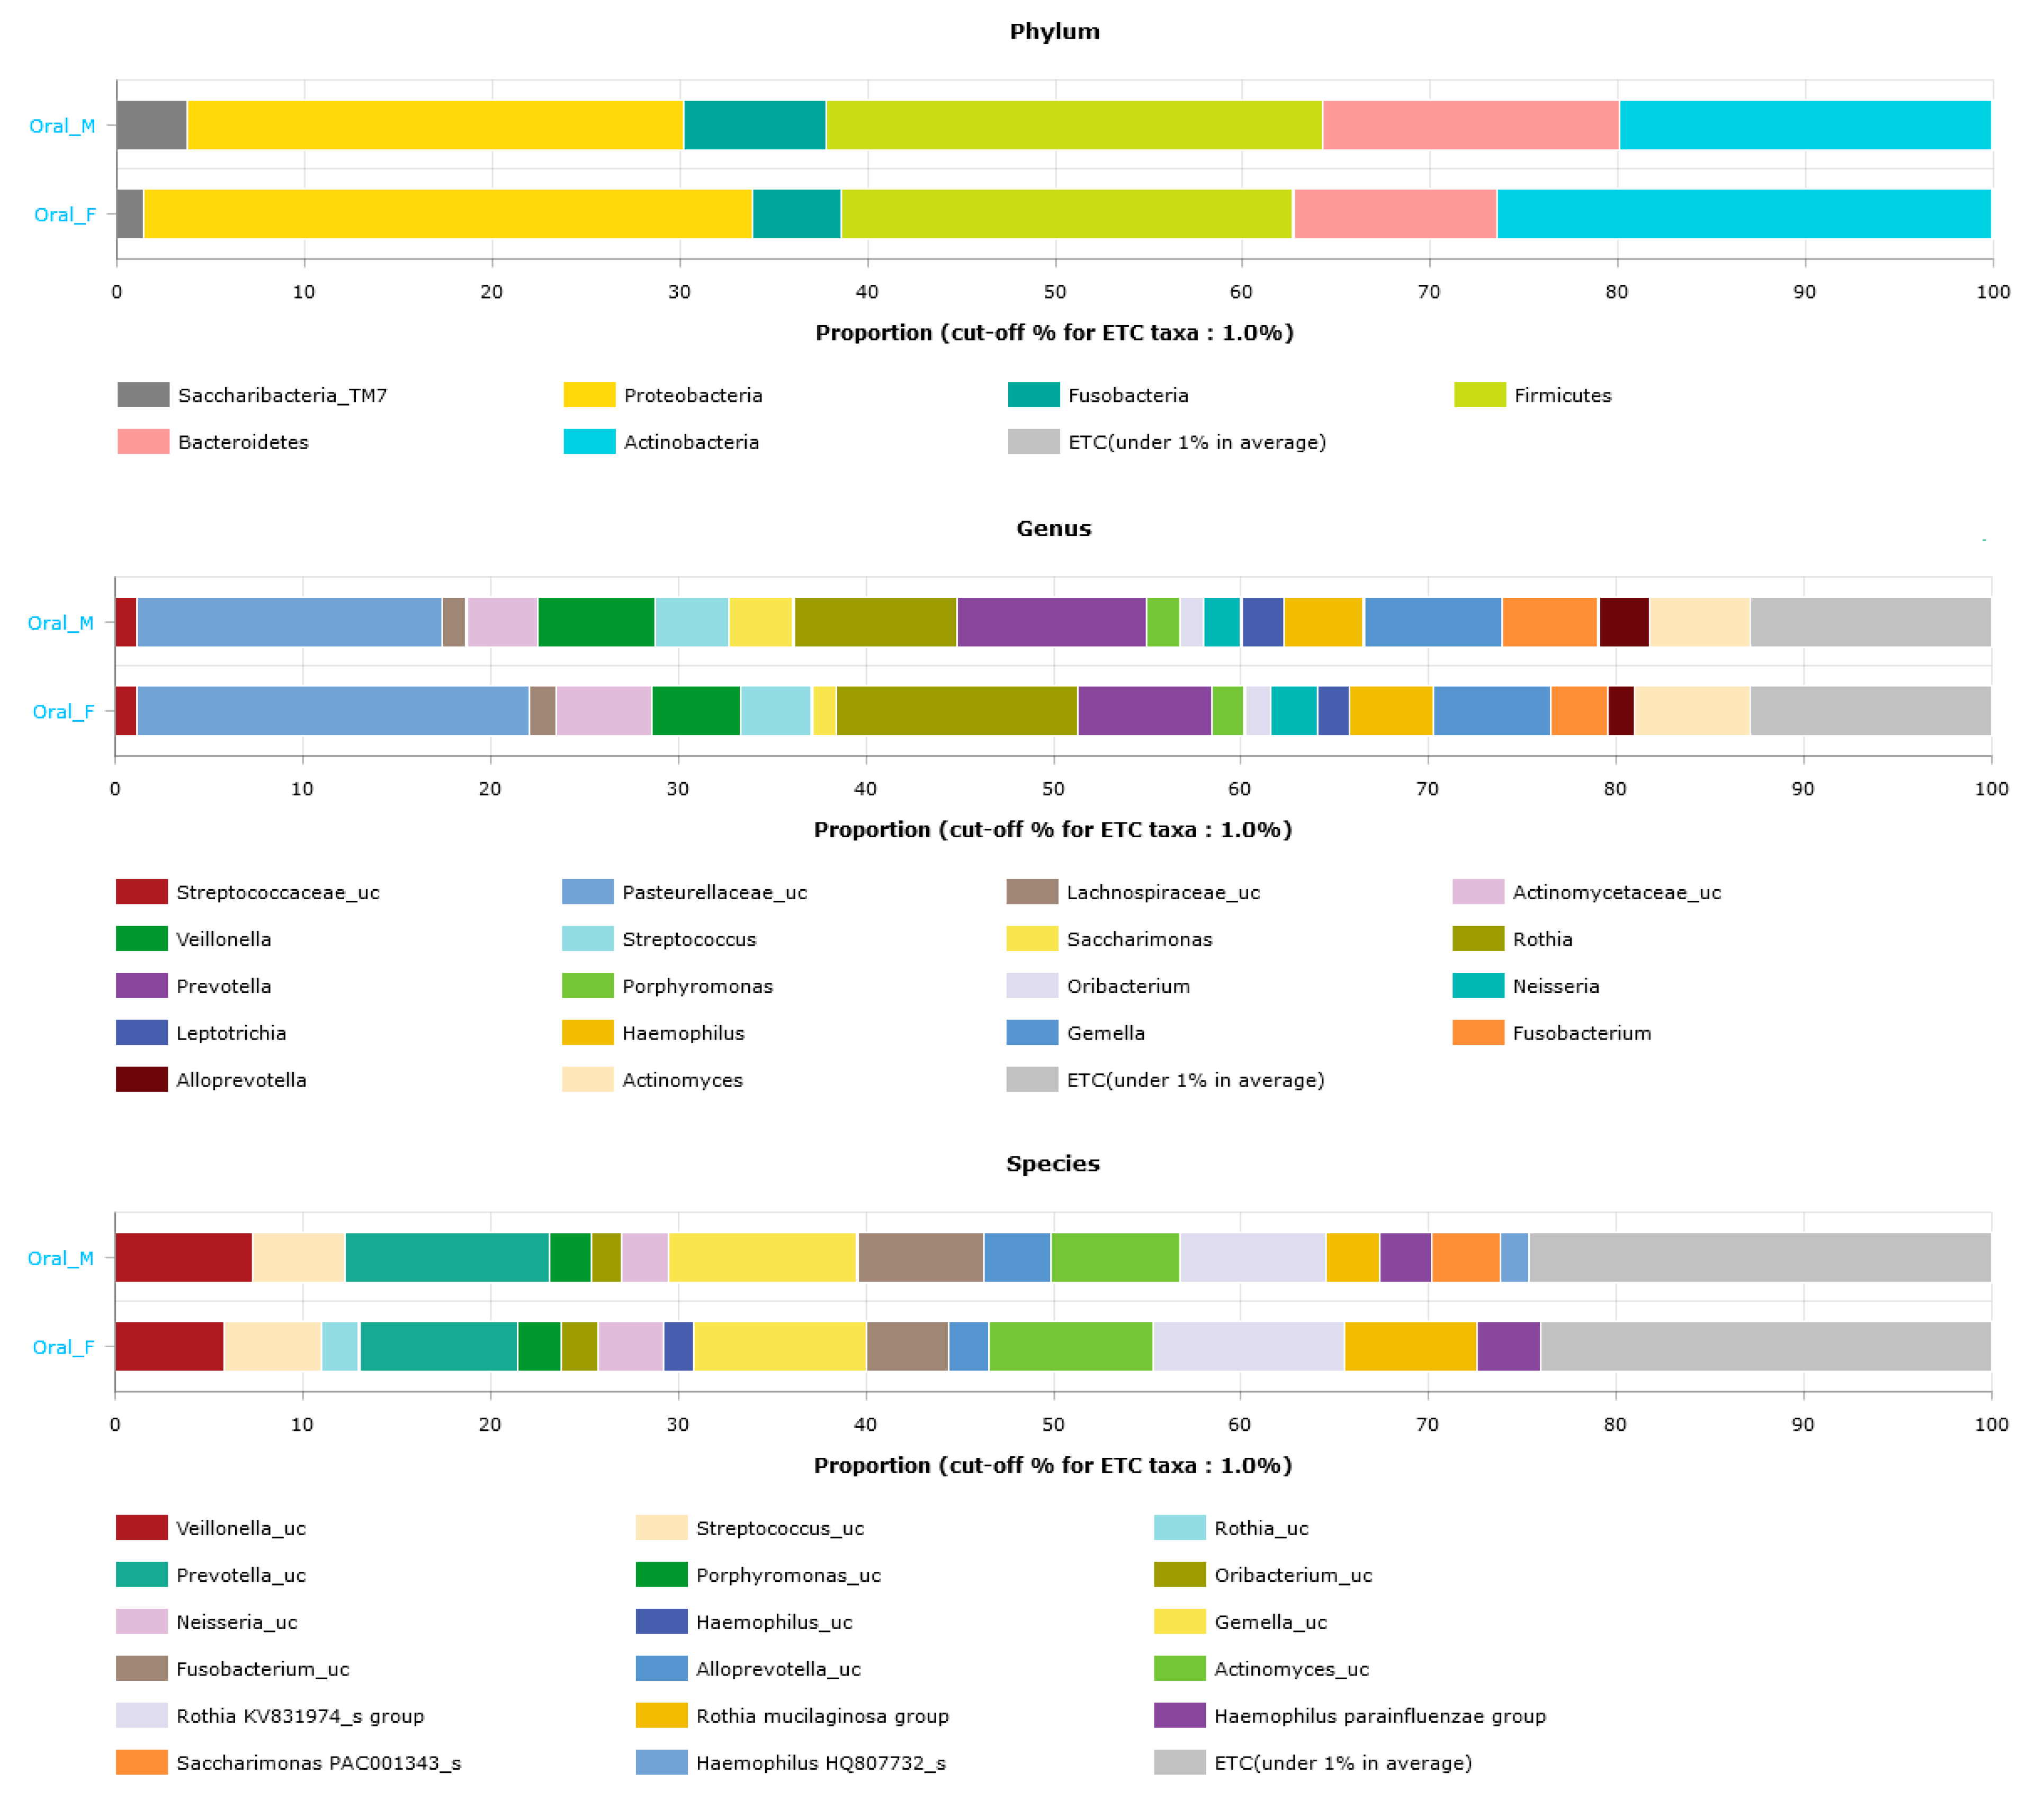
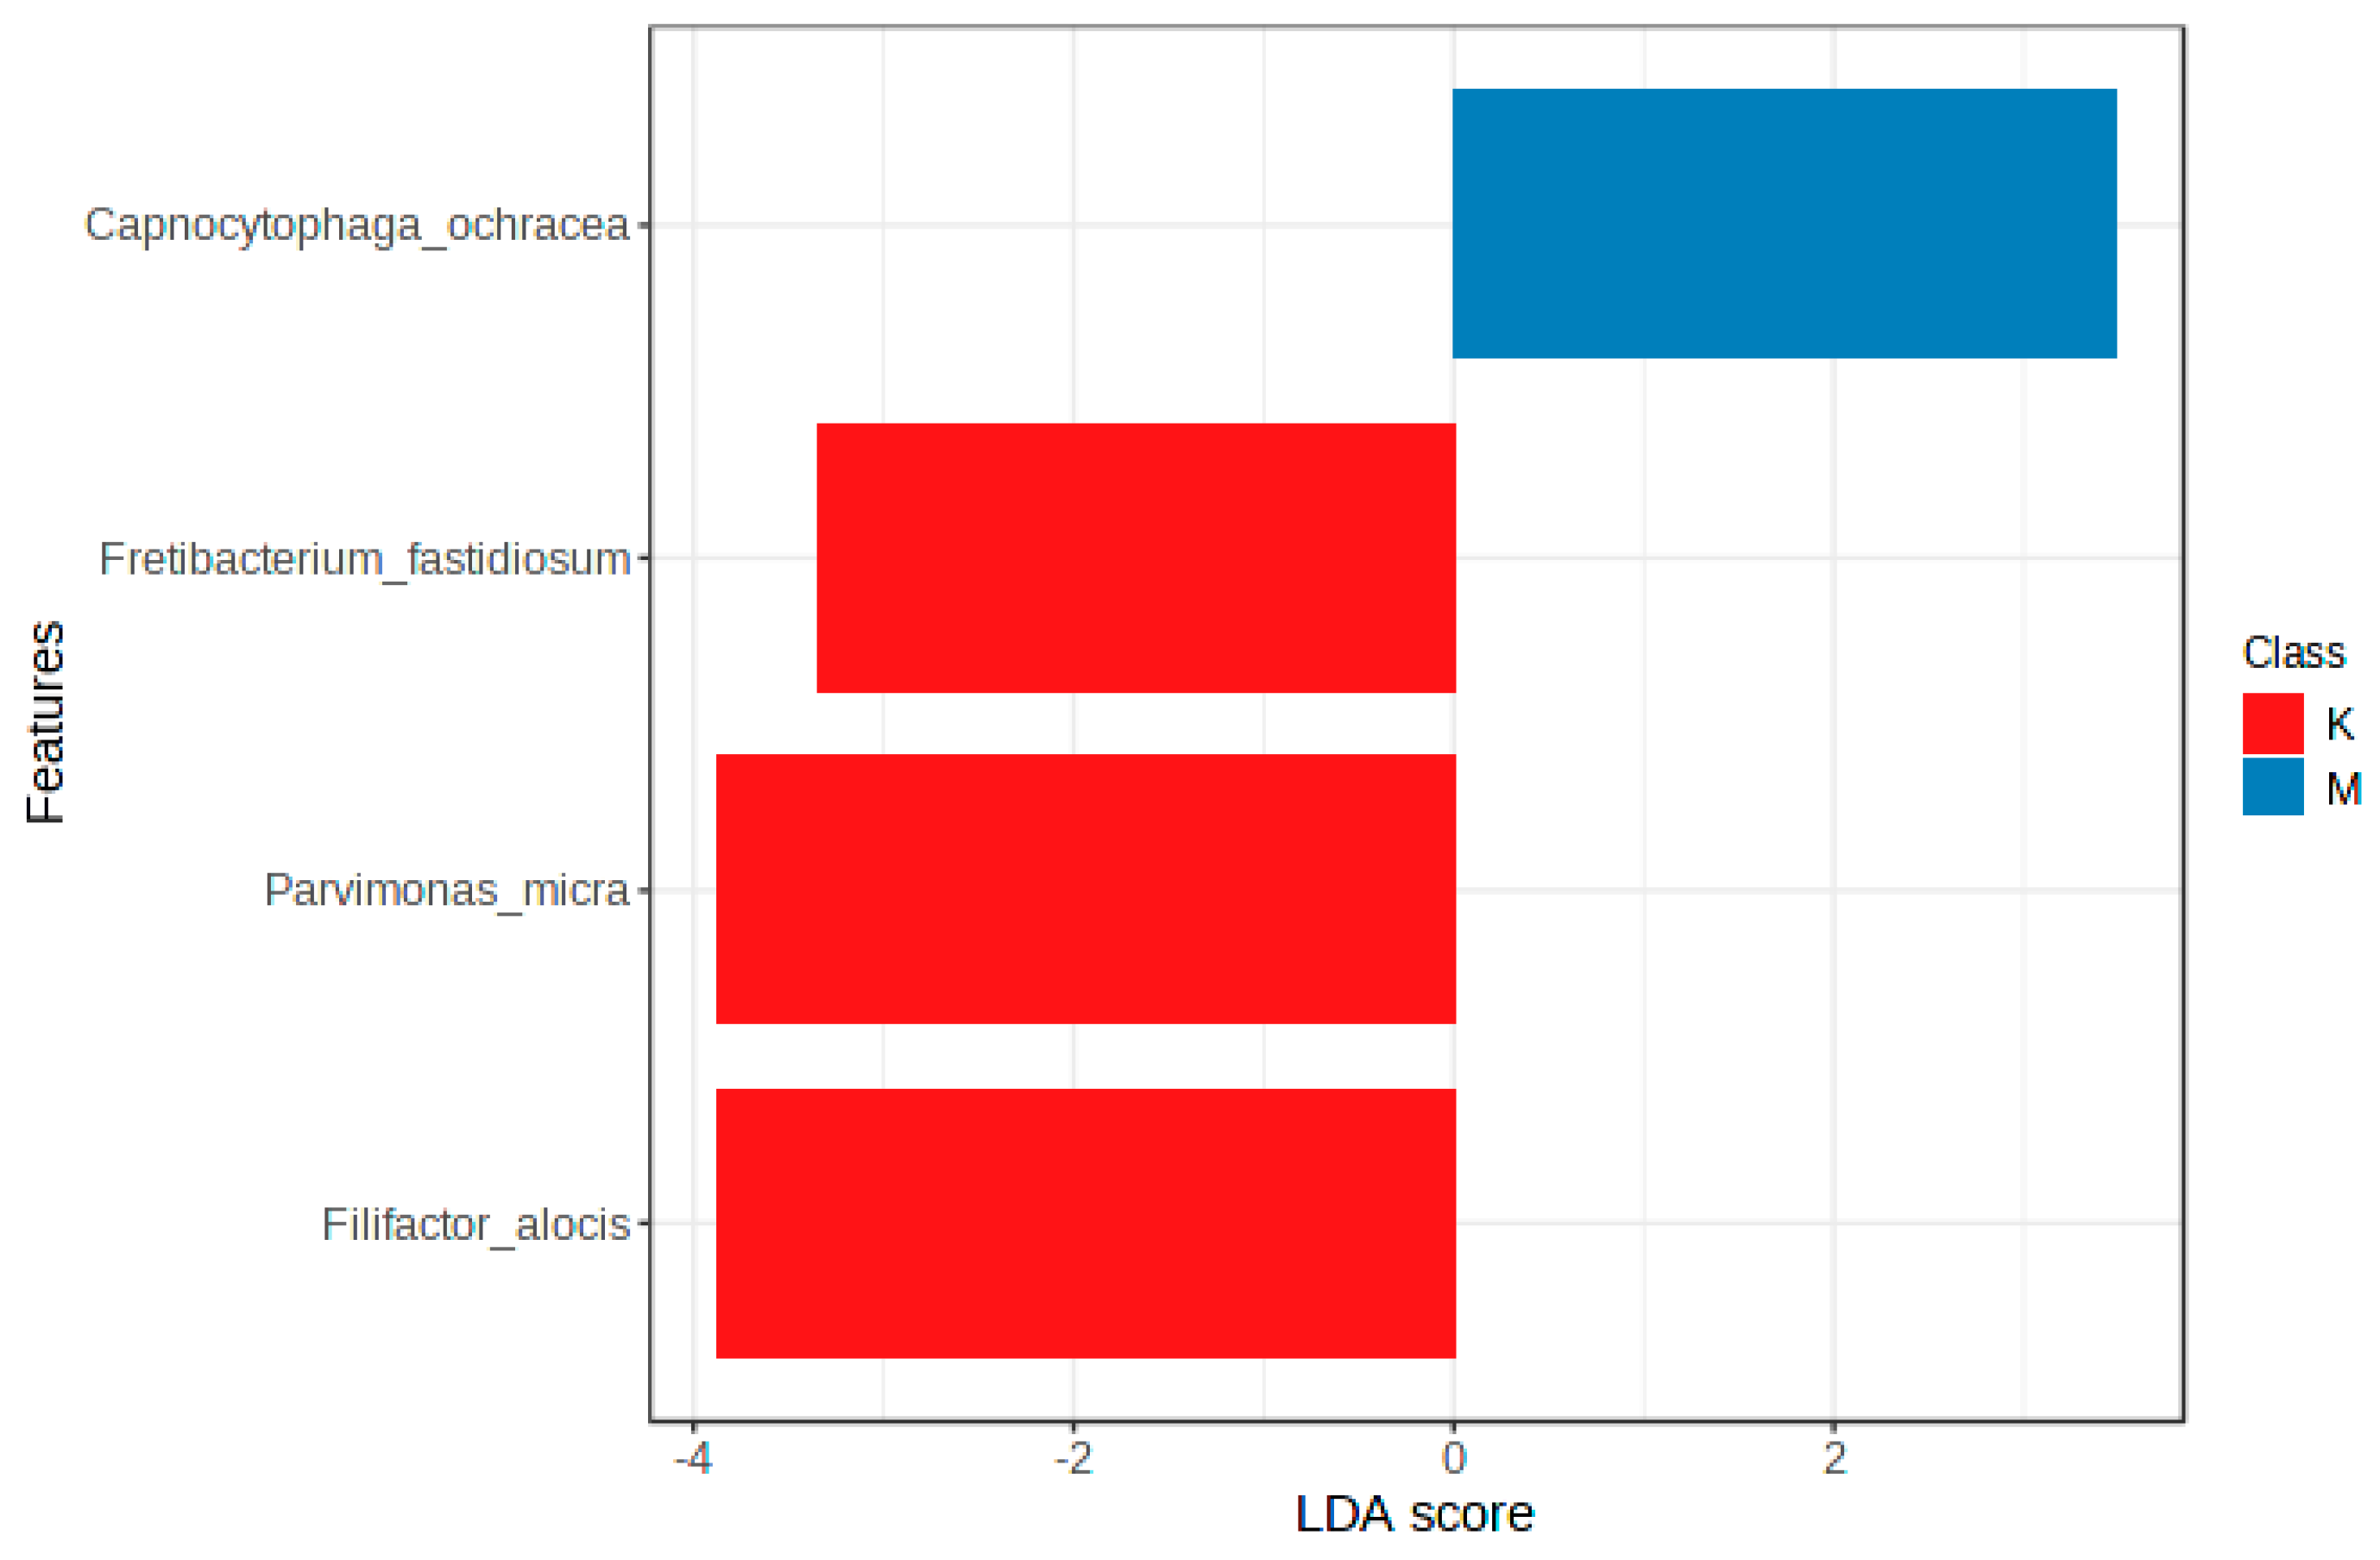
3.4. Oral Microbiota Profiles

Bacteria of Firmicutes and Proteobacteria had the largest share in the oral microbiota—54% in males and 57% in females, but in females, Proteobacteria type dominated the Firmicutes type—about 32.5% to 24.5%. The family of Pasteurellaceae dominated oral microbiota—16% in males and 21% in females. In both males and females, the genus of Rothia and Prevotella bacteria together accounted for about 20%. In females, the genus of Rothia bacteria dominated, while in males, the genus of Prevotella bacteria dominated. The most common species of bacteria in the oral microbiota in both males and females were Prevotella spp., Gemella spp., Rothia spp., Actinomyces spp., and Veillonella spp. (Figure 9).
The PERMANOVA analysis estimated the statistical significance of differences in the observed community composition at species level between males and females in buccal swab samples. The largest differences were attributed to Capnocytophaga ochracea with the highest abundance in females, and Filifactor alocis with the elevated level in males. In Figure 10, the other co-varying species that were identified in both groups are shown.

4. Discussion

The dominant types of gut bacteria in healthy people are Bacteroidetes, Firmicutes, Actinobacteria, and Proteobacteria, with the first two types accounting for about 90% of the gut microbiota [53,54]. Our research confirmed that types Bacteroidetes and Firmicutes constituted precisely 90% of the gut microbiota in healthy women and 91.5% of the gut microbiota in healthy men of Polish origin.
The subjects followed a typical Polish, European, and Western diet, particularly rich in starch, sugar, and animal protein, and low in dietary fiber. The study by Jandhyal et al. showed significant differences in the composition of the gut microbiota depending on geographical origin and related to differences in the diet. The subjects followed a typical Polish, European, and Western diet, affluent in starch, sugar, and animal protein and low in dietary fiber. Children from rural Africa have been shown to have higher levels of Prevotella species, while children from Europe have higher levels of Bacteroides species [55]. The research also shows that the genus Bacteroides dominates the genus Prevotella in healthy people of Polish origin; therefore, in this case, it is most likely to be related to the typical Western diet. Moreover, it is related to the agrarian diet consumed by African children and the Western diet consumed by European children.
Furthermore, another study compared the composition of the microbiota of Native Africans and African Americans. It has been observed that the genus Bacteroides is also dominant among African Americans. The diet of African Americans, similarly to the diet of Europeans, including Polish people, is characterized by greater consumption of animal fat and protein and lower consumption of dietary fiber compared to the diet of Native Africans, and thus the similar composition of gut microbiota in Americans and Europeans [56,57]. In a study by Gomez et al., the composition of the microbiota of the Baka pygmies, the agricultural Bantu population, and the American population was analyzed. Here, as well, the microbiome of the American population was enriched with the genus Bacteroides, which once again confirms that the American diet, just like the European diet, is associated with the growth of bacteria of the genus Bacteroides [58].
A study by Schnorr et al. analyzed the gut microbiota of hunter gatherers from Tanzania and the Italian urban population. The microbiome of the Italian population was characterized by a greater abundance of Firmicutes from the Blautia, Ruminococcus, and Faecalibacterium genera and bacteria from the Bifidobacterium genus [59]. Our research shows that in the gut microbiome of the healthy Polish population, as in the Italian population, the genus Faecalibacterium and Ruminococcus were dominant, and there were numerous bacteria of the genus Blautia. Therefore, the presence of these types of bacteria in the gut microbiota may also be associated with using the Western diet.
A study by Obregon-Tito et al., in turn, showed differences in the microbiota composition between the Peruvian Amazon gatherer and hunting community, the Tunapuco community of the Andes, and Oklahoma residents in the United States. Following a typical American diet, Oklahoma residents also had more Bifidobacteria and genera such as Ruminococcus, Blautia, and Dorea [60]. It is another confirmation that healthy Americans and Europeans have a similar gut microbiota profile.
In the study by Wang et al., the composition of the gut microbiota of the Chinese population was analyzed. In the healthy control group, the Bacteroidetes type constituted 53.2% of the total amount of bacteria [61]. Our research shows, in turn, that the type of Bacteroidetes constituted only 23% of the gut microbiota in women and 19% in men. Therefore, healthy Polish people had more than half as much Bacteroidetes in their gut microbiota than healthy Chinese people. Another study showed that bacteria of the genus Haemophilus constitute 0.34% of the oral microbiome in healthy Beijing citizens [62]. Similarly, in the Polish population, bacteria of the genus Haemophilus constituted a small part of the oral cavity microbiota.
Geographic and ethnic origin greatly influence the basic profile of the microbiota [63]. In five European countries, the influence of ethnicity on the composition of the microbiota was more significant than the diet. Bifidobacteria dominated northern countries, and earlier and greater differentiation of gut bacteria was observed in the southern countries. On the other hand, in the United States, it was noticed that the abundance of Bifidobacteria differs between white and Hispanic infants but does not differ from the black race [64]. In the gut microbiota of healthy Polish people, Bifidobacteria are also one of the most common but not dominant bacteria.
Many studies have found differences in the gut microbiota composition between countries, which is mainly related to local eating habits. Therefore, in different populations, the elemental composition of the microbiota in healthy individuals, considered to be the norm, will vary [65]. Knowledge of the individual profiles of microorganisms in the design of therapeutic interventions is of great importance for the evolving field of personalized nutrition [66]. Adjusting a personalized diet based on microbiome analysis to modulate its composition and re-establish healthy gut microbiota is a novel approach to nutritional treatment [67]. However, the basis of this type of approach is the knowledge of standards adequate to a given community, taking into account, first of all, ethnicity as well as lifestyle and eating habits [68].
In this research, no statistically significant differences in alpha species diversity in the basic profile of the oral and gut microbiota, and in beta species diversity in the basic profile of the oral microbiota were observed between the group of healthy Polish women and the group of healthy Polish men. Both our own research and that of other authors show that diet and other environmental factors have a strong impact on the composition of the oral and gut microbiota. The study included people with moderately good eating habits, without obesity, but with heterogeneous environmental conditions. Therefore, in the case of some characteristics of the gut microbiota, statistically significant differences were observed between women and men, despite the observed regularities in the basic profile consistent with the literature data. Akkermansia belongs to the mucin-degrading bacteria, which contribute to the production of SCFAs. Obesity and other obesity-related metabolic disorders have been shown to be ameliorated by the treatment of Akkermansia muciniphila [69]. In our study, taxonomic-related abundance of Akkermansia in the gut microbiota was higher in females than in males (p = 0.030). A high amount of Akkermansia correlates with a better cardiometabolic profile. Akkermansia has been shown to have a beneficial effect on inflammation and glucose metabolism [70]. In a study by Keshavarz Azizi Raftar et al., the abundance of Akkermansia was higher in healthy people compared to patients with osteopenia and osteoporosis [69]. Moreover, it has been proven that the amount of Akkermansia drastically decreases in patients with acute ischemic stroke [71]. On the other hand, in patients with cerebral ischemic stroke, Akkermansia and Ruminococcaceae increased compared to the control group in another study. In addition, Christensenellaceae and Ruminococcaceae levels were positively correlated with disease severity, and Christensenellaceae levels were positively correlated with clinical outcomes of patients with cerebral ischemic stroke. Furthermore, Christensenellaceae and Ruminococcaceae were significantly positively correlated with the National Institutes of Health Stroke Scale (NIHSS) [72]. It was recognized that the high abundance of Akkermansia and Christensenella promotes healthy aging and, furthermore, longevity. The abundance of Christensenellaceae has been shown to be related to gender [73]. In an American study, women have been shown to have a greater abundance of Christensenellaceae than men [74]. Similarly, in our study, females had higher levels of Christensenellaceae in the gut microbiota than males (p = 0.029). A high abundance of Christensenellaceae in the gut microbiota was also negatively correlated with inflammatory bowel disease and obesity [73]. In a study on animals fed a methionine-restricted diet, levels of Ruminococcaceae were higher in females and lower in males [75]. In our study, the abundance of Ruminococcaceae was also higher in women than in men (p = 0.033). Interestingly, an increase in Ruminococcaceae was observed in females on the methionine-restricted diet compared to the control diet [75]. Our study differs from other microbiome composition studies most likely in terms of method, design, and population studied. This study has several limitations. Advanced technologies for analyzing the composition of the microbiome are associated with high costs; therefore, the most critical limitation is the size of the study. A wider study cohort would lead to more accurate results and possibly more statistically significant differences. In addition, people from central and southern Poland took part in the study. For researchers who would like to take up this topic in the future, we recommend to include people from different areas of a given country, for instance, Poland. There is a strong need to determine the ranges of healthy microbiota in Polish people to find the causes of diseases and their treatment.

5. Conclusions

These findings suggest a basic profile of the oral and gut microbiota in healthy people of Polish origin, following a typical Polish, and at the same time Western diet (rich in starch, sugar, and animal protein, but low in dietary fiber). There were no statistically significant differences in the alpha species diversity between the composition of the oral and gut microbiota in women and men nor in the beta diversity in the case of the oral microbiota. Statistically significant differences in beta diversity were found between the composition of gut microbiota in women and men. The taxonomic abundance of Akkermansia, Christensenellaceae, and Ruminococcaceae in the gut microbiota was higher in women than in men, suggesting better metabolic health in females compared to males. Bacteria of the Firmicutes and Proteobacteria types predominate in the basic profile of the oral microbiota. In turn, the Firmicutes type dominates the gut microbiota. In total, bacteria of the Firmicutes and Bacteroidetes types in the gut microbiota of the healthy Polish population constitute about 90%, confirmed by the literature data. Gender refers to the biological classification of a species based on different cultural attitudes and behaviors associated with its reproductive systems. Gender differences in microbiota profiles are very important factors, not only in human research, but also in preclinical research. Usually, in preclinical animal model studies, male animals are used. There are large amounts of animal reports showing gender-specific differences in the composition of gut microbiota [76,77,78,79,80,81]. The most important reason for using gender classification as a variable in experiments is the issue of reproducibility of the experiment. Gender differences in the gut microbiota may play a role in the sex differences in disease development and progression. Especially, in microbial analysis, gender analysis should be performed routinely in studies on the gut microbiota, which is still not actively being carried out despite the fact that these studies are increasing rapidly [82,83,84,85,86,87,88,89,90,91]. Despite many studies, we still know very little about the gut microbiome of different populations. There is still a great need for further research on the human microbiome in order to be able to adjust the diet, probiotic therapy, or treatment in various disease states in the future.

Author Contributions

Conceptualization, B.Z. and J.P.; methodology, B.Z. and A.D.; software, B.Z.; validation, T.M.; formal analysis, T.M.; investigation, B.Z. and A.D.; data curation, B.Z.; writing—original draft preparation, J.P. and B.Z.; writing—review and editing, B.Z., J.P. and T.M.; visualization, B.Z.; supervision, T.M.; project administration, B.Z.; funding acquisition, B.Z. and T.M. All authors have read and agreed to the published version of the manuscript.

Funding

This research received no external funding.

Institutional Review Board Statement

The research was conducted in compliance with our department hospital’s highest ethical standards, national guidelines, and the Helsinki Declaration. All protocols for the study were approved by the Ethics Committee of Jagiellonian University Medical College (approvement number 1072.6120.267.2019) and written informed consent was obtained from each subject before enrollment.

Data Availability Statement

Not applicable.

Conflicts of Interest

The authors declare no conflict of interest. The funders had no role in the study’s design, in the collection, analyses, or interpretation of data, in the writing of the manuscript, or in the decision to publish the results.

References

  1. Huang, X.; Fan, X.; Ying, J.; Chen, S. Emerging trends and research foci in gastrointestinal microbiome. J. Transl. Med. 2019, 17, 67. [Google Scholar] [CrossRef] [PubMed]
  2. Fan, Y.; Pedersen, O. Gut microbiota in human metabolic health and disease. Nat. Rev. Microbiol. 2021, 19, 55–71. [Google Scholar] [CrossRef] [PubMed]
  3. Boccuto, L.; Tack, J.; Ianiro, G.; Abenavoli, L.; Scarpellini, E. Human Genes Involved in the Interaction between Host and Gut Microbiome: Regulation and Pathogenic Mechanisms. Genes 2023, 14, 857. [Google Scholar] [CrossRef]
  4. Sakkas, H.; Bozidis, P.; Touzios, C.; Kolios, D.; Athanasiou, G.; Athanasopoulou, E.; Gerou, I.; Gartzonika, C. Nutritional Status and the Influence of the Vegan Diet on the Gut Microbiota and Human Health. Medicina 2020, 56, 88. [Google Scholar] [CrossRef] [PubMed]
  5. Klement, R.J.; Pazienza, V. Impact of Different Types of Diet on Gut Microbiota Profiles and Cancer Prevention and Treatment. Medicina 2019, 55, 84. [Google Scholar] [CrossRef] [PubMed]
  6. Saini, A.; Dalal, P.; Sharma, D. Deciphering the interdependent labyrinth between gut microbiota and the immune system. Lett. Appl. Microbiol. 2022, 75, 1122–1135. [Google Scholar] [CrossRef]
  7. Lloyd-Price, J.; Abu-Ali, G.; Huttenhower, C. The healthy human microbiome. Genome Med. 2016, 8, 51. [Google Scholar] [CrossRef]
  8. Mentella, M.C.; Scaldaferri, F.; Pizzoferrato, M.; Gasbarrini, A.; Miggiano, G.A.D. Nutrition, IBD and Gut Microbiota: A Review. Nutrients 2020, 12, 944. [Google Scholar] [CrossRef]
  9. El-Salhy, M.; Hatlebakk, J.G.; Hausken, T. Diet in Irritable Bowel Syndrome (IBS): Interaction with Gut Microbiota and Gut Hormones. Nutrients 2019, 11, 1824. [Google Scholar] [CrossRef]
  10. Caio, G.; Lungaro, L.; Segata, N.; Guarino, M.; Zoli, G.; Volta, U.; De Giorgio, R. Effect of Gluten-Free Diet on Gut Microbiota Composition in Patients with Celiac Disease and Non-Celiac Gluten/Wheat Sensitivity. Nutrients 2020, 12, 1832. [Google Scholar] [CrossRef]
  11. Quesada-Vázquez, S.; Aragonès, G.; Del Bas, J.M.; Escoté, X. Diet, Gut Microbiota and Non-Alcoholic Fatty Liver Disease: Three Parts of the Same Axis. Cells 2020, 9, 176. [Google Scholar] [CrossRef] [PubMed]
  12. Pluta, R.; Ułamek-Kozioł, M.; Januszewski, S.; Czuczwar, S.J. Gut microbiota and pro/prebiotics in Alzheimer’s disease. Aging 2020, 12, 5539–5550. [Google Scholar] [CrossRef]
  13. Gentile, F.; Doneddu, P.E.; Riva, N.; Nobile-Orazio, E.; Quattrini, A. Diet, Microbiota and Brain Health: Unraveling the Network Intersecting Metabolism and Neurodegeneration. Int. J. Mol. Sci. 2020, 21, 7471. [Google Scholar] [CrossRef]
  14. Gubert, C.; Kong, G.; Renoir, T.; Hannan, A.J. Exercise, diet and stress as modulators of gut microbiota: Implications for neurodegenerative diseases. Neurobiol. Dis. 2020, 134, 104621. [Google Scholar] [CrossRef] [PubMed]
  15. Conte, L.; Toraldo, D.M. Targeting the gut-lung microbiota axis by means of a high-fibre diet and probiotics may have anti-inflammatory effects in COVID-19 infection. Ther. Adv. Respir. Dis. 2020, 14, 1753466620937170. [Google Scholar] [CrossRef] [PubMed]
  16. Illiano, P.; Brambilla, R.; Parolini, C. The mutual interplay of gut microbiota, diet and human disease. FEBS J. 2020, 287, 833–855. [Google Scholar] [CrossRef] [PubMed]
  17. Donald, K.; Finlay, B.B. Early-life interactions between the microbiota and immune system: Impact on immune system development and atopic disease. Nat. Rev. Immunol. 2023, 23, 735–748. [Google Scholar] [CrossRef]
  18. Salazar, N.; González, S.; Nogacka, A.M.; Rios-Covián, D.; Arboleya, S.; Gueimonde, M.; Reyes-Gavilán, C.G.L. Microbiome: Effects of Ageing and Diet. Curr. Issues Mol. Biol. 2020, 36, 33–62. [Google Scholar] [CrossRef]
  19. Alsharairi, N.A. The Role of Short-Chain Fatty Acids in Mediating Very Low-Calorie Ketogenic Diet-Infant Gut Microbiota Relationships and Its Therapeutic Potential in Obesity. Nutrients 2021, 13, 3702. [Google Scholar] [CrossRef]
  20. Redondo-Useros, N.; Nova, E.; González-Zancada, N.; Díaz, L.E.; Gómez-Martínez, S.; Marcos, A. Microbiota and Lifestyle: A Special Focus on Diet. Nutrients 2020, 12, 1776. [Google Scholar] [CrossRef]
  21. Mohr, A.E.; Jäger, R.; Carpenter, K.C.; Kerksick, C.M.; Purpura, M.; Townsend, J.R.; West, N.P.; Black, K.; Gleeson, M.; Pyne, D.B.; et al. The athletic gut microbiota. J. Int. Soc. Sports Nutr. 2020, 17, 24. [Google Scholar] [CrossRef] [PubMed]
  22. Faith, J.J.; Guruge, J.L.; Charbonneau, M.; Subramanian, S.; Seedorf, H.; Goodman, A.L.; Clemente, J.C.; Knight, R.; Heath, A.C.; Leibel, R.L.; et al. The long-term stability of the human gut microbiota. Science 2013, 341, 1237439. [Google Scholar] [CrossRef] [PubMed]
  23. Shanahan, F.; Ghosh, T.S.; O’Toole, P.W. The Healthy Microbiome-What Is the Definition of a Healthy Gut Microbiome? Gastroenterology 2021, 160, 483–494. [Google Scholar] [CrossRef] [PubMed]
  24. Integrative HMP (iHMP) Research Network Consortium. The Integrative Human Microbiome Project. Nature 2019, 569, 641–648. [Google Scholar] [CrossRef] [PubMed]
  25. Human Microbiome Project Consortium. Structure, function and diversity of the healthy human microbiome. Nature 2012, 486, 207–214. [Google Scholar] [CrossRef] [PubMed]
  26. Tuominen, H.; Rautava, J. Oral Microbiota and Cancer Development. Pathobiology 2021, 88, 116–126. [Google Scholar] [CrossRef]
  27. Dewhirst, F.E.; Chen, T.; Izard, J.; Paster, B.J.; Tanner, A.C.; Yu, W.H.; Lakshmanan, A.; Wade, W.G. The human oral microbiome. J. Bacteriol. 2010, 192, 5002–5017. [Google Scholar] [CrossRef]
  28. Zapała, B.; Stefura, T.; Milewicz, T.; Wątor, J.; Piwowar, M.; Wójcik-Pędziwiatr, M.; Doręgowska, M.; Dudek, A.; Jania, Z.; Rudzińska-Bar, M. The Role of the Western Diet and Oral Microbiota in Parkinson’s Disease. Nutrients 2022, 14, 355. [Google Scholar] [CrossRef]
  29. Wade, W.G. The oral microbiome in health and disease. Pharmacol. Res. 2013, 69, 137–143. [Google Scholar] [CrossRef]
  30. Rinninella, E.; Raoul, P.; Cintoni, M.; Franceschi, F.; Miggiano, G.A.D.; Gasbarrini, A.; Mele, M.C. What is the Healthy Gut Microbiota Composition? A Changing Ecosystem across Age, Environment, Diet, and Diseases. Microorganisms 2019, 7, 14. [Google Scholar] [CrossRef]
  31. Xie, H.; Guo, R.; Zhong, H.; Feng, Q.; Lan, Z.; Qin, B.; Ward, K.J.; Jackson, M.A.; Xia, Y.; Chen, X.; et al. Shotgun Metagenomics of 250 Adult Twins Reveals Genetic and Environmental Impacts on the Gut Microbiome. Cell Syst. 2016, 3, 572–584.e3. [Google Scholar] [CrossRef] [PubMed]
  32. Cao, C.; Xiao, Z.; Wu, Y.; Ge, C. Diet and Skin Aging-From the Perspective of Food Nutrition. Nutrients 2020, 12, 870. [Google Scholar] [CrossRef] [PubMed]
  33. Singh, R.K.; Chang, H.W.; Yan, D.; Lee, K.M.; Ucmak, D.; Wong, K.; Abrouk, M.; Farahnik, B.; Nakamura, M.; Zhu, T.H.; et al. Influence of diet on the gut microbiome and implications for human health. J. Transl. Med. 2017, 15, 73. [Google Scholar] [CrossRef]
  34. Ponzo, V.; Fedele, D.; Goitre, I.; Leone, F.; Lezo, A.; Monzeglio, C.; Finocchiaro, C.; Ghigo, E.; Bo, S. Diet-Gut Microbiota Interactions and Gestational Diabetes Mellitus (GDM). Nutrients 2019, 11, 330. [Google Scholar] [CrossRef] [PubMed]
  35. Christ, A.; Lauterbach, M.; Latz, E. Western Diet and the Immune System: An Inflammatory Connection. Immunity 2019, 51, 794–811. [Google Scholar] [CrossRef]
  36. Malinowska, A.M.; Kok, D.E.; Steegenga, W.T.; Hooiveld, G.J.E.J.; Chmurzynska, A. Human gut microbiota composition and its predicted functional properties in people with western and healthy dietary patterns. Eur. J. Nutr. 2022, 61, 3887–3903. [Google Scholar] [CrossRef]
  37. Paoli, A.; Mancin, L.; Bianco, A.; Thomas, E.; Mota, J.F.; Piccini, F. Ketogenic Diet and Microbiota: Friends or Enemies? Genes 2019, 10, 534. [Google Scholar] [CrossRef]
  38. Bibbò, S.; Ianiro, G.; Giorgio, V.; Scaldaferri, F.; Masucci, L.; Gasbarrini, A.; Cammarota, G. The role of diet on gut microbiota composition. Eur. Rev. Med. Pharmacol. Sci. 2016, 20, 4742–4749. [Google Scholar]
  39. Bourdeau-Julien, I.; Castonguay-Paradis, S.; Rochefort, G.; Perron, J.; Lamarche, B.; Flamand, N.; Di Marzo, V.; Veilleux, A.; Raymond, F. The diet rapidly and differentially affects the gut microbiota and host lipid mediators in a healthy population. Microbiome 2023, 11, 26. [Google Scholar] [CrossRef]
  40. Agans, R.; Gordon, A.; Kramer, D.L.; Perez-Burillo, S.; Rufián-Henares, J.A.; Paliy, O. Dietary Fatty Acids Sustain the Growth of the Human Gut Microbiota. Appl. Environ. Microbiol. 2018, 84, e01525-18. [Google Scholar] [CrossRef]
  41. Vinelli, V.; Biscotti, P.; Martini, D.; Del Bo, C.; Marino, M.; Meroño, T.; Nikoloudaki, O.; Calabrese, F.M.; Turroni, S.; Taverniti, V.; et al. Effects of Dietary Fibers on Short-Chain Fatty Acids and Gut Microbiota Composition in Healthy Adults: A Systematic Review. Nutrients 2022, 14, 2559. [Google Scholar] [CrossRef] [PubMed]
  42. Tomasello, G.; Mazzola, M.; Leone, A.; Sinagra, E.; Zummo, G.; Farina, F.; Damiani, P.; Cappello, F.; Gerges Geagea, A.; Jurjus, A.; et al. Nutrition, oxidative stress and intestinal dysbiosis: Influence of diet on gut microbiota in inflammatory bowel diseases. Biomed. Pap. Med. Fac. Univ. Palacky Olomouc Czech Repub. 2016, 160, 461–466. [Google Scholar] [CrossRef] [PubMed]
  43. Moszak, M.; Szulińska, M.; Bogdański, P. You Are What You Eat-The Relationship between Diet, Microbiota, and Metabolic Disorders-A Review. Nutrients 2020, 12, 1096. [Google Scholar] [CrossRef] [PubMed]
  44. Bull, M.J.; Plummer, N.T. Part 1: The Human Gut Microbiome in Health and Disease. Integr. Med. (Encinitas). 2014, 13, 17–22. [Google Scholar] [PubMed]
  45. Ranjan, R.; Rani, A.; Metwally, A.; McGee, H.S.; Perkins, D.L. Analysis of the microbiome: Advantages of whole genome shotgun versus 16S amplicon sequencing. Biochem. Biophys. Res. Commun. 2016, 469, 967–977. [Google Scholar] [CrossRef]
  46. Jeżewska-Zychowicz, M.; Gawęcki, J.; Wądołowska, L. I wsp. KomPAN® Kwestionariusz do Badania Poglądów i Zwyczajów Żywieniowych dla osób w Wieku od 16 do 65 lat, Wersja 1.2—Kwestionariusz do Samodzielnego Wypełnienia Przez Respondenta. Rozdz. 2. In KomPAN® Kwestionariusz do Badania Poglądów i Zwyczajów Żywieniowych Oraz Procedura Opracowania Danych; Red Gawęcki, J., Ed.; Komitetu Nauki o Żywieniu Człowieka Polskiej Akademii Nauk: Warszawa, Poland, 2020; pp. 22–34. Available online: http://www.knozc.pan.pl/ (accessed on 15 October 2023).
  47. Wądołowska, L.; Krusińska, B. Procedura Opracowania Danych Żywieniowych z Kwestionariusza KomPAN. Rozdz. 3. In Kwestionariusz do Badania Poglądów i Zwyczajów Żywieniowych Oraz Procedura Opracowania Danych; Red Gawęcki, J., Ed.; Komitetu Nauki o Żywieniu Człowieka Polskiej Akademii Nauk: Warszawa, Poland, 2014; pp. 34–51. Available online: http://www.knozc.pan.pl/ (accessed on 15 October 2023).
  48. Kowalkowska, J.; Wadolowska, L.; Czarnocinska, J.; Czlapka-Matyasik, M.; Galinski, G.; Jezewska-Zychowicz, M.; Bronkowska, M.; Dlugosz, A.; Loboda, D.; Wyka, J. Reproducibility of a Questionnaire for Dietary Habits, Lifestyle and Nutrition Knowledge Assessment (KomPAN) in Polish Adolescents and Adults. Nutrients 2018, 10, 1845. [Google Scholar] [CrossRef]
  49. Herbowski, P.; Lorkiewicz-Muszyńska, D. Rola ekspertyzy antropologicznej podczas weryfikacji wyników okazania osób. Probl. Kryminal. 2017, 297, 5–13. [Google Scholar]
  50. Klindworth, A.; Pruesse, E.; Schweer, T.; Peplies, J.; Quast, C.; Horn, M.; Glöckner, F.O. Evaluation of general 16S ribosomal RNA gene PCR primers for classical and next-generation sequencing-based diversity studies. Nucleic Acids Res. 2013, 41, e1. [Google Scholar] [CrossRef]
  51. Wang, Q.; Garrity, G.M.; Tiedje, J.M.; Cole, J.R. Naive Bayesian classifier for rapid assignment of rRNA sequences into the new bacterial taxonomy. Appl. Environ. Microbiol. 2007, 73, 5261–5267. [Google Scholar] [CrossRef]
  52. Good, I.J. The population frequencies of species and the estimation of population parameters. Biometrika 1953, 40, 237–264. [Google Scholar] [CrossRef]
  53. Schwenger, K.J.; Clermont-Dejean, N.; Allard, J.P. The role of the gut microbiome in chronic liver disease: The clinical evidence revised. JHEP Rep. 2019, 1, 214–226. [Google Scholar] [CrossRef] [PubMed]
  54. Dhar, D.; Mohanty, A. Gut microbiota and COVID-19- possible link and implications. Virus Res. 2020, 285, 198018. [Google Scholar] [CrossRef] [PubMed]
  55. Jandhyala, S.M.; Talukdar, R.; Subramanyam, C.; Vuyyuru, H.; Sasikala, M.; Nageshwar Reddy, D. Role of the normal gut microbiota. World J. Gastroenterol. 2015, 21, 8787–8803. [Google Scholar] [CrossRef] [PubMed]
  56. O’Keefe, S.J.; Chung, D.; Mahmoud, N.; Sepulveda, A.R.; Manafe, M.; Arch, J.; Adada, H.; van der Merwe, T. Why do African Americans get more colon cancer than Native Africans? J. Nutr. 2007, 137 (Suppl. 1), 175S–182S. [Google Scholar] [CrossRef] [PubMed]
  57. Ou, J.; Carbonero, F.; Zoetendal, E.G.; DeLany, J.P.; Wang, M.; Newton, K.; Gaskins, H.R.; O’Keefe, S.J. Diet, microbiota, and microbial metabolites in colon cancer risk in rural Africans and African Americans. Am. J. Clin. Nutr. 2013, 98, 111–120. [Google Scholar] [CrossRef]
  58. Gomez, A.; Petrzelkova, K.J.; Burns, M.B.; Yeoman, C.J.; Amato, K.R.; Vlckova, K.; Modry, D.; Todd, A.; Jost Robinson, C.A.; Remis, M.J.; et al. Gut Microbiome of Coexisting BaAka Pygmies and Bantu Reflects Gradients of Traditional Subsistence Patterns. Cell Rep. 2016, 14, 2142–2153. [Google Scholar] [CrossRef]
  59. Schnorr, S.L.; Candela, M.; Rampelli, S.; Centanni, M.; Consolandi, C.; Basaglia, G.; Turroni, S.; Biagi, E.; Peano, C.; Severgnini, M.; et al. Gut microbiome of the Hadza hunter-gatherers. Nat. Commun. 2014, 5, 3654. [Google Scholar] [CrossRef]
  60. Obregon-Tito, A.J.; Tito, R.Y.; Metcalf, J.; Sankaranarayanan, K.; Clemente, J.C.; Ursell, L.K.; Zech Xu, Z.; Van Treuren, W.; Knight, R.; Gaffney, P.M.; et al. Subsistence strategies in traditional societies distinguish gut microbiomes. Nat. Commun. 2015, 6, 6505. [Google Scholar] [CrossRef]
  61. Wang, P.; Ding, S.; Sun, L.; Feng, Y.; Guo, K.; Zhu, Y.; Huang, D.; Ruan, S. Characteristics and differences of gut microbiota in patients with different Traditional Chinese Medicine Syndromes of Colorectal Cancer and normal population. J. Cancer 2020, 11, 7357–7367. [Google Scholar] [CrossRef]
  62. Gao, L.; Xu, T.; Huang, G.; Jiang, S.; Gu, Y.; Chen, F. Oral microbiomes: More and more importance in oral cavity and whole body. Protein Cell. 2018, 9, 488–500. [Google Scholar] [CrossRef]
  63. Cresci, G.A.; Bawden, E. Gut Microbiome: What We Do and Don’t Know. Nutr. Clin. Pract. 2015, 30, 734–746. [Google Scholar] [CrossRef] [PubMed]
  64. Davis, E.C.; Dinsmoor, A.M.; Wang, M.; Donovan, S.M. Microbiome Composition in Pediatric Populations from Birth to Adolescence: Impact of Diet and Prebiotic and Probiotic Interventions. Dig. Dis. Sci. 2020, 65, 706–722. [Google Scholar] [CrossRef] [PubMed]
  65. Cani, P.D.; Van Hul, M. Mediterranean diet, gut microbiota and health: When age and calories do not add up! Gut 2020, 69, 1167–1168. [Google Scholar] [CrossRef] [PubMed]
  66. Hills, R.D., Jr.; Pontefract, B.A.; Mishcon, H.R.; Black, C.A.; Sutton, S.C.; Theberge, C.R. Gut Microbiome: Profound Implications for Diet and Disease. Nutrients 2019, 11, 1613. [Google Scholar] [CrossRef]
  67. Rinninella, E.; Cintoni, M.; Raoul, P.; Lopetuso, L.R.; Scaldaferri, F.; Pulcini, G.; Miggiano, G.A.D.; Gasbarrini, A.; Mele, M.C. Food Components and Dietary Habits: Keys for a Healthy Gut Microbiota Composition. Nutrients 2019, 11, 2393. [Google Scholar] [CrossRef]
  68. Krishnan, K.; Chen, T.; Paster, B.J. A practical guide to the oral microbiome and its relation to health and disease. Oral Dis. 2017, 23, 276–286. [Google Scholar] [CrossRef]
  69. Keshavarz Azizi Raftar, S.; Hoseini Tavassol, Z.; Amiri, M.; Ejtahed, H.S.; Zangeneh, M.; Sadeghi, S.; Ashrafian, F.; Kariman, A.; Khatami, S.; Siadat, S.D. Assessment of fecal Akkermansia muciniphila in patients with osteoporosis and osteopenia: A pilot study. J. Diabetes Metab. Disord. 2021, 20, 279–284. [Google Scholar] [CrossRef]
  70. de Moraes, A.C.; Fernandes, G.R.; da Silva, I.T.; Almeida-Pititto, B.; Gomes, E.P.; Pereira, A.D.; Ferreira, S.R. Enterotype May Drive the Dietary-Associated Cardiometabolic Risk Factors. Front. Cell Infect. Microbiol. 2017, 7, 47. [Google Scholar] [CrossRef]
  71. Chang, Y.; Woo, H.G.; Jeong, J.H.; Kim, G.H.; Park, K.D.; Song, T.J. Microbiota dysbiosis and functional outcome in acute ischemic stroke patients. Sci. Rep. 2021, 11, 10977. [Google Scholar] [CrossRef]
  72. Li, N.; Wang, X.; Sun, C.; Wu, X.; Lu, M.; Si, Y.; Ye, X.; Wang, T.; Yu, X.; Zhao, X.; et al. Change of intestinal microbiota in cerebral ischemic stroke patients. BMC Microbiol. 2019, 19, 191. [Google Scholar] [CrossRef]
  73. Li, X.; Li, Z.; He, Y.; Li, P.; Zhou, H.; Zeng, N. Regional distribution of Christensenellaceae and its associations with metabolic syndrome based on a population-level analysis. PeerJ 2020, 8, e9591. [Google Scholar] [CrossRef] [PubMed]
  74. Brooks, A.W.; Priya, S.; Blekhman, R.; Bordenstein, S.R. Gut microbiota diversity across ethnicities in the United States. PLoS Biol. 2018, 16, e2006842. [Google Scholar] [CrossRef] [PubMed]
  75. Wallis, K.F.; Melnyk, S.B.; Miousse, I.R. Sex-Specific Effects of Dietary Methionine Restriction on the Intestinal Microbiome. Nutrients 2020, 12, 781. [Google Scholar] [CrossRef] [PubMed]
  76. Yurkovetskiy, L.; Burrows, M.; Khan, A.A.; Graham, L.; Volchkov, P.; Becker, L.; Antonopoulos, D.; Umesaki, Y.; Chervonsky, A.V. Gender bias in autoimmunity is influenced by microbiota. Immunity 2013, 39, 400–412. [Google Scholar] [CrossRef]
  77. Markle, J.G.; Frank, D.N.; Mortin-Toth, S.; Robertson, C.E.; Feazel, L.M.; Rolle-Kampczyk, U.; von Bergen, M.; McCoy, K.D.; Macpherson, A.J.; Danska, J.S. Sex differences in the gut microbiome drive hormone-dependent regulation of autoimmunity. Science 2013, 339, 1084–1088. [Google Scholar] [CrossRef]
  78. Org, E.; Mehrabian, M.; Parks, B.W.; Shipkova, P.; Liu, X.; Drake, T.A.; Lusis, A.J. Sex differences and hormonal effects on gut microbiota composition in mice. Gut Microbes 2016, 7, 313–322. [Google Scholar] [CrossRef]
  79. Fushuku, S.; Fukuda, K. Gender difference in the composition of fecal flora in laboratory mice, as detected by denaturing gradient gel electrophoresis (DGGE). Exp. Anim. 2008, 57, 489–493. [Google Scholar] [CrossRef]
  80. Elderman, M.; Hugenholtz, F.; Belzer, C.; Boekschoten, M.; van Beek, A.; de Haan, B.; Savelkoul, H.; de Vos, P.; Faas, M. Sex and strain dependent differences in mucosal immunology and microbiota composition in mice. Biol. Sex Differ. 2018, 9, 26. [Google Scholar] [CrossRef]
  81. Fransen, F.; van Beek, A.A.; Borghuis, T.; Meijer, B.; Hugenholtz, F.; van der Gaast-de Jongh, C.; Savelkoul, H.F.; de Jonge, M.I.; Faas, M.M.; Boekschoten, M.V.; et al. The impact of gut microbiota on gender-specific differences in immunity. Front. Immunol. 2017, 8, 754. [Google Scholar] [CrossRef]
  82. Mueller, S.; Saunier, K.; Hanisch, C.; Norin, E.; Alm, L.; Midtvedt, T.; Cresci, A.; Silvi, S.; Orpianesi, C.; Verdenelli, M.C.; et al. Differences in fecal microbiota in different European study populations in relation to age, gender, and country: A cross-sectional study. Appl. Environ. Microbiol. 2006, 72, 1027–1033. [Google Scholar] [CrossRef]
  83. Li, M.; Wang, B.; Zhang, M.; Rantalainen, M.; Wang, S.; Zhou, H.; Zhang, Y.; Shen, J.; Pang, X.; Zhang, M.; et al. Symbiotic gut microbes modulate human metabolic phenotypes. Proc. Natl. Acad. Sci. USA 2008, 105, 2117–2122. [Google Scholar] [CrossRef] [PubMed]
  84. Ding, T.; Schloss, P.D. Dynamics and associations of microbial community types across the human body. Nature 2014, 509, 357–360. [Google Scholar] [CrossRef] [PubMed]
  85. Dominianni, C.; Sinha, R.; Goedert, J.J.; Pei, Z.; Yang, L.; Hayes, R.B.; Ahn, J. Sex, body mass index, and dietary fiber intake influence the human gut microbiome. PLoS ONE 2015, 10, e0124599. [Google Scholar] [CrossRef] [PubMed]
  86. Singh, P.; Manning, S.D. Impact of age and sex on the composition and abundance of the intestinal microbiota in individuals with and without enteric infections. Ann. Epidemiol. 2016, 26, 380–385. [Google Scholar] [CrossRef]
  87. Haro, C.; Rangel-Zúñiga, O.A.; Alcalá-Díaz, J.F.; Gómez-Delgado, F.; Pérez-Martínez, P.; Delgado-Lista, J.; Quintana-Navarro, G.M.; Landa, B.B.; Navas-Cortés, J.A.; Tena-Sempere, M.; et al. Intestinal microbiota is influenced by gender and body mass index. PLoS ONE 2016, 11, e0154090. [Google Scholar] [CrossRef]
  88. Borgo, F.; Garbossa, S.; Riva, A.; Severgnini, M.; Luigiano, C.; Benetti, A.; Pontiroli, A.E.; Morace, G.; Borghi, E. Body mass index and sex affect diverse microbial niches within the gut. Front. Microbiol. 2018, 9, 213. [Google Scholar] [CrossRef]
  89. Gao, X.; Zhang, M.; Xue, J.; Huang, J.; Zhuang, R.; Zhou, X.; Zhang, H.; Fu, Q.; Hao, Y. Body mass index differences in the gut microbiota are gender specific. Front. Microbiol. 2018, 9, 1250. [Google Scholar] [CrossRef]
  90. Takagi, T.; Naito, Y.; Inoue, R.; Kashiwagi, S.; Uchiyama, K.; Mizushima, K.; Tsuchiya, S.; Dohi, O.; Yoshida, N.; Kamada, K.; et al. Differences in gut microbiota associated with age, sex, and stool consistency in healthy Japanese subjects. J. Gastroenterol. 2019, 54, 53–63. [Google Scholar] [CrossRef]
  91. Sinha, T.; Vich Vila, A.; Garmaeva, S.; Jankipersadsing, S.A.; Imhann, F.; Collij, V.; Bonder, M.J.; Jiang, X.; Gurry, T.; Alm, E.J.; et al. Analysis of 1135 gut metagenomes identifies sex-specific resistome profiles. Gut Microbes 2019, 10, 358–366. [Google Scholar] [CrossRef]
Figure 1. Beta diversity in the gut microbiota of males (Gut_M) and females (Gut_F): p < 0.048 (n = 144). High/Mid/Low values are related to the median.
Diversity 15 01103 g001
Figure 2. The wealth of bacteria groups that produce lactic acids as a result of fermentation in the gut microbiota of males (Gut_M, green color) and females (Gut_F, blue color) (n = 144).
Diversity 15 01103 g002
Figure 3. The wealth of bacteria groups that produce lactic acids as a result of fermentation in the oral microbiota of males (Oral_M, green color) and females (Oral_F, blue color) (n = 144).
Diversity 15 01103 g003
Figure 4. Taxonomic relative abundance of Akkermansia in the gut microbiota of males (Gut_M, green color) and females (Gut_F, blue color): p = 0.030 (n = 144).
Diversity 15 01103 g004
Figure 5. Taxonomic relative abundance of Christensenellaceae in the gut microbiota of males (Gut_M, green color) and females (Gut_F, blue color): p = 0.029 (n = 144).
Diversity 15 01103 g005
Figure 6. Taxonomic relative abundance of Ruminococcaceae in the gut microbiota of males (Gut_M, green color) and females (Gut_F, blue color): p = 0.033 (n = 144).
Diversity 15 01103 g006
Figure 7. Characteristics of microbiota profiles in the gut of males and females (n = 144).
Diversity 15 01103 g007
Figure 8. LEfSe identification of the most differentially abundant species between males-M (blue bars) and females-K (red bars) in the gut of healthy study participants. Figure shows taxa at species level with significant differences that have an LDA score larger than the threshold value of 3.5.
Diversity 15 01103 g008
Figure 9. Characteristics of microbiota profiles in the oral cavity of males and females (n = 144).
Diversity 15 01103 g009
Figure 10. LEfSe identification of the most differentially abundant species between males-M (blue bars) and females-K (red bars) in the oral cavity of healthy study participants. Figure shows taxa at species level with significant differences that have an LDA score larger than the threshold value of 3.5.
Diversity 15 01103 g010
Table 1. BMI classification for adults [49].
BMI [kg/m2]BMI Interpretation
<16.00Underweight (Severe thinness)
16.00–16.99Underweight (Moderate thinness)
17.00–18.49Underweight (Mild thinness)
18.50–24.99Normal range
25.00–29.99Overweight (Pre-obese)
30.00–34.99Obese (Class I)
35.00–39.99Obese (Class II)
≥40.00Obese (Class III)
Table 2. The characteristics of the study participants (n = 144).
MSDMinMaxQ1MeQ3
Age (years)39.9010.5122.0056.0031.5040.5047.75
Weight (kg)64.1013.0447.0096.0055.7559.5067.75
Height (m)1.670.101.551.861.591.651.76
BMI (kg/m2)22.732.8018.0028.0021.0022.0025.00
M—mean; SD—standard deviation; Min—minimum; Max—maximum; Q—quartile; Me—median.
Table 3. Lifestyle and diet characteristics of the subjects (n = 144).
QuestionOption 1
and Response Percentage
Option 2
and Response Percentage
Option 3
and Response Percentage
EducationUniversity—77%Secondary—23%-
Place of residenceCity—82%Countryside—18%-
Physical activity at workLittle—100%--
Leisure time physical activityLittle—59%Moderate—27%High—14%
Following a specific dietNo—100%--
Smoking statusNon-smoker—100%--
Self-assessment of health in comparison with peersSame as peers—80%Better than peers—20%-
The number of meals during the dayThree meals—43%Four meals—41%Five meals—16%
Eating meals at regular timesYes, but only some of them—77%No—23%-
Frequency of consumption of white breadSeveral times a day—57%Once a week—23%Once a day—20%
Frequency of consumption of whole meal bread1–3 times a month—45%Once a day—30%Once a week—25%
Frequency of consumption of refined grain productsSeveral times a week—55%Once a week—27%1–3 times a month—18%
Frequency of consumption of whole grain products1–3 times a month—70%Several times a week—30%-
Frequency of consumption of cottage cheese1–3 times a month—50%Once a week—32%Several times a week—18%
Frequency of consumption of cheeseSeveral times a week—52%1–3 times a month—25%Once a day—23%
Frequency of consumption of ready-to-eat meat productsSeveral times a week—57%Once a day—25%1–3 times a month—18%
Frequency of consumption of red meatOnce a week—59%Several times a week—21%1–3 times a month—20%
Frequency of consumption of white meatSeveral times a week—77%1–3 times a month—23%-
Frequency of consumption of fishOnce a week—52%1–3 times a month—48%-
Frequency of consumption of eggOnce a week—52%Several times a week—25%1–3 times a month—23%
Frequency of consumption of legumes1–3 times a month—100%--
Frequency of consumption of fruitSeveral times a week—59%Once a day—21%Several times a day—20%
Frequency of consumption of vegetableSeveral times a day—50%Once a day—39%Once a week—11%
Salting ready mealsNo—68%Yes, but only sometimes—32%-
The type of frying fat usedPlant oil—100%--
Type of milk consumedWith reduced fat content—100%--
Frequency of consumption of fermented milk drinksSeveral times a week—80%Once a day—20%-
Sweetening hot beveragesYes, one teaspoon of sugar or honey—64%No—36%-
Frequency of drinking waterSeveral times a day—100%--
Table 4. Run parameters’ characteristics.
Stool SamplesOral Swabs
Total read counts3,230,1991,345,530
Average counts per sample78,78531,291
Maximum counts per sample110,58953,060
Minimum counts per sample48,6735433
Table 5. Alpha diversity according to various indices in the gut and oral microbiota of males and females (n = 144).
Indicatorp-Value (Gut Microbiota)p-Value (Oral Microbiota)
ACE0.5590.492
Chao10.7110.507
Shannon0.1560.645
Simpson0.1240.937
Phylogenetic Diversity0.1270.796
Disclaimer/Publisher’s Note: The statements, opinions and data contained in all publications are solely those of the individual author(s) and contributor(s) and not of MDPI and/or the editor(s). MDPI and/or the editor(s) disclaim responsibility for any injury to people or property resulting from any ideas, methods, instructions or products referred to in the content.

