Article

Genetic Variation in Gaultheria nummularioides (Ericaceae: Gaultherieae) from the Sky Islands of the Himalaya-Hengduan Mountains

1
Yunnan Key Laboratory of Pharmacology for Natural Products, School of Pharmaceutical Sciences, Kunming Medical University, Kunming 650500, China
2
State Key Laboratory of Natural and Biomimetic Drugs, School of Pharmaceutical Sciences, Peking University, No. 38 Xueyuan Road, Beijing 100191, China
3
Botanical Research Institute of Texas, 1700 University Drive, Fort Worth, TX 76107, USA
*
Authors to whom correspondence should be addressed.
Diversity 2022, 14(8), 652; https://doi.org/10.3390/d14080652
Submission received: 5 July 2022 / Revised: 1 August 2022 / Accepted: 1 August 2022 / Published: 12 August 2022

Abstract

:
Species diversity is high in the Himalaya-Hengduan Mountains, particularly at the edges characterized by deep ravines and “sky islands”. Studies focused on sky-island species are sparse and the patterns observed in response to both geographic and climatic factors are inconsistent. Here phylogeographic and phylogenetic analyses of Gaultheria nummularioides, a species originating in the late Pliocene with its main distribution in the Himalaya-Hengduan Mountains, were conducted to reveal the pattern of genetic dynamics in response to physical geography, glacial fluctuations, and monsoons. We found that in this species genetic variation is higher among populations than within populations, with a significant phylogeographic boundary between the central Himalaya and the eastern Himalaya and the Hengduan Mountains. We also found a high incidence of private alleles, possibly associated with strong habitat isolation. The phylogeographic pattern recovered is consistent with populations in glacial refugia that have experienced expansion after glaciation. The divergence times of most haplotypes coincide with the time of the weakening of the Asian monsoon in these regions. Models of geographic range size showed a significant decrease from the Last Interglacial through the Last Glacial Maximum to the Current, and a predicted increase from the Current to the year 2070. Our study provides insights for understanding speciation among sky islands in this region.

1. Introduction

The term “sky islands” was proposed by Heald [1] for depicting the Arizona Mountains in the United States but now refers generally to high-elevation habitats among continental mountains that are geographically isolated from each other. Through the heterogeneity of climate and habitats at different elevations resulting in isolation, sky islands within a region are expected to harbor populations with distinctive morphologies and genetic structure [2]. Approximately 20 mountain areas around the world are regarded as sky islands, mostly comprising biodiversity hotspots [3], including the Rocky Mountains, the Great Basin, the Himalaya, and the Altai-Tianshan region in northwestern China [4]. In Southwest China, the sky islands in the Himalaya at the eastern edge of the Qinghai-Tibet Plateau, including the adjacent Hengduan Mountains, were recognized together as the Himalaya-Hengduan Mountains. These mountains are characterized by deep ravines or steep river valleys, in contrast to the rolling mountains, lake basins, and broad valleys of narrow amplitude on the planation surface of the plateau. Studying this region can facilitate understanding of the influence of geographic, climatic, and biological factors in promoting species differentiation and the generation of biodiversity in sky-island regions [2,5].
The application of phylogeographic methods is critical for understanding species evolution and biogeographic history [6]. Phylogeographic boundaries supporting high levels of genetic differentiation have been commonly reported in groups with island-like population genetic structure in the Himalaya-Hengduan Mountains [7,8,9], such as the Tanaka-Kaiyong Line (TKL), an important floristic boundary between the Sino-Japanese region to the east and the Sino-Himalayan region to the west [10], and the Ward Line-Mekong-Salween Divide (MSD), an important floristic boundary between the eastern Himalaya and the Hengduan Mountains [8]. Whereas previous phylogeographic studies have mainly focused on the species with a distribution on the main planation surface of the Qinghai-Tibet Plateau (e.g., Juniperus przewalskii Komarov [11]; Pedicularis longiflora Rudolph [12]; Meconopsis integrifolia (Maxim.) Franch. [13]; Primula tibetica G. Watt [14]; Parasyncalathium souliei (Franch.) J.W. Zhang, Boufford & H. Sun [15]; Quercus aquifolioides Rehder & E.H. Wilson [16]), less work [9] has been conducted on the species limited to the deep ravines or steep river valleys within the Himalaya-Hengduan Mountains, and knowledge of their evolutionary histories and patterns of genetic isolation is still poor.
Gaultheria nummularioides D. Don is a tetraploid prostrate shrublet in the tribe Gaultherieae of the family Ericaceae [17,18,19], with a geographic distribution from the Himalaya-Hengduan Mountains through the Isthmus of Kra to Malesia. The distinct morphological characters of G. nummularioides relative to other Asian species of Gaultheria prompted placement in the monotypic series Nummularioideae Airy Shaw in section Monoanthemona D.J. Middleton, which also included G. ser. Antipodae D.J. Middleton from New Zealand and G. ser. Myrtilloideae D.J. Middleton from South America in the most recent classification of Gaultheria based on morphology [20], but was later found with DNA sequence data to be phylogenetically nested within the Leucothoides s.l. clade [21]. This species has a typical sky-island distribution limited to the deep ravines or steep river valleys of the Himalaya-Hengduan Mountains and the edges of volcanic craters in Malesia (usually above tree line), with elevations ranging from 1700 m to 3900 m [17,22,23]. It is the most widespread species among the ca. 47 species within the Leucothoides s.l. clade (i.e., 21 species endemic to Malesia and 27 endemic to the Himalaya-Hengduan Mountains with two of the latter extending to Peninsular Malaysia), and evolved early within the clade [23]. Previous studies have found that the species exhibits high variation both morphologically and genetically [20,22,23]. As such, it has the potential to provide insights into understanding the patterns of genetic differentiation among the peaks comprising its sky-island habitat.
Wide variation in leaf shape, indumentum, and flowers has resulted in the recognition of several varieties within Gaultheria nummularioides (Figure 1). Populations within this species can vary in leaf blade shape (ovate, subrhombic, or orbicular) and size (ranging from 0.6 to 2.1 cm long), together forming the basis of two varieties, i.e., G. nummularioides var. elliptica Rehder & E.H. Wilson and G. nummularioides var. microphylla C.Y. Wu & T.Z. Hsu, although these were later not recognized as taxa [22,24]. In addition, populations can vary in the indumentum of branchlets and leaves (sparsely or densely piliferous), and corolla color and shape (white to deep red, narrowly or broadly urceolate) [22,24]. The population from Tengchong County (Baoshan, China) has orbicular large (almost > 2 cm long) leaf blades, in contrast to most others with ovate leaf blades ≤ 1 cm long; a population from Yadong County (Shigatse, China) is densely piliferous on stems and leaves abaxially with bristly serrate leaf margins, in contrast to most others, which are sparsely piliferous on these organs; and populations from Luding County (Tibetan Autonomous Prefecture of Garzê, China) and Gongshan County (Nujiang of the Lisu Autonomous Prefecture, China) have white narrowly urceolate corollas, in contrast to the whitish red to deep red broadly urceolate corollas of most others (Figure 1).
The sky-island distribution of this species may be associated with genetic diversity and distinct evolutionary processes. Based on seven samples of Gaultheria nummularioides from the Himalaya-Hengduan Mountains, Lu et al. [23] found that both ITS and chloroplast genes show substantial infraspecific nucleotide diversity. A strong phylogenetic break found among the samples of G. nummularioides in that study appears to be correlated with the southernmost extension of the Hengduan Mountains in China and central Yunnan Province and western Sichuan Province, China. However, low sampling across geographic space in the study limited conclusions regarding the relationship among morphological variation, genetic differentiation, and geographic distribution.
Another factor to consider in the pattern of genetic differentiation of Gaultheria nummularioides is gene flow, which may be reduced or absent among populations on geographically isolated islands through selection or genetic drift [25,26,27]. Pleistocene glacial cycles and monsoons have profoundly affected montane sky-island species distributions, genetic diversification, and demography (e.g., Sedum lanceolatum Torr. [28]). Species could shift, expand, or contract along elevational gradients arising from a change in climatic conditions [29,30]. The landscape is another important factor [31,32]. Although there is evidence that some subnival seed plants of the Himalaya-Hengduan Mountains exhibit island-like population genetic structures [7,8,9], more phylogeographic studies of subnival sky-island plant species are needed for a comprehensive understanding of the biogeographical history of this flora and the effects of geological events on species genetic architecture [7].
Here we sampled 273 individuals in 19 populations of Gaultheria nummularioides from the Himalaya-Hengduan Mountains for DNA sequence variation from the plastid genome to test the putative effects of Pleistocene glaciation and monsoons on patterns of variation within and among populations. Specifically, we address the following questions: (1) could any phylogeographic boundary within the populations of G. nummularioides be detected, and is any such boundary associated with floristic boundaries? (2) Are patterns of haplotype variation and divergence correlated with Pleistocene glacial cycle-induced climatic shifts and monsoons in montane habitats? (3) Is morphological variation correlated with patterns of chloroplast haplotype variation?

2. Materials and Methods

2.1. Taxon Sampling

Gaultheria nummularioides has a distribution in the Himalaya-Hengduan Mountains and Malesia. We excluded those from Malesia because: (1) our topic mainly focused on the genetic variation and structure among the series of sky islands in the core distribution range for a species, as in Wiens et al. [33] (the Madrean Sky Islands of southeastern Arizona) and Hirao et al. [34] (isolated mountain peaks in Japan); and (2) Malesian populations, although currently considered part of G. nummularioides, were once treated as a distinct species, i.e., Gaultheria repens Blume. Although G. repens is currently placed as a synonym of G. nummularioides, our personal observations and the observations of Sleumer [35] lead us to consider that it may be better recognized as a distinct taxon at the varietal or species level, as based on differences in leaf texture, floral characters, and the presence of aromatic oil.
The sky islands in the Himalaya-Hengduan Mountains are mostly located in Southwest China, with a small proportion of border areas in Nepal, Bhutan, India, and Myanmar. We therefore focused on collecting representative populations on mountain peaks in China. Within China, we covered the range of both geographic and morphological variation, sampling populations from the montane areas of Yunnan, Sichuan, and Tibet (Table S1), and longitudinally covering the distribution of this species within the Himalaya-Hengduan Mountains, including the central Himalaya (CH) and eastern Himalaya (EH) and both the western Hengduan Mountains (WHM) and eastern Hengduan Mountains (EHM). According to the sampling statistics based on the Chinese Virtual Herbarium (CVH, http://www.cvh.ac.cn/ (accessed on 15 March 2022)), which stores information of 317 specimen records of Gaultheria nummularioides in this region with locality information, our sampling covered 45% of the counties in which sky islands occur, and G. nummularioides frequently occurs in these counties, with 225 specimen records (71% of the total).
We obtained data from 273 individuals from among 19 populations (Table S1). Six populations are from the Himalaya within Tibet: four (PZL, YD, SD, and NDL) are from the central Himalaya (CH), two (DXL and MD) are from the eastern Himalaya (EH), and the remaining 13 are from the Hengduan Mountains. Ten (GS-2, DZA, GS-3, DLJ, GS, YZ, DZB, LSD, YW, and JD) are from the western Hengduan Mountains (WHM) in Yunnan and three (TQ, HLG, and BX) are from the eastern Hengduan Mountains (EHM) in Sichuan. The representatives for each population ranged from four to 15 individuals, depending on population size (Table S1). An individual of Gaultheria albiflora (Ching ex T.Z. Hsu) P.W. Fritsch & Lu Lu ((L. Lu et al. LL-2013-50, see Fritsch et al. (2015) [35]) was selected as the outgroup for the first phylogenetic tree reconstruction at the population level. The collected fresh plants were placed in plastic bags and immediately preserved with desiccant silica gel.

2.2. DNA Sequencing

The DNA of all samples was extracted and isolated from the leaves preserved in dry silica gel with the CTAB method [36,37]. The total DNA obtained was subjected to electrophoresis in 1% agarose gels and the concentration and purity of the DNA were measured by an ultraviolet spectrophotometer (Beijing Liuyi Biotechnology Co., Ltd., Lot No. WD-9403C, Beijing, China). The DNA was diluted to 30 ng/L with double-distilled water after detection.
PCRs were carried out in a final volume of 20.4 µL each containing, and comprised 9 μM double-distilled water, 10 μM 2 × Taq PCR MasterMix (TIANGEN Biotechnology Co., Ltd. (Beijing, China), Lot No. U9104), 0.4 μM of each primer, and 1 μM of DNA. Primer sets of 22 DNA regions with high variation were selected from the whole chloroplast genome of the species within Gaultheria ser. Trichophyllae Airy Shaw, the clade that is sister to the clade in which G. nummularioides belongs [38], for phylogenetic reconstruction, with one individual sampled from each population (Table S2). Two cpDNA regions (trnV-GAC and psbK-psbI) were later selected for sequencing each individual from all 19 populations for phylogeographic studies, as based on both a number of variable sites and success rates of PCR amplification (Table S2). The PCR regimen is as follows: pre-denaturation at 94 °C for 4 min, followed by 35 cycles of denaturation at 94 °C for 1 min, annealing at 52 °C for 45 s, extension at 72 °C for 1 min, and finally termination of the extension cycles at 72 °C for 10 min. The PCR products were purified with the Wizard PCR Preps DNA purification system (Promega, Madison, WI, USA) as in Lu et al. [23], and then sequenced with an ABI 3730 xl automated sequencer (Applied Biosystems, Foster City, CA, USA). All sequences from this study were deposited in GenBank (https://www.ncbi.nlm.nih.gov/genbank/ (accessed on 4 November 2021)).

2.3. Phylogenetic Reconstruction

Sequences were assembled and manually edited with the program Sequencher v4.1.4 (Gene Codes Corp., Ann Arbor, MI, USA), aligned in Mafft v7.450 [39], and manually adjusted in Geneious v8.0 (Biomatters Ltd., Auckland, New Zealand). Gaps that appeared in the alignment were regarded as missing data. To test phylogenetic relationships among populations, we reconstructed a phylogenetic tree with one individual sampled from each of the 19 populations based on a combined data set from the 22 cpDNA regions (Table S2) mentioned above by using maximum likelihood (ML) analyses [40]. The ML analysis (option “-f a”) was performed in RAxML [41], along with 2000 rapid bootstrap replicates under the GTRGAMMA model [42].

2.4. Phylogeographic Analyses

Based on the geographical distance and the geographic trend of mountains, we grouped the 19 populations that belong to four regions (i.e., CH, EH, WHM, and EHM, populations for each mentioned in the Taxon Sampling section above) in three ways (three group sets, Table S2) for group comparative studies: (1) two groups: a group of four populations from CH, and another group of the remaining 15 populations from EH + WHM + EHM; (2) three groups: a group from CH (four populations), a group from EH + WHM (12 populations), and a group from EHM (three populations); and (3) two groups: a group from CH + EH (six populations) and a group from WHM + EHM (as above). Therefore, six groups of populations were classified, i.e., CH, EH + WHM + EHM, EH + WHM, EHM, CH + EH, and WHM + EHM.
We calculated the total number and proportion of haplotypes with the program DnaSP v6 [43], which was also applied to confirm the distinctive cpDNA haplotypes within populations or groups. Population haplotypes were mapped with ArcMap v10.2.02 (http://services.arcgisonline.com/arcgis/rest/services/World_Street_Map/MapServer (accessed on 31 October 2021)). For depicting haplotype relationships, we constructed a haplotype network using the median-joining (MJ) method [44], implemented in the software Network v4.6.0 (http://www.fluxus-engineering.com (accessed on 16 January 2021)). DnaSP v6 was also employed for calculating haplotype diversity (Hd) and nucleotide diversity (π), with 1000 permutations performed to obtain the p values for comparison. For investigating haplotype composition, frequency, and sequence variation by locus in each population, the genetic diversity parameters over the total geographic distribution and the geographic distribution of each group were calculated with Permut v1.0 [45]. These parameters included the level of genetic diversity [46]: total genetic diversity (HT), average within-population genetic diversity (HS), and genetic differentiation coefficients between populations, including genetic differentiation with unordered alleles (GST) and genetic differentiation with ordered alleles (NST). The degree of population differentiation was estimated by the analysis of molecular variance (AMOVA) in the program ARLEQUIN v3.0 [47]. FST, the inbreeding coefficient of the populations, represents genetic variability among different populations and measurement of population structure [48]. Genetic differentiation/variation was then calculated among groups by FCT, among populations within groups by FSC, and within populations by FST [49].
A Mantel test [50] was performed with the program GenAlEx v6.502 [51] to assess the extent of correlation between geographic and genetic distances, with correlation coefficients (r2) calculated. A neutral test for the calculation of Tajima’s D and Fu’s FS parameters was performed with DnaSP v6 under the infinite allele model at the 0.02 level of significance [52]. The population is considered to have experienced a bottleneck effect or recent expansion when Tajima’s D is significantly positive or negative, respectively. When FS is significantly negative, it indicates that the population has a bottleneck effect [52]. We performed the neutral test on each of the six groups and overall populations based on the combined data of psbK-psbI and trnV-GAC.
Mismatch analysis can reveal population expansion events, including recent expansion that has occurred in the history of the species, based on DNA sequence information and the distribution of pairwise genetic differences between different individuals [53,54]. If a population has undergone growth or expansion, then the mismatch analysis presents a Poisson distribution, whereas if the population is under dynamic equilibrium, then the mismatch distribution is bimodal or multimodal [54,55]. A mismatch analysis was performed with both DnaSP v6 and ARLEQUIN. The sum of squared deviations (SSD) and Harpending’s raggedness index (HRag) [55] of the mismatch analysis observations and expected values with their significance were calculated. The raggedness index quantifies the smoothness of the discrepancy distribution, which can be used to detect deviation from the stable population mode [56]. We inferred the relevant events by calculating the time of differentiation. If the subsequent result was close to the expansion model, the mismatch analysis showed a unimodal curve. Then the expansion time was usually calculated by using the formula t = τ/2u, and the mismatch analysis was explained by the tau value (τ), which is commonly used for expansion time calculation: u is calculated using the formula u = 2 μkg, with μ representing the rate of nucleotide substitution, k the sequence length (720 bp in this study), and g the generation time (5 years as the number of years until first flowering of Gaultheria nummularioides (pers. observation). The current research on the rate of chloroplast nucleotide substitution rate of G. nummularioides was unavailable. We therefore estimated the evolution rate scope of the trnV-GAC and psbK-psbI regions with their joint analysis by the angiosperm chloroplast mutation rate minimum value 1.01 × 10⁻⁹ s/s/y [57], and maximum rate value 8.24 × 10⁻⁹ s/s/y [58]. The population has experienced recent expansion when the value of Tajima’s D is significantly either positive or negative.
The ecological niche model (ENM) is used to predict the potential distribution of species [59,60]. The Maximum Entropy model is the most commonly used and recognized algorithm because it can yield a satisfactory prediction result with relatively few distribution points [61,62]. We implemented the Maximum Entropy model in MaxEnt v3.4.1. The geographic distribution data (GPS information) of Gaultheria nummularioides were obtained from the Chinese Virtual Herbarium (CVH, http://www.cvh.ac.cn/ (accessed on 15 March 2021)), including 37 sampling presence points covering its distribution in the Himalaya-Hengduan Mountains. The climate information was downloaded from the World Climate Database (www.worldclim.org (accessed on 19 January 2021)), and the bioclimatic data for the Last Glacial Maximum, the Last Interglacial, Current, and 2070s (2061–2080) were selected, with 19 factor variables in 2.5 arc-minute resolution for each period. The multicollinearity between environmental variables may lead to overfitting of the forecast distribution; therefore, the Pearson correlation coefficient (r = ±0.8) was used to filter the environmental variables [59,63]. Accounting for the life history features of G. nummularioides, we used seven environmental variables as predictors in the models, i.e., Bio2 (mean diurnal range), Bio3 (isothermality), Bio6 (minimum temperature of coldest month), Bio7 (temperature annual range), Bio13 (precipitation of the wettest month), Bio14 (precipitation of the driest month), and Bio15 (coefficient of variation of precipitation seasonality).
The GCS_WGS_1984 coordinate system was selected as the data format in ArcGIS v10.6. Using the geographic distribution data of Gaultheria nummularioides and 19 climatic factors, the Maxent model was used to predict suitable habitat, and Jackknife test was used to find the effective environmental variables which had a great impact on species potential distribution. We randomly selected 75% as the training data and 25% of the distribution data as the test set with 10 replicates. The accuracy of the model prediction was assessed by the Receiver Operating Characteristic Curve (ROC) and Area under Curve (AUC), the values for both of which range from 0.5 to 1 [64,65]. The ROC curve has been recommended because it summarizes model performance and overall conditions in which a model could operate [66], using all the information provided by the predictive model [65]. Values of AUC higher than 0.9 are commonly considered to be an excellent prediction [67,68].

2.5. Population Divergence Estimation
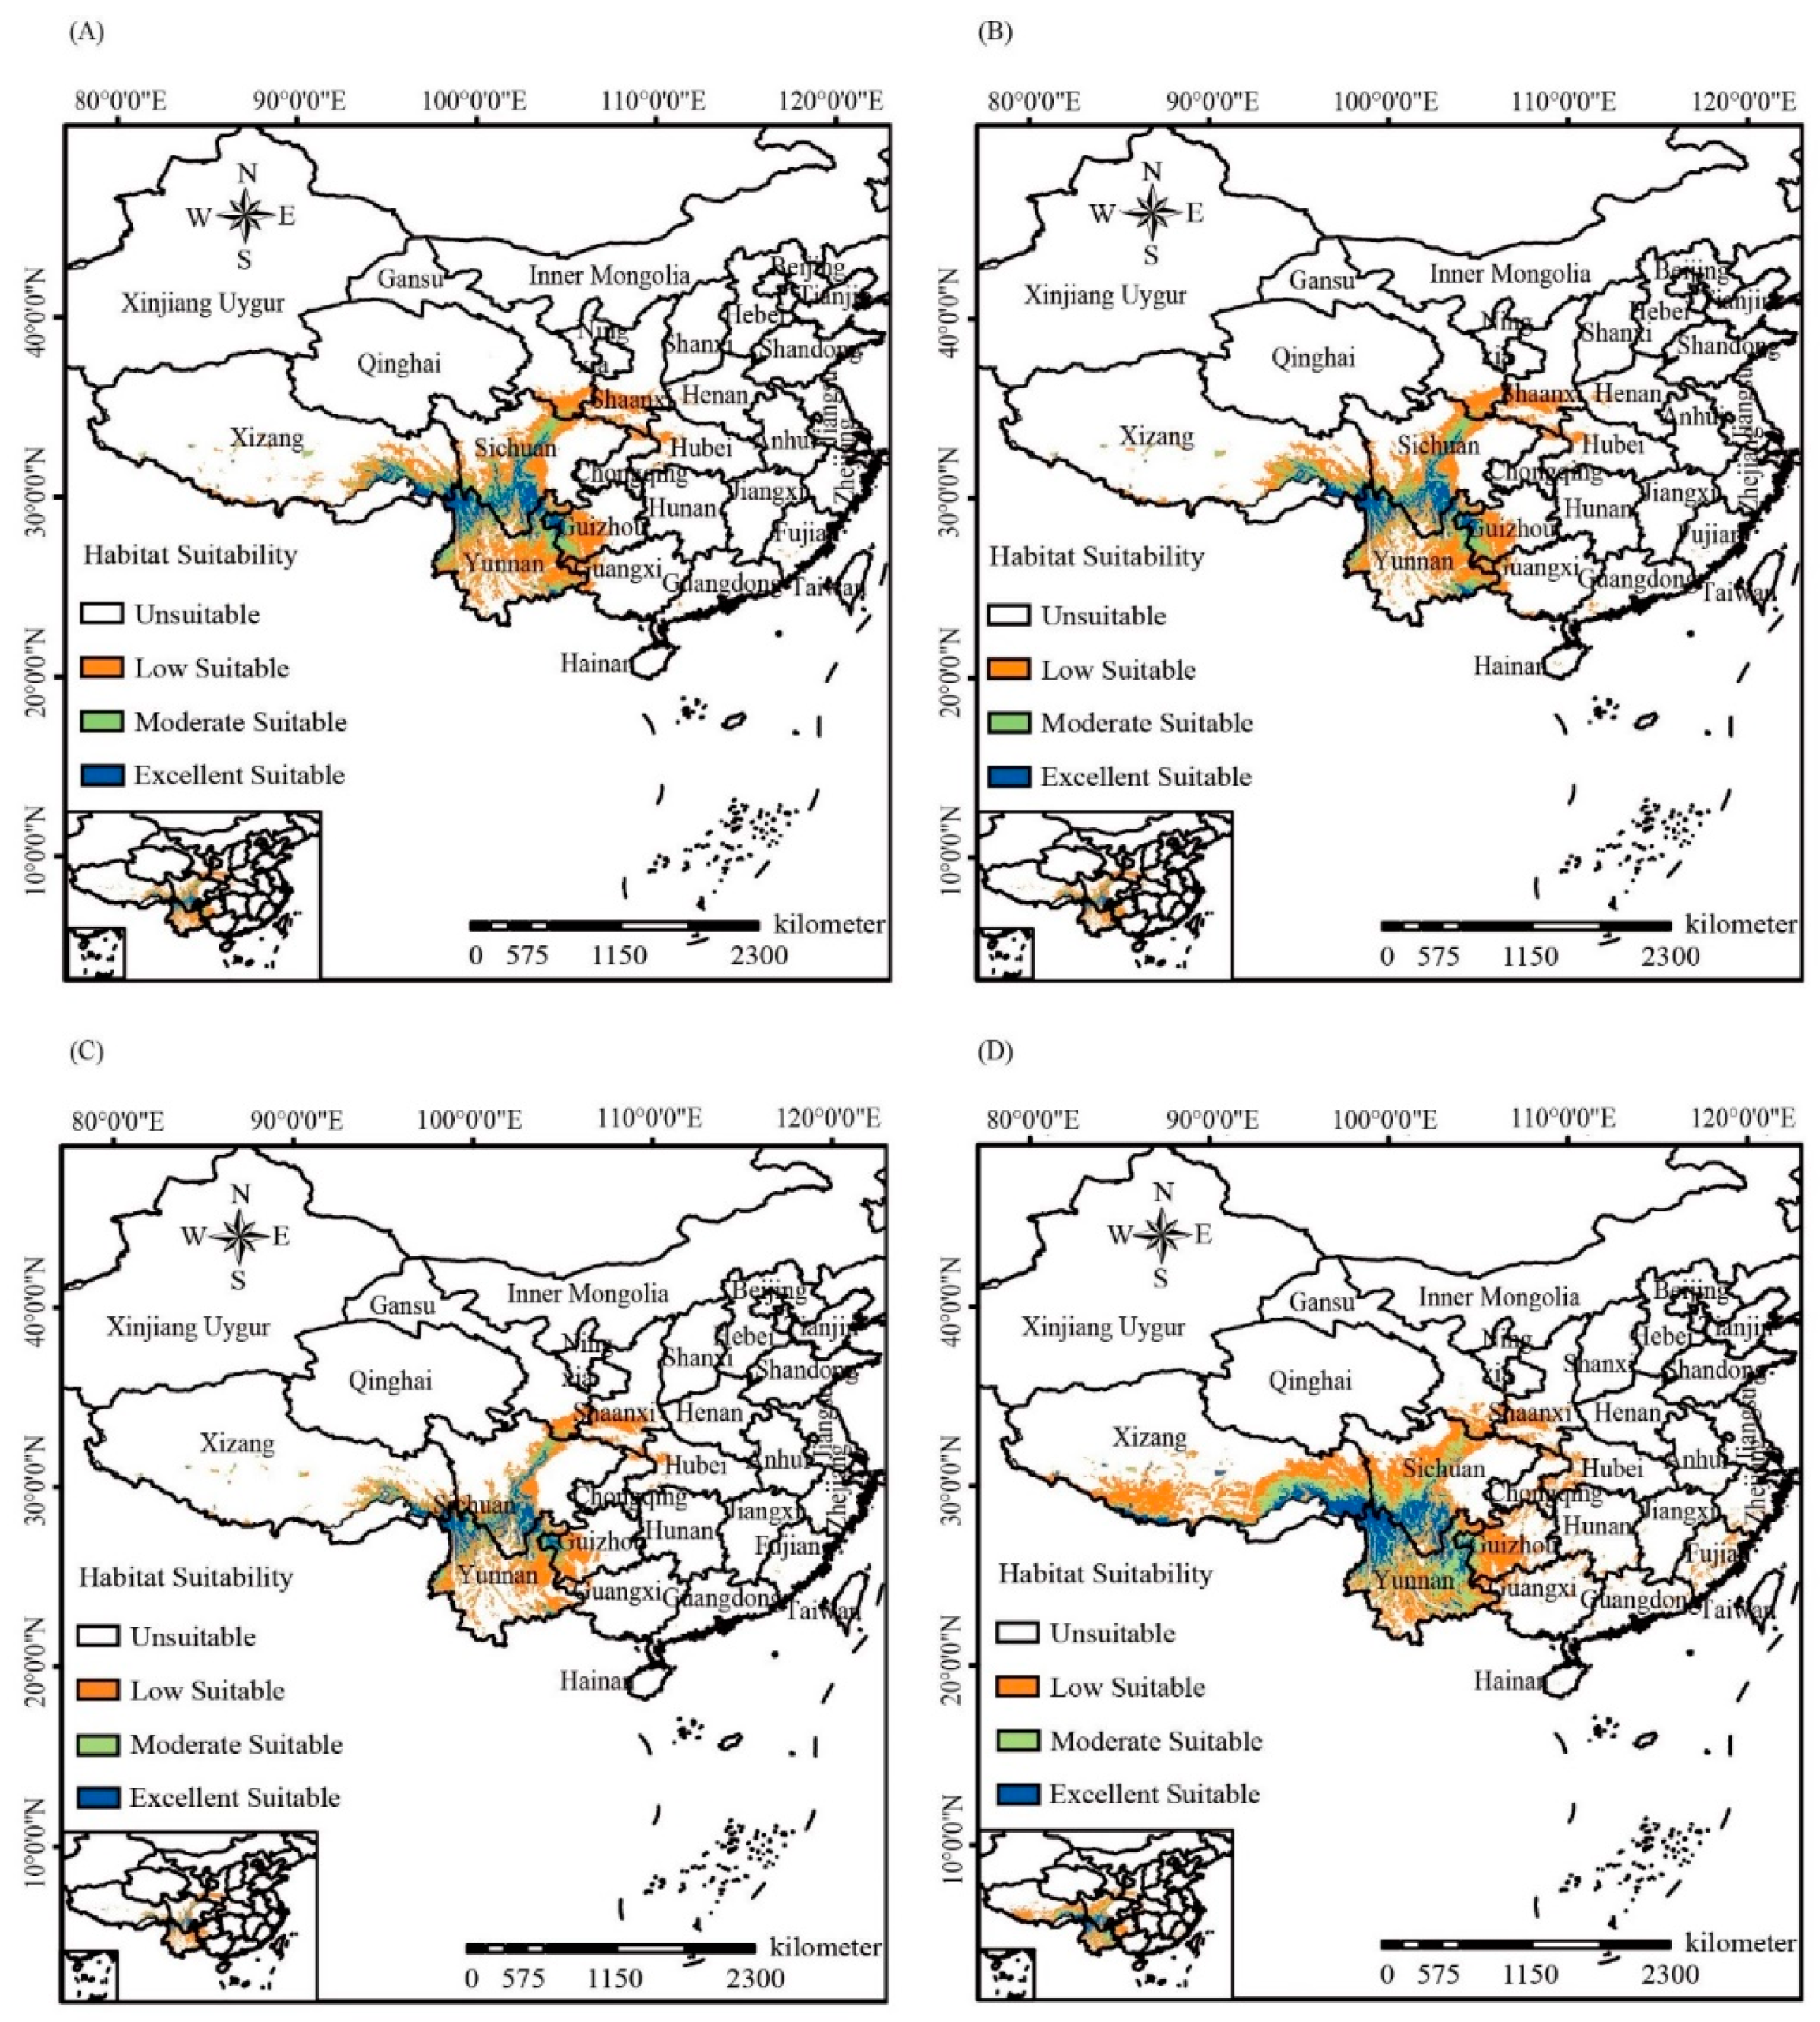
To estimate haplotype divergence among various populations, we first obtained the matrix of haplotype sequences by DnaSP v6, with a haplotype (H20) from Gaultheria albiflora selected as the outgroup. The divergence times of haplotypes were estimated with a Bayesian Monte Carlo Markov Chain (MCMC) coalescent method implemented in BEAST (v1.8.3; [69]). The best-fitting model of DNA substitution for the combined dataset was found to be GTR + G with the Akaike Information Criterion (AIC) as implemented in jModelTest v2.0 [70]. Because there is no reported fossil information of G. nummularioides, we used secondary calibration dating for the crown age of this species by initially conducting a phylogenetic dating analysis across the tribe Gaultherieae based on the modified dataset of Lu et al. [71]. Because only one individual of this species was sampled on the chronogram of Lu et al. [71], the stem age rather than the crown age of this species was available. We therefore added two more samples of G. nummularioides (one individual from the population JD and one from HLG, Table S1) for obtaining a new chronogram of the tribe Gaultherieae with the crown age for the species. The protocol for generating the BEAST tree (e.g., fossil calibration, model testing, and prior settings) followed the study of Lu et al. [71]. To estimate the time of origin of G. nummularioides, the secondary calibration point of 2.94 Ma (95% HPD: 1.55–4.77 Ma) was obtained from the new chronogram of the tribe Gaultherieae. An uncorrelated lognormal relaxed molecular clock was then estimated under a constant coalescent size tree prior. Following standard practice, we set the second calibration point to a normal distribution. Thus, the minimum fossil age was used to define the offset value and constrained the lower bound of the 95% prior interval of the distribution [72]. The prior was therefore set with a mean of 2.937 and a standard deviation of 0.8. The BEAST analysis was run for 80 million generations and a sample frequency of 10,000 was set for MCMC. Convergence of independent chains and adequate mixing of all parameters was considered to be achieved when the Effective Sample Size was >200, as assessed with Tracer v1.6 [73].

3. Results

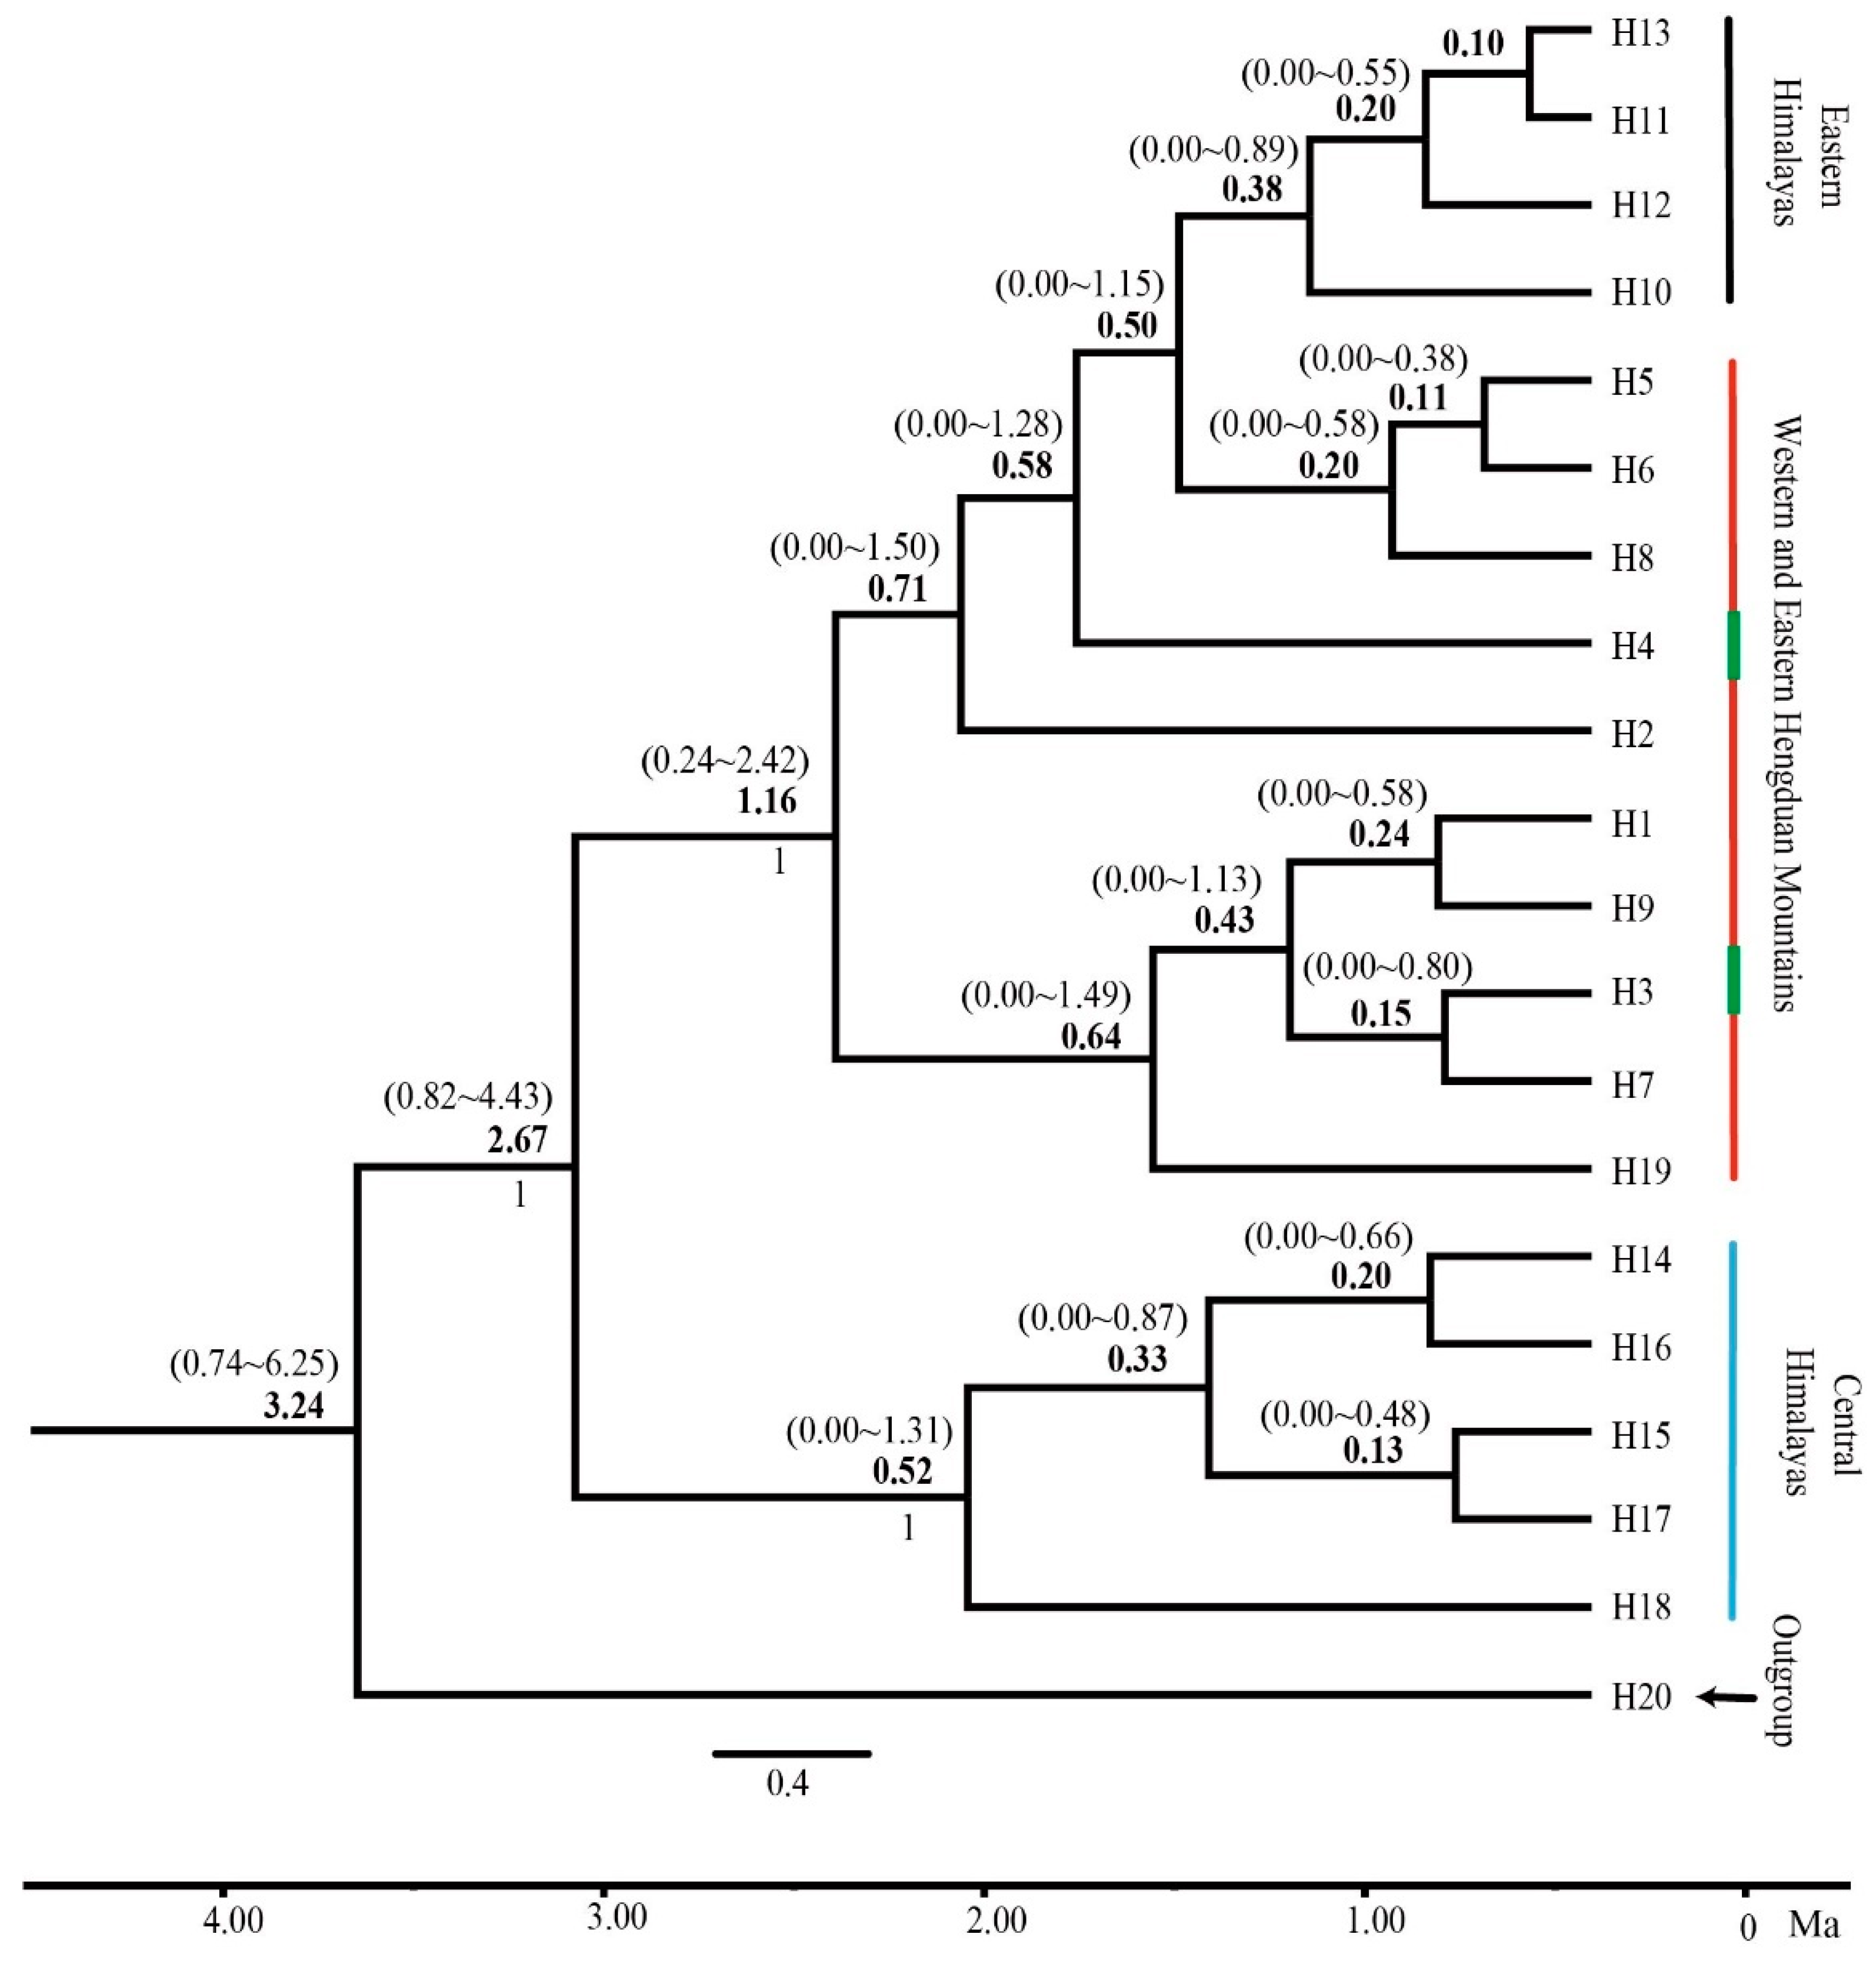
3.1. Phylogenetic Tree Reconstruction

The relationships among most populations were not well resolved and with poorly bootstrap support, likely resulting from the low number of phylogenetically informative sites (Figure 2). Although the information from phylogenetics is limited, it can be inferred that the 15 populations from EH and HM are well supported as a monophyletic group (BP = 98), and are distinct from the four populations YD, PZL, SD, and NDL from CH, which did not form a strongly supported clade. The YD population is sister to the 15 populations (BP = 95). The three populations from EHM, i.e., BX, TQ, and HLG, form a clade with the population DZB from WHM (BP = 99). Therefore, the phylogenetic relationship of the populations of EH is closer to those of HM than those of CH.

3.2. Genetic Diversity

Two of the 22 genic regions showed a high level of variable sites. The aligned sequence length of psbK-psbI is 387 bp and trnV-GAC is 333 bp, and the total aligned length of the combination of psbK-psbI and trnV-GAC is 720 bp, with 21 polymorphic sites. There are 19 chloroplast haplotypes thus identified in the combined dataset (Table S1, Figure 3A). Haplotypes H1 and H2 are the most widely distributed haplotypes, with H1 occurring across nine populations (GS-2, GS-3, LSD, YZ, DZA, DZB, GS, YW, and JD) and H2 across seven populations (GS-2, GS-3, MD, DLJ, DZA, BX, and GS). Two haplotypes, i.e., H5 and H15, are each shared by four populations: GS-2, GS-3, DLJ, and DZA for H5, and NDL, PZL, SD, and YD for H15. The haplotype H16 is shared among three populations: NDL, PZL, and SD. Three haplotypes are shared between two populations: H3 (HLG, TQ), H13 (MD, DXL), and H14 (NDL, SD). The other 11 haplotypes are private for only one population each: H4 (BX), H6 (GS-2), H7 (GS-2), H8 (GS-2), H9 (LSD), H10 (MD), H11 (MD), H12 (MD), H17 (PZL), H18 (YD), and H19 (YW). Based on the network analysis (Figure 3B), H1, the most frequent haplotype, is located in the center connected with seven haplotypes (H2, H3, H7, H8, H9, H15, and H19). Among the latter, H2 and H15 are both internal to some other haplotypes: H2 was internal to H4, H5, H10, and H13, whereas H15 was internal to H14, H16, H17, and H18. H1, H2, and H15 yielded a star-like pattern with their descendant haplotypes.
Haplotype diversity (Hd) and nucleotide diversity (π) were calculated for each population (Table S1). For psbK-psbI, Hd ranges from 0 to 0.600, and π from 0 to 0.002. For trnV-GAC, Hd ranges from 0 to 0.790, and π from 0 to 0.004. For the combination of psbK-psbI and trnV-GAC, Hd ranges from 0 to 0.838, and π from 0 to 0.003, with the total value of Hd = 0.845 and that of π = 0.007. Some populations (e.g., JD, HLG, TQ, DXL, YZ, and DZB) contain only one chloroplast haplotype; thus, their values of nucleotide polymorphism and haplotype polymorphism = 0. The population GS-2 has the highest haplotype polymorphism with Hd = 0.838, and it has the highest nucleotide polymorphism with π = 0.002. Within the species, the total cpDNA haplotype diversity (HT) = 0.860, and the average within-population diversity (HS) = 0.326 (Table 1). Among the six groups of populations we classified, Hd ranges from 0.475 to 0.786, and π from 0.001 to 0.007 (Table 1). HT ranges from 0.501 (S.E. = 0.045) to 0.860 (S.E. = 0.041) and HS ranges from 0.044 (S.E. = 0.044) to 0.479 (S.E. = 0.043) (Table 1). Overall, we found a low level of genetic diversity within populations and a high level of genetic diversity among populations and groups.

3.3. Phylogeographic Analyses

Phylogeographic analyses were based on the combined dataset of psbK-psbI and trnV-GAC. GST and NST were calculated as 0.620, and 0.890 at the population level, respectively (Table 1). The NST values were higher than the GST values, demonstrating a significant phylogeographic structure. At the group level, GST ranged from 0.044 to 0.933, and NST from 0.107 to 0.968 (Table 1), which also demonstrated a phylogeographic structure for the populations of these groups. This phylogeographic structure can be also demonstrated by the haplotype map (Figure 3A): populations PZL, YD, SD, and NDL share haplotype H15, DXL and MD share H13, and TQ and HLG share H3; these groups were distinct from the other nine populations, which share H1.
Based on the Mantel test, we found a correlation between genetic distance and geographic distance (r2 = 0.086, p = 0.02 < 0.05; Table 1). By the AMOVA analysis (Table 2), genetic variation among populations within groups was calculated as 9.53% (FSC = 0.648) for the grouping set I (CH and EH + WHM + EHM), 12.00% (FSC = 0.617) for the grouping set II (CH, EH + WHM and EHM), and 36.71% (FSC = 0.821) for the grouping set III (H + HM), whereas those within populations were calculated as 5.17% (FST = 0.948), 7.44% (FST = 0.926), and 7.99% (FST = 0.920), respectively for these three groupings. The genetic variation among populations within groups was found to be higher than those within populations. Among all tests, the largest variation among groups appears in set I: CH and EH + WHM + EHM, up to 85.30%.
In the neutral test analysis, values of Tajima’s D were found to be not significant among in all six groups (all p > 0.05, Table 3). Values of Fu’s FS were found to be positive in two groups (CH + EH, EHM) but were not significant (p > 0.05), and were negative in the other four groups (CH, EH + WHM + EHM, EH + WHM, WHM + EHM) and not significant (p > 0.05). These results indicate that Gaultheria nummularioides appears to not have experienced population expansion.
However, based on the mismatch distributions in the plot in Figure S1, the curves of the groups CH (in both groups set I and II), EH + WHM + EHM, EH + WHM were all unimodal, and the remaining groups EHM, CH + EH, and WHM + EHM and in the group overall were bimodal, with values of SSD ranging from 0.006 (p = 0.030) to 0.185 (p = 0.040), of HRag ranging from 0.047 (p = 0.620) to 0.592 (p = 0.010), and of tau (τ) ranging from 0.680 to 11.029 (Table 3). This suggests that the groups CH, EH + WHM + EHM, EH + WHM, and WHM + EHM have experienced population expansion, whereas the other groups and the species overall did not.
An assessment of MaxEnt model accuracy showed that the AUC values for both the training data and test data in four periods were all >0.98 with the random prediction AUC values = 0.5 (Figure S2), indicating excellent accuracy for the MaxEnt predictions. Among the seven selected environmental variables for MaxEnt prediction, temperature annual range (Bio7) possessed the highest contribution rate, accounting for 44.5% of the prediction. This implies that it played the most important role in the prediction of the distribution of Gaultheria nummularioides, followed by the minimum temperature of the coldest month (Bio6, 27.3%) and isothermality (Bio3, 14.2%), whereas mean diurnal range (Bio2, 5.6%), precipitation of the wettest month (Bio13, 3.8%), and precipitation of the driest month (Bio14, 4.5%) had a weak influence. The coefficient of variation of precipitation seasonality (Bio15) had no effect, accounting for 44.5% of the prediction (Table 4). Based on the classification of potentially suitable areas of G. nummularioides in the Himalaya-Hengduan Mountains predicted by the MaxEnt model in four time periods, the current suitable area for G. nummularioides was smaller than those in both past (the Last Interglacial and the Last Glacial Maximum) and future (the 2070s) (Figure 4). The areas of moderate suitability and excellent suitability in all periods mostly cover Northern Yunnan, Western Sichuan, Southwestern Tibet, and Northwestern Guizhou.

3.4. Divergence of Population Haplotypes

The BEAST analysis yielded a majority-rule tree showing a crown-group origin of the 19 haplotypes of Gaultheria nummularioides at ca. 3.24 Ma (95% HPD: 0.74–6.25 Ma; Figure 5). All cpDNA haplotypes subsequently diverged into two lineages at ca. 2.67 Ma (95% HPD: 0.82–4.43 Ma, PP = 1.00) in the late Pliocene. One of these lineages comprises Hap 14, Hap 15, Hap 16, Hap 17, and Hap 18 that characterize the populations YD, SD, PZL, and NDL from CH (the central Himalaya), and the other comprises all other haplotypes that characterize the populations EH, WHM, and EHM (the eastern Himalaya and the Hengduan Mountains). Most haplotypes diverged after 1.16 Ma and mostly during the glacial period within the late Pleistocene (ca. 0.5 Ma to 0.1 Ma).

4. Discussion

4.1. Genetic Differentiation within and among Populations

We found that genetic differentiation in G. nummularioides is higher among populations than within populations, with a significant phylogeographic structure. The AMOVA analysis and Mantel test revealed high genetic divergence and significant genetic breaks among the central and eastern Himalaya, as well as the west and east Hengduan Mountains; four distinct haplotype regions can therefore be distinguished (Figure 3A). The complex topography with heterogeneously isolated niches may explain the high genetic differentiation among populations in the lineage of CH (central Himalaya), EH (eastern Himalaya), WHM (western Hengduan Mountains), and EHM (eastern Hengduan Mountains), similar to the genetic divergence pattern of Quercus aquifolioides in Yang et al. [16]. High levels of genetic differentiation among populations have also been found in many cpDNA phylogeographic studies of plants in river valleys of southwest China [74,75,76]. Sky islands tend to have genetically structured populations, possibly due to enhanced genetic drift and reduced gene flow among montane areas [77,78]. Rich haplotypes have probably resulted from limited gene flow among populations and the genetic diversity appears to result in high among-population genetic variation [16]. The attributes of highly dissected topography, complex variable climate, and isolated habitats of the eastern Himalaya and the Hengduan Mountains may create barriers to gene flow.
In contrast to the previously reported phytogeographic boundaries such as the Tanaka-Kaiyong Line (TKL) and the Ward Line-Mekong-Salween Divide (MSD), the genetic differentiation of Gaultheria nummularioides instead supported a major phytogeographic boundary between CH and EH + WHM + EHM. Based on the phylogenetic tree and haplotype networks, the earliest divergent populations were from CH and then colonized WHM and EHM, and the populations of EH diverged recently from those of WHM, indicating a phylogeographic break between CH and EH + WHM + EHM. Among the 19 haplotypes, we found richer haplotypes in the EH + WHM + EHM clade than in the CH clade (15 vs. 4).
The central and eastern Himalaya differ in climate, geology, and snowline elevation. The climate of the central Himalaya is dominated by the southwest monsoon from the Indian Ocean, whereas the eastern Himalaya is affected by both the southwest monsoon from the Indian and the East Asian monsoons from the Pacific Ocean [79]. Most of the high (>8000 m) mountain peaks in the world are located in the central Himalaya, whereas a conspicuous geomorphotectonic character is the sharp bend in the eastern Himalaya [80,81]. Moreover, the snowline elevations (SLA) of the central and the eastern Himalaya also differ: the mean SLA migrated upward by 67 m between 1994 and 2015 in the central Himalaya, and the SLA trends of the eastern Himalaya are consistent with the central Himalaya up to 2000, whereas an increase in SLA (~7 m a−1) appeared afterward [82]. In comparing the central and eastern Himalaya with the Hengduan Mountains, the eastern Himalaya are closer to the Hengduan Mountains in terms of the geographic orientation of mountains, climate, and geology. Mountains trend predominantly north-to-south in both the eastern Himalaya and the Hengduan Mountains, whereas they trend east-to-west in the central Himalaya [83,84]. The climates of the eastern Himalaya and the Hengduan Mountains are influenced by both the southwest and the East Asian monsoons [79]. The geology is characterized by deep ravines or steep river valleys in the eastern Himalaya and the Hengduan Mountains. Moreover, there are accumulation-type glaciers in the eastern and central Himalaya [85,86]. Therefore, the heterogeneity of climate, geology, and the snowline elevations between the central and eastern Himalaya may explain the phylogeographic boundaries observed in our study.

4.2. Genetic Divergence Correlated with Pleistocene Glacial Cycle-Induced Climatic Shifts and Monsoons in Montane Habitats

Higher genetic differentiation among populations versus within populations for high-montane plants can result from founder effects as in Lupinus alopecuroides Desr. [77], or selfing and repeated bottlenecks as in Puya raimondii Harms [87]. The haplotypes of the WHM populations are generally dominated by H1, H2, and H5. Both evolutionary forces could be operable [26,88,89,90]. The two forces were promoted by Pleistocene climatic oscillation and extreme topography affecting population dynamics [91,92,93]. Chloroplast introgression could also explain our geographic structure of haplotypes. Interspecific gene flow can cause the introgression of one species’ chloroplast into a population of another species with reticulation of chloroplast lineages but with permanence of morphological traits [28,94]. The late Pleistocene, a time characterized by dramatic changes in species distributions, provided allopatric species the opportunities to occur in sympatry, which would probably have caused ancient introgression events between related taxa [95,96,97]. Within the ser. Leucothoides s.l. clade, Gaultheria nummularioides has been found to harbor patterns of reticulation or hybridization in its evolution [21,23].
Nonetheless, Quaternary glaciations and related monsoon systems may contribute more strongly to shaping the demographic history of Gaultheria nummularioides. The southeastern QTP is known as an important glacial refugium of many plants [98], and allopatric divergence of populations in isolated microrefugia could be responsible for many private cpDNA haplotypes across the current distribution [99]. Our study suggests that geographically isolated mountains share several haplotypes, e.g., the populations YZ, JD, GS, GS-2, GS-3, DZA, DZB, LSD, and YW all share haplotype H1 even though some are clearly isolated by ravines. The star-like shape of the haplotype network indicates that populations preserved in refugia have experienced population expansion after glaciation [98].
Geological events along with climatic oscillations, including the monsoon system and Quaternary glaciation, could have facilitated the formation of genetic diversity and differentiation of taxa in the Himalaya-Hengduan Mountains [100]. Phylogeographical studies on several sky-island species from these mountains, e.g., Chionocharis hookeri (C.B. Clarke) I.M. Johnst., Eriophyton wallichii Benth., Incarvillea arguta Royle, Marmoritis complanata (Dunn) A.L. Budantzev, Mirabilis himalaica (Edgew.) Heimerl, Paraquilegia microphylla (Royle) J.R. Drumm. & Hutch. and Thalictrum squamiferum Lecoy. [8,9,100,101] show that the onset of diversification generally falls into the mid- to late-Pleistocene, and also show evidence of recent spatial expansion based on cpDNA, which mostly overlaps with the time of strong infraspecific differentiation found here in Gaultheria nummularioides.
The Himalaya-Hengduan Mountains are affected by both the southwest monsoon from the Indian and the East Asian monsoons from Pacific Oceans. Most haplotypes diverged between 0.5–0.1 Ma, which coincides with the time of the weakening of the Asian monsoons in these regions. Through mismatch analysis, we detected a recent expansion of Gaultheria nummularioides within the period of the Last Glacial Maximum, a time of intensification of the Asian monsoons [102,103]. Not only were sky islands an important glacial refugium that preserved genetic diversity of arctic and alpine taxa throughout glacial periods, but their varied topography also promoted genetic differentiation of populations during warm interglacials [28]. Populations on different mountains likely experienced alternating periods of isolation and connectivity during Pleistocene climatic fluctuations [6,104,105,106,107]. During these fluctuations, high-elevation population range expansions and contractions/fragmentations may have shaped the pattern of extensive genetic divergence and gene flow of species with elevational range shifts (e.g., Rocky Mountains [28], the northern Andes [77]). The high proportion of private haplotypes (11 out of 19) of G. nummularioides, with geographic structure but also with frequent haplotypes shared among adjacent populations, can result from the joint effect of both population mixing and isolation throughout the glacial/interglacial alternations.
The climate sensitivity of alpine sky-island species has been a concern because of global warming [108,109,110]. These species are expected to shift to higher elevations with the reduction of available habitat, but in fact ecological niche modelling studies have shown that more of these species have increased their range size rather than decreased through time [108,111]. Based on surveying the distribution dynamics of 151 montane plants from the Himalaya-Hengduan Mountains, Liang et al. [108] showed that the range sizes for these subalpine and alpine plants as a whole increased gradually from the Last Glacial Maximum to Current as climate warming occurred, or from Current to 2050s as climate warming was predicted to occur, mainly because warming can drive varied distribution shifts rather than solely unidirectional range shifts. The distribution shifts of Gaultheria nummularioides in our study were found to be mainly influenced by temperature (Bio6 and Bio7). Our results showed that the range size significantly increased from the Current to 2070, consistent with the general pattern of Liang et al. [108], but in contrast was modeled to decrease from the LIG through LCM to the Current. The study of Liang et al. [108] further indicated that low- and mid-montane species within the sampled plants generally decreased. Gaultheria nummularioides has the widest elevational distribution within the genus, ranging from 1000 to 4200 m [112], covering both mid-mountain and alpine regions, and therefore its distribution dynamics may be affected by both elevational forces.

4.3. Morphological Variation among Various Populations

The responses of sky-island populations to climate and ecological fragmentation are not only genetic but also phenotypic. In other studies, morphological variation has been detected to have geographic structure consistent with genetic differentiation [25,104,113,114]. In our study, there are two corolla types, i.e., white to whitish green and narrowly urceolate (Figure 1B,F), and pink to deep red and broadly urceolate (Figure 1J,K,M,O). The populations GS-3 and HLG have the former type and the populations DXL, MD, GS-2, LSD, DLJ, and NDL have the latter type. In addition, leaves vary in size and shape: leaf blades of some plants are small and ovate (YD, MD, and NDL), and those of others are large and orbicular (e.g., YW), although most are intermediate. The indumentum on leaves and branches also varies in populations or even within populations. However, we find no evidence for the morphological variations above associated with either cpDNA genetic differentiation or geographic pattern. As mentioned above, we detected a high frequency of reticulate evolution or hybridization in G. nummularioides [20]. Further understanding of morphological evolution in the species awaits further studies based on nuclear DNA data with increasing sampling.

5. Conclusions

We conducted phylogeographic and phylogenetic analyses on 273 individuals from 19 populations in Gaultheria nummularioides and divided the sample collection sites into six basic groups (areas) in three ways (three group sets) for analyses. The results showed a higher level of genetic diversity among populations than within populations in this species. A phylogeographic boundary was detected between the central Himalaya and the eastern Himalaya plus the Hengduan Mountains, linked to heterogeneity of climate, geology, and snowline elevation. The populations of the eastern Himalaya are more closely related to the Hengduan Mountains than either are to the central Himalaya. Mismatch analysis indicated that G. nummularioides experienced population expansion after glaciation, and divergence times of most haplotypes were 0.5–0.1 Ma, which coincides with the time of the weakening of the Asian monsoons in these regions. Quaternary glaciations and related monsoon systems may have strongly shaped the demographic history of this species. Ecological niche modeling suggested that the shifts in geographic distribution found in our study are mainly determined by temperature, and range size was estimated to have significantly increased from the Current to 2070 but predicted to decrease from the LIG through LCM to the Current. Our study extends understanding of the genetic differentiation and evolutionary processes of sky-island species in response to geographic complexity and Pleistocene climate changes within the Himalaya-Hengduan Mountains.

Supplementary Materials

The following supporting information can be downloaded at: https://www.mdpi.com/article/10.3390/d14080652/s1, Figure S1: Plots of the mismatch analysis of the six groups classified in the study and overall (all populations) in Gaultheria nummularioides based on the combined data of psbK-psbI and trnV-GAC. Expected values are shown by the solid line, whereas observation values are shown by dotted line. Figure S2: The average area under the curve (AUC) for ten MaxEnt runs of G. nummularioides. The red line represents the mean value for the ten MaxEnt runs, and the blue line represents ±1 standard deviation. The mean AUC value of 0.98 illustrates an excellent model. (A–D) represent the Last Interglacial, Last Glacial Maximum, Current, and 2070s, respectively. Table S1: Voucher information and population localities of samples used in the study. Haplotypes, Haplotype diversity (Hd), nucleotide diversity (π) of populations in G. nummularioides, and the group to which each population belongs are presented. The number of haplotypes, the code of each population, and the number of individuals in each population (N) are shown in parentheses. Table S2: The 22 cpDNA regions and their primer information used for phylogenetic tree reconstruction and screened for phylogeographic analyses.

Author Contributions

L.L. designed the study; J.Z., P.W.F., S.Y. and L.L. wrote the paper; J.Z., X.C. and Y.L. performed the experiments and analyses. All authors have read and agreed to the published version of the manuscript.

Funding

This study was supported by grants from the National Natural Science Foundation of China (31960080, 41671052), Scientific Research Fund Project of Yunnan Education Department (No. 2022Y197), Program Innovative Research Team in Science and Technology in Yunnan Province (No. 202005AE160004), the U.S. National Science Foundation (DEB-0717711 to P.W.F.), the National Geographic Society (4-03-9329), and the CAS President’s International Fellowship Initiative (PIFI, 2010T2S05 to P.W.F.).

Institutional Review Board Statement

Not applicable.

Informed Consent Statement

Not applicable.

Data Availability Statement

The sequences obtained were deposited in GenBank under the accession codes ON615643-ON616404.

Acknowledgments

The authors thank Yan-Quan Chen and Guo-Hong Li for sample collection and Yang Tao, Hong-Yan Huang, and Chao Wu for laboratory advice and assistance.

Conflicts of Interest

The authors declare no conflict of interest.

References

  1. Heald, W.F. Sky islands in Arizona. Nat. Hist. 1951, 60, 95–96. [Google Scholar]
  2. He, K.; Jiang, X.L. Sky islands of southwest China. I: An overview of phylogeographic patterns. Chin. Sci. Bull. 2014, 59, 585–597. [Google Scholar] [CrossRef]
  3. Myers, N.; Mittermeier, R.A.; Mittermeier, C.G.; da Fonseca, G.A.B.; Kent, J. Biodiversity hotspots for conservation priorities. Nature 2000, 403, 853–858. [Google Scholar] [CrossRef] [PubMed]
  4. DeBano, L.F. The Madrean Sky Island Archipelago: A Planetary Overview. In Biodiversity and Management of the Madrean Archipelago: The Sky Islands of Southwestern United States and Northwestern Mexico, September 19–23, 1994; University of Arizona: Tucson, AZ, USA, 1995. [Google Scholar]
  5. He, K.; Gutierrez, E.E.; Heming, N.M.; Koepfli, K.P.; Wan, T.; He, S.W.; Jin, W.; Liu, S.Y.; Jiang, X.L. Cryptic phylogeographic history sheds light on the generation of species diversity in sky-island mountains. J. Biogeogr. 2019, 46, 2232–2247. [Google Scholar] [CrossRef]
  6. Avise, J.C. Phylogeography: The History and Formation of Species; Harvard University Press: Cambridge, MA, USA, 2000; pp. viii + 447. [Google Scholar]
  7. Luo, D.; Xu, B.; Rana, S.K.; Li, Z.M.; Sun, H. Phylogeography of rare fern Polystichum glaciale endemic to the subnival zone of the Sino-Himalaya. Plant Syst. Evol. 2018, 304, 485–499. [Google Scholar] [CrossRef]
  8. Luo, D.; Xu, B.; Li, Z.M.; Sun, H. The ‘Ward Line-Mekong-Salween Divide’ is an important floristic boundary between the eastern Himalaya and Hengduan Mountains: Evidence from the phylogeographical structure of subnival herbs Marmoritis complanatum (Lamiaceae). Bot. J. Linn. Soc. 2017, 185, 482–496. [Google Scholar] [CrossRef]
  9. Luo, D.; Yue, J.P.; Sun, W.G.; Xu, B.; Li, Z.M.; Comes, H.P.; Sun, H. Evolutionary history of the subnival flora of the Himalaya-Hengduan Mountains: First insights from comparative phylogeography of four perennial herbs. J. Biogeogr. 2016, 43, 31–43. [Google Scholar] [CrossRef]
  10. Li, X.W.; Jie, L. The Tanaka-Kaiyong line—An important floristic line for the study of the flora of East Asia. Ann. Mo. Bot. Gard. 1997, 84, 888–892. [Google Scholar]
  11. Zhang, Q.; Chiang, T.Y.; George, M.; Liu, J.Q.; Abbott, R.J. Phylogeography of the Qinghai-Tibetan Plateau endemic Juniperus przewalskii (Cupressaceae) inferred from chloroplast DNA sequence variation. Mol. Ecol. 2005, 14, 3513–3524. [Google Scholar] [CrossRef] [PubMed]
  12. Yang, F.S.; Li, Y.F.; Ding, X.; Wang, X.Q. Extensive population expansion of Pedicularis longiflora (Orobanchaceae) on the Qinghai-Tibetan Plateau and its correlation with the Quaternary climate change. Mol. Ecol. 2008, 17, 5135–5145. [Google Scholar] [CrossRef]
  13. Yang, F.S.; Qin, A.L.; Li, Y.F.; Wang, X.Q. Great genetic differentiation among populations of Meconopsis integrifolia and its implication for plant speciation in the Qinghai-Tibetan Plateau. PLoS ONE 2012, 7, e37196. [Google Scholar] [CrossRef] [PubMed]
  14. Ren, G.P.; Mateo, R.G.; Liu, J.Q.; Suchan, T.; Alvarez, N.; Guisan, A.; Conti, E.; Salamin, N. Genetic consequences of Quaternary climatic oscillations in the Himalayas: Primula tibetica as a case study based on restriction site-associated DNA sequencing. New Phytol. 2017, 213, 1500–1512. [Google Scholar] [CrossRef]
  15. Lin, N.; Deng, T.; Moore, M.J.; Sun, Y.X.; Huang, X.H.; Sun, W.G.; Luo, D.; Wang, H.C.; Zhang, J.W.; Sun, H. Phylogeography of Parasyncalathium souliei (Asteraceae) and its potential application in delimiting phylogeoregions in the Qinghai-Tibet Plateau (QTP)-Hengduan Mountains (HDM) Hotspot. Front. Genet. 2018, 9, 171. [Google Scholar] [CrossRef] [PubMed]
  16. Yang, Q.S.; Wang, B.X.; Gao, L.; Xiong, H.B.; Tang, W. Ecological study on molecular phylogeography of Quercus aquifolioides, an endemic oak in SW China. Ekoloji 2019, 28, 899–914. [Google Scholar]
  17. Fritsch, P.W.; Lu, L.; Bush, C.M.; Cruz, B.C.; Kron, K.A.; Li, D.Z. Phylogenetic analysis of the Wintergreen Group (Ericaceae) based on six genic regions. Syst. Bot. 2011, 36, 990–1003. [Google Scholar] [CrossRef]
  18. Kron, K.A.; Judd, W.S.; Stevens, P.F.; Crayn, D.M.; Anderberg, A.A.; Gadek, P.A.; Quinn, C.J.; Luteyn, J.L. Phylogenetic classification of Ericaceae: Molecular and morphological evidence. Bot. Rev. 2002, 68, 335–423. [Google Scholar] [CrossRef]
  19. Middleton, D.J.; Wilcock, C.C. A critical examination of the status of Pernettya as a genus distinct from Gaultheria. Edinb. J. Bot. 1990, 47, 291–301. [Google Scholar] [CrossRef]
  20. Middleton, D.J. Infrageneric classification of the genus Gaultheria L (Ericaceae). Bot. J. Linn. Soc. 1991, 106, 229–258. [Google Scholar] [CrossRef]
  21. Lu, L.; Fritsch, P.W.; Bush, C.M.; Wang, H.; Kron, K.A.; Li, D.Z. Allopolyploidy in the Wintergreen Group of tribe Gaultherieae (Ericaceae) inferred from low-copy nuclear genes. Nord. J. Bot. 2019, 37, e02077. [Google Scholar] [CrossRef]
  22. Fritsch, P.W.; Zhou, L.; Lu, L.; Bartholomew, B. The flowering plant genus Gaultheria (Ericaceae) in the Gaoligong Shan, along the border region of China and Myanmar. Proc. Calif. Acad. Sci. 2008, 59, 147–214. [Google Scholar]
  23. Lu, L.; Fritsch, P.W.; Cruz, B.C.; Wang, H.; Li, D.Z. Reticulate evolution, cryptic species, and character convergence in the core East Asian clade of Gaultheria (Ericaceae). Mol. Phylogenet. Evol. 2010, 57, 364–379. [Google Scholar] [CrossRef] [PubMed]
  24. Fang, R.Z.; Stevens, P.F. Gaultheria. In Flora of China; Wu, Z.Y., Raven, P.H., Hong, D.Y., Eds.; Science Press: Beijing, China; Missouri Botanical Garden Press: St. Louis, MO, USA, 2005; Volume 14, pp. 464–475. [Google Scholar]
  25. Slentz, S.; Boyd, A.E.; McDade, L.A. Morphological differentiation among Madrean sky island populations of Castilleja austromontana (Scrophulariaceae). Madroño 1999, 46, 100–111. [Google Scholar]
  26. Mayr, E. Change of Genetic Environment and Evolution; Allen & Unwin: London, UK, 1954. [Google Scholar]
  27. Wright, S. Isolation by distance. Genetics 1943, 28, 114–138. [Google Scholar] [CrossRef] [PubMed]
  28. DeChaine, E.G.; Martin, A.P. Marked genetic divergence among sky island populations of Sedum lanceolatum (Crassulaceae) in the Rocky Mountains. Am. J. Bot. 2005, 92, 477–486. [Google Scholar] [CrossRef]
  29. Hewitt, G. The genetic legacy of the Quaternary ice ages. Nature 2000, 405, 907–913. [Google Scholar] [CrossRef]
  30. Hewitt, G.M. The structure of biodiversity—Insights from molecular phylogeography. Front. Zool. 2004, 1, 4. [Google Scholar] [CrossRef]
  31. Slatkin, M. Gene flow and the geographic structure of natural-populations. Science 1987, 236, 787–792. [Google Scholar] [CrossRef]
  32. Manel, S.; Holderegger, R. Ten years of landscape genetics. Trends Ecol. Evol. 2013, 28, 614–621. [Google Scholar] [CrossRef]
  33. Wiens, J.J.; Camacho, A.; Goldberg, A.; Jezkova, T.; Kaplan, M.E.; Lambert, S.M.; Miller, E.C.; Streicher, J.W.; Walls, R.L. Climate change, extinction, and Sky Island biogeography in a montane lizard. Mol. Ecol. 2019, 28, 2610–2624. [Google Scholar] [CrossRef]
  34. Hirao, A.S.; Shimono, Y.; Narita, K.; Wada, N.; Kudo, G. Ecotypic divergences of the alpine herb Potentilla matsumurae adapted to fellfield-snowbed habitats across a series of mountain sky islands. Am. J. Bot. 2019, 106, 772–787. [Google Scholar] [CrossRef]
  35. Fritsch, P.W.; Manchester, S.R.; Stone, R.D.; Cruz, B.C.; Almeda, F. Northern Hemisphere origins of the amphi-Pacific tropical plant family Symplocaceae. J. Biogeogr. 2015, 42, 891–901. [Google Scholar] [CrossRef]
  36. Huang, J.C.; Ge, X.J.; Sun, M. Modified CTAB protocol using a silica matrix for isolation of plant genomic DNA. Biotechniques 2000, 28, 432–434. [Google Scholar] [CrossRef] [PubMed]
  37. Porebski, S.; Bailey, L.G.; Baum, B.R. Modification of a CTAB DNA extraction protocol for plants containing high polysaccharide and polyphenol components. Plant Mol. Biol. Rep. 1997, 15, 8–15. [Google Scholar] [CrossRef]
  38. Zhang, M.Y.; Fritsch, P.W.; Ma, P.F.; Wang, H.; Lu, L.; Li, D.Z. Plastid phylogenomics and adaptive evolution of Gaultheria series Trichophyllae (Ericaceae), a clade from sky islands of the Himalaya-Hengduan Mountains. Mol. Phylogenet. Evol. 2017, 110, 7–18. [Google Scholar] [CrossRef] [PubMed]
  39. Katoh, K.; Standley, D.M. MAFFT multiple sequence alignment software version 7: Improvements in performance and usability. Mol. Biol. Evol. 2013, 30, 772–780. [Google Scholar] [CrossRef]
  40. Stamatakis, A.; Hoover, P.; Rougemont, J. A rapid bootstrap algorithm for the RAxML web servers. Syst. Biol. 2008, 57, 758–771. [Google Scholar] [CrossRef]
  41. Stamatakis, A. RAxML-VI-HPC: Maximum likelihood-based phylogenetic analyses with thousands of taxa and mixed models. Bioinformatics 2006, 22, 2688–2690. [Google Scholar] [CrossRef]
  42. Aubriot, X.; Soulebeau, A.; Haevermans, T.; Schatz, G.E.; Cruaud, C.; Lowry, P.P. Molecular phylogenetics of Sarcolaenaceae (Malvales), Madagascar’s largest endemic plant family. Bot. J. Linn. Soc. 2016, 182, 729–743. [Google Scholar] [CrossRef]
  43. Rozas, J.; Ferrer-Mata, A.; Sanchez-DelBarrio, J.C.; Guirao-Rico, S.; Librado, P.; Ramos-Onsins, S.E.; Sanchez-Gracia, A. DnaSP 6: DNA sequence polymorphism analysis of large data sets. Mol. Biol. Evol. 2017, 34, 3299–3302. [Google Scholar] [CrossRef]
  44. Bandelt, H.J.; Forster, P.; Rohl, A. Median-joining networks for inferring intraspecific phylogenies. Mol. Biol. Evol. 1999, 16, 37–48. [Google Scholar] [CrossRef]
  45. Pons, O.; Petit, R.J. Measuring and testing genetic differentiation with ordered versus unordered alleles. Genetics 1996, 144, 1237–1245. [Google Scholar] [CrossRef] [PubMed]
  46. Masatoshi, N. Molecular Population Genetics and Evolution; North-Holland Publishing Company: Amsterdam, The Netherlands, 1975. [Google Scholar]
  47. Excoffier, L.; Laval, G.; Schneider, S. Arlequin (version 3.0): An integrated software package for population genetics data analysis. Evol. Bioinform. 2005, 1, 47–50. [Google Scholar] [CrossRef]
  48. Beaumont, M.A. Adaptation and speciation: What can Fst tell us? Trends Ecol. Evol. 2005, 20, 435–440. [Google Scholar] [CrossRef]
  49. Miguel, I.; Iriondo, M.; Garnery, L.; Sheppard, W.S.; Estonba, A. Gene flow within the M evolutionary lineage of Apis mellifera: Role of the Pyrenees, isolation by distance and post-glacial re-colonization routes in the western Europe. Apidologie 2007, 38, 141–155. [Google Scholar] [CrossRef]
  50. Smouse, P.E.; Long, J.C.; Sokal, R.R. Multiple-regression and correlation extensions of the Mantel test of matrix correspondence. Syst. Zool. 1986, 35, 627–632. [Google Scholar] [CrossRef]
  51. Peakall, R.; Smouse, P.E. GENALEX 6: Genetic analysis in Excel. Population genetic software for teaching and research. Mol. Ecol. Notes 2006, 6, 288–295. [Google Scholar] [CrossRef]
  52. Fu, Y.X. Statistical tests of neutrality of mutations against population growth, hitchhiking and background selection. Genetics 1997, 147, 915–925. [Google Scholar] [CrossRef] [PubMed]
  53. Rogers, A.R.; Harpending, H. Population growth makes waves in the distribution of pairwise genetic differences. Mol. Biol. Evol. 1992, 9, 552–569. [Google Scholar] [PubMed]
  54. Slatkin, M.; Hudson, R.R. Pairwise comparisons of mitochondrial DNA sequences in stable and exponentially growing populations. Genetics 1991, 129, 555–562. [Google Scholar] [PubMed]
  55. Harpending, H.C. Signature of ancient population-growth in a low-resolution mitochondrial DNA mismatch distribution. Hum. Biol. 1994, 66, 591–600. [Google Scholar]
  56. Kawabe, A.; Yamane, K.; Miyashita, N.T. DNA polymorphism at the cytosolic phosphoglucose isomerase (PgiC) locus of the wild plant Arabidopsis thaliana. Genetics 2000, 156, 1339–1347. [Google Scholar] [CrossRef] [PubMed]
  57. Wolfe, K.H.; Li, W.H.; Sharp, P.M. Rates of nucleotide substitution vary greatly among plant mitochondrial, chloroplast, and nuclear DNAs. Proc. Natl. Acad. Sci. USA 1987, 84, 9054–9058. [Google Scholar] [CrossRef] [PubMed]
  58. Richardson, J.E.; Pennington, R.T.; Pennington, T.D.; Hollingsworth, P.M. Rapid diversification of a species-rich genus of neotropical rain forest trees. Science 2001, 293, 2242–2245. [Google Scholar] [CrossRef] [PubMed]
  59. Xu, N.; Meng, F.Y.; Zhou, G.F.; Li, Y.F.; Wang, B.; Lu, H. Assessing the suitable cultivation areas for Scutellaria baicalensis in China using the Maxent model and multiple linear regression. Biochem. Syst. Ecol. 2020, 90. [Google Scholar] [CrossRef]
  60. Lu, C.Y.; Gu, W.; Dai, A.H.; Wei, H.Y. Assessing habitat suitability based on geographic information system (GIS) and fuzzy: A case study of Schisandra sphenanthera Rehd. et Wils. in Qinling Mountains, China. Ecol. Modell. 2012, 242, 105–115. [Google Scholar] [CrossRef]
  61. Mousazade, M.; Ghanbarian, G.; Pourghasemi, H.R.; Safaeian, R.; Cerda, A. Maxent data mining technique and its comparison with a bivariate statistical model for predicting the potential distribution of Astragalus fasciculifolius Boiss. in Fars, Iran. Sustainability 2019, 11, 3452. [Google Scholar] [CrossRef]
  62. Phillips, S.J.; Anderson, R.P.; Schapire, R.E. Maximum entropy modeling of species geographic distributions. Ecol. Modell. 2006, 190, 231–259. [Google Scholar] [CrossRef]
  63. Yang, X.Q.; Kushwaha, S.P.S.; Saran, S.; Xu, J.C.; Roy, P.S. Maxent modeling for predicting the potential distribution of medicinal plant, Justicia adhatoda L. in Lesser Himalayan foothills. Ecol. Eng. 2013, 51, 83–87. [Google Scholar] [CrossRef]
  64. Lobo, J.M.; Jimenez-Valverde, A.; Real, R. AUC: A misleading measure of the performance of predictive distribution models. Global Ecol. Biogeogr. 2008, 17, 145–151. [Google Scholar] [CrossRef]
  65. Fielding, A.H.; Bell, J.F. A review of methods for the assessment of prediction errors in conservation presence/absence models. Environ. Conserv. 1997, 24, 38–49. [Google Scholar] [CrossRef]
  66. Swets, J.A. Measuring the accuracy of diagnostic systems. Science 1988, 240, 1285–1293. [Google Scholar] [CrossRef] [PubMed]
  67. Wei, Y.Q.; Zhang, L.; Wang, J.N.; Wang, W.W.; Niyati, N.; Guo, Y.L.; Wang, X.F. Chinese caterpillar fungus (Ophiocordyceps sinensis) in China: Current distribution, trading, and futures under climate change and overexploitation. Sci. Total Environ. 2021, 755, 142548. [Google Scholar] [CrossRef] [PubMed]
  68. Marmion, M.; Luoto, M.; Heikkinen, R.K.; Thuiller, W. The performance of state-of-the-art modelling techniques depends on geographical distribution of species. Ecol. Modell. 2009, 220, 3512–3520. [Google Scholar] [CrossRef]
  69. Drummond, A.J.; Suchard, M.A.; Xie, D.; Rambaut, A. Bayesian phylogenetics with BEAUti and the BEAST 1.7. Mol. Biol. Evol. 2012, 29, 1969–1973. [Google Scholar] [CrossRef] [PubMed]
  70. Darriba, D.; Taboada, G.L.; Doallo, R.; Posada, D. jModelTest 2: More models, new heuristics and parallel computing. Nat. Methods 2012, 9, 772. [Google Scholar] [CrossRef] [PubMed]
  71. Lu, L.; Fritsch, P.W.; Matzke, N.J.; Wang, H.; Kron, K.A.; Li, D.Z.; Wiens, J.J. Why is fruit colour so variable? Phylogenetic analyses reveal relationships between fruit-colour evolution, biogeography and diversification. Global Ecol. Biogeogr. 2019, 28, 891–903. [Google Scholar] [CrossRef]
  72. Xiang, Q.Y.; Thomas, D.T.; Xiang, Q.P. Resolving and dating the phylogeny of Cornales—Effects of taxon sampling, data partitions, and fossil calibrations. Mol. Phylogenet. Evol. 2011, 59, 123–138. [Google Scholar] [CrossRef] [PubMed]
  73. Rambaut, A.; Drummond, A.J. Tracer, V1.6. Available online: http://tree.bio.ed.ac.uk/software/tracer/ (accessed on 4 July 2022).
  74. Tian, B.; Zhou, Z.L.; Du, F.K.; He, C.Z.; Xin, P.Y.; Ma, H.C. The Tanaka Line shaped the phylogeographic pattern of the cotton tree (Bombax ceiba) in southwest China. Biochem. Syst. Ecol. 2015, 60, 150–157. [Google Scholar] [CrossRef]
  75. Yue, L.L.; Chen, G.; Sun, W.B.; Sun, H. Phylogeography of Buddleja crispa (Buddlejaceae) and its correlation with drainage system evolution in Southwestern China. Am. J. Bot. 2012, 99, 1726–1735. [Google Scholar] [CrossRef]
  76. Zhang, L.; Sun, W.B.; Wang, Z.L.; Guan, K.Y.; Yang, J.B. Isolation and characterization of microsatellite loci for Hibiscus aridicola (Malvaceae), an endangered plant endemic to the dry-hot valleys of Jinsha River in Southwest China. Int. J. Mol. Sci. 2011, 12, 5698–5704. [Google Scholar] [CrossRef] [PubMed]
  77. Vasquez, D.L.A.; Balslev, H.; Hansen, M.M.; Sklenar, P.; Romoleroux, K. Low genetic variation and high differentiation across sky island populations of Lupinus alopecuroides (Fabaceae) in the northern Andes. Alpine Bot. 2016, 126, 135–142. [Google Scholar] [CrossRef]
  78. Sekar, S.; Karanth, P. Flying between Sky Islands: The effect of naturally fragmented habitat on butterfly population structure. PLoS ONE 2013, 8, e71573. [Google Scholar] [CrossRef] [PubMed]
  79. Jiang, C.; Tan, K.; Ren, M.X. Effects of monsoon on distribution patterns of tropical plants in Asia. Chin. J. Plant Ecol. 2017, 10, 1103–1112. [Google Scholar]
  80. Roy, A.B.; Purohit, R. Chapter 17—The Himalayas: Evolution through collision. In Indian Shield; Roy, A.B., Purohit, R., Eds.; Elsevier: Amsterdam, The Netherlands, 2018; pp. 311–327. [Google Scholar]
  81. Zhao, L.F.; Li, L.; Liao, J.; Dong, S.X.; Liang, Y.L.; Gao, R. Shear-wave velocity reveals heterogeneous geometry of the main Himalayan thrust system and deep structure beneath the Nepal Himalayas. Geochem. Geophys. Geosyst. 2022, 23, e2021GC010263. [Google Scholar] [CrossRef]
  82. Garg, P.K.; Shukla, A.; Jasrotia, A.S. On the strongly imbalanced state of glaciers in the Sikkim, eastern Himalaya, India. Sci. Total Environ. 2019, 691, 16–35. [Google Scholar] [CrossRef] [PubMed]
  83. Bhattari, S.; Chhetri, D.B. Ecosystem Profile Eastern Himalayas Region; WWF-US, Asia Program: Washington, DC, USA, 2005; pp. 1–97. Available online: https://www.cepf.net/sites/default/files/final.ehimalayas.ep_.pdf (accessed on 4 July 2022).
  84. Zhang, T.G.; Wang, W.C.; Gao, T.G.; An, B.S.; Yao, T.D. An integrative method for identifying potentially dangerous glacial lakes in the Himalayas. Sci. Total Environ. 2022, 806, 150442. [Google Scholar] [CrossRef] [PubMed]
  85. Ou, X.J.; Lai, Z.P.; Zhou, S.Z.; Zeng, L.H. Timing of glacier fluctuations and trigger mechanisms in eastern Qinghai-Tibetan Plateau during the late Quaternary. Quat. Res. 2014, 81, 464–475. [Google Scholar] [CrossRef]
  86. Bolch, T.; Kulkarni, A.; Kaab, A.; Huggel, C.; Paul, F.; Cogley, J.G.; Frey, H.; Kargel, J.S.; Fujita, K.; Scheel, M.; et al. The state and fate of Himalayan glaciers. Science 2012, 336, 310–314. [Google Scholar] [CrossRef]
  87. Sgorbati, S.; Labra, M.; Grugni, E.; Barcaccia, G.; Galasso, G.; Boni, U.; Mucciarelli, M.; Citterio, S.; Iramategui, A.B.; Gonzales, L.V.; et al. A survey of genetic diversity and reproductive biology of Puya raimondii (Bromeliaceae), the endangered queen of the Andes. Plant Biol. 2004, 6, 222–230. [Google Scholar] [CrossRef] [PubMed]
  88. Salerno, P.E.; Senaris, J.C.; Rojas-Runjaic, F.J.M.; Cannatella, D.C. Recent evolutionary history of Lost World endemics: Population genetics, species delimitation, and phylogeography of sky-island treefrogs. Mol. Phylogenet. Evol. 2015, 82, 314–323. [Google Scholar] [CrossRef] [PubMed]
  89. Spurgin, L.G.; Illera, J.C.; Jorgensen, T.H.; Dawson, D.A.; Richardson, D.S. Genetic and phenotypic divergence in an island bird: Isolation by distance, by colonization or by adaptation? Mol. Ecol. 2014, 23, 1028–1039. [Google Scholar] [CrossRef] [PubMed]
  90. Hoeck, P.E.A.; Bollmer, J.L.; Parker, P.G.; Keller, L.F. Differentiation with drift: A spatio-temporal genetic analysis of Galapagos mockingbird populations (Mimus spp.). Philos. Trans. R. Soc. B Biol. Sci. 2010, 365, 1127–1138. [Google Scholar] [CrossRef] [PubMed]
  91. Beheregaray, L.B.; Ciofi, C.; Caccone, A.; Gibbs, J.P.; Powell, J.R. Genetic divergence, phylogeography and conservation units of giant tortoises from Santa Cruz and Pinzon, Galapagos Islands. Conserv. Genet. 2003, 4, 31–46. [Google Scholar] [CrossRef]
  92. Carson, H.L. Increased genetic variance after a population bottleneck. Trends Ecol. Evol. 1990, 5, 228–230. [Google Scholar] [CrossRef]
  93. Carson, H.L.; Templeton, A.R. Genetic revolutions in relation to speciation phenomena—The founding of new populations. Annu. Rev. Ecol. Syst. 1984, 15, 97–131. [Google Scholar] [CrossRef]
  94. Schaal, B.A.; Hayworth, D.A.; Olsen, K.M.; Rauscher, J.T.; Smith, W.A. Phylogeographic studies in plants: Problems and prospects. Mol. Ecol. 1998, 7, 465–474. [Google Scholar] [CrossRef]
  95. Higashi, H.; Sakaguchi, S.; Ikeda, H.; Isagi, Y.; Setoguchi, H. Multiple introgression events and range shifts in Schizocodon (Diapensiaceae) during the Pleistocene. Bot. J. Linn. Soc. 2013, 173, 46–63. [Google Scholar] [CrossRef]
  96. Gugger, P.F.; Sugita, S.; Cavender-Bares, J. Phylogeography of Douglas-fir based on mitochondrial and chloroplast DNA sequences: Testing hypotheses from the fossil record. Mol. Ecol. 2010, 19, 1877–1897. [Google Scholar] [CrossRef] [PubMed]
  97. Dixon, C.J.; Schonswetter, P.; Schneeweiss, G.M. Traces of ancient range shifts in a mountain plant group (Androsace halleri complex, Primulaceae). Mol. Ecol. 2007, 16, 3890–3901. [Google Scholar] [CrossRef]
  98. Chen, J.H.; Huang, Y.; Brachi, B.; Yun, Q.Z.; Zhang, W.; Lu, W.; Li, H.N.; Li, W.Q.; Sun, X.D.; Wang, G.Y.; et al. Genome-wide analysis of Cushion willow provides insights into alpine plant divergence in a biodiversity hotspot. Nat. Commun. 2019, 10, 5230. [Google Scholar] [CrossRef]
  99. Gao, Q.B.; Zhang, F.Q.; Xing, R.; Gornall, R.J.; Fu, P.C.; Li, Y.; Gengji, Z.M.; Chen, S.L. Phylogeographic study revealed microrefugia for an endemic species on the Qinghai-Tibetan Plateau: Rhodiola chrysanthemifolia (Crassulaceae). Plant Syst. Evol. 2016, 302, 1179–1193. [Google Scholar] [CrossRef]
  100. Rana, H.K.; Luo, D.; Rana, S.K.; Sun, H. Geological and climatic factors affect the population genetic connectivity in Mirabilis himalaica (Nyctaginaceae): Insight From phylogeography and dispersal corridors in the Himalaya-Hengduan biodiversity hotspot. Front. Plant Sci. 2020, 10. [Google Scholar] [CrossRef] [PubMed]
  101. Rana, S.K.; Luo, D.; Rana, H.K.; O’Neill, A.R.; Sun, H. Geoclimatic factors influence the population genetic connectivity of Incarvillea arguta (Bignoniaceae) in the Himalaya-Hengduan Mountains biodiversity hotspot. J. Syst. Evol. 2021, 59, 151–168. [Google Scholar] [CrossRef]
  102. Jia, Y.; Milne, R.I.; Zhu, J.; Gao, L.M.; Zhu, G.F.; Zhao, G.F.; Liu, J.; Li, Z.H. Evolutionary legacy of a forest plantation tree species (Pinus armandii): Implications for widespread afforestation. Evol. Appl. 2020, 13, 2646–2662. [Google Scholar] [CrossRef]
  103. Wang, Z.W.; Chen, S.T.; Nie, Z.L.; Zhang, J.W.; Zhou, Z.; Deng, T.; Sun, H. Climatic factors drive population divergence and demography: Insights based on the phylogeography of a riparian plant species endemic to the Hengduan Mountains and adjacent regions. PLoS ONE 2015, 10, e0145014. [Google Scholar] [CrossRef]
  104. Shepard, D.B.; Burbrink, F.T. Lineage diversification and historical demography of a sky island salamander, Plethodon ouachitae, from the Interior Highlands. Mol. Ecol. 2008, 17, 5315–5335. [Google Scholar] [CrossRef]
  105. Wiens, J.J.; Graham, C.H. Niche conservatism: Integrating evolution, ecology, and conservation biology. Annu. Rev. Ecol. Evol. Syst. 2005, 36, 519–539. [Google Scholar] [CrossRef]
  106. Wiens, J.J. The role of morphological data in phylogeny reconstruction. Syst. Biol. 2004, 53, 653–661. [Google Scholar] [CrossRef]
  107. Hewitt, G.M. Some genetic consequences of ice ages, and their role in divergence and speciation. Biol. J. Linn. Soc. 1996, 58, 247–276. [Google Scholar] [CrossRef]
  108. Liang, Q.L.; Xu, X.T.; Mao, K.S.; Wang, M.C.; Wang, K.; Xi, Z.X.; Liu, J.Q. Shifts in plant distributions in response to climate warming in a biodiversity hotspot, the Hengduan Mountains. J. Biogeogr. 2018, 45, 1334–1344. [Google Scholar] [CrossRef]
  109. Dullinger, S.; Gattringer, A.; Thuiller, W.; Moser, D.; Zimmermann, N.E.; Guisan, A.; Willner, W.; Plutzar, C.; Leitner, M.; Mang, T.; et al. Extinction debt of high-mountain plants under twenty-first-century climate change. Nat. Clim. Chang. 2012, 2, 619–622. [Google Scholar] [CrossRef]
  110. Lande, R. Risks of population extinction from demographic and environmental stochasticity and random catastrophes. Am. Nat. 1993, 142, 911–927. [Google Scholar] [CrossRef] [PubMed]
  111. Elsen, P.R.; Tingley, M.W. Global mountain topography and the fate of montane species under climate change. Nat. Clim. Chang. 2015, 5, 772–776. [Google Scholar] [CrossRef]
  112. Wang, Y.H.; Lu, L.; Wang, Y.H.; Wang, H. Evaluation and utilization of germplasm resources of Gaultheria L. in China. J. Yunnan Univ. Nat. Sci. Ed. 2013, 35, 378–389+410. [Google Scholar]
  113. Fave, M.J.; Johnson, R.A.; Cover, S.; Handschuh, S.; Metscher, B.D.; Muller, G.B.; Gopalan, S.; Abouheif, E. Past climate change on Sky Islands drives novelty in a core developmental gene network and its phenotype. BMC Evol. Biol. 2015, 15, 183. [Google Scholar] [CrossRef]
  114. Boyd, A. Morphological analysis of Sky Island populations of Macromeria viridiflora (Boraginaceae). Syst. Bot. 2002, 27, 116–126. [Google Scholar]
Figure 1. Phenotypic diversity of Gaultheria nummularioides. For population code and voucher details see Table S1. Text in parentheses refers to the population voucher code. (A,B), population HLG (L. Lu et al. LL-2011-27): (A), prostrate habit and bluish black fruits, (B), white narrowly urceolate corolla; (C,D), Population TQ (L. Lu et al. LL-2011-38): (C), subrhombic to orbicular leaf blades, (D), purple immature fruits with exposed style, and branches and abaxial leaves with indumentum; (E,F), Population GS-3 (L. Lu et al. LL-2013-29): (E), ovate to subrhombic leaf blades, densely hirsute on abaxial surface (bottom right), (F), white narrowly urceolate corolla; (G,H), Population GS-2 (L. Lu et al. LL-2013-24): (G), prostrate habit and bluish black fruits, (H), bluish black fruits with long calyx lobes and occluded style; (IK), Population LSD (L. Lu et al. LL-2014-32): (I), prostrate habit with small ovate leaves, sparsely hirsute on abaxial surface (bottom right), (J), deep pink broadly urceolate corolla, (K), whitish pink broadly urceolate corolla; (L,M), Population DXL (L. Lu et al. LL-07096): (L), prostrate habit with small ovate leaves, (M), light pink broadly urceolate corolla; (N,O), Population NDL (L. Lu et al., LL-2018-15): (N), branches, and abaxial surface and margins of leaves with indumentum, (O), whitish red broadly urceolate corollas.
Diversity 14 00652 g001
Figure 2. Maximum likelihood (ML) tree of Gaultheria nummularioides with one-individual sampling for each population based on 22 cpDNA regions. The numbers above each branch represent ML bootstrap values. CH, EH, WHM, and EHM represent the central Himalaya, eastern Himalaya, western Hengduan Mountains, and eastern Hengduan Mountains, respectively. GS, Population GS (voucher: L. Lu et al., 2006-01-21); YW, Population YW (L. Lu et al., LL-07010); JD, Population JD (L. Lu et al., 06-18A); HLG, Population HLG (L. Lu et al. LL-2011-27); BX, Population BX (L. Lu et al. LL-2011-43); TQ, Population TQ (L. Lu et al. LL-2011-38); DXL, Population DXL (L. Lu et al. LL-07096); YD, Population YD (L. Lu et al. GLM-102752); GS-2, Population GS-2 (L. Lu et al. LL-2013-24); GS-3, Population GS-3 (L. Lu et al. LL-2013-29); YZ, Population YZ (L. Lu et al. LL-2014-57); DZA, Population DZA (L. Lu et al. LL-2014-14A); DZB, Population DZB (L. Lu et al. LL-2014-14B); DLJ, Population DLJ (L. Lu et al. LL-2014-26); LSD, Population LSD (L. Lu et al. LL-2014-32); MD, Population MD (L. Lu et al. LL-2018-7); NDL, Population NDL (L. Lu et al. LL-2018-15); PZL, Population PZL (L. Lu et al. LL-2018-17); SD, Population SD (L. Lu et al. LL-2018-18).
Diversity 14 00652 g002
Figure 3. The geographic distribution and network of the 19 cpDNA haplotypes of Gaultheria nummularioides based on the combined data of psbK-psbI and trnV-GAC. (A), haplotype geographic distribution; (B), haplotype network with frequency denoted by the size of the circle, and each branch representing one mutation.
Diversity 14 00652 g003
Figure 4. The distributions of suitable habitat of Gaultheria nummularioides of different time periods with MaxEnt ecological niche modeling based on mean diurnal range, isothermality, minimum temperature of the coldest month, temperature annual range, precipitation of wettest month, precipitation of driest month, and coefficient of variation of precipitation seasonality. (AD) represent the Last Interglacial, Last Glacial Maximum, Current, and 2070s, respectively.
Diversity 14 00652 g004
Figure 5. Divergence time estimation among populations of Gaultheria nummularioides. The majority-rule chronogram generated from divergence time analysis of 19 haplotypes in G. nummularioides. Divergence times estimates are in boldface and their 95% HPD values are in parentheses above the branches.
Diversity 14 00652 g005
Table 1. Genetic diversity indices and genetic differentiation values of groups and overall (all populations) in Gaultheria nummularioides. Populations were divided into six basic groups in three ways, based on geographical distance and the trend of mountains: CH from the central Himalaya, EH + WHM + EHM from the eastern Himalaya plus the Hengduan Mountains, CH + EH from the Himalaya, WHM + EHM from the Hengduan Mountains, EH + WHM from the eastern Himalaya plus the western Hengduan Mountains, and EHM from the eastern Hengduan Mountains. Standard errors are shown in parentheses; HS represents average within-population genetic diversity and HT represents total genetic diversity; genetic differentiation coefficients between populations are represented by GST and NST and haplotype diversity (Hd) and nucleotide diversity (π) of groups in G. nummularioides are also presented. NC = not significant; r2 = Mantel correlation coefficient, * p < 0.05; “-” = no values.
Group SetsGroupsHSHTGSTNSTHdπr2
Grouping set I
based on geographical distance
CH0.479 (0.043)0.501 (0.045)0.044 (NC)0.107 (NC)0.4930.001-
EH + WHM + EHM0.297 (0.081)0.801 (0.063)0.630 (0.101)0.706 (0.092)0.7860.002-
Grouping set II
based on geographical distance
CH0.479 (0.043)0.501 (0.045)0.044 (NC)0.107 (NC)0.4930.001-
EH + WHM0.398 (0.092)0.758 (0.081)0.475 (0.109)0.600 (0.104)0.7540.002-
EHM0.044 (0.044)0.667 (0.250)0.933 (NC)0.968 (NC)0.4750.002-
Grouping set III
based on geographical trend of mountains
CH + EH 0.440 (0.110)0.773 (0.083)0.431 (0.162)0.909 (0.033)0.7210.007-
WHM + EHM0.284 (0.083)0.747 (0.076)0.620 (0.112)0.671 (0.107)0.7330.002-
All populationsOverall0.326 (0.065)0.860 (0.041)0.620 (0.075)0.890 (0.032)0.8450.0070.086 *
Table 2. Results of AMOVA analyses of groups. Populations were divided into six basic groups in Table 2. FSC represents variance within groups; FCT represents variance among groups * = p < 0.05.
Group SetsSource of VariationSum of Squares (SS)Variance ComponentsPercentage of VariationFixation Index
Grouping set I
CH, EH + WHM + EHM
Among groups399.293.562 Va85.30FCT = 0.853 *
Among populations within groups100.060.398 Vb9.53FSC = 0.648 *
Within populations54.680.216 Vc5.17FST = 0.948 *
Grouping set II
CH, EH + WHM, EHM
Among groups356.572.338 Va80.55FCT = 0.806 *
Among populations within groups82.790.348 Vb12.00FSC = 0.617 *
Within populations54.670.216 Vc7.44FST = 0.926 *
Grouping set III
CH + EH, WHM + EHM
Among groups195.081.495 Va55.30FCT = 0.553 *
Among populations within groups244.270.992 Vb36.71FSC = 0.821 *
Within populations54.670.216 Vc7.99FST = 0.920 *
Table 3. Results of neutral test and mismatch analyses of groups. Populations were divided into six basic groups in three ways based on geographical distance and the trend of mountains: CH from the central Himalaya, EH + WHM + EHM from the eastern Himalaya plus the Hengduan Mountains, CH + EH from the Himalaya, WHM + EHM from the Hengduan Mountains, EH + WHM from the eastern Himalaya plus the western Hengduan Mountains, and EHM from the eastern Hengduan Mountains. Tajima’s D represents the site-frequency spectrum for single-nucleotide polymorphism loci; Fu’s Fs represents the deviation from neutral expectation in populations; HRag and SSD are both used to evaluate the sudden expansion model of unimodal distribution, and tau (τ) represents the unit of mutational time of unimodal distribution; * = p < 0.05.
Group SetsGroupsNeutrality TestsMismatch Analysis
Dp ValueFu’s FSp ValueSSDp ValueHRagp ValueTau
Grouping set I
based on geographical distance
CH−1.120.092−2.6890.0540.0090.0600.1410.1800.680
EH + WHM + EHM−0.5070.320−4.9520.0600.006 *0.030 0.078 *0.0101.463
Grouping set II
based on geographical distance
CH−1.120.092−2.6890.0540.0090.0600.1410.1800.680
EH + WHM−0.4110.348−4.5270.0550.012 *0.010 0.076 *0.0301.469
EHM0.8500.6731.8750.9190.185 *0.040 0.592 *0.0101.984
Grouping set III
based on geographical trend of mountains
CH + EH1.1000.7992.5960.9080.1120.0500.1190.28011.029
WHM + EHM−0.1580.438−2.5420.1680.006 *0.030 0.089 *0.0001.240
All populationsOverall0.1850.581−1.0780.4180.0430.4000.0470.6209.771
Table 4. Contribution rates of seven environmental variables.
VariableDescriptionContribution (%)Permutation Importance
Bio2Mean diurnal range5.66.5
Bio3Isothermality14.28.1
Bio6Minimum temperature of coldest month27.326.5
Bio7Temperature annual range 44.555.5
Bio13Precipitation of the wettest month3.80.8
Bio14Precipitation of the driest month4.52.6
Bio15Coefficient of variation of precipitation seasonality00
Publisher’s Note: MDPI stays neutral with regard to jurisdictional claims in published maps and institutional affiliations.

