Abstract
Oceanic currents, biological traits, and geological evidence from historical climate change have shaped the distribution of genetic diversity and demographic history in Macrobrachium japonicum. In this study, we investigated the phylogeographic structures and demographic history of M. japonicum in Taiwan and the Ryukyu Islands by the partial mitochondrial COI gene. The topology of the haplotype minimum-spanning network revealed a star-like structure, which suggested a recent range expansion. With the apparent lack of strong dispersal barriers to gene flow between ocean basins, amphidromous prawns, as marine organisms with larvae of high dispersal abilities, are generally expected to show genetic homogeneity. Divergence data suggested that M. japonicum populations diverged 0.462 ± 0.164 myr. Complex patterns of asymmetrical gene flow indicate that variation in dispersal ability is affected by the dominant Kuroshio Current systems of the Pacific Ocean. Analysis of its demographic history revealed that M. japonicum underwent a decline in size following a recent population expansion based on ABC analysis. Bayesian skyline plot analyses of all populations indicated that the expansion of M. japonicum was estimated to have occurred in 175 Kya and that the effective population size rapidly increased by approximately 50 Kya. The results of this study may offer both practical and theoretical value for the further study of conservation genetics, management, and sustainable resource utilization.
1. Introduction
Oceanic currents, biological traits (e.g., effective dispersal capability and life cycle), and geological evidence from historical climate change (e.g., sea-level oscillations during glacial cycles) have proven to be important contributing factors to the phylogeographic structure, historical demography, and genetic diversity of coastal marine systems [1]. The northwest Pacific, which is a marine biodiversity hotspot [2] and a large coastal ocean region characterized by the presence of unique tectonic and hydrologic features [3], provides a natural resource for investigating the underlying mechanisms contributing to determining whether and how species shift geographical ranges in response to marine diversification and speciation. During major glaciations, the northwestern (NW) Pacific became partly continuous landmasses, including the East China Sea (ECS), the Taiwan Strait, and the South China Sea (SCS), due to a sea level decline of approximately 120–140 m. The emergence of the Taiwan Strait as a barrier is one of the important factors that shaped current phylogeographical patterns and the existence of two deep lineages in marine species, such as the Chinese four-eyed sleeper (Bostrychus sinensis) [4], spadenose shark (Scoliodon macrorhynchos) [5], spotted scat (Scatophagus argus) [6], cutlassfish (Lepturacanthus savala) [7], and yellowbelly threadfin bream (Nemipterus bathybius) [8]. The dynamic oceanographic system in the northwest Pacific has been postulated to affect the phylogeographic structure across multiple marine organisms. In general, the migration of marine organisms can be passively dispersed by ocean currents over long distances and produce genetically homogeneous populations. The Kuroshio Current (KC) in the Asia Northwest Pacific (ANP) is characterized by warm sea surface temperatures and high productivity levels, originating from the Philippines to the Pacific coast of southern mainland Japan via Taiwan and the southern tip of the Ryukyu Islands. Meanwhile, the Taiwan Warm Current (a branch of the Kuroshio Current) flows northward to the Taiwan Strait and meets the southward-running China Coastal Current (CCC). Meanwhile, some phylogeographic studies have shown a lower genetic structure with high levels of gene flow, such as in bigeye tuna (Thunnus obesus) [9], Chinese beard eel (Cirrhimuraena chinensis) [10], and the large yellow croaker (Larimichthys crocea) [11].
Freshwater prawns of the genus Macrobrachium Bate, 1868 (Decapoda: Palaemonidae) are a highly diverse group of decapod crustaceans and can be ecologically separated into two types of life cycles, including land-locked prawns with limited distributions, which complete their life cycle within freshwater environments; the others are amphidromous, distributed in freshwater residents, and require a certain concentration (i.e., 10% to 35%) of larval development in estuarine or marine environments [12]. There was a total of l6 species of Macrobrachium reported in Taiwan, of which M. asperulum was a land-locked species and the others were amphidromous [13]. Life history strategies determine the levels of connection among populations of freshwater species, and recent comparative phylogeographic studies have investigated their relative importance in motivating the pursuit of the biogeographic history of various Macrobrachium species [14,15]. The movement of land-locked species in Macrobrachium, spending its entire life cycle in inland freshwater habitats, will be strongly affected by river ranges. As a consequence, there is no gene flow between effective physical barriers and a highly structured phylogeography is exhibited. A preliminary study on the phylogeography of land-locked M. asperulum in Taiwan was carried out and revealed four divergent clades in three geographical regions. However, the phylogeography of the facultatively amphidromous (M. nipponense) revealed two distinct lineages (A and B), and both individuals from lineages A and B could be found in most sampling sites in Taiwan [14]. Previous studies suggested that the life-history strategy was the principal mechanism that determined the scale of genetic structuring within a species and proposed the two dispersal routes of M. asperulum and M. nipponense from mainland China to Taiwan [14,15]. However, the genetic structuring of amphidromous Macrobrachium populations in Taiwan remains unclear. M. japonicum is an amphidromous species with early life stages that depend on estuarine or brackish waters to complete their development and has a high fecundity and relatively small eggs at maturity [16]. The larval phase as a planktonic stage and passively drift to the ocean is the dominant dispersal stage when considering population connectivity in marine systems and colonization of new suitable habitats [17]. M. japonicum is only one species of the Genus Macrobrachium, and was termed the Kuroshio type in Taiwan owing to the distribution pattern found in Taiwan, Ryukyu, and Japan [13,18]. In previous studies, the Kuroshio Current flows were the active transport mechanism of amphidromous prawns in the Ryukyu Islands (e.g., Caridina [17,19]). Moreover, the phylogenetic process of Macrobrachium on Taiwan and Ryukyu has not been effectively and reasonably explained, and there are no studies on the population relationship between Taiwan and Ryukyu Island. In the present study, to address the abovementioned issues, we used the mitochondrial COI gene to establish phylogeographic patterns in Taiwan and Ryukyu Island. Three major goals were to (1) determine the genetic diversity and genetic structure of M. japonicum, (2) reconstruct the phylogeographic patterns of M. japonicum and understand the events that led to their current distribution, and (3) investigate whether the population dynamics and demographic history of M. japonicum occurred during repeated climate changes in the Quaternary period.
2. Materials and Methods
2.1. Sample Collection and Sequencing
The partial mitochondrial COI gene, which was 644 base pairs (bp) long, was sequenced from 234 specimens of Macrobrachium japonicum collected from thirteen localities in Taiwan and Ryukyu Island (Table 1 and Figure 1). The thirteen populations belonged to four regions according to phylogeographical distribution (M. asperulum [15]): Japan (Ryukyu Island, OK), Northwest Taiwan Island (Lanyang River, LY; Danshui River, DS), West Taiwan Island (Taan River, TA; Dajia River, DJ; Choshui River, CS), and Southeast Taiwan Island (Kaoping River, KP; Sizhong River, SI; Hualien River, HD; Hsiukuluan River, SK; Beinan River, BN; Dawu River, DW; Gangkou River, GK) (Table 1 and Figure 1). Location information and sample numbers are provided in Table 1. Samples were collected from the field sites with seines, fatally anesthetized with MS-222 (Sigma, St. Louis, MO, USA), with the identification of species based on morphological characteristics [20], and they were fixed and stored in 100% ethanol. All animal experiments were performed in the laboratory of Chiao-Chuan Han, National Museum of Marine Biology and Aquarium, and were carried out following the guidelines and approval of the Animal Research and Ethics Committee of the National Museum of Marine Biology and Aquarium. In Taiwan, the use of prawn as experimental animals does not require a license. Genomic DNA was extracted from muscle tissue using an Axygen™ Multisource Genomic DNA Miniprep Kit (Axygen). The partial mitochondrial COI gene was amplified by polymerase chain reaction (PCR) using the primers MLCO1490 (5′- GGTCAACAAACCATAAAGACATTGG -3′) and MHCO2198 (5′- TATACTTCTGGGTGCCCAAAGAATCA -3′) [21]. Polymerase chain reaction (PCR) was carried out in a total volume of 25 μL following the conditions described in Han et al. [22]. The PCR products were subjected to commercial bidirectional sequencing using the same primers as for PCR and run on an ABI 377 automated sequencer (Applied Biosystems, Foster City, CA, USA).

Table 1.
List of sampling locations and the sample sizes, the number of haplotypes, haplotype diversities, and nucleotide diversities of the partial mtDNA COI region sequences for each location.
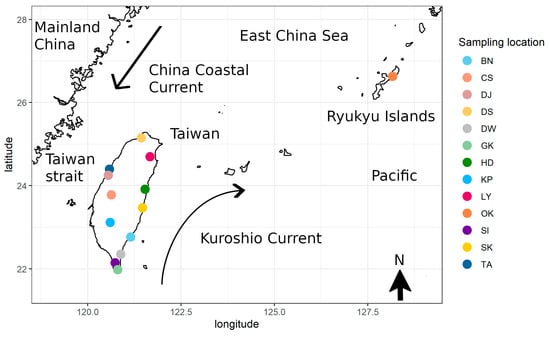
Figure 1.
The locations of Macrobrachium japonicum samples in this study.
2.2. Sequence Alignment and Data Analysis
The partial cytochrome c oxidase subunit I (COI) gene of mitochondrial DNA was edited for alignment using CLUSTAL X software [23]. The genetic diversity of each population, including the number of haplotypes (N), haplotype diversity (h), private haplotypes (ph), nucleotide diversity (θ(π)) [24], and nucleotide diversity (θ (ω)) [25], was calculated using DnaSP v5.0 software [26]. Pairwise FST values and analysis of molecular variance (AMOVA) were calculated in Arlequin v3.5 [27] to examine the spatial partitioning of genetic variation among populations. For the hierarchical analysis, populations were grouped and defined based on geographical factors: (1) two geographical groups, Taiwan and Ryukyu island, were primarily divided by the strait; (2) three geographical groups, Ryukyu island, West Taiwan (Taiwan Strait), and East Taiwan (Pacific Ocean), were primarily divided by the ocean region; and (3) four geographical groups, Ryukyu island, Northwest Taiwan Island, West Taiwan Island, and Southeast Taiwan Island, were primarily divided by the phylogeographical region. Haplotypes were constructed using the program Pop art 1.7 software based on the minimum-spanning haplotype network (MSN) [28].
2.3. Historical Demography, Divergence Time Estimation, and Biogeographic Analysis
Historical demographic scenarios were analyzed using Tajima’s D test [29] and Fu’s Fs test [30] to test the assumption of neutrality, and mismatch distributions were computed in DnaSP v5.0 [26]. To determine the effective population size changes over time, Bayesian skyline plot (BSP) analyses were conducted in BEAST v1.8.2 for each lineage in M. japonicum [31]. We ran >200,000,000 MCMC iterations to ensure the convergence of all parameters (ESSs > 200); the first 10% of samples for each chain were discarded as burn-in. Plots for each analysis were generated using Tracer v1.5 [32]. In addition, we calculated the time to the most recent common ancestor (TMRCA) using BEAST v1.8.2 software [31]. In this study, a mutation rate of 2.33% per million years was calibrated for the mtDNA partial COI genes in Neocaridina for population expansion [33,34]. We used MIGRATE v3.2.6 [35] to determine the direction of the historical migration rate (M = m/μ, where m = migration rate and μ = the per-locus mutation rate) between Taiwan and Ryukyu Island (south to north vs. north to south). The maximum likelihood inference was conducted in MIGRATE, comparing a full migration model (where θ and M were estimated jointly from the data) to a restricted model (where θ was averaged and M was assumed to be symmetrical among populations). Each run consisted of two replicates of 10 short chains (with 10,000 genealogies sampled) and 3 long chains (with 100,000 genealogies sampled), discarding the first 10,000 genealogies. Each model was run five times to ensure the convergence of parameter estimates. A migration matrix model with unequal population sizes and different migration rates was assumed [35].
To investigate the possible historical demographic scenarios of M. japonicum, we implemented approximate Bayesian computation (ABC) methods using the program DIYABC v.2.0.4 [36]. We defined five demographic scenarios to determine the possible demographic history of M. japonicum following the recommendations proposed by Cabrera and Palsboll [37] (Figure 2). In scenario A (CON model), populations of M. japonicum maintained a constant size over time. In scenario B (DEC model), populations of M. japonicum experienced a bottleneck event. In scenario C (INC model), populations of M. japonicum expanded recently. In scenario D (INCDEC model), populations of M. japonicum expanded then experienced a single instantaneous decrease in population size. In scenario E (DECINC model), populations of M. japonicum experienced a bottleneck event followed by a single instantaneous increase in population size. We simulated three million datasets for each scenario and calculated summary statistics using the software DIYABC [36]. The posterior probability of each scenario was obtained by a direct approach and by the logistic regression approach, as implemented in DIYABC [36].
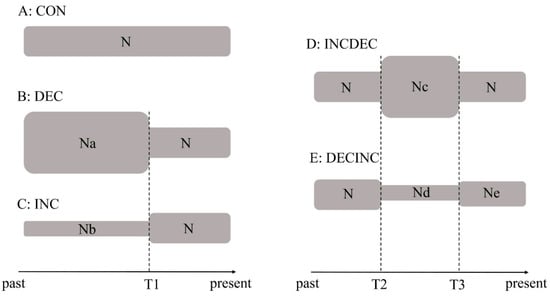
Figure 2.
Schematic representation of five demographic scenarios for Macrobrachium japonicum tested by approximate Bayesian computation (A–E). Time and effective population size are not to scale.
3. Results
3.1. Genetic Diversity
A total of 644 bp of the partial sequences of the mitochondrial COI gene from 234 specimens was analyzed and found to contain 22.4% guanine, 24.1% adenine, 27.6% thymine, and 25.8% cytosine (48.2% GC content). A total of 142 haplotypes were identified and the average haplotype diversity was high (0.988), ranging from 0.968 (HD) to 1.000 (DS, TA, and DJ). The average nucleotide diversity (θ(π), 0.00896) was low, ranging from 0.00688 (AN) to 0.01007 (GK) (Table 1). There were only 27 haplotypes that occurred in more than one population, with no single haplotypes observed in all populations. The most common haplotype of COI (H12, 16, and 36) was shared by specimens from eight populations (Table A1). A total of 13 haplotypes were identified in the OK population, and only one haplotype (H12) was shared with the populations in Taiwan. All sequences in this study were deposited in GenBank (ON864135–ON864368)
3.2. Phylogenetic Reconstruction and Genetic Structure
The presence of the phylogeographic structure demonstrated that NST was much larger than GST (0.03295 and 0.00093, respectively), indicating a strong relationship between phylogeny and geography [38]. The topology of the haplotype minimum-spanning network revealed no clustering that corresponded to the sampling site (Figure 3). The range of pairwise FST values between populations ranged from −0.044 (between AN and DJ) to 0.178 (between OK and AN), with a mean value of 0.03277. Moreover, the pairwise FST values between Ryukyu Island (OK) and other populations in Taiwan were relatively high and statistically significant, indicating that genetic differentiation occurred (Table A2). The results of hierarchical analyses of molecular variance (AMOVA) indicated that most of the genetic variation was within populations (two groups (Scenario Ⅰ, 90.28%), three groups (Scenario Ⅱ, 97.05%), and three groups (Scenario Ⅲ, 96.88%) (Table 2)). Only 8.87%, 2.14%, and 2.38% of the total variation was found among the groups when the populations were divided into two groups (Scenario Ⅰ), two groups (Scenario Ⅱ), and three groups (Scenario Ⅲ), respectively (Table 2). Estimates of gene flow calculated with the MIGRATE program indicated the possibility of genetic exchange between the southern region (Taiwan group) and the northern region (Ryukyu). Asymmetrical gene flow between the southern region and the northern region was found, indicating that individuals migrated from the southern region to the northern region. The estimate of historical gene flow from the southern region to the northern region was larger than that from the northern region to the southern region (MS→N = 184.69, 97.5% CI: 65.0~376.3 and MN→S = 21.50, 97.5% CI: 6.7~48.2, where the suffixes S and N indicate the southern region and the northern region, respectively).
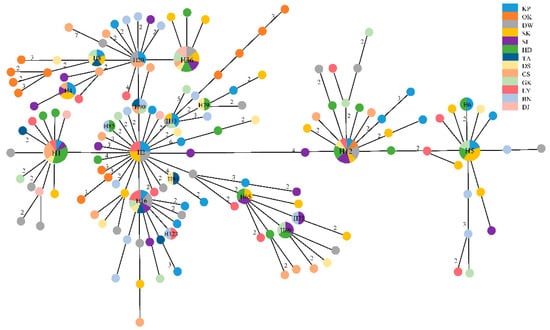
Figure 3.
The median-joining network of 142 haplotypes of Macrobrachium japonicum based on partial mtDNA COI gene. Each circle represents a haplotype, and the circle size is proportional to the haplotype frequency. Black numbers in the bars across the branches are the number of mutational steps.
Table 2.
Analysis of molecular variance (AMOVA) for Macrobrachium japonicum populations in three scenarios based on partial mtDNA COI gene.
3.3. Molecular Dating and Historical Demographic Expansion
Tajima’s D and Fu’s Fs tests of neutrality were statistically significant (Tajima’s D, −2.144, p < 0.01 and Fu’s Fs, −32.694, p < 0.001), and unimodal mismatch distributions were observed, indicating a recent demographic expansion for the populations of M. japonicum. The same result was verified in the star-like network, which suggested a recent range expansion. Bayesian skyline plot analysis, assuming a substitution rate of 2.33% per million years, showed that M. japonicum populations experienced continuous and rapid population growth beginning approximately 0.2 myr ago (Figure 4). The estimated time to coalescence in M. japonicum was 0.462 ± 0.164 myr based on the results obtained with BEAST. We used ABC analysis to determine the possible demographic history of M. japonicum. In the ABC modeling, the “DECINC model” was highly favored (posterior probability = 0.9654 (0.9221, 1.0000)) over the “CON model” (posterior probability = 0.0000 (0.0000, 0.0016)), the “DEC model” (posterior probability = 0.0346 (0.0000, 0.0779)), the “INC model” (posterior probability = 0.0000 (0.0000, 0.0016)), and the “INCDEC model” (posterior probability = 0.0000 (0.0000, 0.0016)).
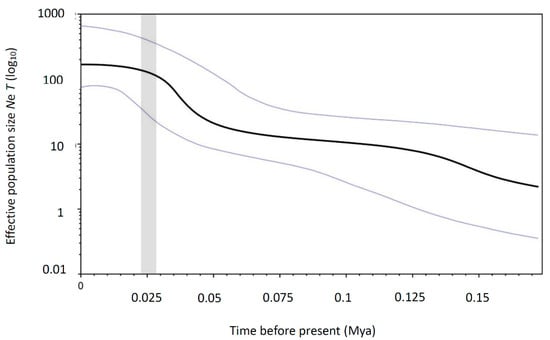
Figure 4.
Bayesian skyline plot of the effective population sizes over time for Macrobrachium japonicum based on partial mtDNA COI gene. The units of the X axis are millions of years, and the units of the Y axis are Ne (the log-transformed product of effective population size and generation length in years). Median estimated effective population sizes (bold lines) are enclosed within 95% highest posterior density intervals (light gray lines). The estimated time-frame of the Last Glacial Maximum is denoted by the area shaded in dark grey.
4. Discussion
4.1. Genetic Diversity
The conservation of genetic diversity within species was recognized as a benefit, potentially enabling populations and species to adapt and evolve in response to environmental changes. Many factors can negatively affect the genetic diversity of marine species, including overfishing, pollution, genetic drift within the population, bottleneck effects, inbreeding, and life history. The analyses of genetic diversity in M. japonicum populations in this study revealed similar haplotype diversity (0.988) and reduced nucleotide diversity (0.00896) compared with previous studies of other Macrobrachium species in Taiwan (e.g., M. asperulum [15] and M. nipponense [14]). The remarkably lower nucleotide diversity may be due to the lower effective population size of M. japonicum in Taiwan, as compared with that of M. asperulum and M. nipponense. Low nucleotide diversity combined with high haplotype diversity has frequently been attributed to the founder effect or population bottleneck [39]. Similar patterns of nucleotide diversity among populations of M. japonicum over a large territory could indicate a high larval dispersal potential. More plausibly, the high frequency and even distribution of private haplotypes within M. japonicum populations suggest an extremely large effective female population size.
4.2. Population Structure and Demographic History
Pairwise FST values suggested low genetic differentiation, except between the Ryukyu and Taiwan populations. The present analysis indicates considerable genetic homogeneity and higher levels of gene flow across the Taiwanese populations of M. japonicum. As commonly seen in amphidromous prawn, larvae outflow to the ocean and exhibit shorter cumulative dispersals in adjacent rivers (stepping stone). These features might point to a gene flow along the eastern coast of Taiwan, similar to that seen in amphidromous fish [40] and amphidromous prawn [14,41]. A moderate to high level of genetic differentiation was observed between the Ryukyu and Taiwan populations (Table A2). Peripheral populations tend to exhibit greater genetic differentiation than other populations in the same ocean owing to genetic drift in the context of low gene flow as a result of their peripheral location and founder effects [42]. Populations of amphidromous species, which are similar to marine organisms with high dispersal ability, tend to exhibit widespread dispersal, whereas those with limited dispersal ability tend to be structured [43]. The results from MIGRATE suggested asymmetrical gene flow. Complex patterns of asymmetrical gene flow suggest that variation in dispersal ability may be affected by the dominant Kuroshio Current systems of the Pacific Ocean. The Kuroshio Current is present year round and runs northward along the eastern coast of Taiwan to Ryukyu. This hypothesis can explain why the genetic migration from Taiwan to Ryukyu was larger than that in the opposite direction. Dispersal between Taiwan and Ryukyu in this region of the Kuroshio Current was previously studied in other widespread marine-dispersed species, such as Sicyopterus japonicus [44]. Based on the AMOVA results, genetic differentiation within populations of M. japonicum from the two geographic regions (Taiwan + Ryukyu) accounted for 90.28% of the total genetic variation, but only 8.87% (FSC = 0.0093, p =0.105) of the variation among groups and 0.85% (FST = 0.097, p < 0.001) of the variation among populations within groups (Table 2). However, when the population was divided into three regional groups (Ryukyu, Eastern, and Western Taiwan), or four groups including the phylogeographic group in Taiwan, the genetic variation among groups was observed to be only a small portion of the total genetic variability (2.14% and 2.38%, respectively; results not shown).
Our approximate Bayesian computation (ABC) analysis investigating demographic changes in all Macrobrachium populations indicated a decline in population size following a recent population expansion. A comparison of current and historical genetic diversity (θω (0.02961) > θπ (0.00896)) of the population of M. japonicum showed a pattern of decline [45]. However, high haplotype diversity and low nucleotide diversity were found in the population, and the results of demographic tests (BSP, mismatch analysis, and neutrality tests (Tajima’s D and Fu’s Fs)) were consistent with a recent population expansion [29,30,46]. Population expansion in Taiwan has been reported in prawns such as M. asperulum [15] and M. nipponense [14]. Bayesian skyline plot analyses estimated that the expansion of the M. japonicum population began 175 Kya and that the effective population size increased rapidly until approximately 50 Kya, indicating that the expansion event occurred in the late Pleistocene Period. The changes in climate, primarily mediated by a series of large glacial–interglacial changes during the late Pleistocene Period, might have led to the restriction of biotic exchange and affected the demographic history of M. japonicum in Taiwan and Ryukyu. Previous studies of the demographic expansion of M. nipponense in Taiwan also found evidence of a late-Pleistocene demographic expansion [14]. Following the glacial periods of the late Pleistocene, we postulated that the warm climate was favorable for M. japonicum survival and promoted the recent population expansion in Taiwan.
4.3. Phylogeography of Macrobrachium Japonicum
Macrobrachium species exhibit notably similar or different phylogeographic structures when compared with other congeneric species across the same geographical scale, at different spatial scales, and life histories. The temporal-spatial genetic architecture in Macrobrachium can be affected by various life cycles. Liu et al. [15] noted a large disparity among four distinct lineages of M. asperulum in Taiwan and revealed that land-locked species were likely affected by geographic isolation with regard to their intraspecific divergence, population structure, and geographical distribution. Chen et al. [14] demonstrated that all haplotypes of M. nipponense belonged to two distinct genetic lineages, and the lack of phylogeographic structure in Taiwan was consistent with our findings in M. japonicum. Amphidromous prawn is generally expected to show genetic homogeneity owing to the high dispersal abilities of larvae and the apparent lack of strong dispersal barriers to gene flow between ocean basins. The spawning season of M. japonicum is from early spring to summer and they have a relatively shorter pelagic larval duration (PLD) of 42 days [47]. In contrast to previous work on the genus Macrobrachium, our results present evidence that M. japonicum exists as a single evolutionary lineage throughout Taiwan and Ryukyu. Therefore, the pattern of phylogeographic structure observed in M. japonicum may indicate that both the life history of oceanic planktonic larvae and ocean currents are the most important factors facilitating the gene flow. A similar result was encountered in the related species distributed in the same region, Rhinogobius gigas [40] and S. japonicus [44], as well as in amphidromous representatives of goby, the other main family of freshwater fish. M. japonicum does not form a true panmictic population, as the Taiwan and Ryukyu populations are differentiated. Nevertheless, analysis of within-population genetic differentiation does suggest that there is a limited degree of population sub-structuring in the Taiwan and Ryukyu populations. This shallow population structuring likely reflects the long-distance and asymmetrical dispersal. Our estimates of tMRCA for M. japonicum are consistence with previous studies of M. nipponense (0.49 myr) [41]. These results suggest common threads in the colonization of Taiwan by Macrobrachium. In the future, a larger-scale sampling study among a range of distributions may provide more details on the phylogeographic structure of M. japonicum.
Author Contributions
Conceptualization, C.-C.H. (Chiao-Chuan Han) and W.-K.W.; methodology, C.-H.L. and I.-C.W.; software, H.-D.L. and C.-C.H. (Chi-Chun Huang); validation, I.-C.W., H.-D.L., and W.-K.W.; formal analysis, H.-D.L.; writing—original draft preparation, C.-C.H. (Chiao-Chuan Han), H.-D.L. and W.-K.W.; writing—review and editing, W.-K.W. All authors have read and agreed to the published version of the manuscript.
Funding
This research was funded by the Ministry of Science and Technology, Taiwan, grant number MOST 110-2221-E-035-038 and MOST 102-2621-M-29-002-MY3.
Institutional Review Board Statement
Not applicable.
Informed Consent Statement
Not applicable.
Data Availability Statement
All sequences in this study were deposited in GenBank (ON864135–ON864368).
Conflicts of Interest
The authors declare no conflict of interest.
Appendix A
Table A1.
The distribution information of the shared haplotypes (H01–H142). P indicates the number of private haplotypes in each population. The haplotype numbers in boldface type indicate shared haplotypes.
Table A2.
Matrix of pairwise FST among six populations based on mitochondrial COI gene (below diagonal) in Macrobrachium japonicum.
References
- Galindo, H.M.; Olson, D.B.; Palumbi, S.R. Seascape genetics: A coupled oceanographic-genetic model predicts population structure of Caribbean corals. Curr. Biol. 2006, 16, 1622–1626. [Google Scholar] [CrossRef]
- Briggs, J.C.; Bowen, B.W. A realignment of marine biogeographic provinces with particular reference to fish distributions. J. Biogeogr. 2012, 39, 12–30. [Google Scholar] [CrossRef]
- Wang, P. Response of Western Pacific marginal seas to glacial cycles: Paleoceanographic and sedimentological features. Mar. Geol. 1999, 156, 5–39. [Google Scholar] [CrossRef]
- Qiu, F.; Li, H.; Lin, H.; Ding, S.; Miyamoto, M.M. Phylogeography of the inshore fish, Bostrychus sinensis, along the Pacific coastline of China. Mol. Phylogenet. Evol. 2016, 96, 112–117. [Google Scholar] [CrossRef] [PubMed]
- Chen, X.; Wang, J.J.; Ai, W.M.; Chen, H.; Lin, H.D. Phylogeography and genetic population structure of the spadenose shark (Scoliodon macrorhynchos) from the Chinese coast. Mitochondrial DNA Part A DNA Mapp. Seq. Anal. 2018, 29, 1100–1107. [Google Scholar] [CrossRef]
- Yan, Y.R.; Hsu, K.C.; Yi, M.R.; Li, B.; Wang, W.K.; Kang, B.; Lin, H.D. Cryptic diversity of the spotted scat Scatophagus argus (Perciformes: Scatophagidae) in the South China Sea: Pre- or post-production isolation. Mar. Freshw. Res. 2020, 71, 1640–1650. [Google Scholar] [CrossRef]
- Gu, S.; Yi, M.R.; He, X.B.; Lin, P.S.; Liu, W.H.; Luo, Z.S.; Lin, H.D.; Yan, Y.R. Genetic diversity and population structure of cutlassfish (Lepturacanthus savala) along the coast of mainland China, as inferred by mitochondrial and microsatellite DNA markers. Reg. Stud. Mar. Sci. 2021, 43, 101702. [Google Scholar] [CrossRef]
- Yi, M.R.; Hsu, K.C.; Wang, J.X.; Feng, B.; Lin, H.D.; Yan, Y.R. Genetic structure and diversity of the yellowbelly threadfin bream Nemipterus bathybius in the northern South China sea. Diversity 2021, 13, 324. [Google Scholar] [CrossRef]
- Chiang, H.C.; Hsu, C.C.; Lin, H.D.; Ma, G.C.; Chiang, T.Y.; Yang, H.Y. Population structure of bigeye tuna (Thunnus obesus) in the South China Sea, Philippine Sea and western Pacific Ocean inferred from mitochondrial DNA. Fish. Res. 2006, 79, 219–225. [Google Scholar] [CrossRef]
- Li, H.; Li, J.; Lin, H.; Ding, S. Phylogeography of the Chinese beard eel, Cirrhimuraena chinensis Kaup, inferred from mitochondrial DNA: A range expansion after the last glacial maximum. Int. J. Mol. Sci. 2014, 15, 13564–13577. [Google Scholar] [CrossRef] [PubMed]
- Liu, Q.; Lin, H.; Chen, J.; Ma, J.; Liu, R.; Ding, S. Genetic variation and population genetic structure of the large yellow croaker (Larimichthys crocea) based on genome-wide single nucleotide polymorphisms in farmed and wild populations. Fish. Res. 2020, 232, 105718. [Google Scholar] [CrossRef]
- Liu, M.Y.; Cai, Y.X.; Tzeng, C.S. Molecular systematics of the freshwater prawn genus Macrobrachium bate, 1868 (Crustacea: Decapoda: Palaemonidae) inferred from mtDNA sequences, with emphasis on east Asian species. Zool. Stud. 2007, 46, 272–289. [Google Scholar]
- Chen, R.T.; Tsai, C.F.; Tzeng, W.N. Freshwater prawns (Macrobrachium bate, 1868) of Taiwan with special references to their biogeographical origins and dispersion routes. J. Crustac. Biol. 2009, 29, 232–244. [Google Scholar] [CrossRef]
- Chen, P.C.; Shih, C.H.; Chu, T.J.; Wang, D.; Lee, Y.C.; Tzeng, T.D. Population structure and historical demography of the oriental river prawn (Macrobrachium nipponense) in Taiwan. PLoS ONE 2015, 10, e0145927. [Google Scholar] [CrossRef] [PubMed]
- Liu, M.Y.; Tzeng, C.S.; Lin, H.D. Phylogeography and the genetic structure of the land-locked freshwater prawn Macrobrachium asperulum (Crustacea: Decapoda: Palaemonidae) in Taiwan. Hydrobiologia 2011, 671, 1–12. [Google Scholar] [CrossRef]
- Hiraga, H.; Azuma, K.; Kusaka, T.; Kinoshita, I.; Fujita, S. Downstream drifting of Macrobrachium (Decapoda: Palaemonidae) larvae in the Shimanto River, Japan. Plankton Benthos. Res. 2021, 16, 301–307. [Google Scholar] [CrossRef]
- Fujita, J.; Zenimoto, K.; Iguchi, A.; Kai, Y.; Ueno, M.; Yamashita, Y. Comparative phylogeography to test for predictions of marine larval dispersal in three amphidromous shrimps. Mar. Ecol. Prog. Ser. 2016, 560, 105–120. [Google Scholar] [CrossRef]
- Wowor, D.; Muthu, V.; Meier, R.; Balke, M.; Cai, Y.; Ng, P.K.L. Evolution of life history traits in Asian freshwater prawns of the genus Macrobrachium (Crustacea: Decapoda: Palaemonidae) based on multilocus molecular phylogenetic analysis. Mol. Phylogenet. Evol. 2009, 52, 340–350. [Google Scholar] [CrossRef]
- Weese, D.A.; Fujita, Y.; Hidaka, M.; Santos, S.R. The long and short of it: Genetic variation and population structure of the anchialine atyid shrimp Caridina rubella on Miyako-Jima, Japan. J. Crustac. Biol. 2012, 32, 109–117. [Google Scholar] [CrossRef][Green Version]
- Ito, A.; Fujita, Y.; Shokita, S. Redescription of the first zoeas of six Macrobrachium species (Decapoda: Caridea: Palaemonidae) occurring in Japan. Crustac. Res. 2003, 32, 55–72. [Google Scholar] [CrossRef][Green Version]
- Folmer, O.; Black, M.; Hoeh, W.; Lutz, R.; Vrijenhoek, R. DNA primers for amplification of mitochondrial cytochrome c oxidase subunit I from diverse metazoan invertebrates. Mol. Mar. Biol. Biotechnol. 1994, 3, 294–299. [Google Scholar]
- Han, C.C.; Fang, L.S.; Chang, I.M.; Lin, H. DuGenetic variation of the land-locked freshwater shrimp Caridina pseudodenticulata (Decapoda: Atyidae: Caridina) in Taiwan. Mitochondrial DNA Part A DNA Mapp. Seq. Anal. 2018, 29, 687–694. [Google Scholar] [CrossRef] [PubMed]
- Thompson, J.D.; Gibson, T.J.; Plewniak, F.; Jeanmougin, F.; Higgins, D.G. The CLUSTAL X windows interface: Flexible strategies for multiple sequence alignment aided by quality analysis tools. Nucleic Acids Res. 1997, 25, 4876–4882. [Google Scholar] [CrossRef] [PubMed]
- Nei, M. Molecular Evolutionary Genetics; Columbia University Press: New York, NY, USA, 1987. [Google Scholar]
- Jukes, T.H.; Cantor, C.R. Evolution of protein molecules. Mamm. Protein Metab. 1969, 3, 21–132. [Google Scholar]
- Librado, P.; Rozas, J. DnaSP v5: A software for comprehensive analysis of DNA polymorphism data. Bioinformatics 2009, 25, 1451–1452. [Google Scholar] [CrossRef] [PubMed]
- Excoffier, L.; Lischer, H.E.L. Arlequin suite ver 3.5: A new series of programs to perform population genetics analyses under Linux and Windows. Mol. Ecol. Resour. 2010, 10, 564–567. [Google Scholar] [CrossRef]
- Leigh, J.W.; Bryant, D. POPART: Full-feature software for haplotype network construction. Methods Ecol. Evol. 2015, 6, 1110–1116. [Google Scholar] [CrossRef]
- Tajima, F. The effect of change in population size on DNA polymorphism. Genetics 1989, 123, 597–601. [Google Scholar] [CrossRef] [PubMed]
- Fu, Y.X. Statistical tests of neutrality of mutations against population growth, hitchhiking and background selection. Genetics 1997, 147, 915–925. [Google Scholar] [CrossRef]
- Drummond, A.J.; Suchard, M.A.; Xie, D.; Rambaut, A. Bayesian phylogenetics with BEAUti and the BEAST 1.7. Mol. Biol. Evol. 2012, 29, 1969–1973. [Google Scholar] [CrossRef]
- Rambaut, A.; Drummond, A. Tracer V. 1.5. Computer Program and Documentation Distributed by the Authors. Available online: http://beast.bio.ed.ac.uk/Tracer (accessed on 26 March 2021).
- Han, C.C.; Hsu, K.C.; Fang, L.S.; Cheng, I.M.; Lin, H.D. Geographical and temporal origins of Neocaridina species (Decapoda: Caridea: Atyidae) in Taiwan. BMC Genet. 2019, 20, 86. [Google Scholar] [CrossRef] [PubMed]
- Shih, H.-T.; Cai, Y. Two new species of the land-locked freshwater shrimps genus, Neocaridina Kubo, 1938 (Decapoda: Caridea: Atyidae), from Taiwan, with notes on speciation on the island. Zool. Stud. 2007, 46, 680–694. [Google Scholar]
- Beerli, P.; Felsenstein, J. Maximum likelihood estimation of a migration matrix and effective population sizes in n subpopulations by using a coalescent approach. Proc. Natl. Acad. Sci. USA 2001, 98, 4563–4568. [Google Scholar] [CrossRef] [PubMed]
- Cornuet, J.M.; Pudlo, P.; Veyssier, J.; Dehne-Garcia, A.; Gautier, M.; Leblois, R.; Marin, J.M.; Estoup, A. DIYABC v2.0: A software to make approximate Bayesian computation inferences about population history using single nucleotide polymorphism, DNA sequence and microsatellite data. Bioinformatics 2014, 30, 1187–1189. [Google Scholar] [CrossRef] [PubMed]
- Cabrera, A.A.; Palsbøll, P.J. Inferring past demographic changes from contemporary genetic data: A simulation-based evaluation of the ABC methods implemented in diyabc. Mol. Ecol. Resour. 2017, 17, e94–e110. [Google Scholar] [CrossRef]
- Pons, O.; Petit, R.J. Measuring and testing genetic differentiation with ordered versus unordered alleles. Genetics 1996, 144, 1237–1245. [Google Scholar] [CrossRef] [PubMed]
- Benzie, J.A.H.; Ballment, E.; Forbes, A.T.; Demetriades, N.T.; Sugama, K.; Moria, H.S. Mitochondrial DNA variation in Indo-Pacific populations of the giant tiger prawn, Penaeus monodon. Mol. Ecol. 2002, 11, 2553–2569. [Google Scholar] [CrossRef]
- Liao, T.Y.; Lu, P.L.; Yu, Y.H.; Huang, W.C.; Shiao, J.C.; Lin, H.D.; Jhuang, W.C.; Chou, T.K.; Li, F. Amphidromous but endemic: Population connectivity of Rhinogobius gigas (Teleostei: Gobioidei). PLoS ONE 2021, 16, e0246406. [Google Scholar] [CrossRef] [PubMed]
- Chen, P.C.; Shih, C.H.; Chu, T.J.; Lee, Y.C.; Tzeng, T.D. Phylogeography & genetic structure of the oriental river prawn Macrobrachium nipponense (Crustacea: Decapoda: Palaemonidae) in East Asia. PLoS ONE 2017, 12, e0173490. [Google Scholar] [CrossRef]
- Yamaguchi, K.; Nakajima, M.; Taniguchi, N. Loss of genetic variation and increased population differentiation in geographically peripheral populations of Japanese char Salvelinus leucomaenis. Aquaculture 2010, 308, S20–S27. [Google Scholar] [CrossRef]
- Bernays, S.J.; Schmidt, D.J.; Hurwood, D.A.; Hughes, J.M. Phylogeography of two freshwater prawn species from far-northern Queensland. Mar. Freshw. Res. 2015, 66, 256–266. [Google Scholar] [CrossRef]
- Ju, Y.M.; Hsu, C.H.; Fang, L.S.; Lin, H.D.; Wu, J.H.; Han, C.C.; Chen, I.S.; Chiang, T.Y. Population structure and demographic history of Sicyopterus japonicus (Perciformes; Gobiidae) in Taiwan inferred from mitochondrial control region sequences. Genet. Mol. Res. 2013, 12, 4046–4059. [Google Scholar] [CrossRef] [PubMed]
- Templeton, A.R. The “Eve” Hypotheses: A Genetic Critique and Reanalysis. Am. Anthropol. 1993, 95, 51–72. [Google Scholar] [CrossRef]
- Grant, W.S.; Bowen, B.W. Shallow population histories in deep evolutionary lineages of marine fishes: Insights from sardines and anchovies and lessons for conservation. J. Hered. 1998, 89, 415–426. [Google Scholar] [CrossRef]
- Morizane, T. The larval development of Macrobrachium japonicum (De Haan) reared in the laboratory. La Mer 1971, 9, 235–251. [Google Scholar]


Publisher’s Note: MDPI stays neutral with regard to jurisdictional claims in published maps and institutional affiliations. |
© 2022 by the authors. Licensee MDPI, Basel, Switzerland. This article is an open access article distributed under the terms and conditions of the Creative Commons Attribution (CC BY) license (https://creativecommons.org/licenses/by/4.0/).