Article

Comparing Genetic and Field-Based Estimates of Population Connectivity in Marbled Salamanders, Ambystoma opacum

by
Karine E. Posbic-Leydet
1,†,
Kelsey L. Glennon
2,*,†,
Jolene T. Fisher
2,
Don R. Church
3 and
Sheri A. Church
1
1
Department of Biological Sciences, The George Washington University, 2023 G Street NW, Washington, DC 20052, USA
2
School of Animal, Plant and Environmental Sciences, University of the Witwatersrand, Johannesburg, Johannesburg 2000, South Africa
3
Department of Biology, University of Virginia, Charlottesville, VA 22904, USA
*
Author to whom correspondence should be addressed.
These authors contributed equally to this work.
Diversity 2022, 14(7), 524; https://doi.org/10.3390/d14070524
Submission received: 19 January 2022 / Revised: 24 March 2022 / Accepted: 14 April 2022 / Published: 29 June 2022
(This article belongs to the Special Issue Amphibian Ecology in Geographically Isolated Wetlands)

Abstract

:
Estimating connectivity is key for maintaining population viability for pond-breeding amphibians, especially in areas where habitat alterations occur. Here, we used genetic data (microsatellites) to estimate connectivity of marbled salamanders, Ambystoma opacum, among three focal ponds and compared it to field data (capture-mark-recapture estimates) of movement among the same ponds. In addition, we derived least-cost dispersal paths from genetic data and compared them to field connectivity estimates. We found that genetic and field estimates of dispersal were generally congruent, but field-based paths were more complex than genetic-based paths. While both methods complement each other in identifying important source-sink metapopulation dynamics to inform efficient conservation management plans, field data provide a more biologically accurate understanding of the spatial movement of individual marbled salamanders.

1. Introduction

A key feature of estimating population connectivity and making predictions about how species cope with changing environments is movement—both dispersal and migration. Over the past few decades, there has been an increasing emphasis on methods used to estimate dispersal across different scenarios, particularly for animal populations (for review see [1]). A change in dispersal affects migration patterns and subpopulation connectivity within a larger metapopulation. Such changes will affect the viability of populations and genetic diversity, subsequently affecting offspring survival and other factors that help maintain populations [2,3]. Estimating individuals’ movement among populations can be done using population genetic analyses or field-based methods, like mark-recapture. However, the utility of comparing these two approaches is currently debated (e.g., [3], but see [4]).
Determining connectivity between populations helps to identify source-sink dynamics [5], populations that need special conservation protection [6], and locations for necessary dispersal corridors [7]. In particular, accurately estimating population connectivity of pond-breeding amphibians is necessary for assessing the viability of populations [8]. Notably, amphibian populations are experiencing a world-wide decline [9,10]. In particular, studies suggest that these declines are precipitated by the destruction, alteration, and fragmentation of amphibian habitats [11,12,13]. A greater understanding of how amphibians move among breeding ponds and their terrestrial habitats is an informative means to mitigate potential threats, particularly as these animals are often difficult to observe. For instance, previous work on ambystomatid salamanders highlights that combining spatial analyses with population genetics can be informative [14], with a more recent study suggesting that the two methods are congruent [4]. Marbled salamanders, Ambystoma opacum (Gravenhorst), are distributed across eastern North America [12] and are listed as threatened or endangered in several states in the United States [15], often due to habitat destruction or fragmentation. For this study, we compare the utility of genetic and field methods for estimating movement and identifying dispersal routes within a pond complex of A. opacum located in eastern North America, in Virginia’s Maple Flats Pond complex.
When examining the movement of individuals among populations, distinguishing between gene flow, migration, and dispersal is important. Migration is often defined as the movement of individuals between a breeding site and non-breeding site. Here, we do not explicitly measure dispersal, as dispersal is a one-way movement of individuals, with or without the contribution of alleles to the next generation. Instead, we use genetic data to infer gene flow as an indirect method of estimating movement (defined as the movement of individuals to breeding ponds that results in reproduction) and compare it to capture-mark-recapture (CMR), a means of directly estimating movement probabilities of individuals among ponds. There is a general understanding that indirect and direct methods estimate different characteristics: gene flow estimates allelic movement and CMR measures individuals’ movements [16,17]. Accurate interpretations of the migration estimates derived from these different methods are important because they may have profound effects on the final assessment of population connectivity that can be used in conservation management plans.
While migration estimates and dispersal measures can be used to infer the degree of connectivity between populations, spatial analyses provide valuable means of merging the effects of landscape features on the movement of individuals [4,18,19] and identify the placement of corridors necessary to promote migration between populations. Least-cost path (LCP) analysis is a spatial technique that can evaluate potential movement trajectories and is a more accurate approach for fitting patterns of genetic structure than Euclidean distance analysis [20,21,22]. Many studies use observational data and a priori expectations to measure cost, which may be misleading given that a species may not follow anthropologic assumptions of landscape quality [23,24]. Recent studies combined direct and indirect estimates of gene flow to help assign relative costs of the habitat features and determine the most biologically plausible dispersal routes [14,25]. Notably, habitat costs and associated dispersal routes may differ depending on the type of data (e.g., genetic vs. mark-recapture) used in the initial assessment of the populations, but whether data support this difference needs to be explored. Comparing indirect and direct estimates of movement can help identify the most biologically plausible movement among geographically isolated wetlands, which is necessary for managing landscape connectivity.
Here, we inferred pond connectivity and movement routes using direct and indirect estimates among three breeding ponds of Ambystoma opacum (Ambystomatidae). To do this, we assessed the difference between genetic estimates of gene flow and field estimates of salamander movement by asking if direct and indirect estimates of population connectivity differ.

2. Materials and Methods

2.1. Study Site and Study Species

Our study focuses on three breeding ponds of Ambystoma opacum that are in the Maple Flats Sinkhole Pond Complex [26] at the base of the Blue Ridge Mountains in the Shenandoah Valley of Augusta County, Virginia, USA, which is home to approximately 24 ponds (Figure 1). We focused on three ponds (Pond Two, Oak Pond, and Deep Pond). These focal ponds are part of a karst-depression wetland in the Shenandoah Valley [27] with little microtopography among ponds and are well-known for their role in biodiversity and biogeographic patterns of organisms. The three differ in the extent of regenerating forest (clear cut in 1980) and mature forest (at least 100 years old) that encircle each pond [28]. Within the clear cuts, white pines were planted at higher density than they occur within the mature forest. Regenerating forest is situated between Deep Pond and Pond Two and between Deep Pond and Oak Pond. The ponds represent breeding grounds for terrestrial adults, who breed explosively from late August through September. Marbled salamanders lay their eggs in dry or ebbed ponds and the eggs hatch when rising pond levels inundate the nest [29,30]. Breeding site fidelity is high among experienced adults [31]. Marbled salamanders retreat from their breeding ponds during the nonbreeding season or in the case of brooding females after a nest is inundated. They live primarily underground the remainder of the year, with limited movement [12].

2.2. Genotyping Individuals

During the 1999 breeding season, toe clippings from individuals who entered the three focal ponds were collected and stored in 95% ethanol for subsequent DNA analysis. We extracted genomic DNA from the toe clippings using Qiagen’s DNeasy Tissue Extraction Kit according to the manufacturer’s protocol (Qiagen Inc., Valencia, CA, USA). We individually amplified nine variable microsatellite loci [15] (Table 1 and Table S1) for all individuals and pooled the amplified fragments for fragment visualization using primers labeled with WellRED fluorescent labels (D4, D3, D2; IDTdna, Inc., Newark, NJ, USA) and analyzed them on a CEQ 8000 (Beckman Coulter, Fullerton, CA, USA) at The George Washington University (Washington, DC, USA). We used a 600 base pair DNA size standard to size the fragments with the FRAG-4 analysis method. We visualized the results on the Beckman Coulter CEQ Analysis System Software (Beckman Coulter, Inc.), and identified and manually recorded the target alleles (i.e., the peaks with the largest reflective fluorescent unit [RFU] that corresponded to estimated PCR band lengths characterized by gel electrophoresis).
We cloned six samples, on average, for each locus across all populations to verify that the allele sizes represented variations within the microsatellite repeat region and not another type of substitution within the flanking regions. We used Qiagen’s Cloning Kit (Qiagen Inc., Valencia, CA, USA) according to the manufacturer’s protocol, and sent clones to SeqWright (Houston, TX, USA) to be sequenced on an ABI3300 Sequencer. We manually aligned and visually examined the clone sequences to verify the allele lengths obtained via fragment analysis. In total, 456 clones were sequenced and all allele size variations corresponded to microsatellite repeat differences.

2.3. Calculating Genetic Diversity and Population Differentiation

We tested for linkage disequilibrium (LD) for each pair of loci in Genepop on the Web [32,33]. We used the log likelihood ratio statistic (α = 0.05) with a Markov chain with 10,000 dememorization steps and 1000 batches with 10,000 iterations each [32,33]. Two loci (Aop31 and AmaD328) showed evidence of linkage, therefore we retained only one of the two loci (Aop31) for genetic analyses. We used MICRO-CHECKER 2.2.3 [34] to identify the presence of scoring errors, large allele drop-out and null alleles. Aop7 and AjeD422 contained null alleles; therefore, we adjusted these loci using the Brookfield 2 method [35]. This method of adjustment treats missing data as null homozygotes, which was appropriate for our data because missing data were few and not consistent across loci for one individual. Once alleles were adjusted, genetic diversity indices (e.g., observed and expected heterozygosity) were estimated for each locus and each population using GenoDive 3.04 [36]. To examine genetic structure of focal ponds in the Maple Flats complex, we performed an analysis of molecular variance (AMOVA) in GenoDive 3.04. We also used the Meirman and Hedrick unbiased estimate (G”ST) for pairwise estimates of FST [37]. For all analyses, we ran 10,000 permutations to estimate significance.

2.4. Estimating Field Movement and Gene Flow

We used field estimates of movement from a capture mark recapture (CMR) study of adult Ambystoma opacum in years 1999–2003 [28]. Movement probabilities were averaged across males and females and breeders and nonbreeders among ponds. Estimates of movement probability presented here represent migration between ponds across the four years of Church et al.’s study. Capture mark recapture methods followed [38,39,40,41]. Briefly, the ponds are oriented in an approximate equilateral triangle and each pond was encircled with a drift fence and pitfall traps set up in ten-meter intervals around the perimeter. Drift fences were set up prior to the A. opacum breeding season and were run continuously for five years. While juveniles were marked with toe clips to distinguish from adults, they were not followed in the Church et al. (2022) study. We recognize that the salamanders move from their terrestrial forest habitat to their breeding pond and then back to terrestrial forest habitat for hibernation; individuals were not followed to ascertain which habitat type they moved into. The close proximity of the ponds meant that it was possible for an individual to reach more than one pond from its hibernation site during a breeding season. The drift fence perimeters were associated with both regenerating forest (clear-cut 20 years prior to the onset of the CMR study) and mature forest habitat (approximately 100-year-old growth). Individuals were captured, photographed, and released at the location of capture and in the direction they were heading (i.e., other side of the fence). Capture histories were reconstructed using natural dorsal markings in a program developed specifically for A. opacum called Extract Compare, available online: https://conservationresearch.org.uk/Home/ExtractCompare/salamander.html (accessed 14 July 2009). In total, over 11,000 individuals were represented by over 32,000 captures. The CMR data does not take juvenile movement into account, which could affect the estimates of migration.
We then estimated average recent gene flow between the three focal ponds using BAYESASS 3.04 [42]. We chose this method because this genetic assignment method provides estimates on a recent or contemporary timescale. We estimated gene flow using the six loci that did not exhibit null alleles because adjusted genotypes are randomly assigned to individuals, which prevents multilocus analysis. BAYESASS uses Bayesian methods and Markov chain Monte Carlo resampling to estimate the proportion of individuals in each population that are migrants from a source population. It also estimates the proportion of individuals derived from the source populations each generation. Following software manual recommendations, we first ran exploratory runs to adjust the mixing parameters (i.e., acceptance rates). Once we achieved optimal acceptance rates (20–60%), we ran ten independent runs with 100 million generations each, discarding ten million as burn-in, sampling the chain every 2000 generations, and examined the trace files in TRACER 1.5 [43] for evidence of convergence, mixing and consistency of the estimates between independent runs. For each run, we calculated the Bayesian deviance as a measure of model fit and selected the run with the lowest deviance for obtaining parameter estimates [44,45].

2.5. Least-Cost Path Analysis

We classified habitat (vernal ponds, streams, and the two habitat types, clear-cut and forest) using a five-meter resolution aerial photograph taken of the Maple Flats Sinkhole Pond Complex in 1998 that was acquired from the U.S. Forest Service. We used the CMR estimates of migration from Church et al. (2022) and genetic estimates of gene flow calculated for this study to independently determine the relative costs for each of the two habitat types (regenerating versus mature forest). Each set of costs was used to construct a different movement map between ponds. From the CMR data, we determined that the average landscape migration through regenerating forest habitat was 0.011, while migration through mature forest habitat was 0.026. Under the assumption that higher rates of migration indicate a relatively lower cost of movement, we determined that the cost of moving through the clear-cut habitat was 2.3 times greater than the forest habitat (Table 2). Using genetic estimates, we inferred migration through regenerating forest (between Pond Two and Deep Pond) and through mature forest habitat (between Pond Two and Oak Pond). To standardize for distance, these estimates of the proportion of migrants were divided by the Euclidean distance between the ponds. We determined that migration through clear-cut was 4.24 × 10⁻⁴ and migration through forest was 4.46 × 10⁻⁴. Therefore, based on the genetic data the cost of moving through regenerating forest was 1.05 times greater than migration through mature forest (Table 2 and Table S2). We assigned the actual cost values for regenerating and mature forests based on these relationships using relative non-dimensional weights. Ambystoma opacum are not aquatic and do not migrate through filled vernal ponds or streams; these land cover classes were assigned the highest relative cost of movement.
Based on the calculated costs, we constructed two cost surfaces and determined the cost-distance (i.e., a cumulative weighted distance based on a cost surface) radiating from each source pond (11 ponds) to each pixel in the study area using ArcMap 10.6. We then performed LCP analyses for all pairs of ponds within the Maple Flats Sinkhole Pond Complex (110 paths), including the three focal ponds. For each path within each dispersal map, we characterized several geographic properties. First, we estimated cost length, which is the total length of the LCP. Second, we calculated the straight-line distance as the total length of the straight-line distance between ponds measured from the origin and destination points of the respective LCP (this is different to Euclidean distance between ponds). Lastly, we calculated sinuosity, which is a measure of the complexity of the path equal to the straight-line distance divided by cost length. For this variable, values closer to one indicate little or no complexity in the cost path whereas values closer to zero indicate cost paths are more complex than straight paths. We statistically compared cost length and Euclidean distance for each pair of ponds within each paths map and compared cost length and sinuosity of the paths between the two maps independently using paired two-tailed t-tests.

3. Results

3.1. Genetic Diversity and Population Differentiation

The loci used were found to be polymorphic, but one locus, AmaD328, recovered the most alleles (n = 23) relative to the others. The three ponds comprised similar numbers of alleles, ranging from four to five alleles in each pond (Table 1). Genetic diversity appears to be high for each of the three focal ponds (Ho = 0.643–0.704, Table 1). Analysis of molecular variance found no significant variation among populations (F = 0.008, p = 0.181, Table 2). Genetic differentiation among ponds was negligible, but there was marginal support for genetic differentiation between Oak Pond and Pond Two (G”ST = 0.019, p = 0.06, Table 3). There was some evidence for inbreeding in Pond Two (Table 3).

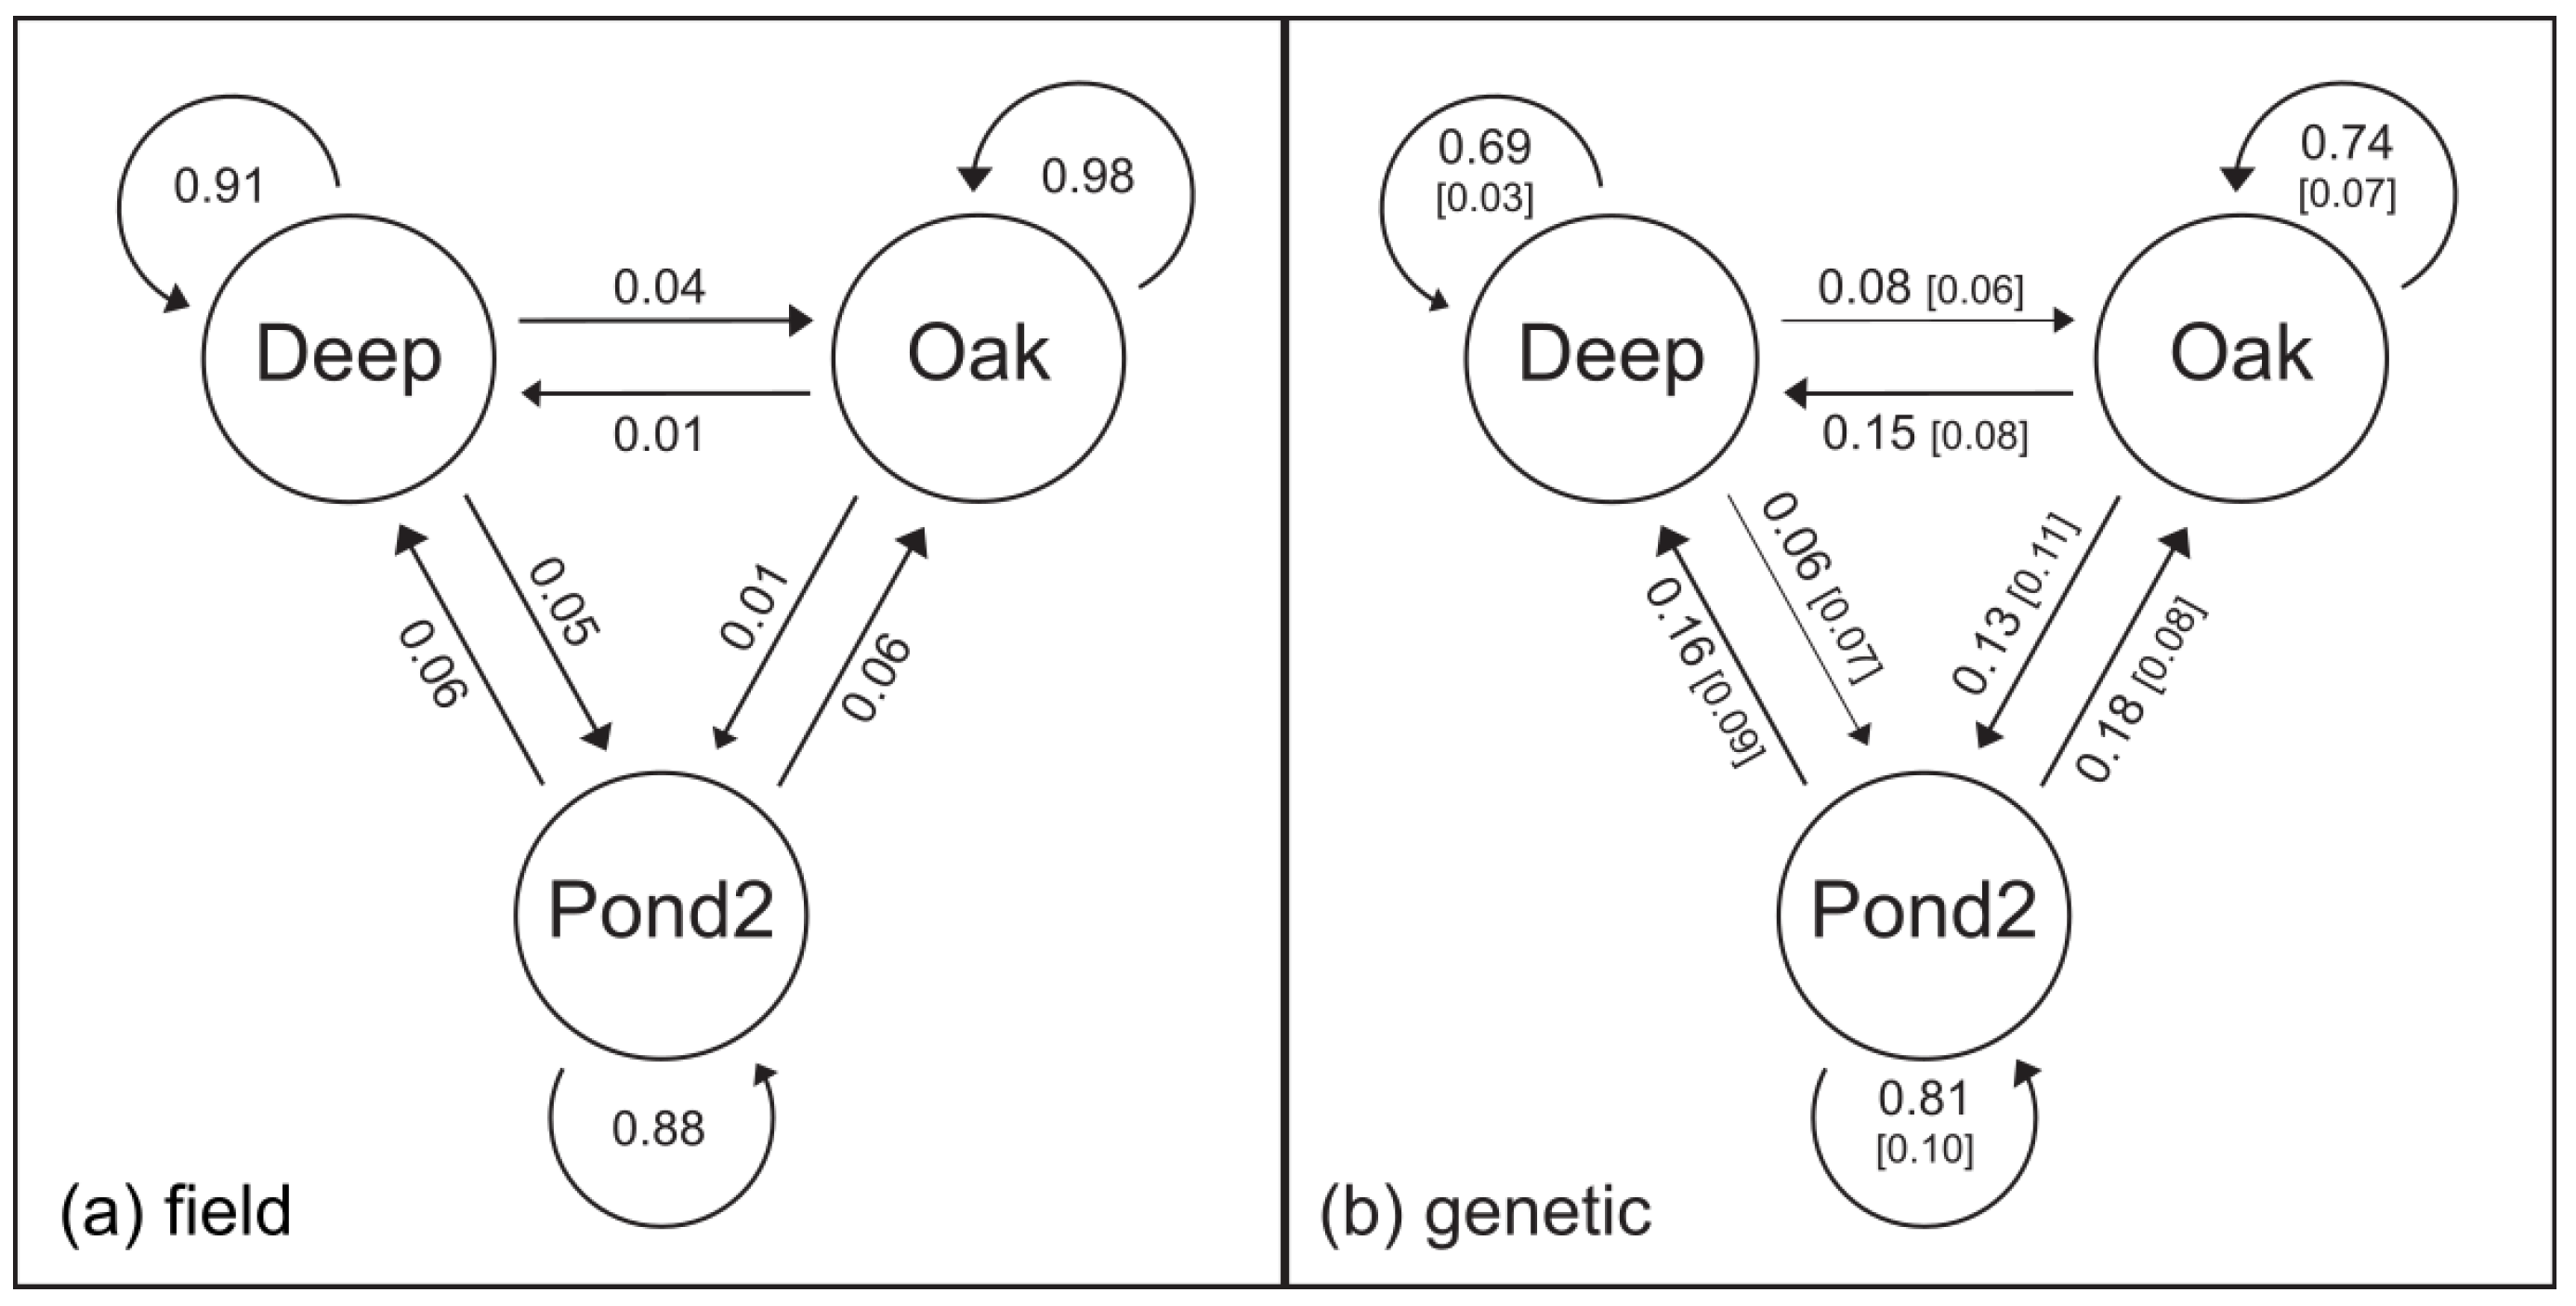
3.2. Estimates of Gene Flow and Migration

CMR estimates of migration between the three focal ponds were somewhat symmetric (Figure 1a). While emigration from Pond Two was greater (0.06 to either Oak Pond or Deep Pond) than immigration into Pond Two (0.05 from Deep Pond, 0.01 from Oak Pond), the difference was minimal. Migration between Oak Pond and Deep Pond was asymmetric with greater movement into Oak Pond from Deep Pond (0.04) compared to the movement into Deep Pond from Oak Pond (0.01). Overall, the lowest migration was of individuals leaving Oak Pond (0.01), while Pond Two had the highest proportion of non-migrants (0.91).
We used BAYESASS to calculate average recent gene flow (Figure 1b). Estimates were overall asymmetric. Gene flow from Pond Two to either Oak Pond or Deep Pond was greater (0.18 and 0.16, respectively) than the gene flow into Pond Two from either Oak Pond or Deep Pond (0.13 and 0.06, respectively). Gene flow between Oak Pond and Deep Pond was also asymmetric, with greater gene flow from Oak Pond to Deep Pond (0.15) compared to gene flow from Deep Pond to Oak Pond (0.08). A large proportion of individuals sampled from Pond Two had Pond Two ancestry (0.81), while individuals from Oak Pond and Deep Pond were more likely to be of admixed ancestry (0.74, 0.69 respectively).

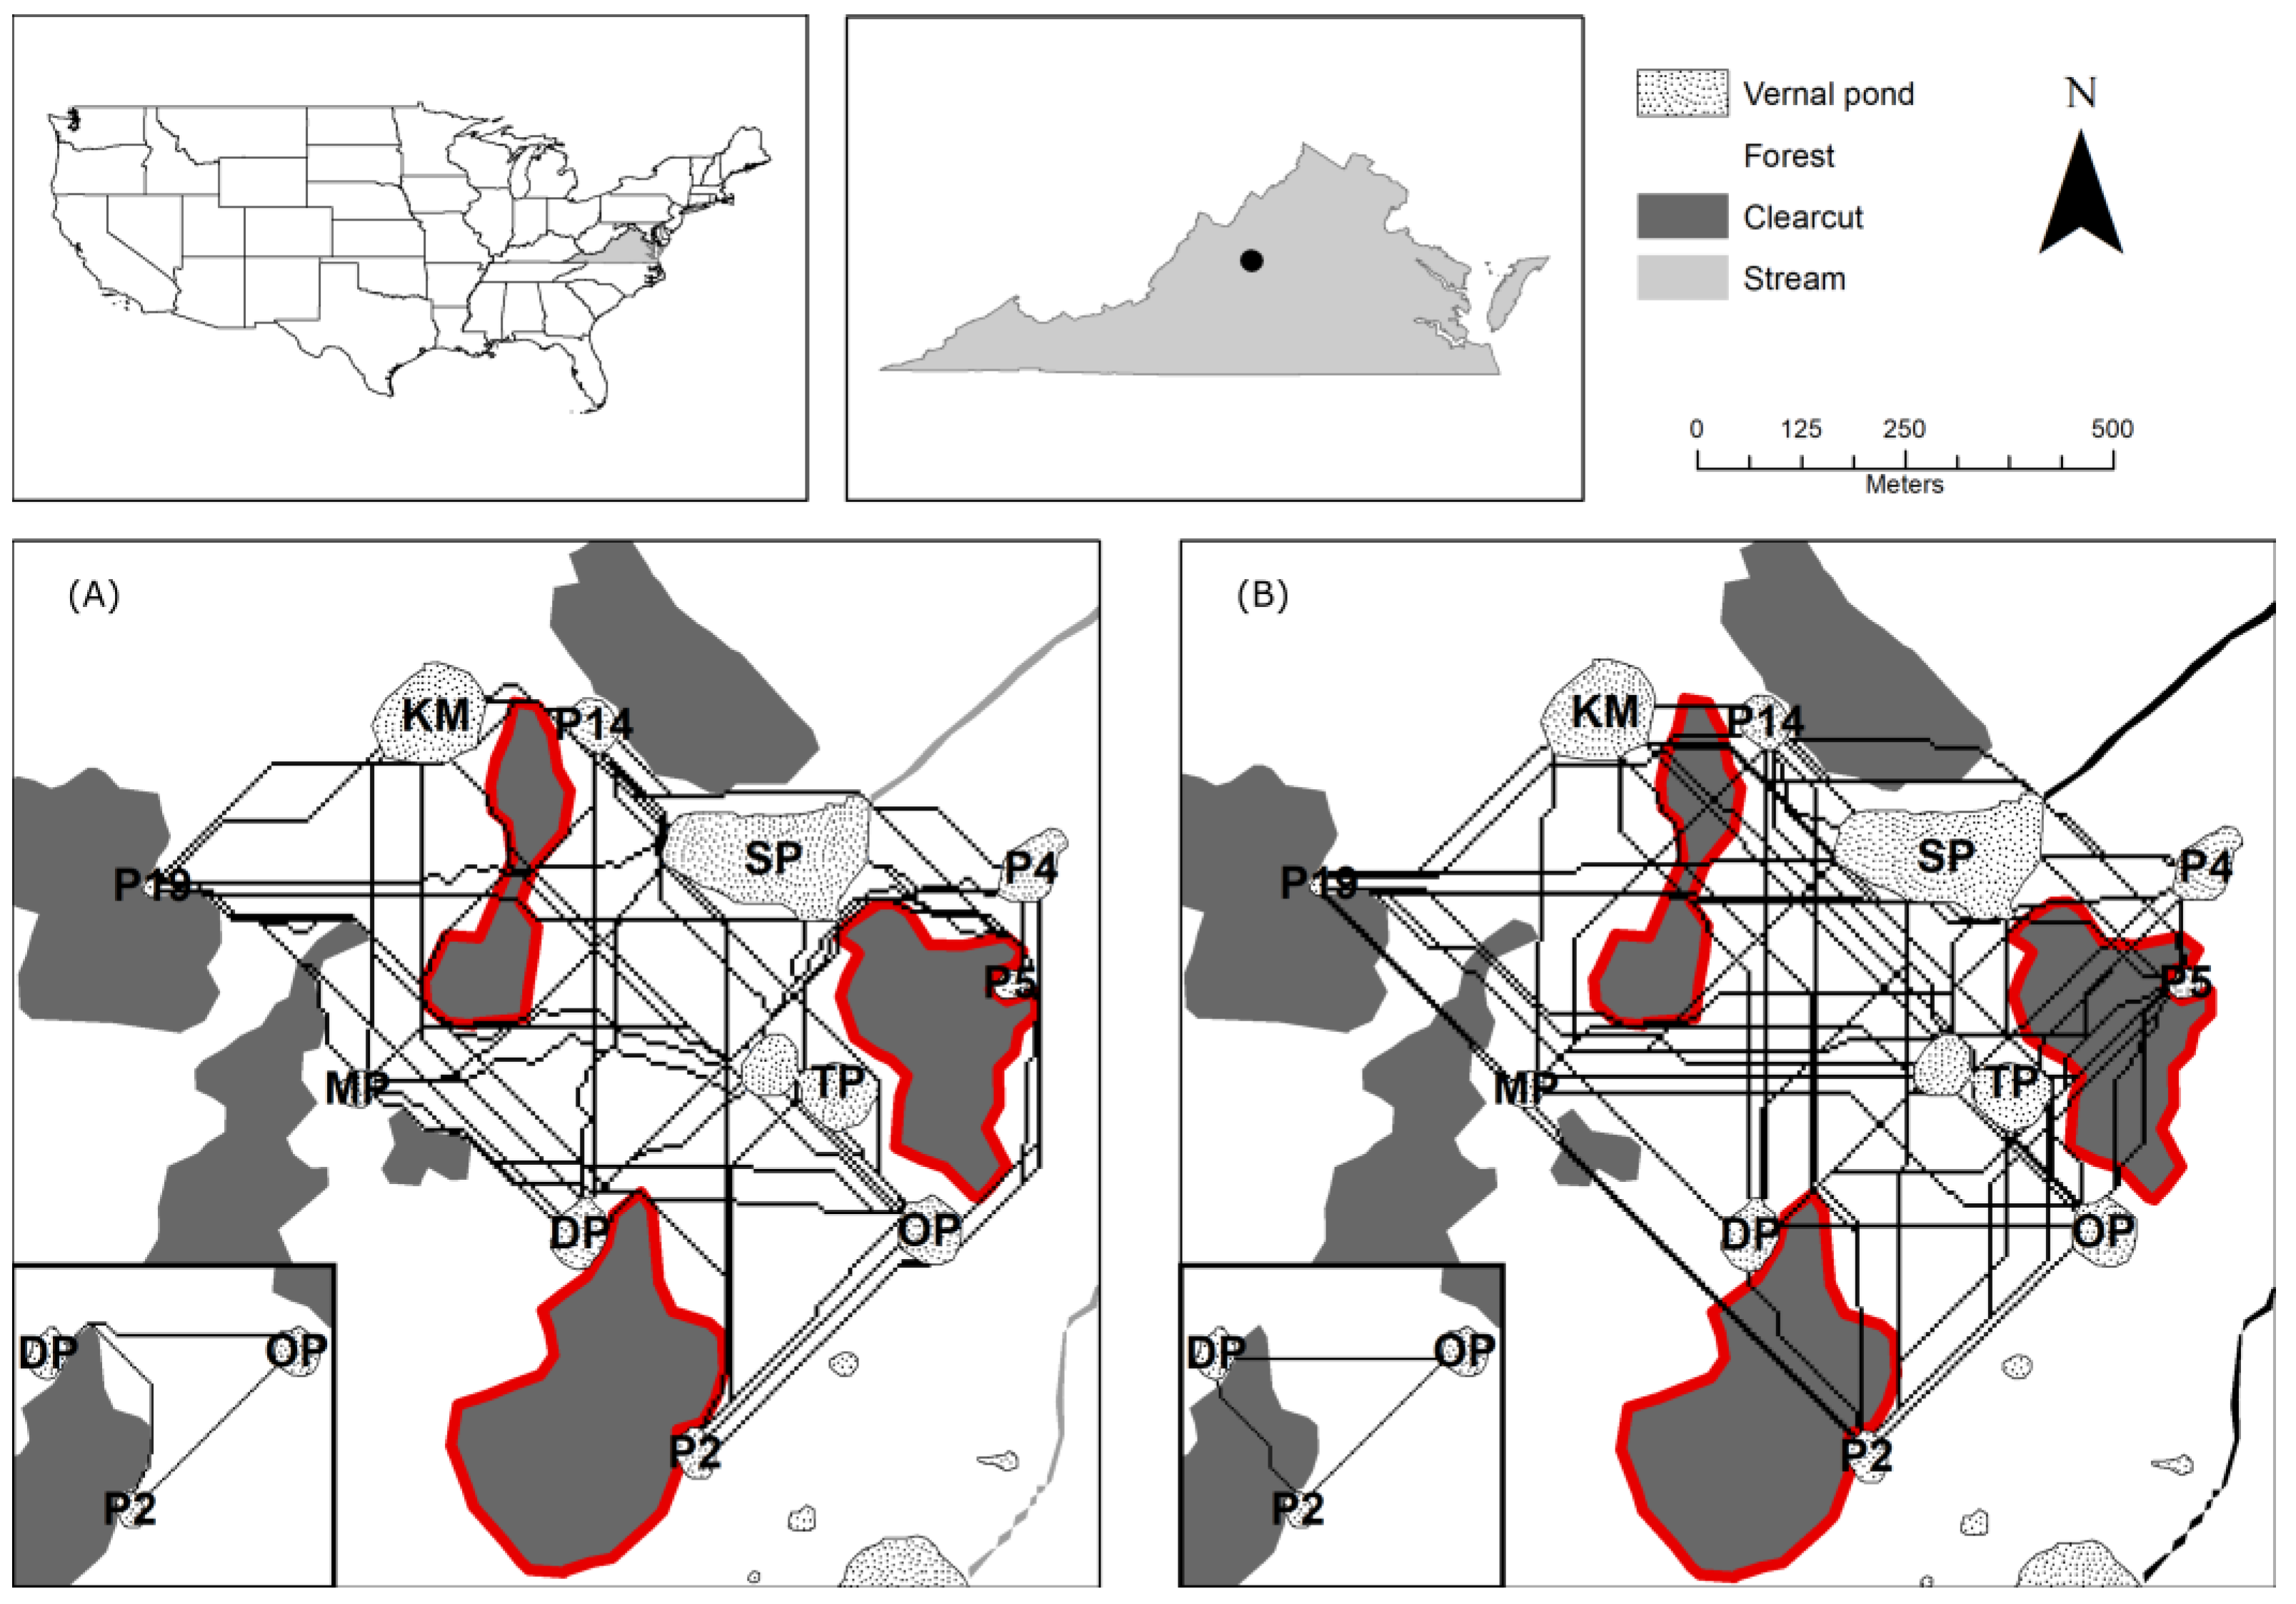
3.3. Least-Cost Movement Routes

According to the costs generated from field and genetic estimates of migration, the two maps show different movement routes (Figure 2 and Table S3). The map constructed on field data show paths that generally avoid going through regenerating forest (Figure 2A). In contrast, the genetic estimates of migration resulted in routes that readily traverse the regenerating forest patches (Figure 2B). A statistical comparison of the LCPs and straight-line distances within each map showed no significant differences for both field data (t = 1.77, df = 218, p = 0.08), and genetic data (t = 0.91, df = 218, p = 0.37), i.e., cost-based lengths were not significantly greater than straight line distances between ponds. Cost lengths built on field data were not significantly greater compared to those built on genetic data (t = 1.16, df = 218, p = 0.25); however, the sinuosity of the paths built on genetic data was significantly greater than the sinuosity of the paths built on field data (t = −6.51, df = 218, p = 0.0001) indicating more complex paths based on field derived costs than those derived from genetic data.

4. Discussion

The marbled salamander, A. opacum, is a charismatic species in the Maple Flats Sinkhole complex. Understanding how these animals move among their breeding ponds is useful to ensuring their future in geographically isolated wetlands where land transformation has either occurred or could take place in the future. In the Maple Flats Sinkhole complex, clear cutting of hardwood may affect how the marbled salamander moves back to its breeding pond, or moves among breeding ponds, which then may affect the genetic diversity of the population. For this study, we compared migration estimates calculated using CMR data and molecular data and then asked whether one dataset over the other predicted more biologically plausible potential movement routes. We found that CMR and molecular data did not differ markedly in some estimates of migration between ponds, but did in others (between Oak and Pond Two in both directions, and migration to Deep Pond from both Oak Pond and Pond Two). We also found that the three focal ponds are genetically diverse with low genetic structure, which supports evidence for migration among focal ponds.
Genetic estimates indicate that there is more migration among ponds compared to the lower migration estimates indicated by CMR data for adults (Figure 1). Interestingly, ambystomid movement differs among different groups. For instance, Trenham et al. [46] reported frequent interpond movement of A. californiensis individuals, but Church [39] did not find this pattern in A. tigrinum at the Maple Flats Sinkhole Complex. The observed differences between genetic and CMR estimates reported here may be due to the different methods used to estimate migration. For instance, the CMR method estimates the actual movement of individuals between populations and for this study comprises four years of CMR data for adult animals, but does not take into account juvenile movement. Furthermore, BAYESASS+ calculates the average migration over the past one to three generations, which is roughly two to twelve years for A. opacum. Therefore, we could be sampling a marginally different timeframe with each of the datasets. Interestingly, Wang and Schaffer [4] noted that their migration estimates were congruent between field-based and molecular data. They suggest that the biology of ambystomid dispersal/migration (short distances, likelihood of reproduction) could explain their results. Specifically, the fact that dispersal takes place over a small distance and reproduction is equally likely for both dispersers and residents may explain similar results between field- and genetic-based estimates.
The migration data suggest a possible source-sink dynamic among the three focal ponds. For instance, Pond Two may be a source population for the other ponds and a source for Oak to a lesser extent. CMR migration patterns suggest that individuals migrate out of Pond Two and Oak more than Deep. Similarly, genetic data indicate that migrants are more likely to move out of Pond Two and Oak than migrate out of Deep. Previous field observations suggest that Pond Two is a generally a poor-quality habitat and has been noted to be a “sink” population in more years than a “source” population [26,47,48], which may explain the similar pattern of migration between field and genetic migration estimates. Notably, the migration estimates indicate that most individuals remain in their home pond. We found that migration rates back into natal ponds ranged between 0.88 and 0.98—this coincides with the work assessing the philopatric nature of A. opacum, where 91% of first-time breeders return to natal ponds and 96.4% of adults maintain breeding site fidelity [31].
Despite the general trait of natal pond fidelity of ambystomatid salamanders, our results highlighted some migration out of ponds. This finding coincides with Gamble et al. [31] where the authors found that less than ten percent of individuals moved to new ponds. Therefore, understanding how the individuals are likely to move through different habitat types may be informative for conservation practices. We found that the least-cost paths built on genetic data indicated that individuals more readily traverse clear-cut patches compared to the paths built on field data, which comprise lengthier and more complex paths to avoid clear cut habitat (Figure 2). Statistical comparisons of the paths between the maps support that the paths built on field costs are more complex than paths built using genetic costs (see results). These differences have implications that are useful for conservation management plans. For instance, field data supports the conservation of forest and the restriction of clear-cutting to preserve salamander migration within the metapopulation. Forest patches tend to be more shaded with a less dense understory, whereas previously clear-cut areas have a much denser and drier understory [49]. Such habitats have been shown to hinder movement of some organisms [50,51]. In addition, amphibians prefer to travel through wetland habitat [52], where open dry areas are thought to limit movement in salamanders [8,53]. Together, these studies support the hypothesis that salamanders prefer to travel through forest habitat [54], ultimately supporting the habitat costs and dispersal map derived from field data. We attribute any paths through clear-cuts to “cracks,” which result when narrow, costly features, in this case narrow clear-cut areas, lead to the erroneous identification of “shortcuts” across habitats that are costly [55]. Juvenile salamanders are able to perceive forest habitat from approximately 10 m away [56], so these small clear-cut areas may not be costly if the juveniles move swiftly and in a straight line through these areas. On the other hand, paths based on genetic costs suggest that limited levels of clear-cutting may not significantly impact dispersal if ponds continue to be part of the landscape and forest exists at a close distance. Pittman and Semlitsch [56] found that dispersing juveniles of Ambystoma maculatum tend to move in straight lines through field habitat. These fields could be comparable to clear-cut habitat in this study in that the fields are more open, unguarded spaces that individuals must traverse in comparison to closed forest habitat. This observation may explain the paths identified in this study based on genetic costs, as these paths tend to be more likely to move through clear-cuts in a straight direction. Taken together, the results presented in this study suggest that minimal clear-cutting may not be detrimental to genetic exchange among marbled salamander populations, but it is ideal to conserve forests where possible to maximize potential areas of movement among ponds. Notably, our genetic study does not provide insight into how clear-cuts may affect survival, growth rates, and other life history parameters that are relevant to the viability of populations.
The estimated migration and gene flow among ponds from CMR data and BAYESASS, respectively, also supports the high genetic diversity estimates of each pond. We found that the ponds are relatively genetically diverse (Table 2) and are not very genetically structured (Table 3). The genetic diversity estimates are similar to those reached in another study of A. opacum in Massachusetts [57]. One locus in this study (AmaD328) comprised more alleles than the others, so these estimates of observed heterozygosity should be interpreted with some caution, although reanalysis of the data with the removal of AmaD328 did not dramatically alter the findings. The apparent lack of structuring also coincides with the estimated migration among ponds. Given the short distances between the focal ponds (between 200–400 m), it not surprising that there is low genetic structuring. In other ambystomatid salamanders, population structuring was often not recovered unless populations were greater than one kilometer apart [58,59,60,61]. As such, the genetic diversity estimates coincide with the dispersal and migration patterns—while individuals remain at their natal pond, enough individuals move among ponds to maintain genetic diversity and reduce genetic structuring among the focal ponds.
Collectively, the data suggest that both molecular-based and CMR-based migration estimates are relatively similar and that both datasets may be informative of the actual movements of individuals. As the CMR data do not distinguish between adult and juvenile movement, genetic data may provide a more detailed insight into the interpond connectivity. Given the biology of A. opacum, it is possible that either means of estimating migration may be useful for constructing conservation management plans in states where the marbled salamander is threatened or endangered. Results support considering habitat between ponds and conserving the habitat type that will be most conducive to individuals’ migration both among ponds and back to their natal ponds.

Supplementary Materials

The following supporting information can be downloaded at: https://www.mdpi.com/article/10.3390/d14070524/s1, Table S1: Characteristics of the seven microsatellite loci used in this study to estimate gene flow between three populations of Ambystoma opacum; Table S2: Relative costs assigned to pond border, forest, and clear-cut habitats derived from field and genetic estimates of connectivity used to predict dispersal routes; Table S3: Geographic properties of the 110 least-cost paths constructed from field and genetic based habitat costs for Ambystoma opacum in the Maple Flats Sinkhole Complex.

Author Contributions

Conceptualization, S.A.C., D.R.C. and K.E.P.-L.; methodology, K.E.P.-L., K.L.G. and J.T.F.; formal analysis, K.E.P.-L., K.L.G. and J.T.F.; data curation, K.L.G.; writing—original draft preparation, K.L.G. and K.E.P.-L.; writing—review and editing, all authors; funding acquisition, S.A.C., K.E.P.-L. and D.R.C. All authors have read and agreed to the published version of the manuscript.

Funding

The genetic work in this study was funded by The George Washington University Bunting Fund and Sophie Danforth Conservation Biology Fund to K.L.P and by a National Science Foundation grant (DEB-0816681) to S.A.C. The CMR study was funded in part by the U.S. Forest Service, National Science Foundation, National Fish and Wildlife Foundation, Conservation International, Sigma Xi Scientific Society grants to D. C. and Henry M. Wilbur.

Institutional Review Board Statement

Ethical review and approval are waived as the samples were collected in the 1990s prior to need for ethical clearance of such studies. No animals were harmed, killed, or transferred out of the field for this study.

Data Availability Statement

Data are available via OSF link: https://osf.io/a2smq/?view_only=ef603c3c05584cdc88fb7776520cee10 (accessed 24 June 2021).

Conflicts of Interest

The authors declare no conflict of interest.

References

  1. Cayuela, H.; Rougemont, Q.; Prunier, J.G.; Moore, J.S.; Clobert, J.; Besnard, A.; Bernatchez, L. Demographic and genetic approaches to study dispersal in wild animal populations: A methodological review. Mol. Ecol. 2018, 27, 3976–4010. [Google Scholar] [CrossRef]
  2. Fahrig, L.; Merriam, G. Habitat patch connectivity and population survival: Ecological archives e066-008. Ecology 1985, 66, 1762–1768. [Google Scholar] [CrossRef]
  3. Lowe, W.H.; Allendorf, F.W. What can genetics tell us about population connectivity? Mol. Ecol. 2010, 19, 3038–3051. [Google Scholar] [CrossRef]
  4. Wang, I.J.; Shaffer, H.B. Population genetic and field-ecological analyses return similar estimates of dispersal over space and time in an endangered amphibian. Evol. Appl. 2017, 10, 630–639. [Google Scholar] [CrossRef]
  5. Andreasen, A.M.; Stewart, K.M.; Longland, W.S.; Beckmann, J.P.; Forister, M.L. Identification of source-sink dynamics in mountain lions of the G reat B asin. Mol. Ecol. 2012, 21, 5689–5701. [Google Scholar] [CrossRef] [Green Version]
  6. Kool, J.T.; Moilanen, A.; Treml, E.A. Population connectivity: Recent advances and new perspectives. Landsc. Ecol. 2013, 28, 165–185. [Google Scholar] [CrossRef]
  7. Cushman, S.A.; Landguth, E.L.; Flather, C.H. Evaluating population connectivity for species of conservation concern in the American Great Plains. Biodivers. Conserv. 2013, 22, 2583–2605. [Google Scholar] [CrossRef] [Green Version]
  8. DeMaynadier, P.G.; Hunter, M.L., Jr. The relationship between forest management and amphibian ecology: A review of the North American literature. Environ. Rev. 1995, 3, 230–261. [Google Scholar] [CrossRef]
  9. Beebee, T.J.; Griffiths, R.A. The amphibian decline crisis: A watershed for conservation biology? Biol. Conserv. 2005, 125, 271–285. [Google Scholar] [CrossRef]
  10. Collins, J.P.; Storfer, A. Global amphibian declines: Sorting the hypotheses. Divers. Distrib. 2003, 9, 89–98. [Google Scholar] [CrossRef]
  11. Belasen, A.M.; Bletz, M.C.; Leite, D.d.S.; Toledo, L.F.; James, T.Y. Long-term habitat fragmentation is associated with reduced MHC IIB diversity and increased infections in amphibian hosts. Front. Ecol. Evol. 2019, 6, 236. [Google Scholar] [CrossRef] [Green Version]
  12. Petranka, J.W. Salamanders of the United States and Canada Smithsonian; Smithsonian Books: Washington, DC, USA, 1998. [Google Scholar]
  13. Vos, C.C.; Chardon, J. Effects of habitat fragmentation and road density on the distribution pattern of the moor frog Rana arvalis. J. Appl. Ecol. 1998, 35, 44–56. [Google Scholar] [CrossRef]
  14. Wang, I.J.; Savage, W.K.; Bradley Shaffer, H. Landscape genetics and least-cost path analysis reveal unexpected dispersal routes in the California tiger salamander (Ambystoma californiense). Mol. Ecol. 2009, 18, 1365–1374. [Google Scholar] [CrossRef]
  15. Croshaw, D.A.; Schable, N.A.; Peters, M.B.; Glenn, T.C. Isolation and characterization of microsatellite DNA loci from Ambystoma salamanders. Conserv. Genet. 2005, 6, 473–479. [Google Scholar] [CrossRef]
  16. Broquet, T.; Petit, E.J. Molecular estimation of dispersal for ecology and population genetics. Annu. Rev. Ecol. Evol. Syst. 2009, 40, 193–216. [Google Scholar] [CrossRef]
  17. Fedy, B.; Martin, K.; Ritland, C.; Young, J. Genetic and ecological data provide incongruent interpretations of population structure and dispersal in naturally subdivided populations of white-tailed ptarmigan (Lagopus leucura). Mol. Ecol. 2008, 17, 1905–1917. [Google Scholar] [CrossRef]
  18. Cowen, R.K.; Paris, C.B.; Srinivasan, A. Scaling of connectivity in marine populations. Science 2006, 311, 522–527. [Google Scholar] [CrossRef] [Green Version]
  19. LaRue, M.A.; Nielsen, C.K. Modelling potential dispersal corridors for cougars in midwestern North America using least-cost path methods. Ecol. Model. 2008, 212, 372–381. [Google Scholar] [CrossRef]
  20. Coulon, A.; Cosson, J.; Angibault, J.; Cargnelutti, B.; Galan, M.; Morellet, N.; Petit, E.; Aulagnier, S.; Hewison, A. Landscape connectivity influences gene flow in a roe deer population inhabiting a fragmented landscape: An individual–based approach. Mol. Ecol. 2004, 13, 2841–2850. [Google Scholar] [CrossRef]
  21. Etherington, T.R. Least-cost modelling and landscape ecology: Concepts, applications, and opportunities. Curr. Landsc. Ecol. Rep. 2016, 1, 40–53. [Google Scholar] [CrossRef] [Green Version]
  22. Stevens, V.M.; Verkenne, C.; Vandewoestijne, S.; Wesselingh, R.A.; Baguette, M. Gene flow and functional connectivity in the natterjack toad. Mol. Ecol. 2006, 15, 2333–2344. [Google Scholar] [CrossRef]
  23. Cushman, S.A.; McKelvey, K.S.; Hayden, J.; Schwartz, M.K. Gene flow in complex landscapes: Testing multiple hypotheses with causal modeling. Am. Nat. 2006, 168, 486–499. [Google Scholar] [CrossRef] [Green Version]
  24. Driezen, K.; Adriaensen, F.; Rondinini, C.; Doncaster, C.P.; Matthysen, E. Evaluating least-cost model predictions with empirical dispersal data: A case-study using radiotracking data of hedgehogs (Erinaceus europaeus). Ecol. Model. 2007, 209, 314–322. [Google Scholar] [CrossRef]
  25. Epps, C.W.; Wehausen, J.D.; Bleich, V.C.; Torres, S.G.; Brashares, J.S. Optimizing dispersal and corridor models using landscape genetics. J. Appl. Ecol. 2007, 44, 714–724. [Google Scholar]
  26. Buhlmann, K.A.; Mitchell, J.C.; Smith, L.R. Descriptive ecology of the Shenandoah Valley sinkhole pond system in Virginia. Banisteria 1999, 13, 23–51. [Google Scholar]
  27. Cartwright, J.M.; Wolfe, W.J. Insular Ecosystems of the Southeastern United States—A Regional Synthesis to Support Biodiversity Conservation in a Changing Climate; U.S. Geological Survey: Reston, VA, USA, 2016; pp. 2330–7102.
  28. Church, D.R.; Bailey, L.L.; Wilbur, H.M.; Green, J.H.; Hiby, L. Salamander Demography at Isolated Wetlands within Mature and Regenerating Forests. Diversity 2022, 14, 309. [Google Scholar]
  29. Bishop, S.C. Notes on Salamanders with Descriptions of Several New Forms; University of Michigan Press: Ann Arbor, MI, USA, 1941. [Google Scholar]
  30. Nobel, G.; Brady, M. Observations on the Life History of the Marbled salamander, Ambystoma opacum. Gravenhurst Zool. 1933, 11, 89–132. [Google Scholar] [CrossRef]
  31. Gamble, L.R.; McGarigal, K.; Compton, B.W. Fidelity and dispersal in the pond-breeding amphibian, Ambystoma opacum: Implications for spatio-temporal population dynamics and conservation. Biol. Conserv. 2007, 139, 247–257. [Google Scholar] [CrossRef]
  32. Raymond, M.; Rousset, F. An exact test for population differentiation. Evolution 1995, 49, 1280–1283. [Google Scholar] [CrossRef]
  33. Rousset, F. genepop’007: A complete re-implementation of the genepop software for Windows and Linux. Mol. Ecol. Resour. 2008, 8, 103–106. [Google Scholar] [CrossRef]
  34. Van Oosterhout, C.; Hutchinson, W.F.; Wills, D.P.; Shipley, P. MICRO-CHECKER: Software for identifying and correcting genotyping errors in microsatellite data. Mol. Ecol. Notes 2004, 4, 535–538. [Google Scholar] [CrossRef]
  35. Brookfield, J. A simple new method for estimating null allele frequency from heterozygote deficiency. Mol. Ecol. 1996, 5, 453–455. [Google Scholar] [CrossRef]
  36. Meirmans, P.; Van Tienderen, P. GENOTYPE and GENODIVE: Two programs for the analysis of genetic diversity of asexual organisms. Mol. Ecol. Notes 2004, 4, 792–794. [Google Scholar] [CrossRef]
  37. Meirmans, P.G.; Hedrick, P.W. Assessing population structure: FST and related measures. Mol. Ecol. Resour. 2011, 11, 5–18. [Google Scholar] [CrossRef]
  38. White, G.C.; Burnham, K.P. Program MARK: Survival estimation from populations of marked animals. Bird Study 1999, 46, S120–S139. [Google Scholar] [CrossRef]
  39. Church, D.R.; Bailey, L.L.; Wilbur, H.M.; Kendall, W.L.; Hines, J.E. Iteroparity in the variable environment of the salamander Ambystoma tigrinum. Ecology 2007, 88, 891–903. [Google Scholar] [CrossRef]
  40. Bailey, L.L.; Kendall, W.L.; Church, D.R.; Wilbur, H.M. Estimating survival and breeding probabilities for pond-breeding amphibians: A modified robust design. Ecology 2004, 85, 2456–2466. [Google Scholar] [CrossRef]
  41. Bailey, L.L.; Kendall, W.L.; Church, D.R. Exploring extensions to multi-state models with multiple unobservable states. In Modeling Demographic Processes in Marked Populations; Thomson, D.L., Cooch, E.G., Conroy, M.J., Eds.; Environmental and Ecological Statistics Series; Springer Science+Business Media: New York, NY, USA, 2009; Volume 3, pp. 693–710. [Google Scholar]
  42. Wilson, G.A.; Rannala, B. Bayesian inference of recent migration rates using multilocus genotypes. Genetics 2003, 163, 1177–1191. [Google Scholar] [CrossRef]
  43. Rambaut, A.; Drummond, A.J.; Xie, D.; Baele, G.; Suchard, M.A. Posterior summarization in Bayesian phylogenetics using Tracer 1.7. Syst. Biol. 2018, 67, 901–904. [Google Scholar] [CrossRef] [Green Version]
  44. Faubet, P.; Waples, R.S.; Gaggiotti, O.E. Evaluating the performance of a multilocus Bayesian method for the estimation of migration rates. Mol. Ecol. 2007, 16, 1149–1166. [Google Scholar] [CrossRef] [Green Version]
  45. Meirmans, P.G. Nonconvergence in Bayesian estimation of migration rates. Mol. Ecol. Resour. 2014, 14, 726–733. [Google Scholar] [CrossRef]
  46. Trenham, P.C.; Koenig, W.D.; Shaffer, H.B. Spatially autocorrelated demography and interpond dispersal in the salamander Ambystoma californiense. Ecology 2001, 82, 3519–3530. [Google Scholar] [CrossRef] [Green Version]
  47. Church, D.R. Population Ecology of Ambystoma tigrinum (Caudata, Ambystomidae) and Occupancy Dynamics in an Appalachian Pond-breeding Amphibian Assemblage; University of Virginia: Charlottesville, VA, USA, 2004. [Google Scholar]
  48. Mitchell, J.C.; Buhlmann, K. Amphibians and reptiles of the Shenandoah Valley sinkhole pond system in Virginia. Banisteria 1999, 13, 129–142. [Google Scholar]
  49. Swartz, R.E.; Kocka, D.M. Wildlife Management Activities in Big Levels, Augusta County, Virginia: An Overview. Banisteria 1999, 13, 11–15. [Google Scholar]
  50. Johnston, B.; Frid, L. Clearcut logging restricts the movements of terrestrial Pacific giant salamanders (Dicamptodon tenebrosus Good). Can. J. Zool. 2002, 80, 2170–2177. [Google Scholar] [CrossRef]
  51. Templeton, A.R.; Robertson, R.J.; Brisson, J.; Strasburg, J. Disrupting evolutionary processes: The effect of habitat fragmentation on collared lizards in the Missouri Ozarks. Proc. Natl. Acad. Sci. USA 2001, 98, 5426–5432. [Google Scholar] [CrossRef] [Green Version]
  52. Funk, W.C.; Blouin, M.S.; Corn, P.S.; Maxell, B.A.; Pilliod, D.S.; Amish, S.; Allendorf, F.W. Population structure of Columbia spotted frogs (Rana luteiventris) is strongly affected by the landscape. Mol. Ecol. 2005, 14, 483–496. [Google Scholar] [CrossRef] [Green Version]
  53. Rothermel, B.B.; Semlitsch, R.D. An experimental investigation of landscape resistance of forest versus old-field habitats to emigrating juvenile amphibians. Conserv. Biol. 2002, 16, 1324–1332. [Google Scholar] [CrossRef] [Green Version]
  54. Todd, B.D.; Luhring, T.M.; Rothermel, B.B.; Gibbons, J.W. Effects of forest removal on amphibian migrations: Implications for habitat and landscape connectivity. J. Appl. Ecol. 2009, 46, 554–561. [Google Scholar] [CrossRef]
  55. Rothley, K. Finding and filling the “cracks” in resistance surfaces for least-cost modeling. Ecol. Soc. 2005, 10, 4. [Google Scholar] [CrossRef] [Green Version]
  56. Pittman, S.; Semlitsch, R. Habitat type and distance to edge affect movement behavior of juvenile pond-breeding salamanders. J. Zool. 2013, 291, 154–162. [Google Scholar] [CrossRef]
  57. Whiteley, A.R.; McGarigal, K.; Schwartz, M.K. Pronounced differences in genetic structure despite overall ecological similarity for two Ambystoma salamanders in the same landscape. Conserv. Genet. 2014, 15, 573–591. [Google Scholar] [CrossRef]
  58. Purrenhage, J.; Niewiarowski, P.; Moore, F.G. Population structure of spotted salamanders (Ambystoma maculatum) in a fragmented landscape. Mol. Ecol. 2009, 18, 235–247. [Google Scholar] [CrossRef] [PubMed]
  59. Spear, S.F.; Peterson, C.R.; Matocq, M.D.; Storfer, A. Landscape genetics of the blotched tiger salamander (Ambystoma tigrinum melanostictum). Mol. Ecol. 2005, 14, 2553–2564. [Google Scholar] [CrossRef] [PubMed]
  60. Storfer, A. Gene flow and endangered species translocations: A topic revisited. Biol. Conserv. 1999, 87, 173–180. [Google Scholar] [CrossRef]
  61. Zamudio, K.R.; Wieczorek, A.M. Fine-scale spatial genetic structure and dispersal among spotted salamander (Ambystoma maculatum) breeding populations. Mol. Ecol. 2007, 16, 257–274. [Google Scholar] [CrossRef]
Figure 1. Estimates of population connectivity for Ambystoma opacum in the Maple Flats Sinkhole Complex, VA, USA. (a) Capture-mark-recapture migration estimates, measured as movement probabilities, averaged over a four-year study. Standard errors are in brackets. (b) Means of the posterior distributions of m, the average recent gene flow represented as proportion of migrants, calculated in the program BAYESASS. Standard deviations are in brackets.
Diversity 14 00524 g001
Figure 2. Habitat maps showing dispersal routes between breeding ponds of marbled salamanders (Ambystoma opacum) in the Maple Flats Sinkhole Pond Complex calculated using least-cost path analysis. Black lines represent paths, clear-cut areas are dark gray, and ponds are light gray. Ponds labeled in this map include Oak Pond (OP), Deep Pond (DP), Pond Two (P2), Pond 19 (P19), Mystery Pond (MP), Kennedy Mountain Meadows (KM), Spring Pond (SP), Twin Pond (TP), Pond 14 (P14), Pond 5 (P5) and Pond 4 (P4). The red outlines clear-cut areas where there are clear differences between field costs and genetic costs. Dispersal maps were constructed using habitat costs derived from field estimates of migration (A) and genetic estimates of migration (B).
Diversity 14 00524 g002
Table 1. Genetic diversity estimates of the three focal ponds for Ambystoma opacum in the Maple Flats Sinkhole Complex.
PopulationNNeHoHs
Oak998.7145.0640.6760.692
Deep9.4294.5730.7040.680
Pond28.1434.5010.6430.672
N = number of alleles, Ne = number of effective alleles, Ho = observed heterozygosity, Hs = expected heterozygosity.
Table 2. Analysis of molecular variance among three focal ponds of A. opacum. F-values were calculated using the stepwise mutation model, as such F-values are equivalent to RST.
Source of Variation% VariationFp-Value
Within populations0.224
Among populations0.0080.0080.181
Table 3. Pairwise population differentiation using G”ST (below the diagonal) and p values (above the diagonal) as well as inbreeding coefficient GIS (along the diagonal and bolded) for each of the three ponds of Ambystoma opacum in the Maple Flats Sinkhole complex. An asterisk (*) indicates significance.
OAKDEEPPOND2
OAK0.0240.7970.071
DEEP–0.002–0.0350.108
POND20.0050.0040.043 *
Publisher’s Note: MDPI stays neutral with regard to jurisdictional claims in published maps and institutional affiliations.

