Article

Evaluation of Production–Living–Ecological Functions in Support of SDG Target 11.a: Case Study of the Guangxi Beibu Gulf Urban Agglomeration, China

1
College of Geography and Planning, Nanning Normal University, Nanning 530001, China
2
Beijing Key Laboratory for Remote Sensing of Environment and Digital Cities, Faculty of Geographical Science, Beijing Normal University, Beijing 100875, China
3
College of Natural Resources and Surveying, Nanning Normal University, Nanning 530001, China
4
Manpower Logistics Academy, Guangxi Vocational and Technical College, Nanning 530226, China
*
Author to whom correspondence should be addressed.
Diversity 2022, 14(6), 469; https://doi.org/10.3390/d14060469
Submission received: 10 April 2022 / Revised: 2 June 2022 / Accepted: 9 June 2022 / Published: 11 June 2022
(This article belongs to the Special Issue Ecosystem Observation, Simulation and Assessment)

Abstract

:
Sustainable Development Goals (SDGs) target 11.a is a good vision for the coordinated development of the economy, society and environment in urban agglomerations. However, there was an extreme lack of indicators, data or case studies for SDG target 11.a, since it is a vague “process target”, which is not conducive to the implementation of SDG target 11.a. It is important to propose a quantitative, convenient, and local policies relevant method to promote the realization or to test the implementation effects of SDG target 11.a. Combined with socio-economic data and land use data, this study uses the methods of comprehensive evaluation model, coupling and coordination degree, and comparative advantage degree methods to study the pattern evolution, coordination characteristics and advantageous areas of production–living–ecological (PLE) functions in the Guangxi Beibu Gulf Urban Agglomeration (GBG_UA) from 1995 to 2019. The results showed that, (1) considering the spatiotemporal distribution of PLE functions, the study area has a relatively stable ecological function as well as fluctuating production and living functions. Considering the coordination characteristics of PLE functions, high–high and low–low clustering effects were observed, and primary coordination maintained the highest proportion, accounting from 55.26% in 1995 to 71.05% in 2019, indicating the SDG target 11.a level in the GBG_UA was poor. Considering the advantageous areas for PLE functions, the region mostly comprises single-function advantageous areas and a few multifunction advantageous areas, including 20 single-function advantage counties (accounting for 52%), 15 dual-function advantage counties (accounting for 39%), and three multi-function advantage counties (accounting for 7.8%), which indicates the lack of diversified land use structures in this region. (2) Optimization suggestions for the coordinated development and realization of SDG target 11.a for the GBG_UA were provided. Suggestions were made based on the radiation and driving role of Nanning city to guide the coordinated development of surrounding counties (districts). Suggestions were also made to improve the design of the integrated transportation network as well as to optimize allocation according to the resource endowment of land and to realize an upgraded ecology as well as agricultural products and services. (3) The evaluation of PLE functions is a quantitative and convenient method that can optimize national and regional development planning and test the implementation effects of SDG target 11.a. This study offers foundational knowledge for the realization of SDG target 11.a in the GBG_UA and provides a reference for the research and implementation of SDG target 11.a in other regions around the world.

1. Introduction

The Sustainable Development Goals (SDGs) were first proposed at the 2012 Rio Earth Summit [1]. In total, 193 countries around the world jointly signed “Changing our future: 2030 Agenda for Sustainable Development” in September 2015. The SDGs framework could be regarded as the blueprint that promotes sustainable development of Member States, which commit to the harmony of ecological environment and social economy. They address the global challenges we face, including poverty, inequality, climate change, environmental degradation, peace and justice, and the SDGs have become a global research hotspot in recent years. In July 2017, the United Nations General Assembly adopted the global indicator framework, which included 17 goals, 169 targets and 232 indicators [2], in which Goal 11 proposed to “Make cities inclusive, safe, resilient and sustainable”. Urban agglomerations include urban, peri urban, and rural areas that, are gathering areas for human activities. For example, comprising 29.12% of the national land area, Chinese urban agglomerations concentrate 75.19% of the total population, 80.05% of the GDP, 82.37% of the total social fixed asset investment and 91.19% of the national fiscal revenue [3]. Nevertheless, there are still many problems regarding the development of urban agglomerations, such as rapid economic development, the rapid expansion of urban construction, the crowding out of ecological space, prominent resource and environmental problems, and the deterioration of the human living environment [4,5,6], as such, SDG target 11.a proposed to “Support positive economic, social and environmental links between urban, peri urban and rural areas by strengthening national and regional development planning”, and SDG target 11.a is a good vision for the coordinated development of economy, society, and environment in urban agglomerations [7].
There have been many studies on the goal, targets and indicators of SDG11. For example, in terms of theory, Caprotti et al. discussed important policy and practical opportunities as well as challenges of the new urban agenda [8]; Mccarton et al. explored the key components needed to achieve safe, resilient and sustainable cities and communities in the EU [9]; and Lawanson et al. revealed that paucity of data, weak institutional capacity as well as poor governance strategies are major impediments to mainstreaming SDG11 in Lagos, Nigeria [10]. In terms of indicators and data, Cochran et al. took EnviroAtlas as an example to show and analyze how earth observation indicators can help fill the gaps in SDG monitoring data [11]. Ni et al. constructed an indicator system for the SDG 11.1–11.7 targets in the urban dimensions in China; however, SDG target 11.a−11.c targets were not included [12]. In terms of case studies, Patel took Cape Town as an example to explore the role of urban experimentation in helping cities cope with the data and governance challenges faced in the implementation of SDG 11 [13]. Abubakar et al. assessed the implementation of SDG11 in Nigeria at the national level [14]. However, there is an extreme lack of indicators, data or case studies for SDG target 11.a, which is not conducive to the implementation of SDG target 11.a.
There are two kinds of targets that are included in SDG 11: one kind are the so-called “outcome targets”, which are marked by numbers, e.g., 11.1, 11.2, 11.3, etc., the others are so-called “process targets”, which are marked with letters, e.g., 11.a, 11.b, etc. [15]. The indicators of “outcome targets” are clear and quantifiable, but those of “process targets” are not, they are vague. Klopp and Petretta investigated the relationship between indicators, complexity, and the politics of measuring cities, emphasizing the need to reduce the vagueness of indicators to avoid fuzziness in local implementation [16]. Thus far, only Erblin et al. have developed a set of SDG target 11.a indicators to assess the quality of spatial governance and planning in Europe [15]. However, this method requires many indicators that are difficult to obtain, and this method is based on the European context. Hansson et al. suggested that domestic actors should be allowed to select indicators “that fulfil the criteria of easy measurement or collection, appropriateness, convenience and relevance to current conditions and national and local development policies, priorities and programmes” [17]. As a result, it is urgent to find quantitative, convenient, and local policies relevant evaluation method and case study for SDG target 11.a.
Land is the carrier of all human activities, and land use is multifunctional [18]. Optimizing management options from the perspective of multifunctional land use can promote sustainable land management [19]. In the European project “Sustainability Impact Assessment: Tools for Environmental Social and Effects of Multifunctional Land Use in Europe Regions (SENSOR)”, land-use functions are classified into three main functions: economic, social and environmental functions [20]. In China, it has been proposed that all human land relations are embodied and included in the utilization of production function, living function, and ecological function [21], which are called production–living–ecological (PLE) functions. China wanted to “promote intensive and efficient production space, appropriate living space and beautiful ecological space” in 2012, and further emphasized that policies should “firmly follow the civilized development path of production development, affluent living and good ecology” in 2017. This represents the planning framework for the coordinated development of PLE functions, which means supporting a positive production function (economy), living function (social), and ecological function (environmental) links by land spatial planning at the national, provincial, prefectural, district, and county levels. Therefore, the coordination of PLE functions is consistent with the national and local development policies, and it can be quantitatively evaluated and has strong operability. Therefore, evaluating of PLE functions is of great significance when formulating reasonable local development planning locally, constructing positive economic, social and environmental links and serving SDG target 11.a.
In recent years, great progress has been made in the evaluation of PLE functions. Since pattern evolution can grasp the spatial distribution patterns and development trends of PLE functions, the coordination characteristics reveal the degree of interaction and game process of PLE functions, and advantageous areas show the natural resources and economic social development of each space unit, PLE functions can be comprehensively evaluated by these indicators. The comprehensive evaluation model [18,22,23], coupling and coordination degree [24,25,26] and comparative advantage degree [27] were used to study the function value, pattern evolution, coordination characteristics and advantageous areas of PLE functions, and the results showed that these methods were very effective, which provided a good technical basis for our study. Although PLE functions play an important role in the SDGs, the existing studies on PLE functions are lack of connection with the SDGs, which is not conducive to providing decision-making services for sustainable development.
Overall, the objectives of this research were as follows:
(1)
Propose a quantitative, convenient, and local policies relevant evaluation method for SDG target 11.a based on evaluating of PLE functions.
(2)
Take the Guangxi Beibu Gulf Urban Agglomeration (GBG_UA), which is one of the new urban agglomerations constructed in China as an example, and analyze the pattern evolution, coordination characteristics, and advantageous areas of PLE functions from 1995 to 2019 and offer foundational knowledge for the development planning and realization of SDG11.a.
(3)
Put forward the optimization of the development planning of PLE functions in the GBG_UA and promote the realization of SDG target 11.a locally. At the same time, this study aims to provide a reference for the research and implementation of SDG target 11.a. in other regions around the world.

2. Materials and Methods
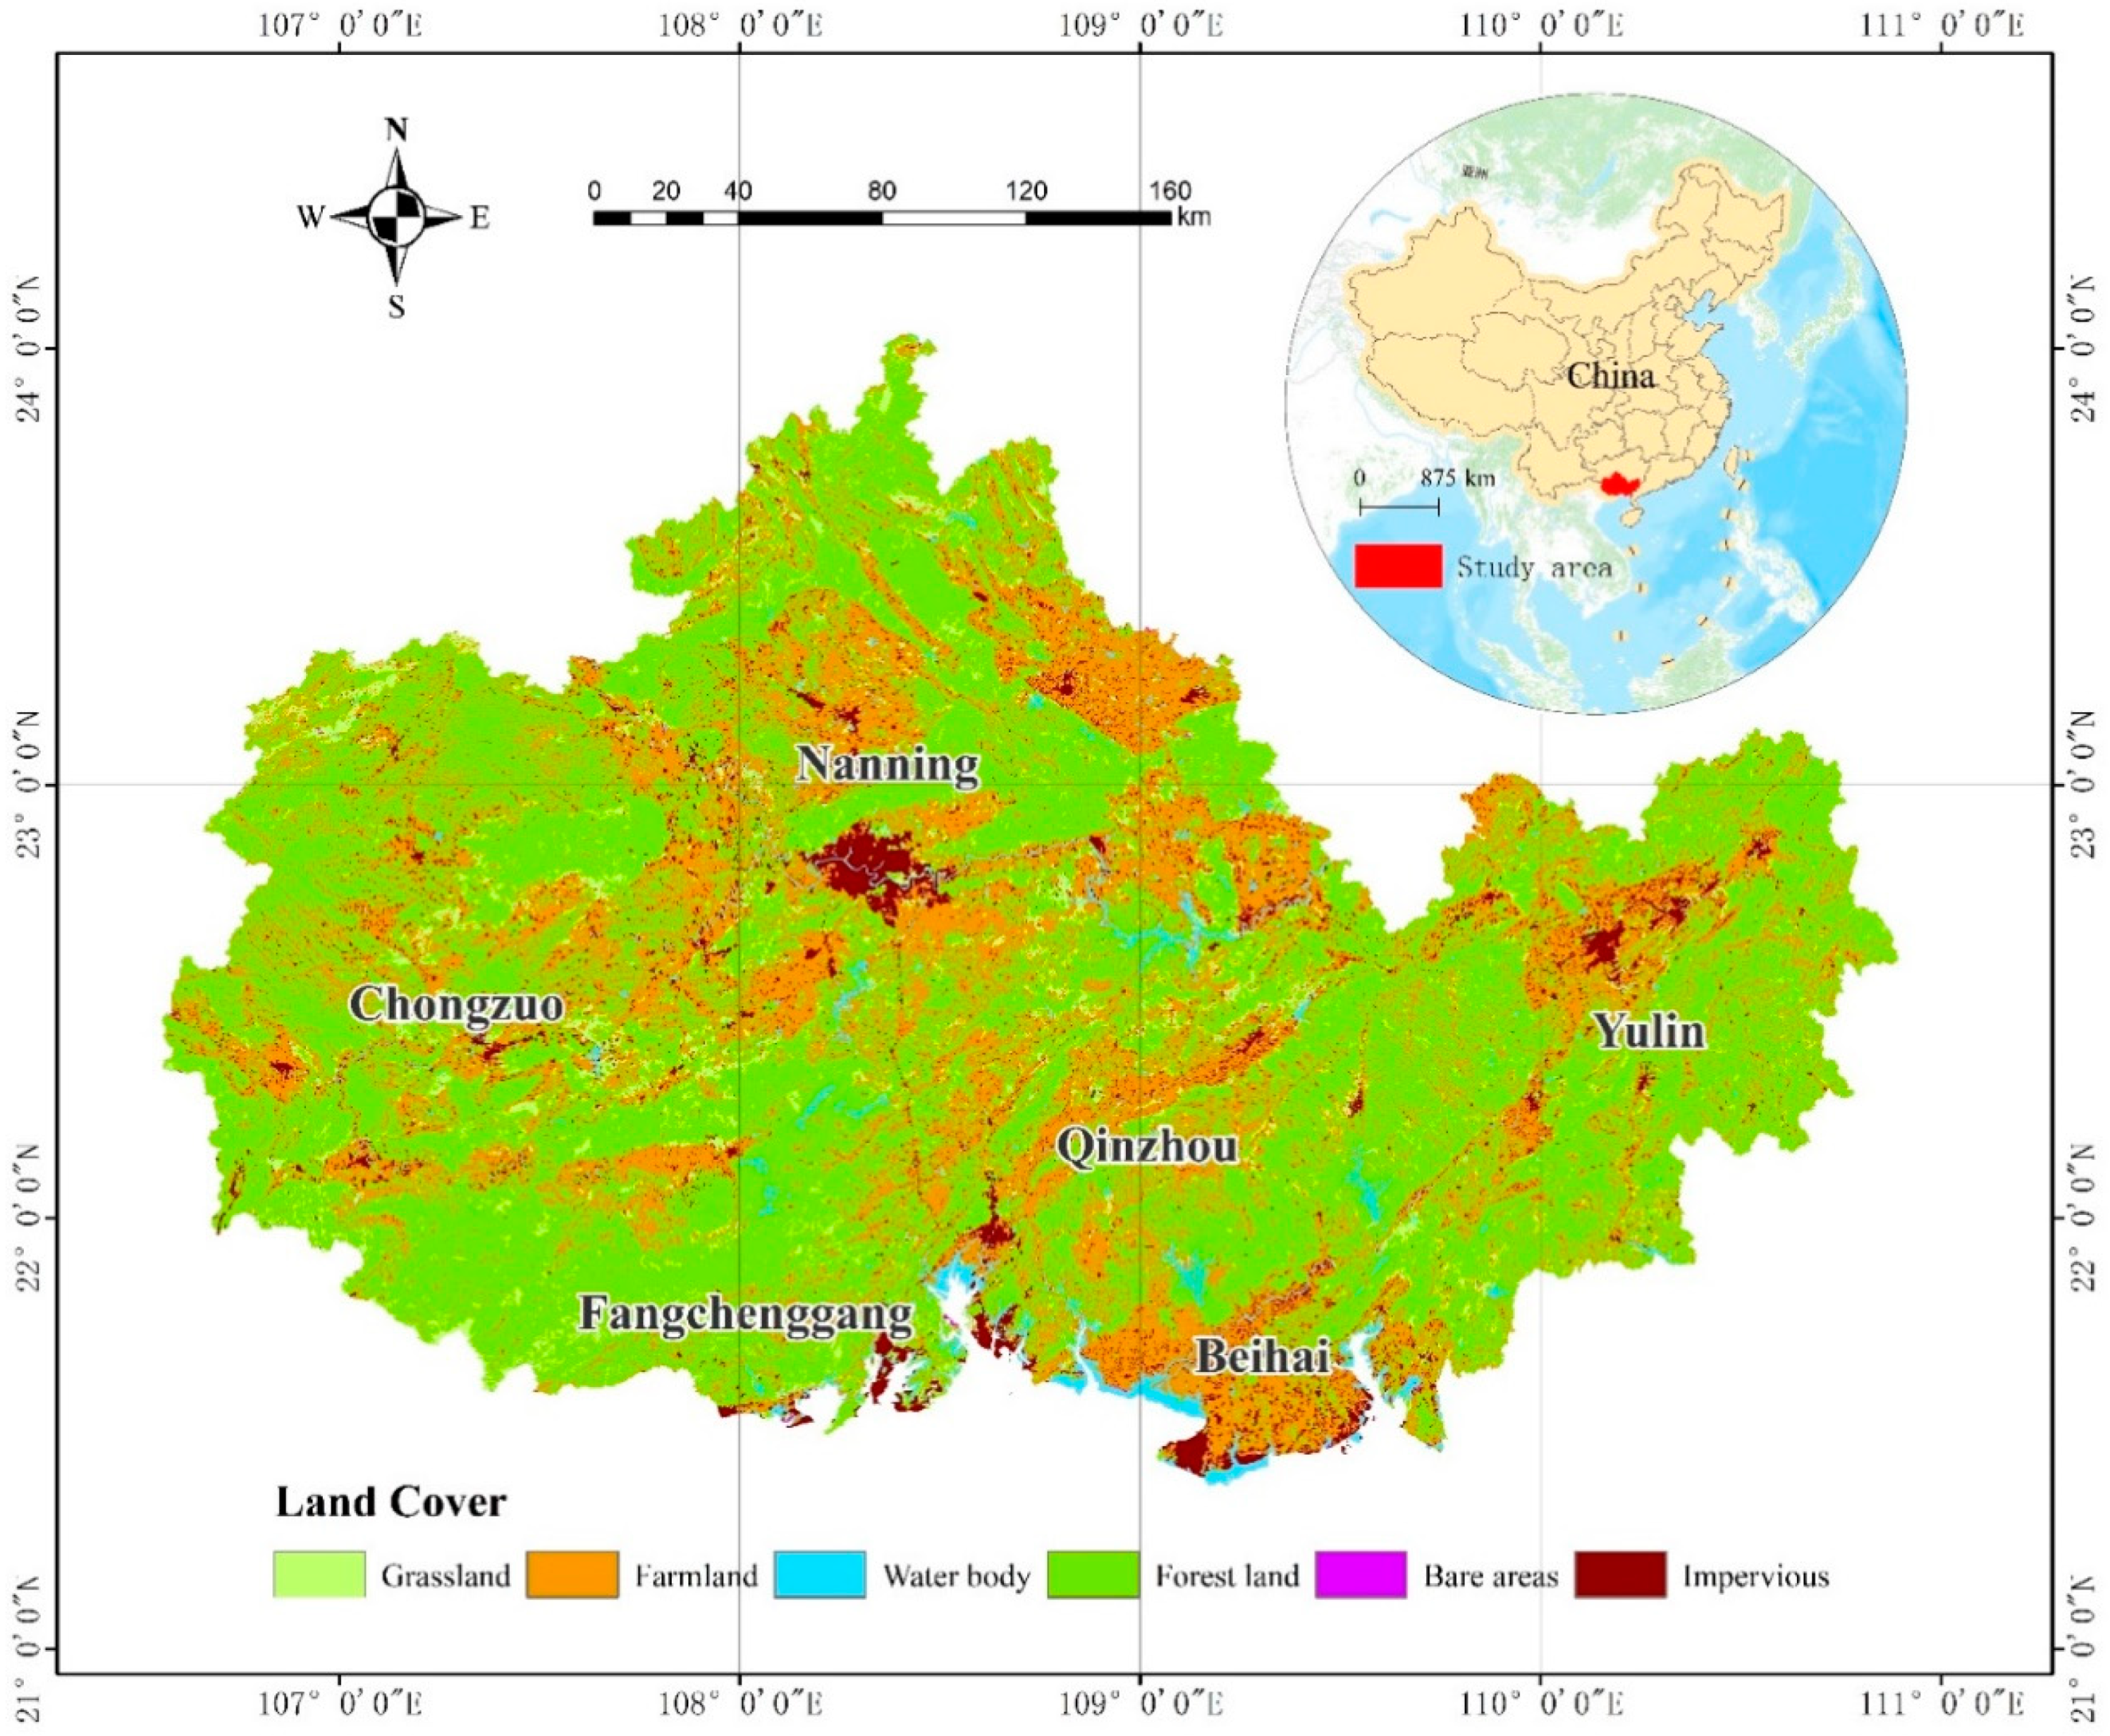
2.1. Study Area

The GBG_UA is located between 20°26′ N and 24°02′ N, and between 106°33′ E and 110°53′ E (Figure 1), and is one of the new urban agglomerations in the south of China [28], with 6 prefecture-level cities and 38 counties (districts) being included in the area. The terrain is high in the west, north, and east; inclines in the middle and south; and there are karst mountains in the west. Complex hills and small basins have formed in the middle of continuous mountains, and piedmont plains, river alluvial plains and deltas are formed in the south. The GBG_UA has a large amount of forest land and farmland, so it has a high ecological level and a good agricultural industrial foundation, and it has great potential to provide ecology, agricultural products and services [29]. The development intensity of the GBG_UA is low, and there is a relatively large stock of land resources that can be developed into construction land. Located in the tropical and subtropical zone, the study area is affected by high temperatures, abundant heat, and rich rainfall. The agglomeration is in the largest bay in southern China and ranks first in China for the quality of its ecological environment. It has plenty of ports, a long coastline, and oil and gas, agricultural, forestry, and tourism resources. The region has a flat terrain, a large environmental capacity, and a strong population and economy carrying capacity. The cities in the GBG_UA have profound historical and humanistic origins. In recent years, major planning, resource development and utilization, industrial layout, and public services have been integrated, and the integrated development of the GBG_UA has a solid foundation, strong momentum, and huge potential.

2.2. Data Sources

The data used in this paper mainly include land use maps and socioeconomic data, which are used to establish the evaluation system for the PLE functions in the GBG_UA. The details are as follows. (1) Land Use Data: The land use data for the study area from 1995 to 2019 were derived from remote sensing monitoring data such as Landsat TM/ETM+ and HJ-1A/1B with a spatial resolution 30 m × 30 m. There are six first-class types including farmland, forest land, grassland, water body, impervious and bare areas, and 25 s-class land use types, including forest land, shrub forest, sparse forest land, other forest land and grassland with high, medium, and low coverage in the land use data, and its classification accuracy degree is greater than 90% [30]. The data are from the Resource and Environmental Science and Data Center of Chinese Academy of Sciences (https://www.resdc.cn, accessed on 1 June 2021), the Ministry of Ecology and Environment’s Center for Satellite Application on Ecology and Environment, and the China National Environmental Monitoring Center. (2) Socioeconomic Data: The socioeconomic data for the study area from 1995 to 2019 are mainly derived from the Statistical Yearbook of Guangxi Zhuang Autonomous Region, the Statistical Yearbook of Nanning City, the Statistical Yearbook of Beihai City, the Statistical Yearbook of Qinzhou City, the Statistical Yearbook of Fangchenggang City, the Statistical Yearbook of Chongzuo City, the Statistical Yearbook of Yulin City, and from the socioeconomic statistical communiques of cities and counties. (3) Administrative Division Data: The administrative division data are derived from the National Geomatics Center of China (http://www.ngcc.cn/ngcc, accessed on 1 June 2021).

2.3. Methods

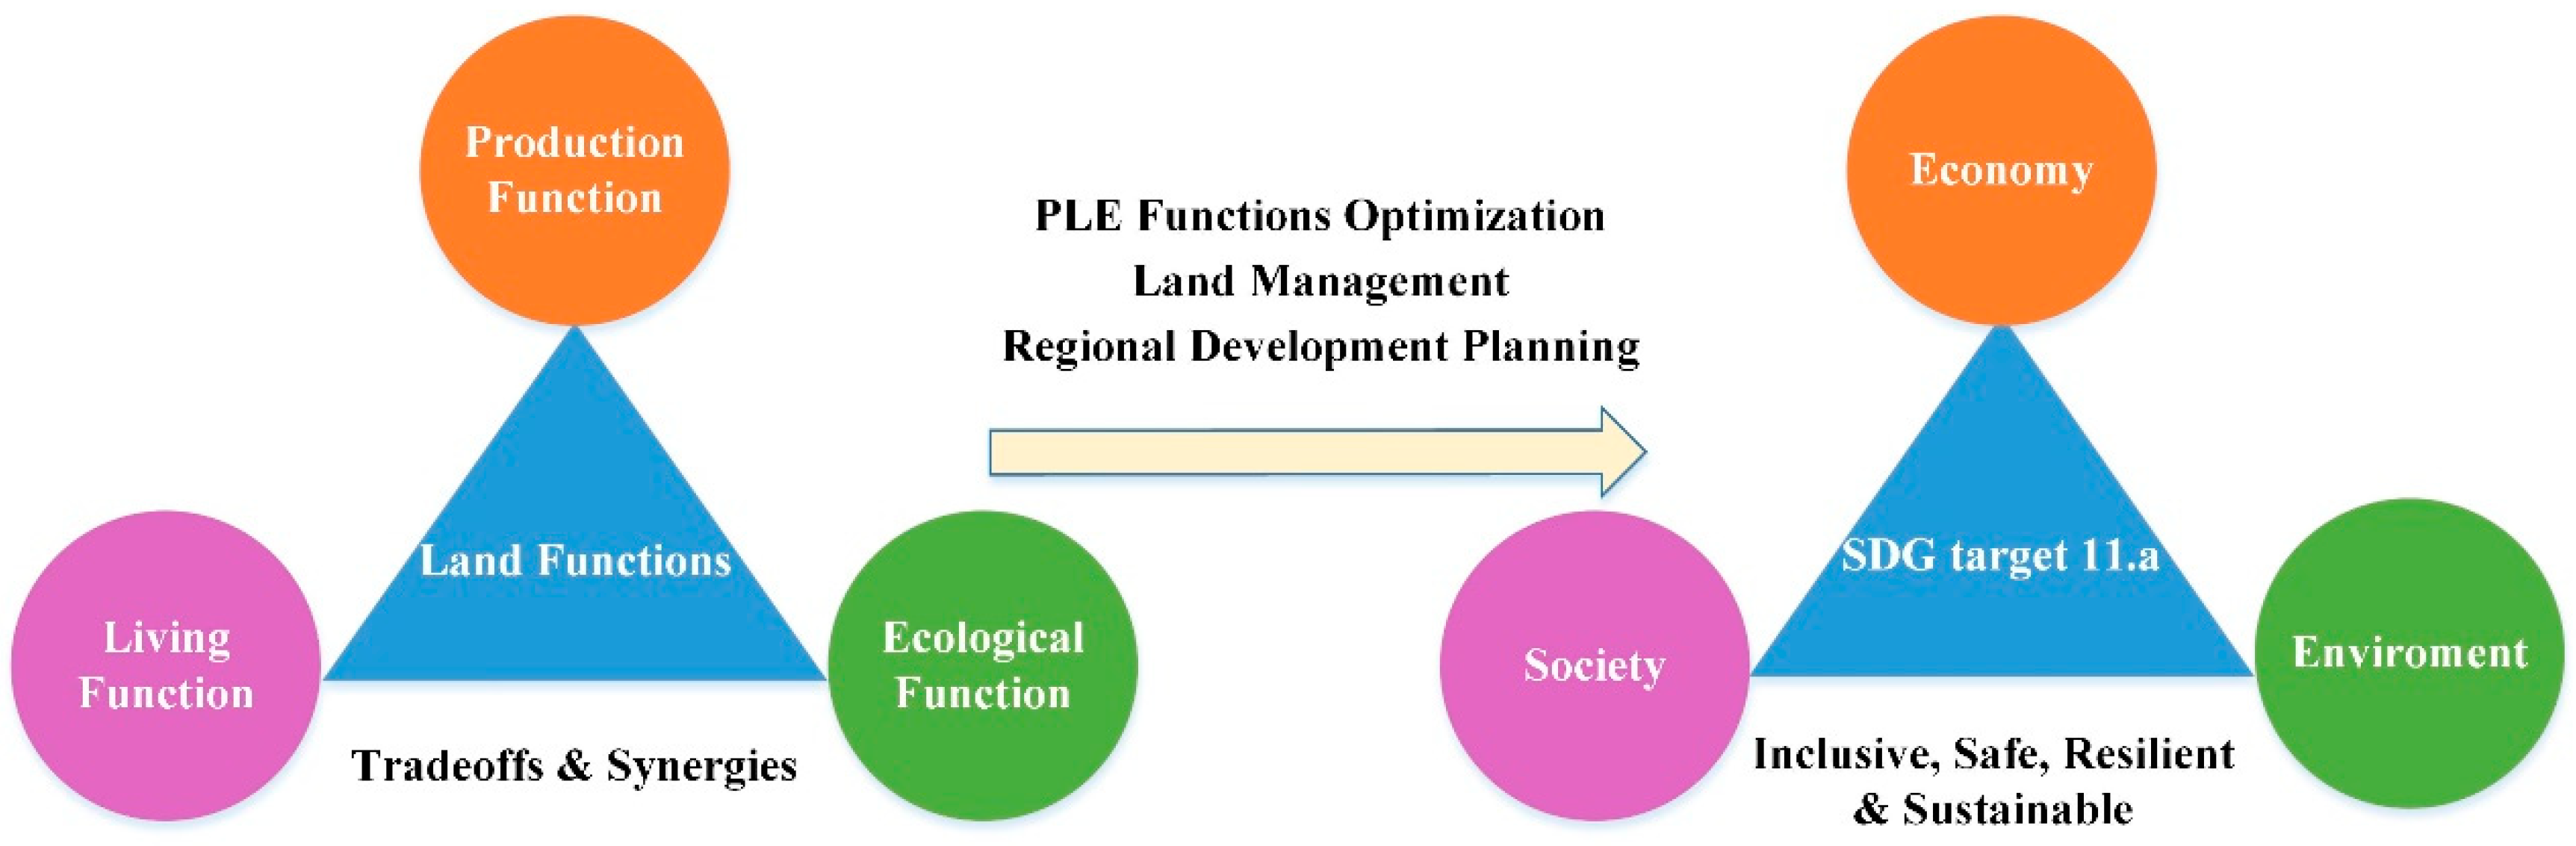
2.3.1. Theoretical Foundation Establishment

SDG target 11.a demands coordinated development of economy, society, and environment, which guarantees human land relations safe and sustainable. All human land relations are embodied and included in the utilization of PLE functions [21]. Production function supports the development of regional industries and provides industrial products, agricultural products, and service products [21,31]. Living function supports residence, consumption, leisure and entertainment [21,31]. Ecological function involves climate regulation, soil conservation, and guaranteeing regional ecological security [21,31]. The interrelations of PLE functions are tradeoffs and synergies [32]. The production function provides economic support for promoting quality of life and maintenance of ecology, the ecological function is the beautiful and healthy foundation for living and production, and the living function supports labor for production. However, the excessive development of living and production function will destroy the ecological environment, and then deteriorate the living function, leading to a vicious circle.
In summary, PLE functions should develop in a coordinated way, specifically, production is efficient and intensive, living is rich and comfortable, and ecology is beautiful and healthy, and achieve SDG target 11.a finally (Figure 2). This study establishes the relationship table of PLE functions coordination levels corresponding to the implementation stage of SDG target 11.a (Table 1).

2.3.2. Building the Evaluation Index System of PLE Functions

The rationality for index system construction is the basis of function evaluation. The principles for index selection include: (a) Typicality and Comparability: there are great differences in the development level of each county in the GBG_UA. When selecting the indices, they should not only be typical, but also comparable. The indices should highlight the differences in the characteristics of PLE functions between each county, so that the evaluation results can be comparable and reflect the differences in the PLE functions of the counties. (b) Operability and Accessibility: As there are many indices that affect the PLE functions, in order to avoid a one-sided pursuit of diversity and comprehensiveness, operable, available and representative indices should be selected.
In this study, 20 indices were selected in terms of land use and socioeconomic types based on the actual use of PLE functions in the GBG_UA. Thus, a function evaluation index system was built for the PLE functions (Table 2).

2.3.3. The Evaluation Model for PLE Functions

There are many methods that can be implemented to measure the weight of indices, such as the analytic hierarchy process, expert scoring method and other subjective weight determination methods [33,34]. Generally, the subjective weight determination method is greatly affected by the subjectivity of the evaluator or consultor and has limitations. The objective weighting law mainly analyzes the importance of the indices in the whole system through the correlation between indices, to determine the weight of the indices, such as through the entropy method and principal component analysis [35,36]. This paper uses the entropy method to measure the weight of the indices.
First, the indices are subject to dimensionless standardization. The entropy method was then used to measure the weight of each index for target layer [37,38]. Finally, a comprehensive evaluation model was used to evaluate the functions at the target layer. Assume that there are m counties under evaluation (including all counties at different times) and n evaluation indices. The matrix formed by the original data is X = (Xij)m×n, where xij is the initial value of the jth index of evaluation object i. The formulas are as follows:
P i j = { ( x i j min   x j ) / ( max x j x i j ) }
f i j = p i j / i = 1 n p i j
H j = k i = 1 n ( f i j × ln f i j )
w j = e j / j m e j
V = i = 1 m w j × P i j
where V is the function evaluation value; Pij is the standardized value of the index; w j is the weight value of index j; e j = 1 H j is the information utility value; H j is the information entropy of the index j; f i j is the index weight; Xij is the initial value of the index; and max xj and min xj are the maximum and minimum of the initial value of the index, respectively.

2.3.4. The Coupling and Coordination Levels

The coupling and coordination level model [38] describes the functional synergy and promotional relationships between PLE functions, which can be calculated as follows:
C = [ V 1 × V 2 × V 3 ( V 1 + V 2 ) ( V 1 + V 3 ) ( V 2 + V 3 ) ] 1 3
The coupling and coordination levels are mainly used to reflect the interaction among elements and cannot reflect the appropriateness of each element’s ratio. Therefore, the coordination level is required to reflect the coordinated development level of the elements [39]. The formula is as follows:
T = α V 1 + β V 2 + γ V 3 ,
D = C T
where V1, V2, and V3 are the evaluation values of production function, living function, and ecological function, respectively; and D is the coordination degree, which is the geometric mean of coupling level C and comprehensive development level T. In this research, three types of spaces are considered to be equally important; thus, the three weight coefficients α, β, and γ are equal to one third.

2.3.5. Comparative Advantages

In our study, an index that measured the level of comparative advantages was used to describe the relative advantages [40] that could identify the functions with comparative advantages among the three functions for each area. The formula for calculating the level of comparative advantages is as follows:
R C A i j = ( X i j / Y i ) / ( X ω j / Y ω )
where Xij represents the jth function value of county i; Yi represents the sum of all function values of county i; Xwj represents the sum of all the jth function values of all of the counties; and Yw represents the sum of all function values of all counties. Agricultural and industrial production functions essentially differ in their land space use. Thus, they are separated from the comprehensive production functions and are calculated separately in this study. A revealed comparative advantage (RCA) value of close to 1 indicates a significant degree of superiority, whereas a RCA value of >1 indicates a comparative advantage. The larger the value, the stronger the advantage. An RCA value of <1 indicates no comparative advantage. Therefore, the smaller the value, the weaker the advantage.

3. Results

3.1. Pattern Evolution of PLE Functions

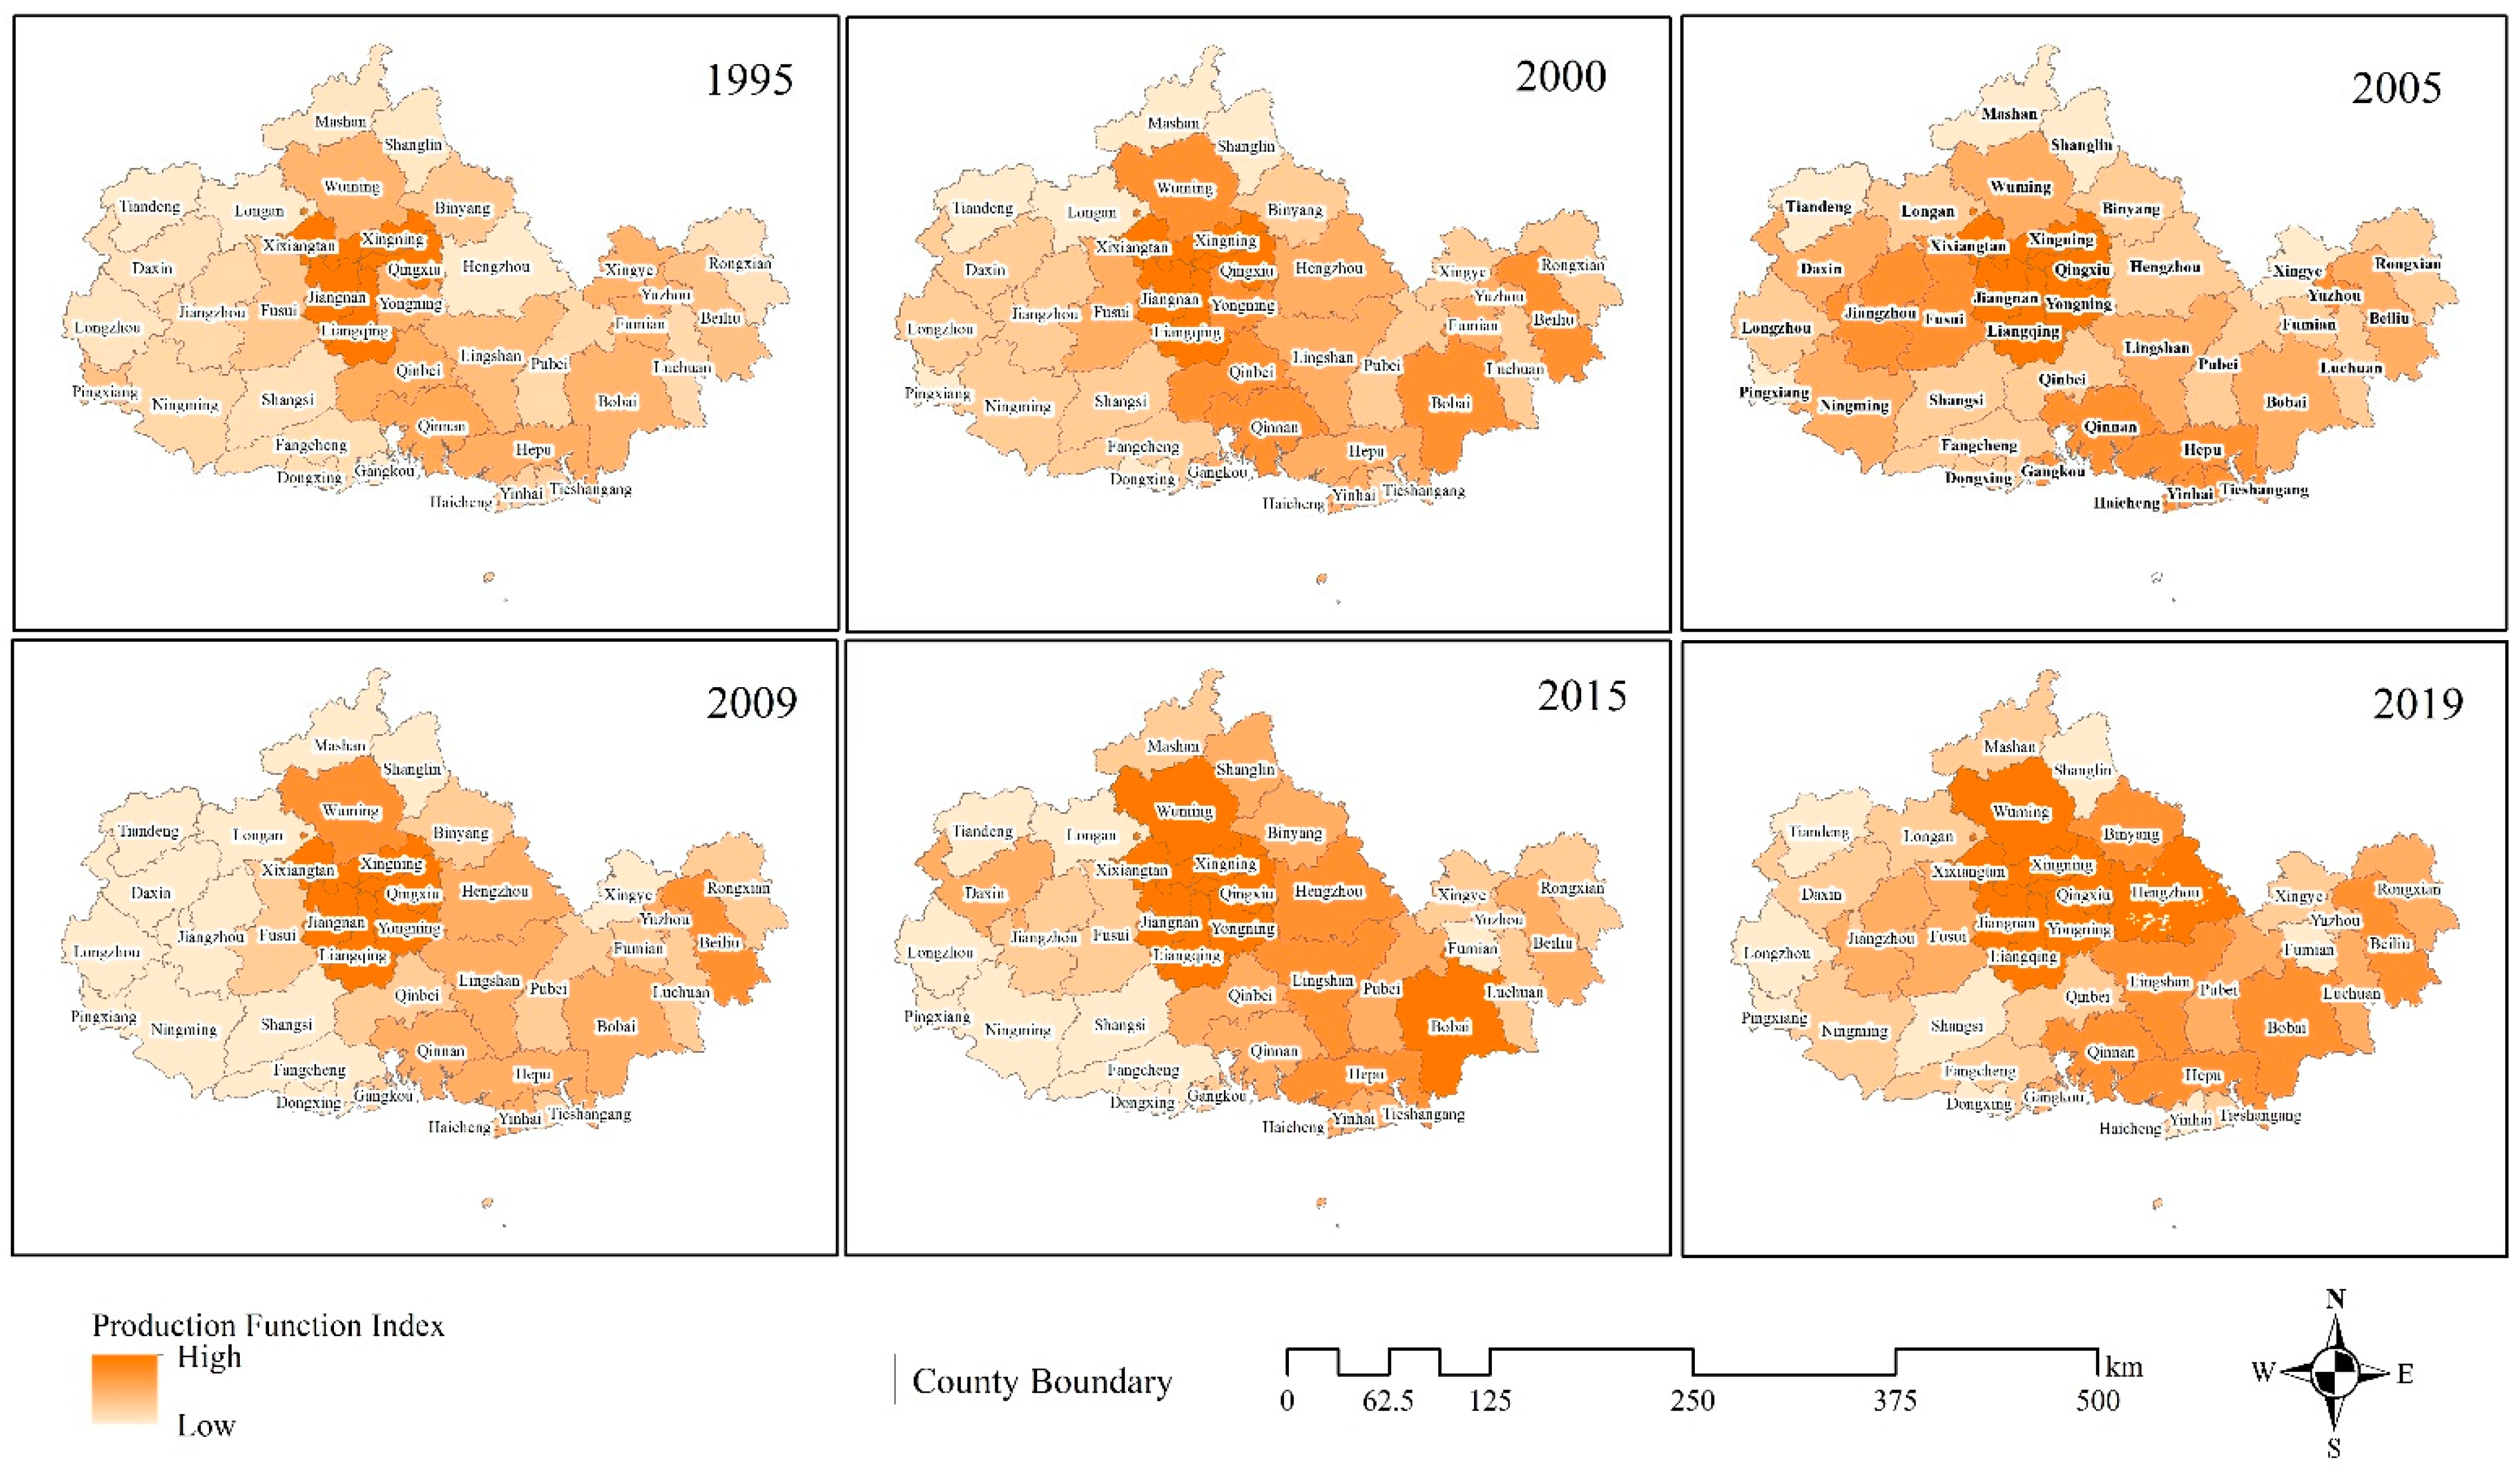
3.1.1. Production Function Evolution and Analysis

Considering the temporal changes from 1995 to 2019, the production function of Nanning city showed a continuous upward trend, whereas that of the other prefecture-level cities fluctuated up and then down (Figure 3). From 1995 to 2000, the production functions of the six cities in the study area showed an upward trend with gentle growth. From 2000 to 2009, due to the impact of the external economy, the production function of the cities other than Nanning city declined, whereas that of Nanning city showed gentle growth, which indicated the high stability of its production function. From 2009 to 2019, with the exception of Nanning city, whose production function showed gentle growth, the production function of the other cities tended to be stable. This indicates that, as the requirements for high-quality development increased during the 12th and 13th Five-Year Plan periods, as more energy-consuming industries transformed, their industrial functions were not demonstrated any further. Nanning city’s industrial development was mainly based on new industries, such as research technology; thus, its production function continued to grow.
Considering spatial distribution characteristics, the high-value areas with production functions are mainly distributed in Nanning city, which has gradually become the core area for production functions in the GBG_UA (Figure 4). The high- and low-value areas are distributed with diminishing functions toward their outer edges of the urban agglomeration. That is, the areas with a higher functional value are based around middle-value areas, which then gradually become low-value areas. The production function of the areas adjacent to Nanning city is also relatively high. This indicates that Nanning city, which also has a political function as the capital of Guangxi Zhuang Autonomous Region and boasts advanced tertiary industry, excellent research technologies, and a favorable investment environment, has started to demonstrate its capacity to radiate its functions as a central city in the region. The low-value areas are mainly distributed in the northern area of the region. Due to the harsh terrain of the Shanglin, Mashan, and Shangsi counties, most of these areas are hills and mountains that are not suitable for production functions. Additionally, the Mashan and Shanglin counties suffer from poor traffic conditions and have a weak foundation for agricultural and industrial production, which restrict their production functions. This has led to the formation of low-value area clusters.

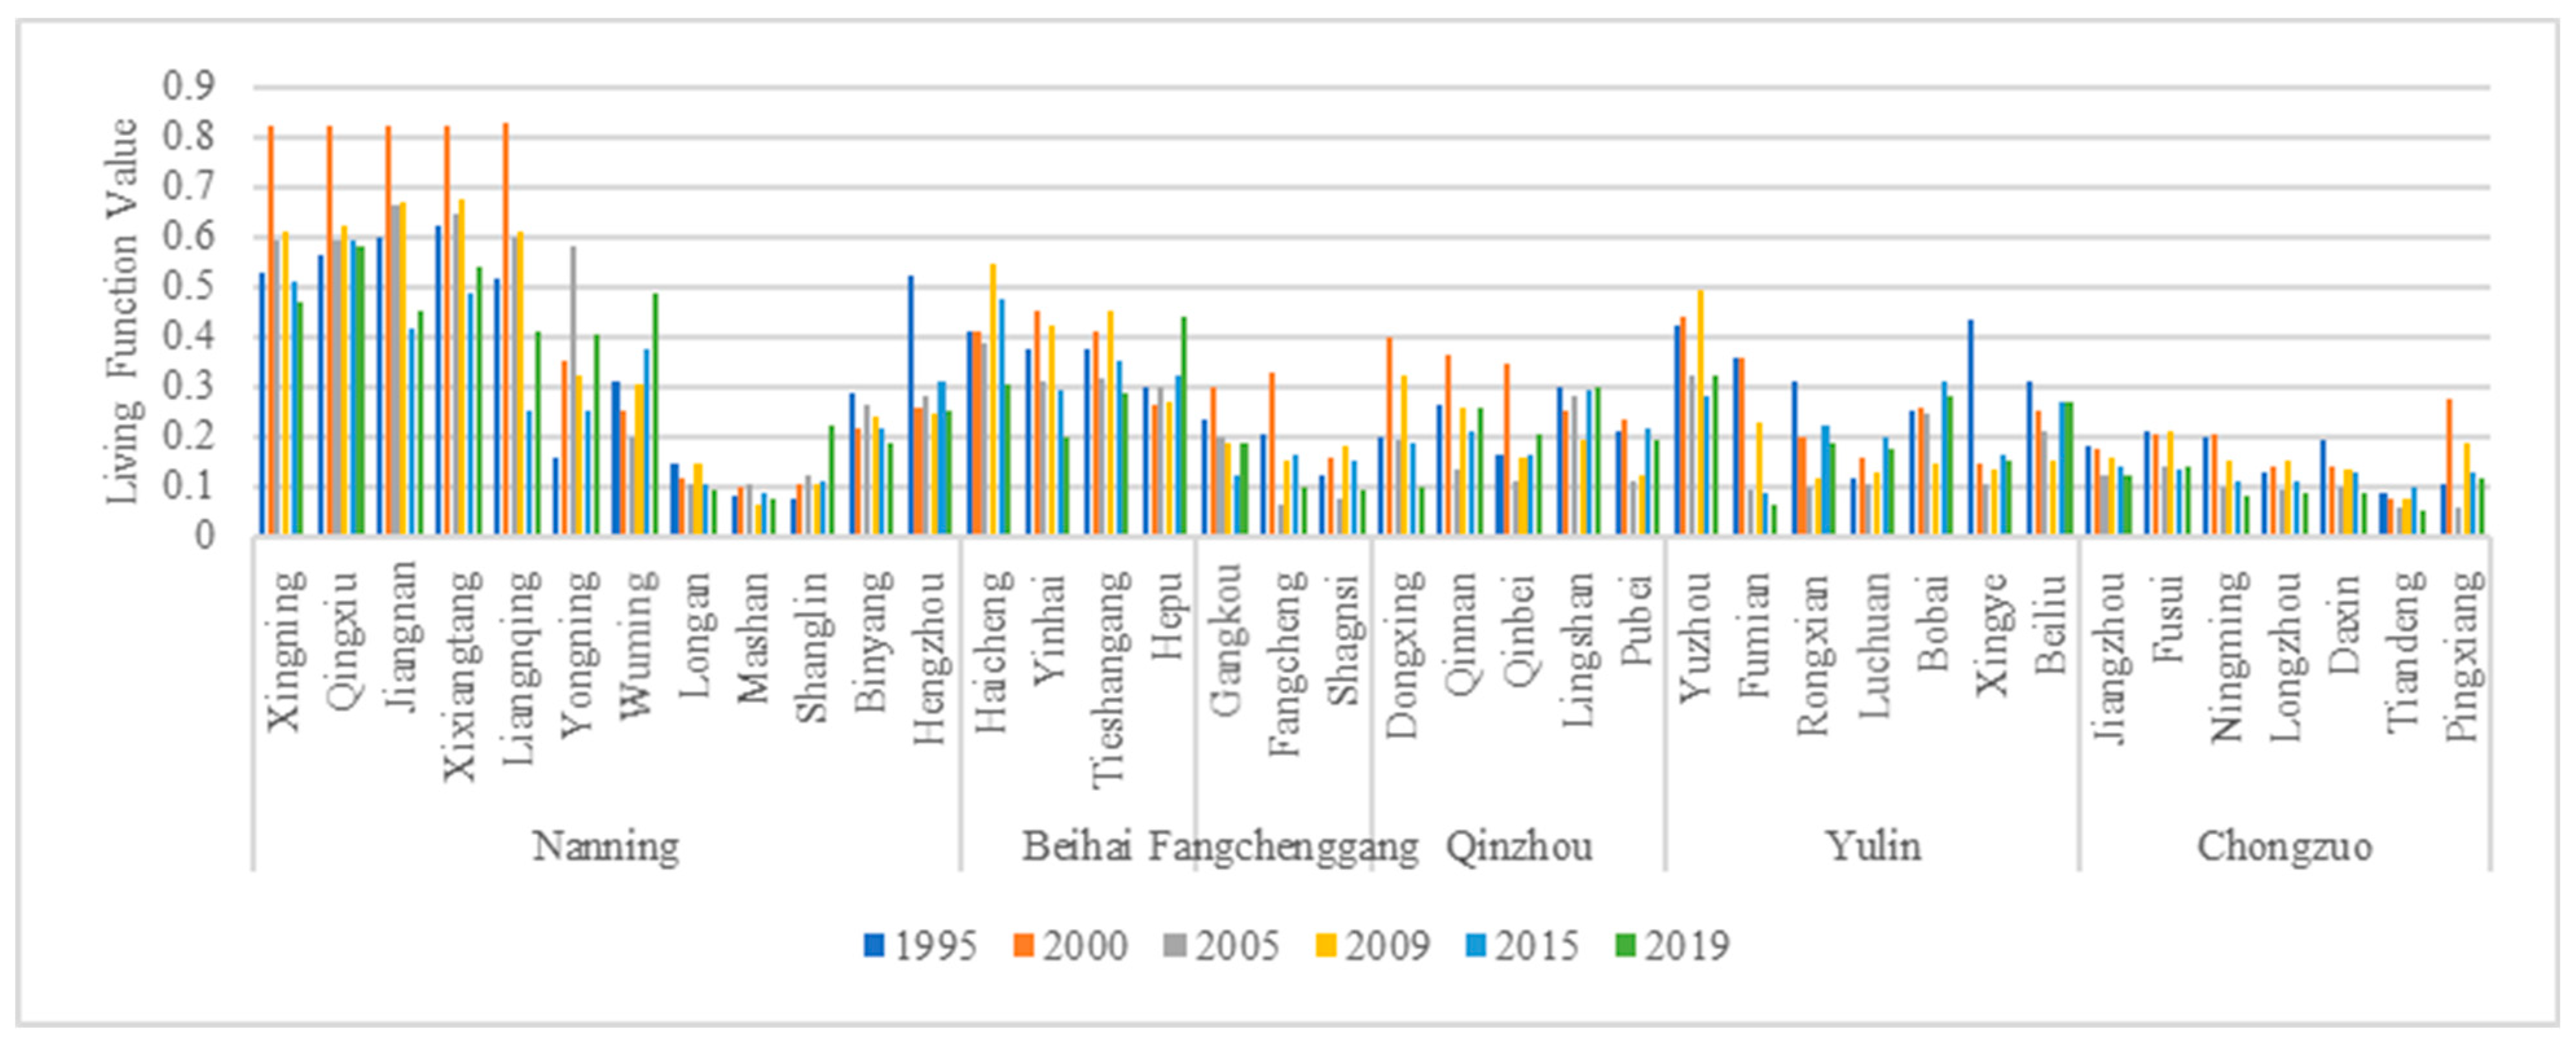
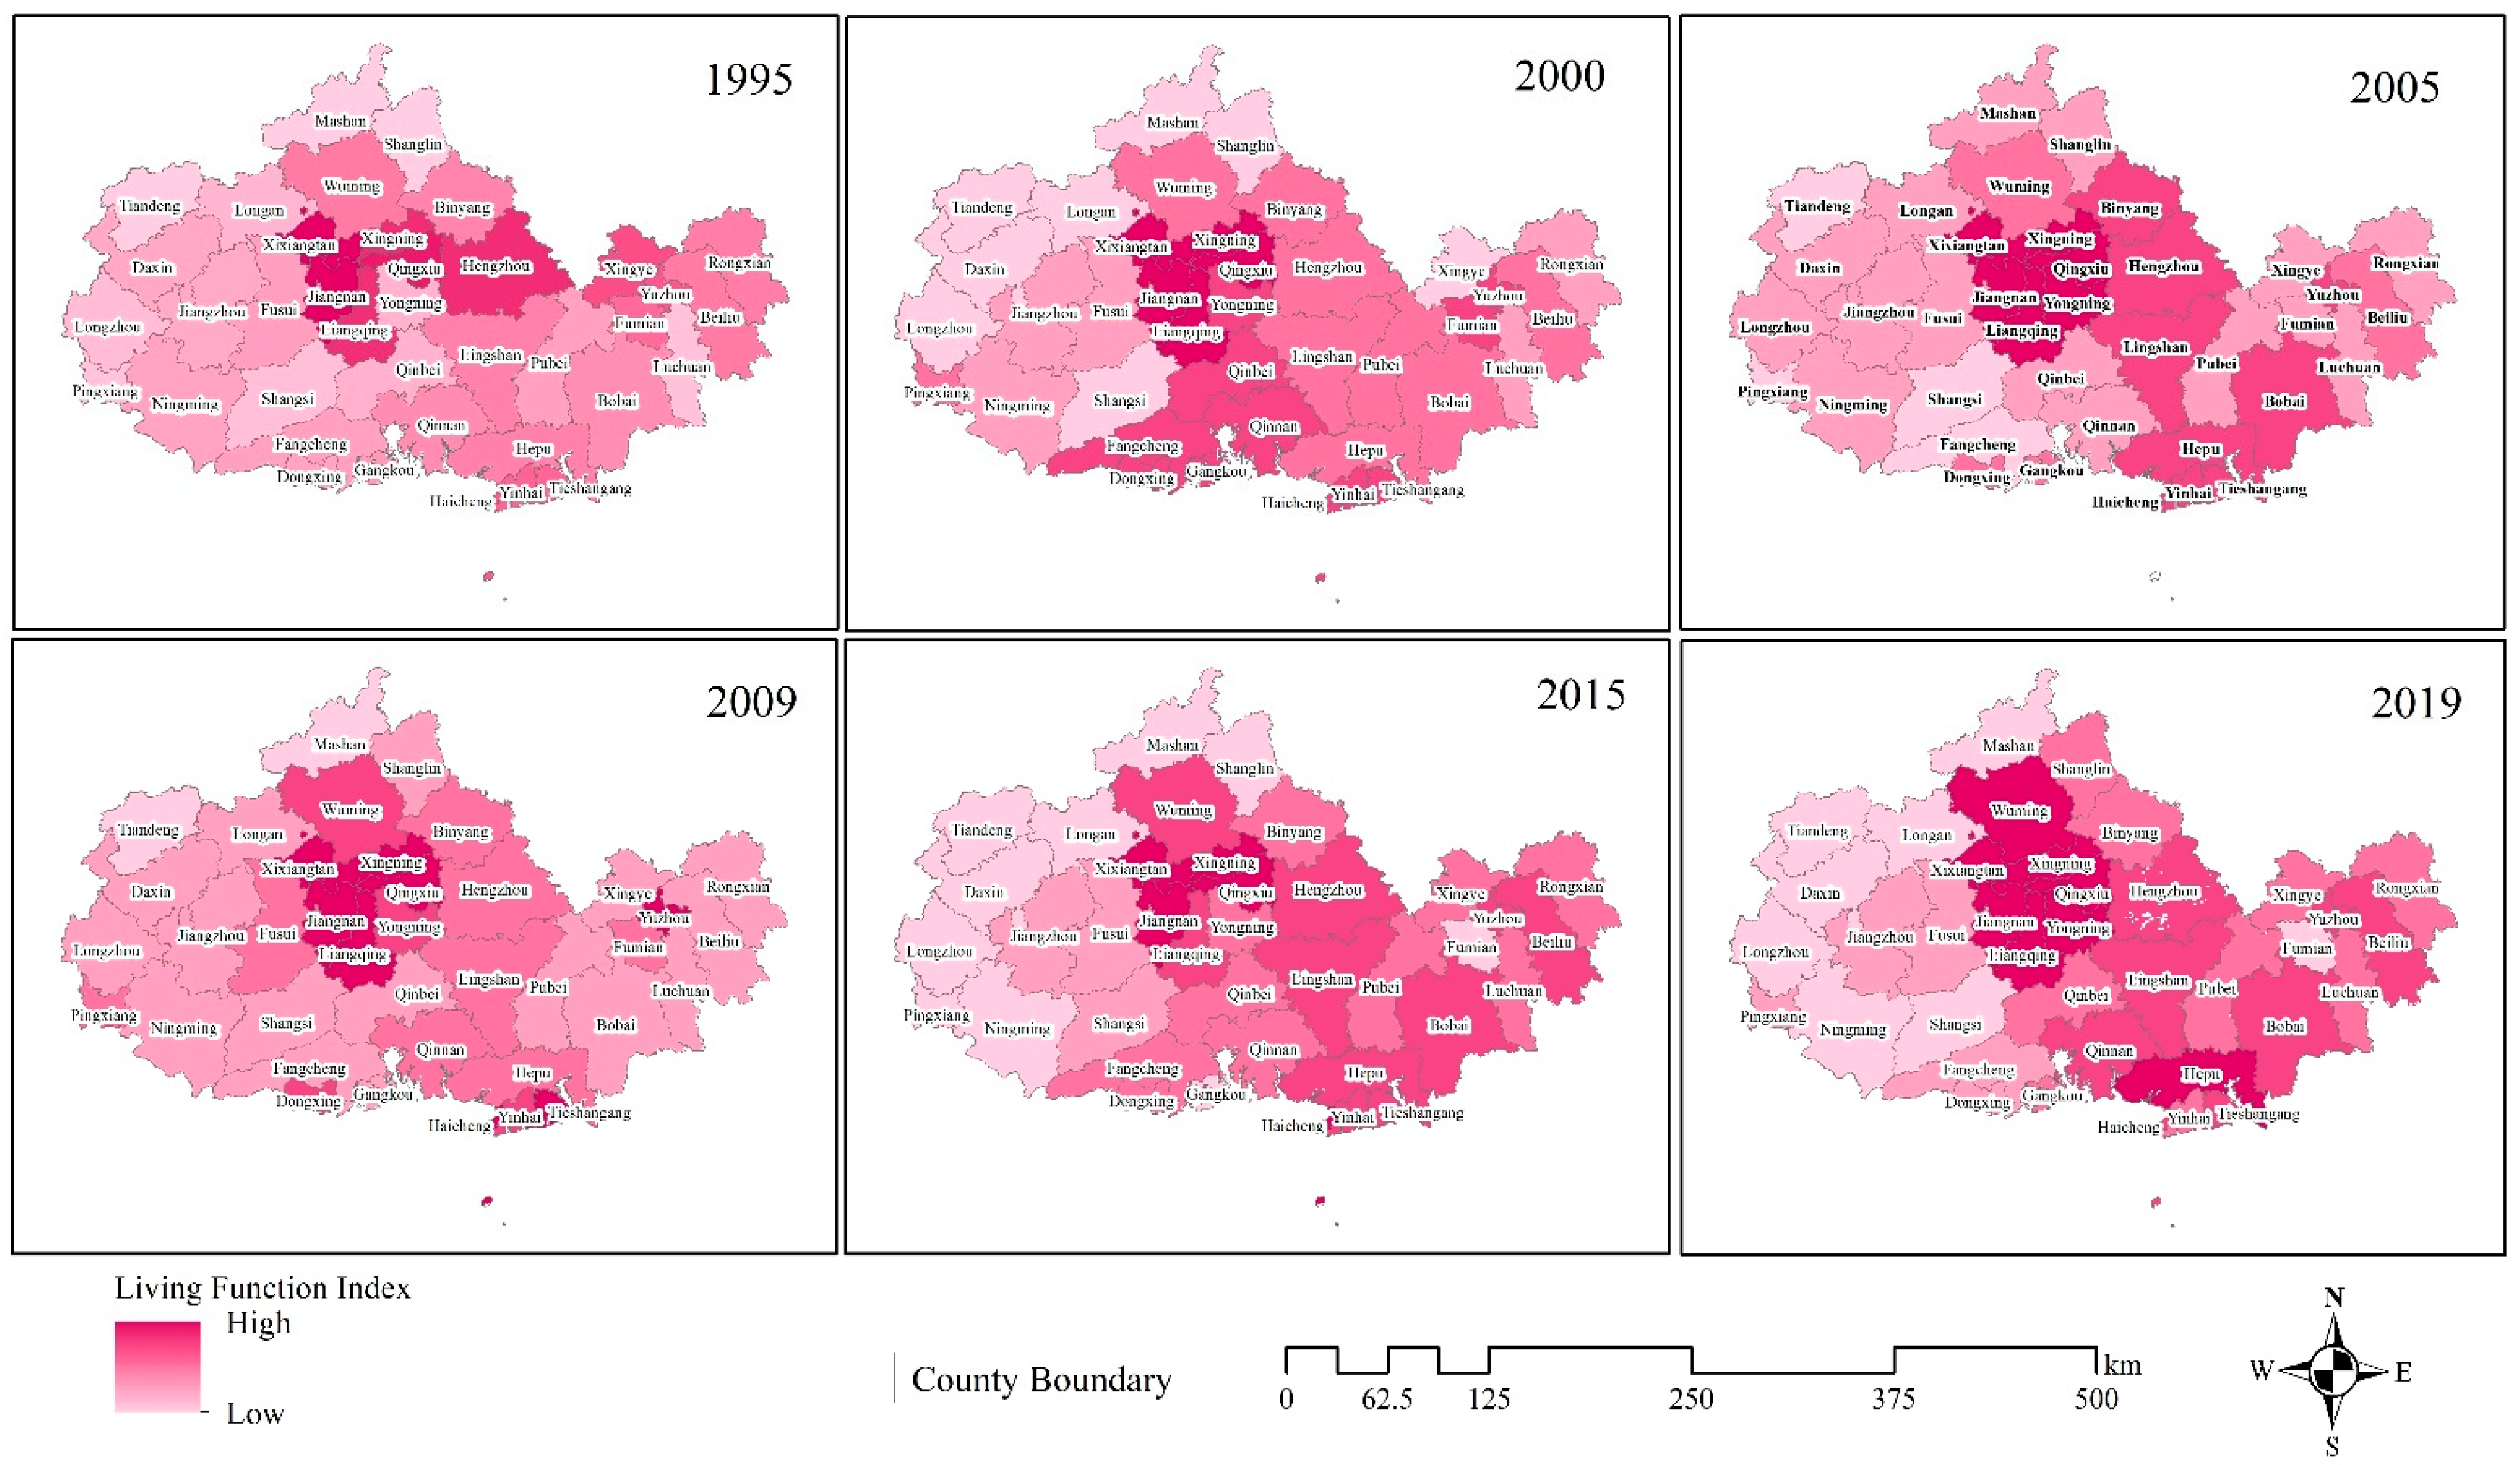
3.1.2. Living Function Evolution and Analysis

From 1995 to 2019, the living function of the six prefecture-level cities in the study area showed a cross-fluctuation trend featuring an “up–down–stable” pattern (Figure 5). From 1995 to 2000, the living functions of the cities of Nanning, Beihai, Fangchenggang, and Qinzhou showed an upward trend, whereas those of the cities of Yulin and Chongzuo declined. From 2000 to 2005, the living function of the six cities in the Guangxi Beibu Gulf declined slightly. In contrast to the production function, the living function of the other prefecture-level cities, with the exception of Nanning city, improved from 2005 to 2009, during which the guiding role of the living function among all of the functions was improved as production function declined. From 2009 to 2019, the living function in the study area declined slightly and only the cities of Chongzuo and Nanning witnessed a slight improvement. Through a comparison of the changes in the living functions and the evolution of the living space pattern, the living space area continued to grow, but its layout was not optimized, thus leading to a decline in the living function.
Figure 6 shows transitions in several main directions while also considering the evolution of high-value areas with a living function, which were mainly distributed in the urban area of Nanning city in 1995, but that shifted focus along the borders between the cities of Nanning, Qinzhou, and Beihai in 2000, and then extended in a V shape between the cities of Nanning, Beihai, and Yulin in 2005. In 2009, this pattern showed a scattered living space distribution and from 2015 to 2019, there was a slight improvement in the living function. Most of the high-value areas are concentrated in Nanning city and extend toward Beihai city. Overall, the living functions of the Nanning and Beihai cities are much better than they are in the other prefecture-level cities. The counties and districts in the northwestern area of the study area are relatively backward, where their capacity for social and living functions in addition to service levels have yet to be improved, which leads to a low living space quality.

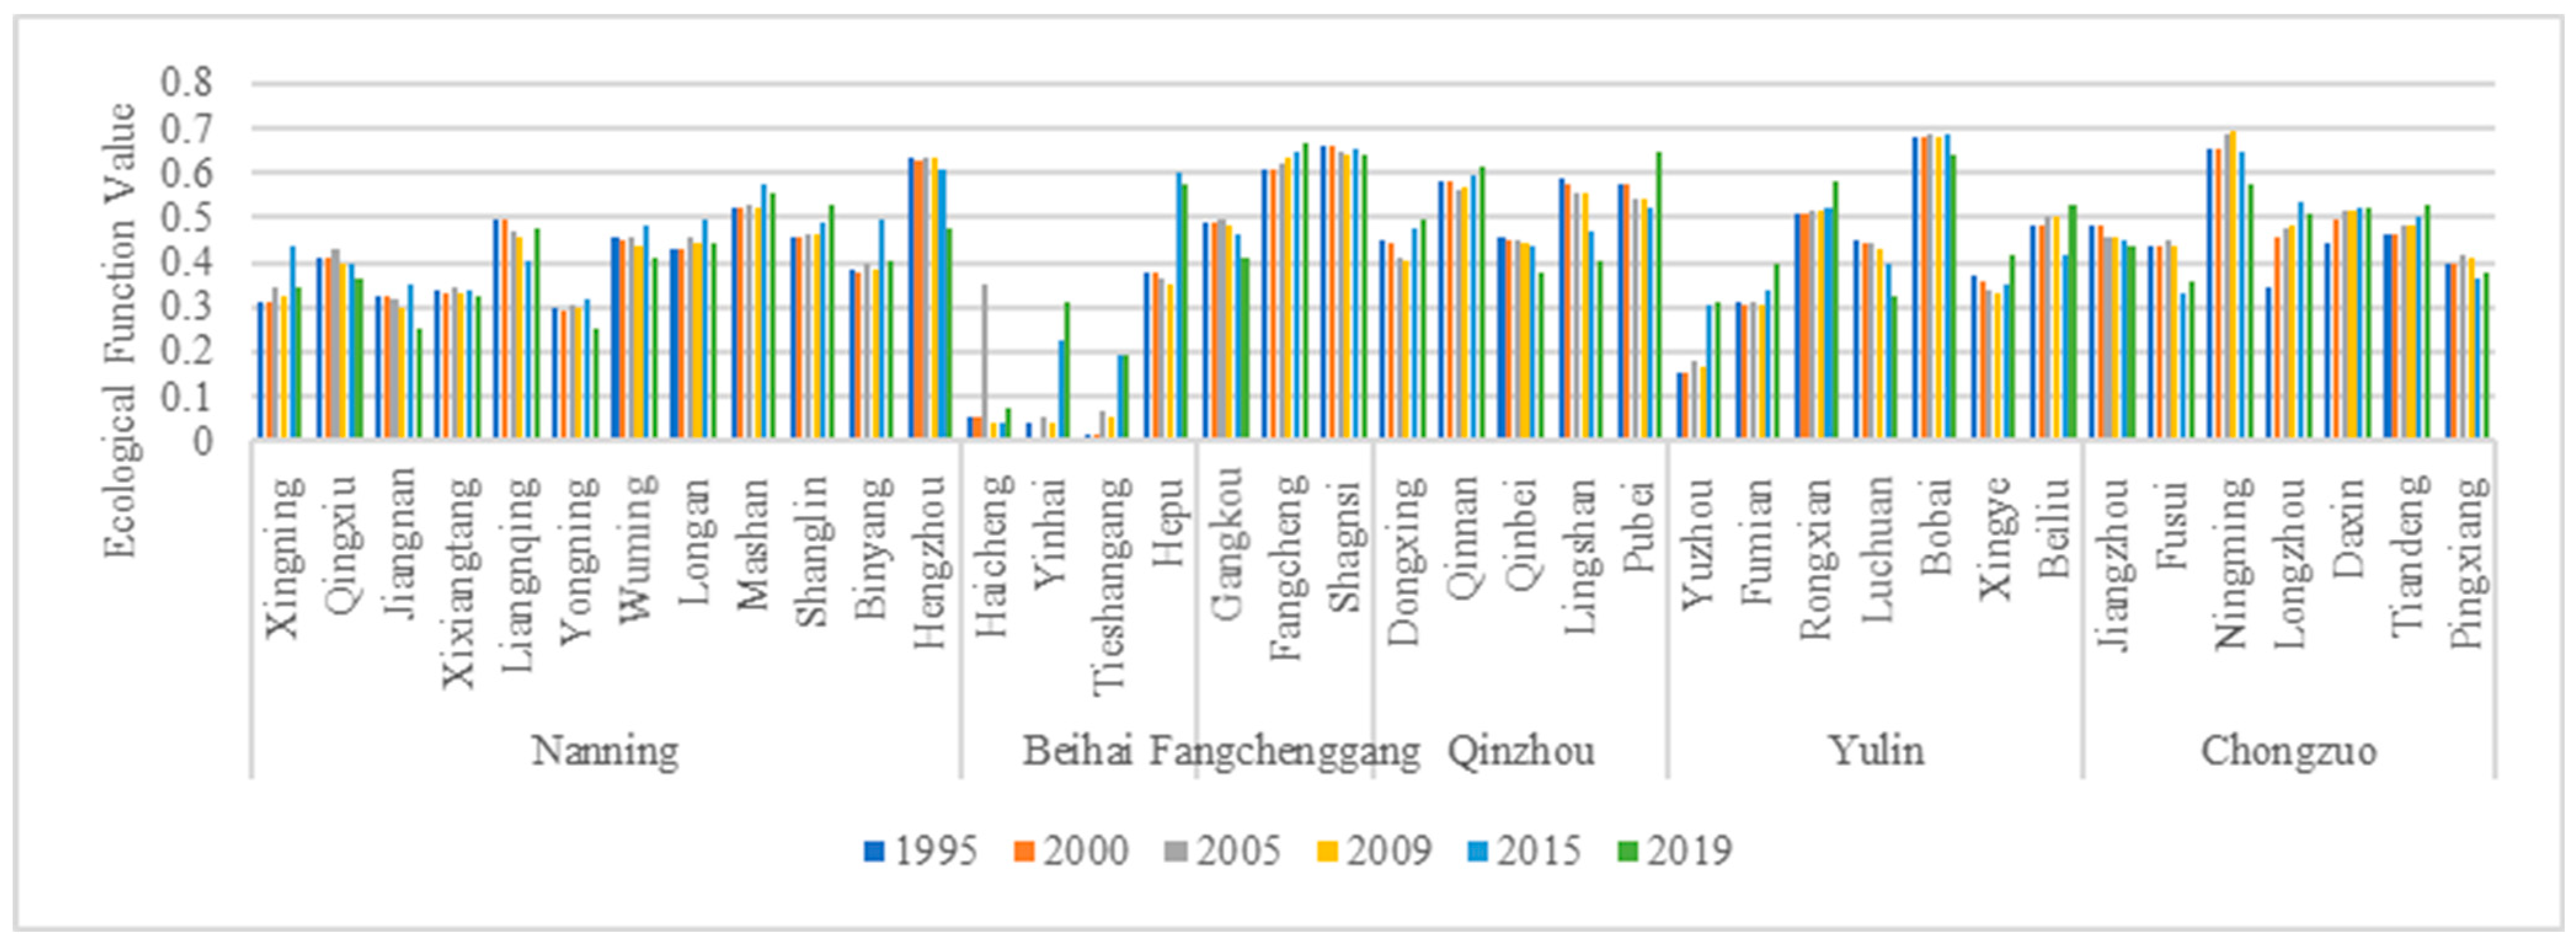
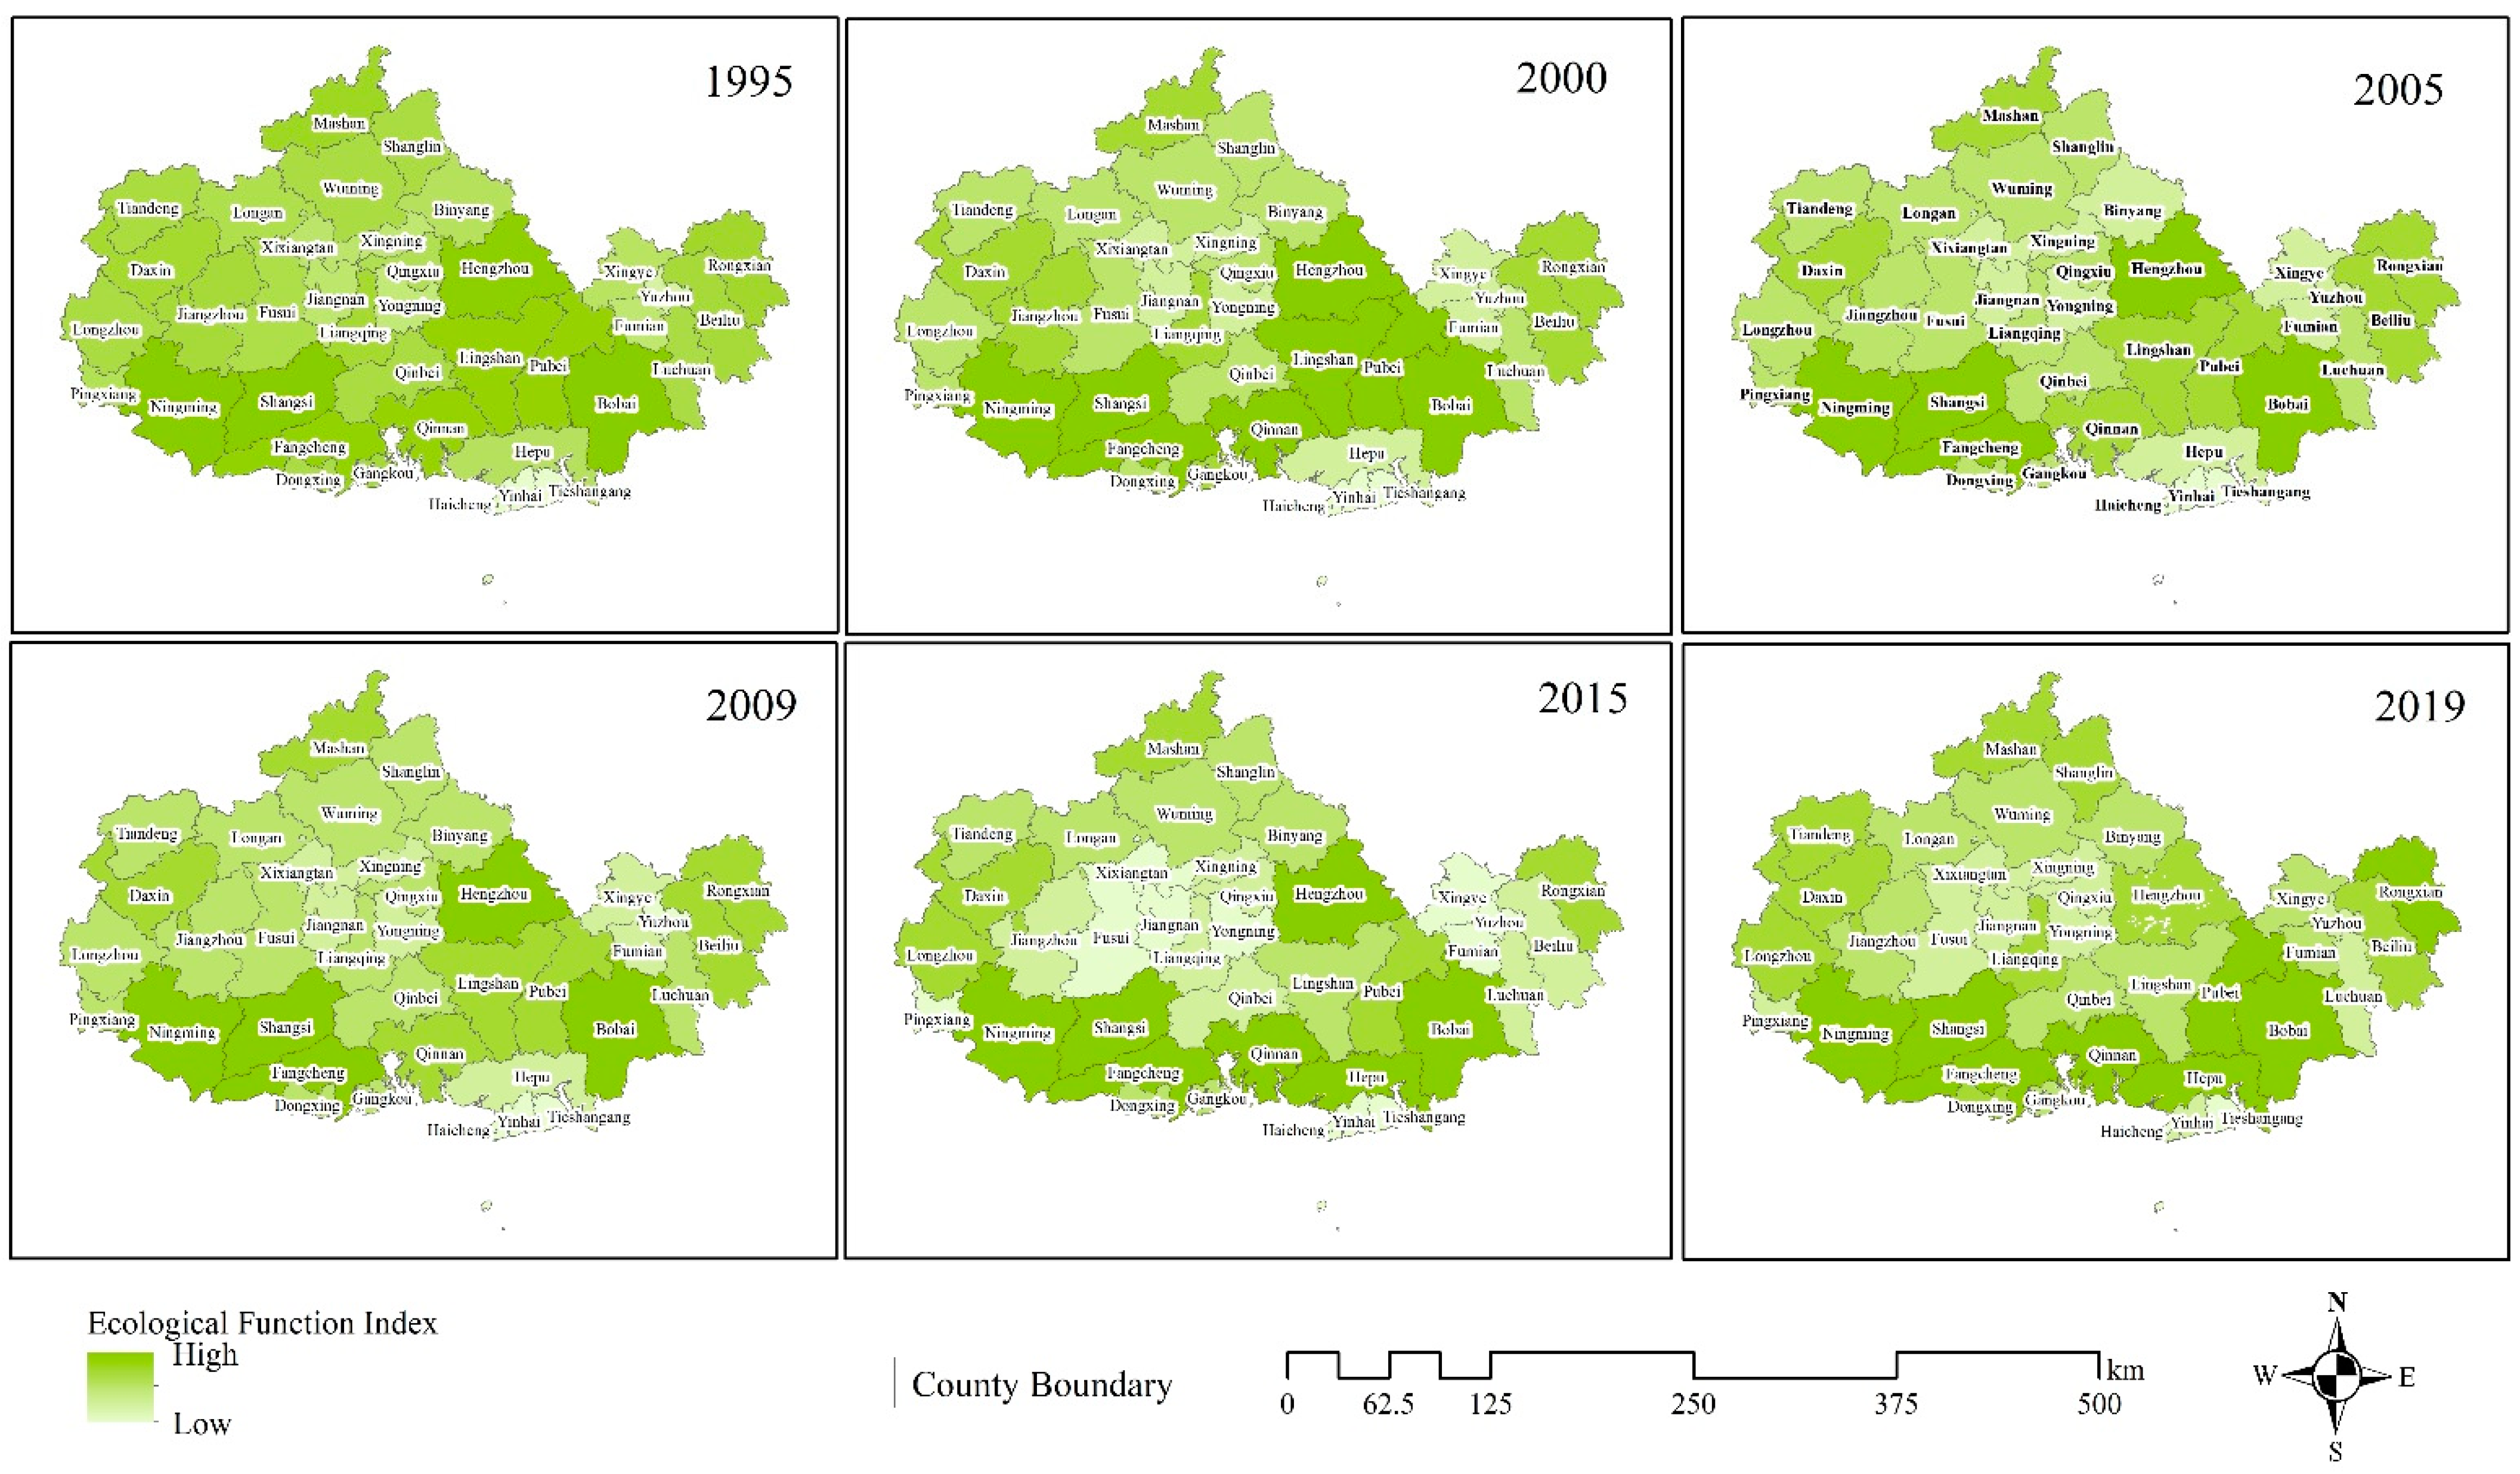
3.1.3. Ecological Function Evolution and Analysis

From 1995 to 2019, the ecological function of the GBG_UA demonstrated small changes and high stability compared with the changes in the production and living functions (Figure 7). From 2009 to 2019, Beihai city, which had a relatively low ecological function, also showed a significant improvement. From 2015 to 2019, the expansion of living and production spaces in Nanning city slightly weakened the city’s ecological function. Considering the land use type of the study area from 1995 to 2019, most of the ecological space in the study area was forest land with a high ecological service value, which always accounted for >50% of the entire land space. Therefore, this region largely enjoyed a relatively stable ecological function.
As shown in Figure 8, in terms of the distribution characteristics of the ecological space function, the high-value areas with an ecological function are mainly distributed in hilly and mountainous areas where there are few human activities, especially in those areas comprising the Hundred Thousand Great Mountains. The spatial distribution characteristics for the ecological function in the study area are highly correlated with the ecological landscape distribution. The main landscapes in the areas covered by forests and waters enjoy a strong ecological function. In relative terms, there is a certain gap between the ecological function of Beihai city and that of the other prefecture-level cities. However, in recent years, Beihai city has become a city with a beautiful and comfortable living environment based on its subtropical coastal tourism resources. Both its ecological environment and function have improved.

3.2. Coordination Characteristics of PLE functions

Drawing on the literature [41,42,43,44,45] and the equal interval method, five coordination levels for the study area were identified: imbalance, primary coordination, intermediate coordination, good coordination, and high-quality coordination. The results of the coupling and coordination levels of the study area for the six periods from 1995 to 2019 were obtained (Figure 9).
Considering spatial distribution (Figure 9), the areas with good coordination were mainly the districts and counties of Nanning city, which were stable throughout the study area. This finding indicates that during the research period, the land that was available for PLE functions in Nanning’s urban area was arranged reasonably, its urban plan was prepared scientifically, and its land use management policies were implemented well. The imbalanced areas gradually spread from north to west and formed a concentrated contiguous area by 2019. The main counties and cities in the imbalanced areas mostly comprised mountainous terrain, which restricted productive areas, such as in Mashan and Shanglin counties, and in emerging economic areas, such as in the Ningming and Dongxing counties, which indicates the impact of the industrial layout on the coordination level of PLE functions. Meanwhile, the original and traditional agricultural foundation could not satisfy the requirements of high-quality production, leading to an imbalance in the PLE functions. The simultaneous growth of high-quality coordination and primary coordination showed that the coordination of PLE functions in the GBG_UA was developing toward two extremes, the rates of high-quality coordination and imbalance were increasing, and primary coordination maintained the highest proportion, accounting from 55.26% in 1995 to 71.05% in 2019 (Figure 10). Only 18.42% of the study area were in good condition in SDG target 11.a, and the rest were in poor condition.

3.3. Advantageous Areas in PLE Functions

To some extent, the complexity of PLE functions shows the potential of the national land space. An administrative unit is called a single-function advantageous area when it has one advantageous function, a dual-function advantageous area when it has two advantageous functions, and a multifunction advantageous area when it has three advantageous functions. According to the calculation results for the spatial function advantages (Table 3), statistics were obtained for the advantageous areas of the GBG_UA and the results are shown in Table 4.
According to Table 4, the land comprising the GBG_UA is dominated by single-function advantageous areas, which account for 52% of the total area. Of these areas, the advantageous areas for production, living, and ecological functions comprised 7.8%, 5.2%, and 39%, respectively. The proportion of advantageous areas with an ecological function was the highest, which indicates the Guangxi Beibu Gulf’s great advantage in terms of its ecological function. There are 15 dual-function advantageous areas, which comprise 39% of the total counties (districts). The multifunction advantageous areas comprised 7.8% of the total counties (districts) and were concentrated in counties and districts dominated by industry and agriculture.
To further explore the spatial distribution of the advantageous functional areas of the GBG_UA, we generated a spatial distribution map (Figure 11). As shown in Figure 10, the advantageous production function areas are significantly adjacent to the advantageous production–living areas and are concentrated in the central part of the study area include the Jiangnan, Liangqing, Yongning, Xingning, Qingxiu, Xixiangtang, Wuming, and Tieshangang districts, and Lingshan county. The administrative units with an advantageous living function include the Yuzhou, Hepu, Yinhai, and Qinnan districts, Beiliu and Pingxiang cities, and Shanglin county, among others. These areas were located in the southeastern part of the study area.
The GBG_UA has many counties and districts with widely distributed advantageous ecological functions. The administrative units with obvious ecological function advantages include the Long’an, Mashan, Shangsi, Pubei, Rongxian, Xingye, Ningming, Longzhou, Daxin, and Tiandeng counties; the Fangcheng, Qinbei, Fumian, and Jiangzhou districts; and the city of Dongxing, with 15 counties being included in total. In addition, a concentrated contiguous ecological area called Shiwan Mountains was formed in the southwestern Guangxi Zhuang Autonomous Region and has obvious ecological function advantages. The advantageous ecological function areas in the GBG_UA comprise a relatively high proportion of the available land space, which indicates the great potential of the study area to provide ecological products and services.

4. Discussion

4.1. The Effectiveness of Our PLE Study

Our study provided a new idea that links the PLE functions coordination with SDG target 11.a. The study of coordinated degree of PLE functions can contribute to the achievement of SDG 1.1.a, which offer useful support for decision makers. In order to achieve SDG target 11.a, on the one hand, decision makers can refer to the coordination degree of PLE functions before planning. On the other hand, decision makers can also use the coordination degree of PLE functions to evaluate the effect of planning implementation afterwards. Although the coordination of PLE functions does not directly calculate the value of SDG target 11.a, their characteristics can reflect a realization of SDG target 11.a (Table 1), helping to reduce the vagueness of SDG target 11.a [1,16]. Our research can help decision makers better understand the coordination of PLE functions and provide them with useful knowledge for SDG target 11.a. Furthermore, research on typical areas of China was carried out by this study according to the international science program of SDGs, the methodology and analytical framework could be easily applied worldwide for supporting the SDG target 11.a and promoting land planning as well as management. This is of great significance for regional development planning and sustainable development in China and is also referential for other countries.
Comparing the evaluation results of PLE functions with the previous research results conducted by Pang et al. and Shen et al. in GBG_UA regions [46,47], it is found that although the evaluation methods or indices are not exactly the same between the studies, the results are highly consistent, such as a relatively higher production function in Nanning and a stable ecological function in the study area. Thus, we believed that the evaluation results of this study are reliable. Compared with previous studies, this study used PLE functions to further evaluate the SDG target 11.a level, so this study is more suitable to consider the implementation of the international plan.
In this research, we have studied production, living and ecological functions, among which ecological functions are related to ecosystem services. Ecosystem services can offer various kinds of benefits for human survival, such as food supply, water conservation, soil conservation, climate regulation and biodiversity protection, and are an essential part of sustainability frameworks [48]. The importance of ecosystem services for SDG has been studied and demonstrated [49,50], and ecosystem services were taken to evaluate the implementation effect of SDG. Although the PLE study did not calculate the value of each type of ecosystem services in detail, it assessed the ecological functions, production functions and living functions in a macro perspective, involving the win–win development of human social system and natural system in a broader perspective.

4.2. Suggestions for the Optimization of PLE Functions

From 1995 to 2019, the number of high-quality coordination counties belonging to urban agglomeration increased (from 0 to 7), and the number of imbalance counties also increased (from 1 to 2), which shows that the coordination of the PLE functions presents a polarized development in the GBG_UA. Primary coordination maintained the highest proportion, accounting from 55.26% in 1995 to 71.05% in 2019, indicating the achievement of SDG target 11.a in the GBG_UA was poor. The transportation, industry, and social services of the GBG_UA should be planned in a unified way, taking advantage of the expansion trend of Nanning city [51], a high-quality coordinated city; emphasizing the driving and radiating role of Nanning city; and affecting the surrounding counties (districts) with good coordination or intermediate coordination to realize high-quality coordination. As for the imbalanced areas, such as Tiandeng county and Fumian district, we can see from the functions value and dominant functions that their production and living functions are low and their ecological functions are high. This indicates that a new ecological industrial structure system should be built, and that can deeply tap into the ecological value and benefits of the area to create green ecological products, and to support the coordinated development of the PLE functions.
The main problem in the utilization of land space with production advantageous functions is the contradiction between environmental protection and economic development. Therefore, while promoting the rational utilization of production space and living space, we should also emphasize the protection of the ecological environment and the development of ecological industry. For example, while developing port logistics and fisheries, the Tieshangang district should also pay attention to the protection of mangroves [52], delimit protection zones, and carry out blue carbon action and a carbon sink economy.
For living function advantageous areas, we should emphasize their geographical advantages and further improve the short board of production and ecological functions. We should pay attention to the joint development of the surrounding high production function cities and collaborate with them with the help of the driving role of the surrounding big cities. For example, Chongzuo city, which is located on the main channel of the “Nanning–Langshan–Hanoi–Guangning” economic corridor, the most convenient channel for China to ASEAN, and Yulin city, which comprises the industrial transfer and processing base in eastern China, should be included in the development of co-urbanization and transportation in the GBG_UA, and to strengthen traffic planning.
On the basis of environmental protection, we should emphasize the value of ecology and realize that ecological benefits can be transformed into economic benefits. Further improving the level of ecological utilization, breaking the state of negative protection and realizing the improvement of the production function should be emphasized. The study area has unique geographical conditions and many characteristic and precious species, such as grapefruit in Rong county, wild camellia produced in Shangsi county (which represents 90% of the world’s supply), and chili padi in Tiandeng county, and it is advisable to delimit characteristic functional areas and to provide policy support to create high-quality ecological industries and to realize an ecological back-feeding economy.

4.3. Limitations and Future Work of the Study

There are many indicators affecting PLE functions. This study selects some representative indicators according to previous studies, but there will inevitably be deficiencies. The evaluation index system will continue to be improved in the future. Besides, we will jump out of the restrictions of administrative regions and look for high resolution remote sensing inversion data that can indicate various indicators, to better reflect the details of spatial differences. This paper evaluated PLE functions and SDG target 11.a from 1995 to 2019, but the future trends are unknown. The development scenario simulations can solve this problem [53]. In the future, we will simulate PLE functions and SDG target 11.a under multiple scenarios for the year 2030. Policy makers will be aware of which scenarios can help to realize SDGs, so as to formulate demand-oriented development plans.

5. Conclusions

Based on land use data and socioeconomic statistical data, this study used a comprehensive evaluation model, coupling and coordination degree, and comparative advantage degree to analyze the pattern evolution, coordination characteristics and advantageous areas of PLE functions in the GBG_UA from 1995 to 2019. Our study could offer useful support for the related land management agencies, help policy-makers to assess regional procedures toward achieving SDG target 11.a and inform them the coordinated development economy, society, and environment. The main conclusions are as follows:
(1)
When considering the spatiotemporal distribution of PLE functions, the study area has a relatively stable ecological function, a good ecological foundation, and fluctuating production and living functions.
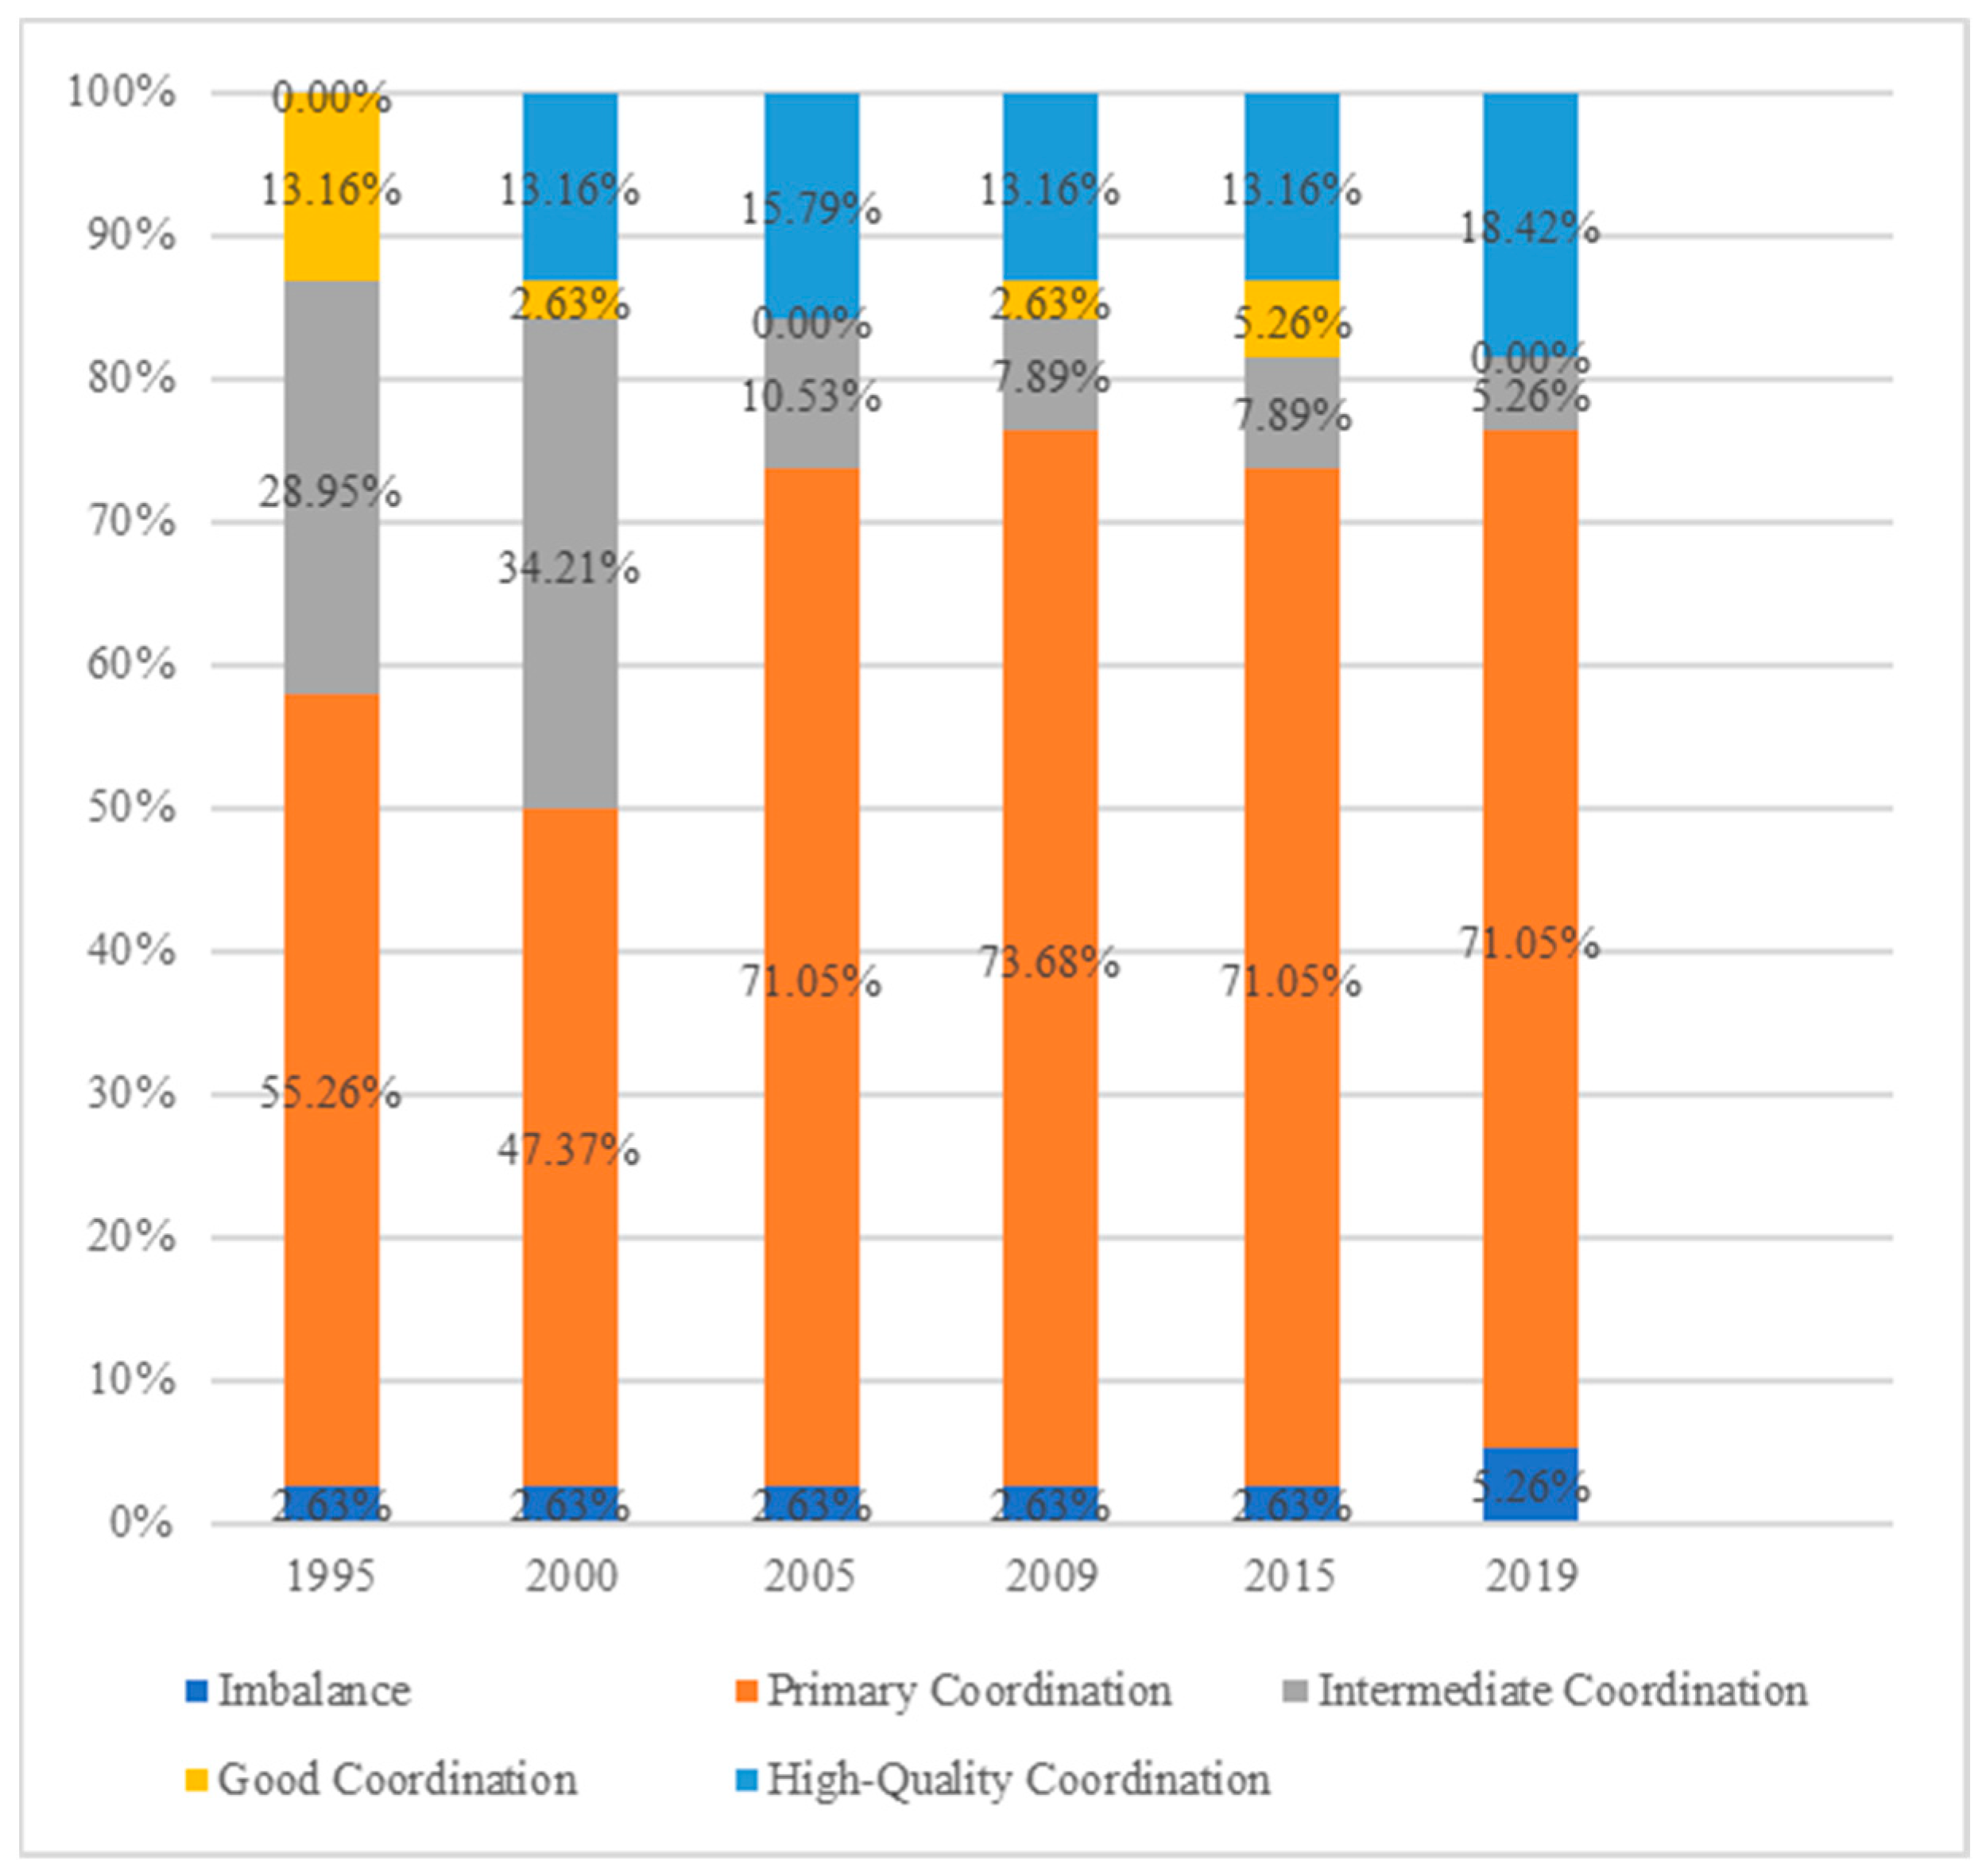
(2)
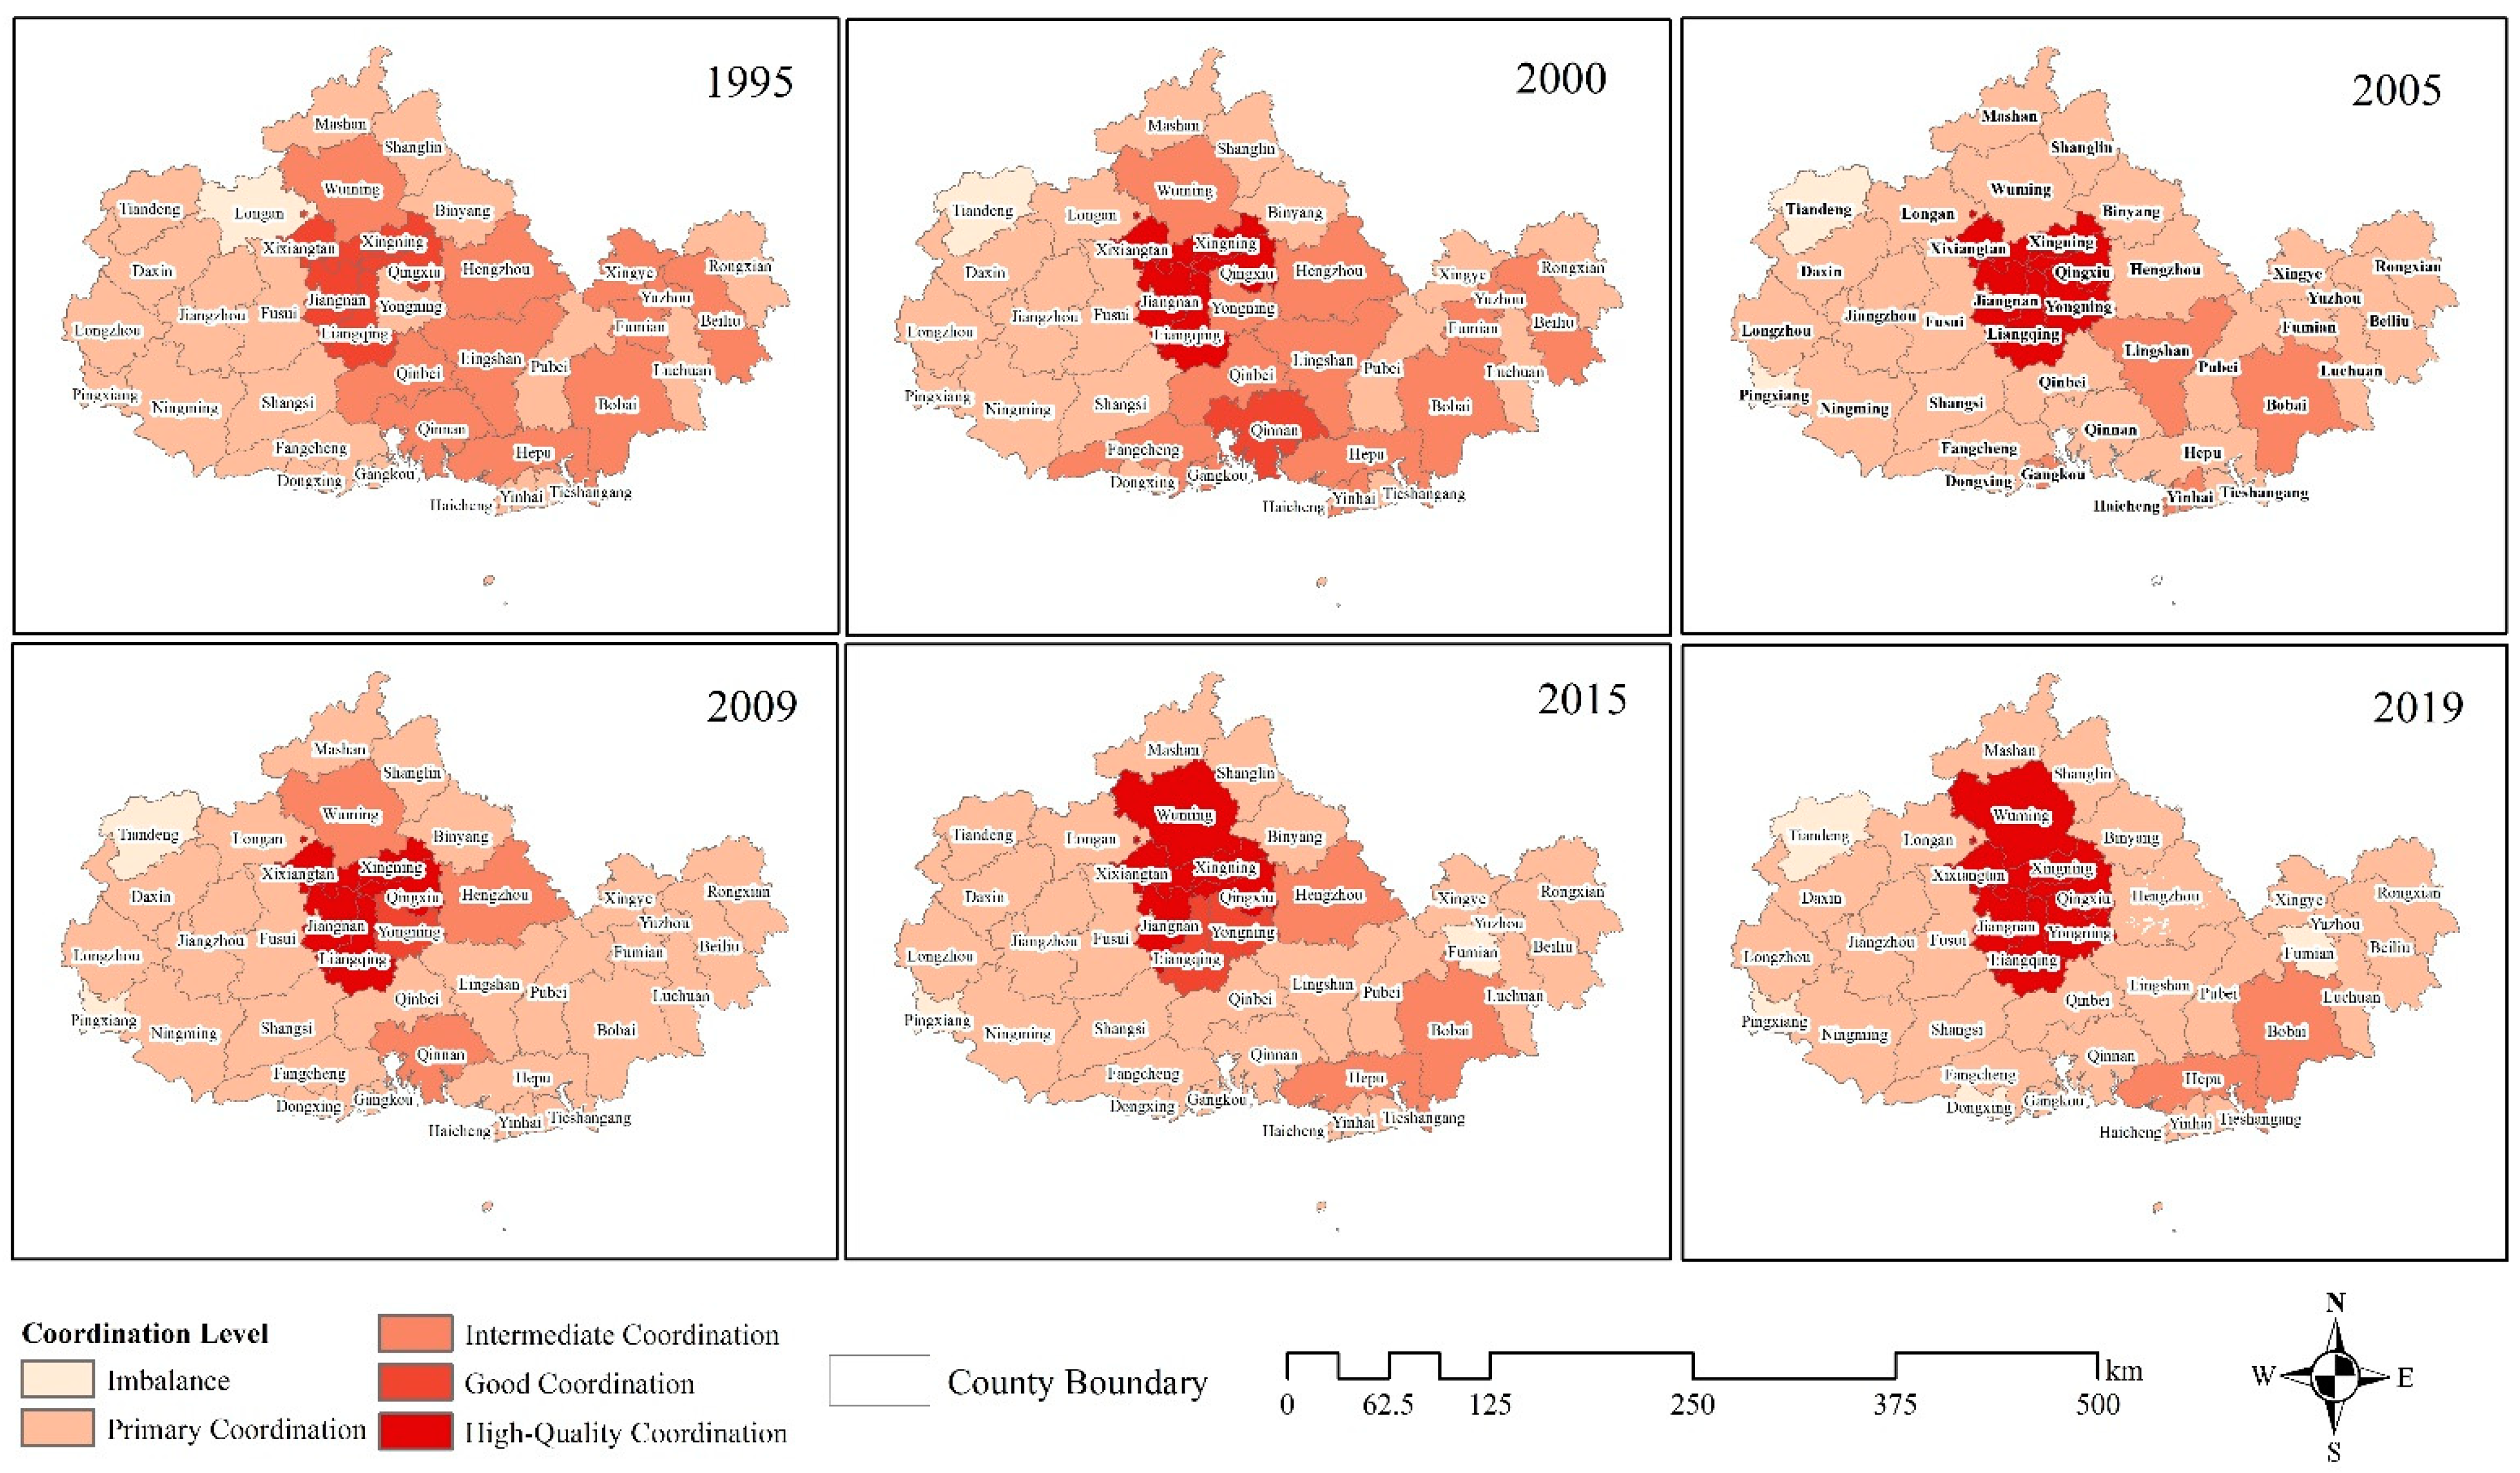
When considering the coordination characteristics of PLE functions, high–high and low–low clustering effects were observed. The coordination level has developed toward two extremes, and primary coordination maintained the highest proportion, accounting from 55.26% in 1995 to 71.05% in 2019, indicating the achievement of SDG target 11.a in the GBG_UA was low.
(3)
Considering the advantageous areas for PLE functions, the region mostly comprises single-function advantageous areas and a few the multifunction advantageous areas, including 20 single-function advantage counties (districts), 15 dual-function advantage counties (districts), and three multi-function advantage counties (districts), which indicates the lack of diversified land use structures in this region and that development planning should be formulated in combination with the local functional advantages.

Author Contributions

Conceptualization, Z.L.; methodology, Z.L.; writing—original draft, Z.L.; supervision, W.J.; formal analysis, W.J.; funding acquisition, W.J.; writing—review and editing, W.J. and K.P.; resources, C.L.; investigation, C.L.; data curation, Y.L. (Yanshun Li); software, Y.L. (Yanshun Li); visualization, Y.L. (Yurong Ling); validation, Y.D. All authors have read and agreed to the published version of the manuscript.

Funding

This research was funded by the National Natural Science Foundation of China (Grant No. 42101369, No. U21A2022, and No. 42164001), and the Open Project of Beijing Key Laboratory for Remote Sensing of Environment and Digital Cities.

Institutional Review Board Statement

Not applicable.

Informed Consent Statement

Not applicable.

Data Availability Statement

Data are available from the authors upon reasonable request as the data needs further use.

Conflicts of Interest

The authors declare no conflict of interest.

References

  1. United Nations. Transforming Our World: The 2030 Agenda for Sustainable Development; United Nations: New York, NY, USA, 2015. [Google Scholar]
  2. Zhang, J.Z.; Wang, S.; Zhao, W.W.; Liu, Y.X.; Fu, B.J. Research progress on the interlinkages between the 17 Sustainable Development Goals and their implication for domestic study. Acta Ecol. Sin. 2019, 39, 8327–8337. [Google Scholar]
  3. Fang, C.L. Important Progress and Prospects of China’s Urbanization and Urban Agglomeration in the Past 40 Years of Reform and Opening-Up. Econ. Geogr. 2018, 38, 1–9. [Google Scholar]
  4. Wang, Z.Y.; Yang, T.X.; Liu, H.L.; Huang, Y.P.; Liu, F.T. Coordinate Spatial Development Strategy of Densely Urbanized Area: Wuhan Metropolitan Circle. Planners 2018, 34, 21–27. [Google Scholar]
  5. Li, Z.; Jiang, W.G.; Wang, W.J.; Lv, J.X.; Deng, Y. Study on the wetland leading service function of Jing-Jin-Ji Urban Agglomeration based on the ecosystem service value. J. Nat. Resour. 2019, 34, 1654–1665. [Google Scholar] [CrossRef]
  6. Jiang, D.; Lin, G.; Fu, J.Y. Discussion on scientific foundation and approach for the overall optimization of “Production-Living-Ecological” space. J. Nat. Resour. 2021, 36, 1085–1101. [Google Scholar] [CrossRef]
  7. Allen, C.; Metternicht, G.; Wiedmann, T. Initial progress in implementing the Sustainable Development Goals (SDGs): A review of evidence from countries. Sustain. Sci. 2018, 13, 1453–1467. [Google Scholar] [CrossRef]
  8. Caprotti, F.; Cowley, R.; Datta, A.; Broto, V.C.; Gao, E.; Georgeson, L.; Herrick, C.; Odendaal, N.; Joss, S. The New Urban Agenda: Key Opportunities and Challenges for Policy and Practice. Urban Res. Pract. 2017, 10, 367–378. [Google Scholar] [CrossRef]
  9. McCarton, L.; O’Hogain, S.; Reid, A. Resilient Cities and Communities. Worth Water 2021, 11, 173–178. [Google Scholar]
  10. Lawanson, T.; Oyalowo, B.; Nubi, T. Global Goal, Local Context: Pathways to Sustainable Urban Development in Lagos, Nigeria. In Housing and SDGs in Urban Africa. Advances in 21st Century Human Settlements; Nubi, T.G., Anderson, I., Lawanson, T., Oyalowo, B., Eds.; Springer: Singapore, 2021; Volume 3, pp. 13–35. [Google Scholar]
  11. Cochran, F.; Daniel, J.; Jackson, L.; Neale, A. Earth Observation-based Ecosystem Services Indicators for National and Subnational Reporting of the Sustainable Development Goals. Remote Sens. Environ. 2020, 244, 111796. [Google Scholar] [CrossRef]
  12. Ni, P.F.; Marco, K.; Guo, J.; Xu, H.D.; Peng, X.H. Assessment of the Progress of Chinese Cities in Implementing UN Sustainable Development Goal 11. Urban Environ. Stud. 2021, 3, 36–55. [Google Scholar]
  13. Zarina, P. Local responses to global sustainability agendas: Learning from experimenting with the urban sustainable development goal in Cape Town. Sustain. Sci. 2017, 12, 785–797. [Google Scholar]
  14. Abubakar, I.R.; Aina, Y.A. The Prospects and Challenges of Developing More Inclusive, Safe, Resilient and Sustainable Cities in Nigeria. Land Use Policy 2019, 87, 104105. [Google Scholar] [CrossRef]
  15. Erblin, B.; Caterina, C.; Giancarlo, C. Unpacking SDG target 11.a: What is it about and how to measure its progress? City Environ. Interact. 2022, 14, 100080. [Google Scholar]
  16. Klopp, J.M.; Petretta, D.L. The urban sustainable development goal: Indicators, complexity and the politics of measuring cities. Cities 2017, 63, 92–97. [Google Scholar] [CrossRef]
  17. Hansson, S.; Arfvidsson, H.; Simon, D. Governance for sustainable urban development: The double function of SDG indicators. Area Dev. Policy 2019, 4, 217–235. [Google Scholar] [CrossRef]
  18. Duan, Y.M.; Wang, H.; Huang, A.; Xu, Y.Q.; Lu, L.H.; Ji, Z.X. Identification and spatial-temporal evolution of rural “production-living-ecological” space from the perspective of villagers’ behavior—A case study of Ertai Town, Zhangjiakou City. Land Use Policy 2021, 106, 105457. [Google Scholar] [CrossRef]
  19. Zhang, Y.N.; Long, H.L.; Tu, S.S.; Ge, D.Z.; Ma, L.; Wang, L.Z. Spatial identification of land use functions and their tradeoffs/synergies in China: Implications for sustainable land management. Ecol. Indic. 2019, 107, 105550. [Google Scholar] [CrossRef]
  20. Kienast, F.; Bolliger, J.; Potschin, M.; de Groot, R.S.; Verburg, P.H.; Heller, I.; Wascher, D.; Haines-Young, R. Assessing landscape functions with broad- scale environmental data: Insights gained from a prototype development for Europe. Environ. Manag. 2009, 44, 1099–1120. [Google Scholar] [CrossRef]
  21. Li, G.; Fang, C. Quantitative function identification and analysis of urban ecological-production-living spaces. Acta Geogr. Sin. 2016, 71, 49–65. [Google Scholar]
  22. Zou, L.L.; Liu, Y.S.; Wang, J.Y.; Yang, Y.Y. An analysis of land use conflict potentials based on ecological-production-living function in the southeast coastal area of China. Ecol. Indic. 2021, 122, 107297. [Google Scholar] [CrossRef]
  23. Ge, C.H.; Zhang, Z.G. Coordinated Development of Wuhan Metropolitan Circle From Economic Geography Viewpoint. Planners 2018, 34, 39–45. [Google Scholar]
  24. Zhang, X.S.; Xu, Z.J. Functional Coupling Degree and Human Activity Intensity of Production–Living–Ecological Space in Underdeveloped Regions in China: Case Study of Guizhou Province. Land 2021, 10, 56. [Google Scholar] [CrossRef]
  25. Fu, J.C.; Zhang, S.L. Functional Assessment and Coordination Characteristics of Production, Living, Ecological Function—A Case Study of Henan Province, China. Int. J. Environ. Res. Public Health 2021, 18, 8051. [Google Scholar] [CrossRef] [PubMed]
  26. Li, J.S.; Sun, W.; Li, M.Y.; Meng, L.L. Coupling coordination degree of production, living and ecologicalspaces and its influencing factors in the Yellow River Basin. J. Clean. Prod. 2021, 298, 126803. [Google Scholar] [CrossRef]
  27. Chen, H.J.; Yang, Q.Y.; Su, K.C.; Zhang, H.Z.; Lu, D.; Xiang, H.; Zhou, L.L. Identification and Optimization of Production-Living-Ecological Space in an Ecological Foundation Area in the Upper Reaches of the Yangtze River: A Case Study of Jiangjin Districtof Chongqing, China. Land 2021, 10, 863. [Google Scholar] [CrossRef]
  28. Fang, C.l. Progress and the future direction of research into urban agglomeration in China. Acta Geogr. Sin. 2014, 69, 1130–1144. [Google Scholar]
  29. Ling, Z.Y.; Li, Y.S.; Jiang, W.G.; Liao, C.M.; Ling, Y.R. Dynamic Change Characteristics of “Production-living-ecological Spaces”of Urban Agglomeration Interlaced with Mountains, Rivers and Sea: A Case Study of the Beibu Gulf Urban Agglomeration in Guangxi. Econ. Geogr. 2022, 42, 18–24. [Google Scholar]
  30. Liu, J.; Zhang, Z.; Xu, X.; Kuang, W.; Zhou, W.; Zhang, S.; Li, R.; Yan, C.; Yu, D.; Jiang, N. Spatial patterns and driving forces of land use change in China during the early 21st century. J. Geogr. Sci. 2010, 20, 483–494. [Google Scholar] [CrossRef]
  31. Liu, J.; Liu, Y.; Li, Y. Classification evaluation and spatial-temporal analysis of “production-living-ecological” spaces in China. Acta Geogr. Sin. 2017, 72, 1290–1304. [Google Scholar]
  32. Xie, H.L.; Yao, G.; Liu, G.Y. Spatial evaluation of the ecological importance based on GIS for environmental management: A case study in Xingguo county of China. Ecol. Indic. 2015, 51, 3–12. [Google Scholar] [CrossRef]
  33. Cheng, J.J.; Hu, S.F.; Zhang, Y.G.; Qi, X.Z.; Jin, S.L. Tourism Destination of Rural Residents Based on Rough Set and Analytic Hierarchy Process Method. Sci. Geogr. Sin. 2016, 36, 1885–1893. [Google Scholar]
  34. Wang, P.; Liu, M.; Liu, H.D. Evaluation of tourism utilization potential of intangible cultural heritage resources in Shanxi Province. Reg. Res. Dev. 2017, 36, 92–98. [Google Scholar]
  35. Ling, Z.Y.; Liu, R. Risk Assessment on Regional Water Scarcity in Guangdong Province Based on Principal Component Analysis. Resour. Sci. 2010, 32, 2324–2328. [Google Scholar]
  36. Zhao, L.; Zhu, Y.M.; Fu, M.C.; Zhang, P.T.; Cao, Y.G. Comparative study on intensive use of rural residential land based on principal component analysis and entropy method. Trans. Chin. Soc. Agric. Eng. 2012, 28, 235–242. [Google Scholar]
  37. Xu, L. Research on the Optimization of Geographical Spatial Pattern of Urban Agglomeration in the Middle Reaches of the Yangtze River base on the “Production, Living and Ecological” Function; Huazhong Agricultural University: Wuhan, China, 2017. [Google Scholar]
  38. Bian, Z.X.; Cheng, X.F.; Yu, M.; Cui, W.; Shi, S.L. The Proportionality of the functions of production, life and ecology in connection zone between Shenyang and Fushun. Chin. J. Agric. Resour. Reg. Plan. 2016, 37, 84–92. [Google Scholar]
  39. Wang, C.; Tang, N. Spatio-temporal characteristics and evolution of rural production-living-ecological space function coupling coordination in Chongqing Municipality. Geogr. Res. 2018, 37, 1100–1114. [Google Scholar]
  40. Li, Y.; Sun, Z.G.; Liu, E.Y.; Shao, C.X. Spatio-temporal evolution of regional structure about crops and livestock in China based on the theory of comparative advantage. J. Nat. Resour. 2021, 36, 1149–1162. [Google Scholar] [CrossRef]
  41. Zhang, J.X. Assessment of landscapes utilization quality and its coupling and coordination based on “Production, Living and Ecological”: A case study of the Southern Jiangsu Region. J. Agric. Sci. 2017, 38, 57–63. [Google Scholar]
  42. Ni, W.Q. The Coupling and Coordination Relationship and Their Spatial Pattern of Urban Land Use Economic, Social and Ecological Benefits of Cities in Three Largest Urban Agglomerations in China. Urban Dev. Stud. 2016, 23, 69–77. [Google Scholar]
  43. Wang, L.J.; Dong, X.F.; Liu, X.G. Spatio-temporal characteristics of coupling coordination between the quality of population urbanization and land urbanization: The case of 12 central cities in Gansu Province, China. Chin. J. Appl. Ecol. 2016, 27, 3335–3343. [Google Scholar]
  44. Guo, Y.H. Study on the Comprehensive Evaluation and Its Spatial Differences of the Coupling Coordination Degree of Regional Production Space, Living Space and Ecology Space in Jiangsu Province; Nanjing Agricultural University: Nanjing, China, 2017. [Google Scholar]
  45. Jin, G.; Deng, X.Z.; Zhang, Q.; Wang, Z.Q.; Li, Z.H. Comprehensive function zoning of national land space for Wuhan metropolitan region. Geogr. Res. 2017, 36, 541–552. [Google Scholar]
  46. Pang, L.; Zhou, X.; Wei, L.G. Function Evaluation and Coupling Coordination Analysis of Land Space “Productive—Living-Ecological” in Guangxi Zhuang Autonomous Region During 2009–2018. Bull. Soil Water Conserv. 2021, 41, 237–244. [Google Scholar]
  47. Shen, S.K.; Lu, Y.; Hua, C.; Qin, D. Quantitative evaluation of the “Production living Ecological” Function in the Nanliu River Basin. Chin. J. Agric. Resour. Reg. Plan. 2020, 41, 147–155. [Google Scholar]
  48. Dangles, O.; Casas, J. Ecosystem services provided by insects for achieving sustainable development goals. Ecosyst. Serv. 2019, 35, 109–115. [Google Scholar] [CrossRef]
  49. Reyers, B.; Selig, E.R. Global targets that reveal the social–ecological interdependencies of sustainable development. Nat. Ecol. Evol. 2020, 4, 1011–1019. [Google Scholar] [CrossRef] [PubMed]
  50. Wood, S.L.R.; Jones, S.K.; Johnson, J.A.; Brauman, K.A.; Chaplin-Kramer, R.; Fremier, A.; Girvetz, E.; Gordon, L.J.; Kappel, C.V.; Mandle, L.; et al. Distilling the role of ecosystem services in the sustainable development goals. Ecosyst. Serv. 2018, 29, 70–82. [Google Scholar] [CrossRef]
  51. National Development and Reform Commission; Ministry of Housing and Urban-Rural Development of the People’s Republic of China. Beibu Gulf Urban Agglomeration Development Plan; National Development and Reform Commission: Beijing, China, 2017.
  52. Curnick, D.J.; Pettorelli, N.; Amir, A.A.; Balke, T.; Barbier, E.B.; Crooks, S.; Dahdouh-Guebas, F.; Duncan, C.; Endsor, C.; Lee, S.Y.; et al. The value of small mangrove patches. Science 2019, 363, 239. [Google Scholar] [CrossRef]
  53. Peng, K.F.; Jiang, W.G.; Ling, Z.Y.; Hou, P.; Deng, Y.W. Evaluating the potential impacts of land use changes on ecosystem service value under multiple scenarios in support of SDG reporting: A case study of the Wuhan urban agglomeration. J. Clean. Prod. 2021, 307, 127321. [Google Scholar] [CrossRef]
Figure 1. The land cover of the Guangxi Beibu Gulf urban agglomeration.
Diversity 14 00469 g001
Figure 2. Schematic diagram of research ideas.
Diversity 14 00469 g002
Figure 3. Changing production function trends in the Guangxi Beibu Gulf urban agglomeration from 1995 to 2019.
Diversity 14 00469 g003
Figure 4. Production function evaluation results in the Guangxi Beibu Gulf urban agglomeration from 1995 to 2019.
Diversity 14 00469 g004
Figure 5. Changing living function trends in the Guangxi Beibu Gulf urban agglomeration from 1995–2019.
Diversity 14 00469 g005
Figure 6. Living function evaluation results in the Guangxi Beibu Gulf urban agglomeration from 1995 to 2019.
Diversity 14 00469 g006
Figure 7. Changing ecological function trends in the Guangxi Beibu Gulf urban agglomeration from 1995 to 2019.
Diversity 14 00469 g007
Figure 8. Ecological function evaluation results in the Guangxi Beibu Gulf urban agglomeration from 1995 to 2019.
Diversity 14 00469 g008
Figure 9. Distribution of land coordination level in the Guangxi Beibu Gulf urban agglomeration from 1995 to 2019.
Diversity 14 00469 g009
Figure 10. County statistics of land coordination level in the Guangxi Beibu Gulf urban agglomeration from 1995 to 2019.
Diversity 14 00469 g010
Figure 11. Distribution of land function advantage areas in the Guangxi Beibu Gulf urban agglomeration.
Diversity 14 00469 g011
Table 1. Link between PLE functions coordination and SDG target 11.a.
Coordination Level of PLE FunctionsSDG Target 11.a Characteristic
ImbalanceExtremely poor production, or the over development of production function has led to the serious extrusion of other functions, such as poor living conditions or serious ecological pollution.
Primary CoordinationProduction has initially developed, life has gradually improved, or the ecology is fragile.
Intermediate CoordinationGradually transformed into an intensive and efficient production mode, and began to pay attention to repair the ecological problems caused by production or living activities.
Good CoordinationProduction developed and ecological restoration has achieved good results, and the overall living environment has been greatly improved.
High-quality CoordinationPLE functions promote each other, there is a positive link betweem PLE functions, and they realize the orderly sustainable development of urban agglomerations.
Table 2. Evaluation index system for the production–ecological–living spaces functions in the Guangxi Beibu Gulf urban agglomeration.
Target LayerGuideline LayerIndex Layer (Unit)Weight
Production functionEconomic developmentRegional GDP (CNY ten thousand)0.0932
Fiscal revenue (CNY ten thousand)0.0758
Total fixed investment (CNY ten thousand)0.0937
Percentages of the output value of secondary and tertiary industries (%)0.1034
Agricultural productionOutput values of agriculture, forestry, animal husbandry and fishery (CNY ten thousand)0.1227
Cultivated land area (km2)0.1236
Grain output (tons)0.0745
Industrial productionIndustrial and mining production space area (km2)0.1102
Total output value of industries above designated scale (CNY ten thousand)0.0997
Number of designated-scale industrial and mining enterprises (EA)0.1031
Living functionLiving carryingGDP per capita (CNY per person)0.1598
Total retail sales of consumer goods per capita (CNY per person)0.1515
Residents’ saving balance per capita (CNY per person)0.1490
Living serviceLiving space area (km2)0.1571
Urbanization rate (%)0.1083
Number of schools (EA)0.1463
Number of medical beds (EA)0.1280
Ecological functionEcological supplyEcological space area (km2)0.1712
Forest coverage rate (%)0.1793
Percentage of waters area (%)0.1721
Ecological maintenanceProportion of days with excellent air quality (%)0.1625
Water quality compliance rate (%)0.1691
Harmless treatment rate of domestic waste (%)0.1458
Note: The space area indices in relation to the PLE functions described in the table are derived from land use types (where the living space area includes urban living spaces and rural residential land area, whereas the ecological space area covers forest land, grassland, and water body). Other data are calculated based on the statistical yearbooks.
Table 3. Land function advantage results in the Guangxi Beibu Gulf urban agglomeration.
Administrative DistrictAgriculture AdvantageIndustry AdvantageLiving AdvantageEcological AdvantageAdvantage Type
Xingning1.5531.4731.0110.395Production–Living
Qingxiu1.4171.3871.1390.385Production–Living
Jiangnan1.5911.6530.9980.297Production
Xixiangtang1.4931.3641.1230.363Production–Living
Liangnqing1.5021.6320.8510.530Production
Yongning1.6771.6230.9440.314Production
Wuming1.4891.4471.0110.450Production–Living
Longan0.8410.7980.6381.603Ecological
Mashan0.8350.4660.4971.921Ecological
Shanglin0.5630.2811.1441.475Living–Ecological
Binyang1.0850.7550.9651.099Production–Ecological
Hengzhou1.1430.7511.0071.016Production–Living–Ecological
Haicheng0.2331.0052.1100.278Production–Living
Yinhai0.3360.4911.4341.204Living–Ecological
Tieshangang0.2101.0201.7920.638Production–Living
Hepu0.6850.6151.3830.970Living
Gangkou0.0881.5031.0901.265Production–Living–Ecological
Fangcheng0.4820.6490.5512.008Ecological
Shagnsi0.5960.2800.5492.111Ecological
Dongxing0.2650.4870.7382.022Ecological
Qinnan0.4181.3610.9721.245Living–Ecological
Qinbei0.5110.8901.1831.175Ecological
Lingshan1.0120.6571.2340.897Production–Living
Pubei0.7580.6410.8431.506Ecological
Yuzhou0.4140.7081.6240.839Living
Fumian0.8470.5840.5271.823Ecological
Rongxian0.6530.5670.9261.519Ecological
Luchuan0.9221.0471.0181.010Production–Living–Ecological
Bobai1.0110.5900.9861.205Production–Ecological
Xingye0.7680.6630.9321.390Ecological
Beiliu0.7480.7581.1111.160Living–Ecological
Jiangzhou0.9250.8450.7311.421Ecological
Fusui0.9671.1990.8121.134Production–Ecological
Ningming0.8730.4060.4971.925Ecological
Longzhou0.6730.4000.6071.938Ecological
Daxin0.8150.3370.5871.896Ecological
Tiandeng0.8600.0940.4082.181Ecological
Pingxiang0.2170.3381.0281.805Living–Ecological
Note: Agriculture advantage and industry advantage represent production advantage.
Table 4. Statistical table for the number of land function advantage areas in the Guangxi Beibu Gulf Urban agglomeration.
Advantage TypeNumber of Administrative DistrictName of Administrative District
Production3Jiangnan, Liangqing, Yongning
Living2Yuzhou, Hepu
Ecological15Longan, Mashan, Fangcheng, Shangsi, Dongxing, Qinbei, Pubei, Fumian, Rongxian, Xingye, Jiangzhou, Ningming, Longzhou, Daxin, Tiandeng
Production–Living7Xingning, Qingxiu, Xixiangtang, Wuming, Tieshangang, Lingshan, Haicheng
Production–Ecological3Fusui, Binyang, Bobai
Living–Ecological5Beiliu, Shanglin, Yinhai, Qinnan, Pingxiang
Production–Living–Ecological3Hengzhou, Gangkou, Lunchuan
Publisher’s Note: MDPI stays neutral with regard to jurisdictional claims in published maps and institutional affiliations.

