
Bat Activity in Organic Rice Fields Is Higher Than in Conventional Fields in Landscapes of Intermediate Complexity


Abstract
1. Introduction
2. Materials and Methods
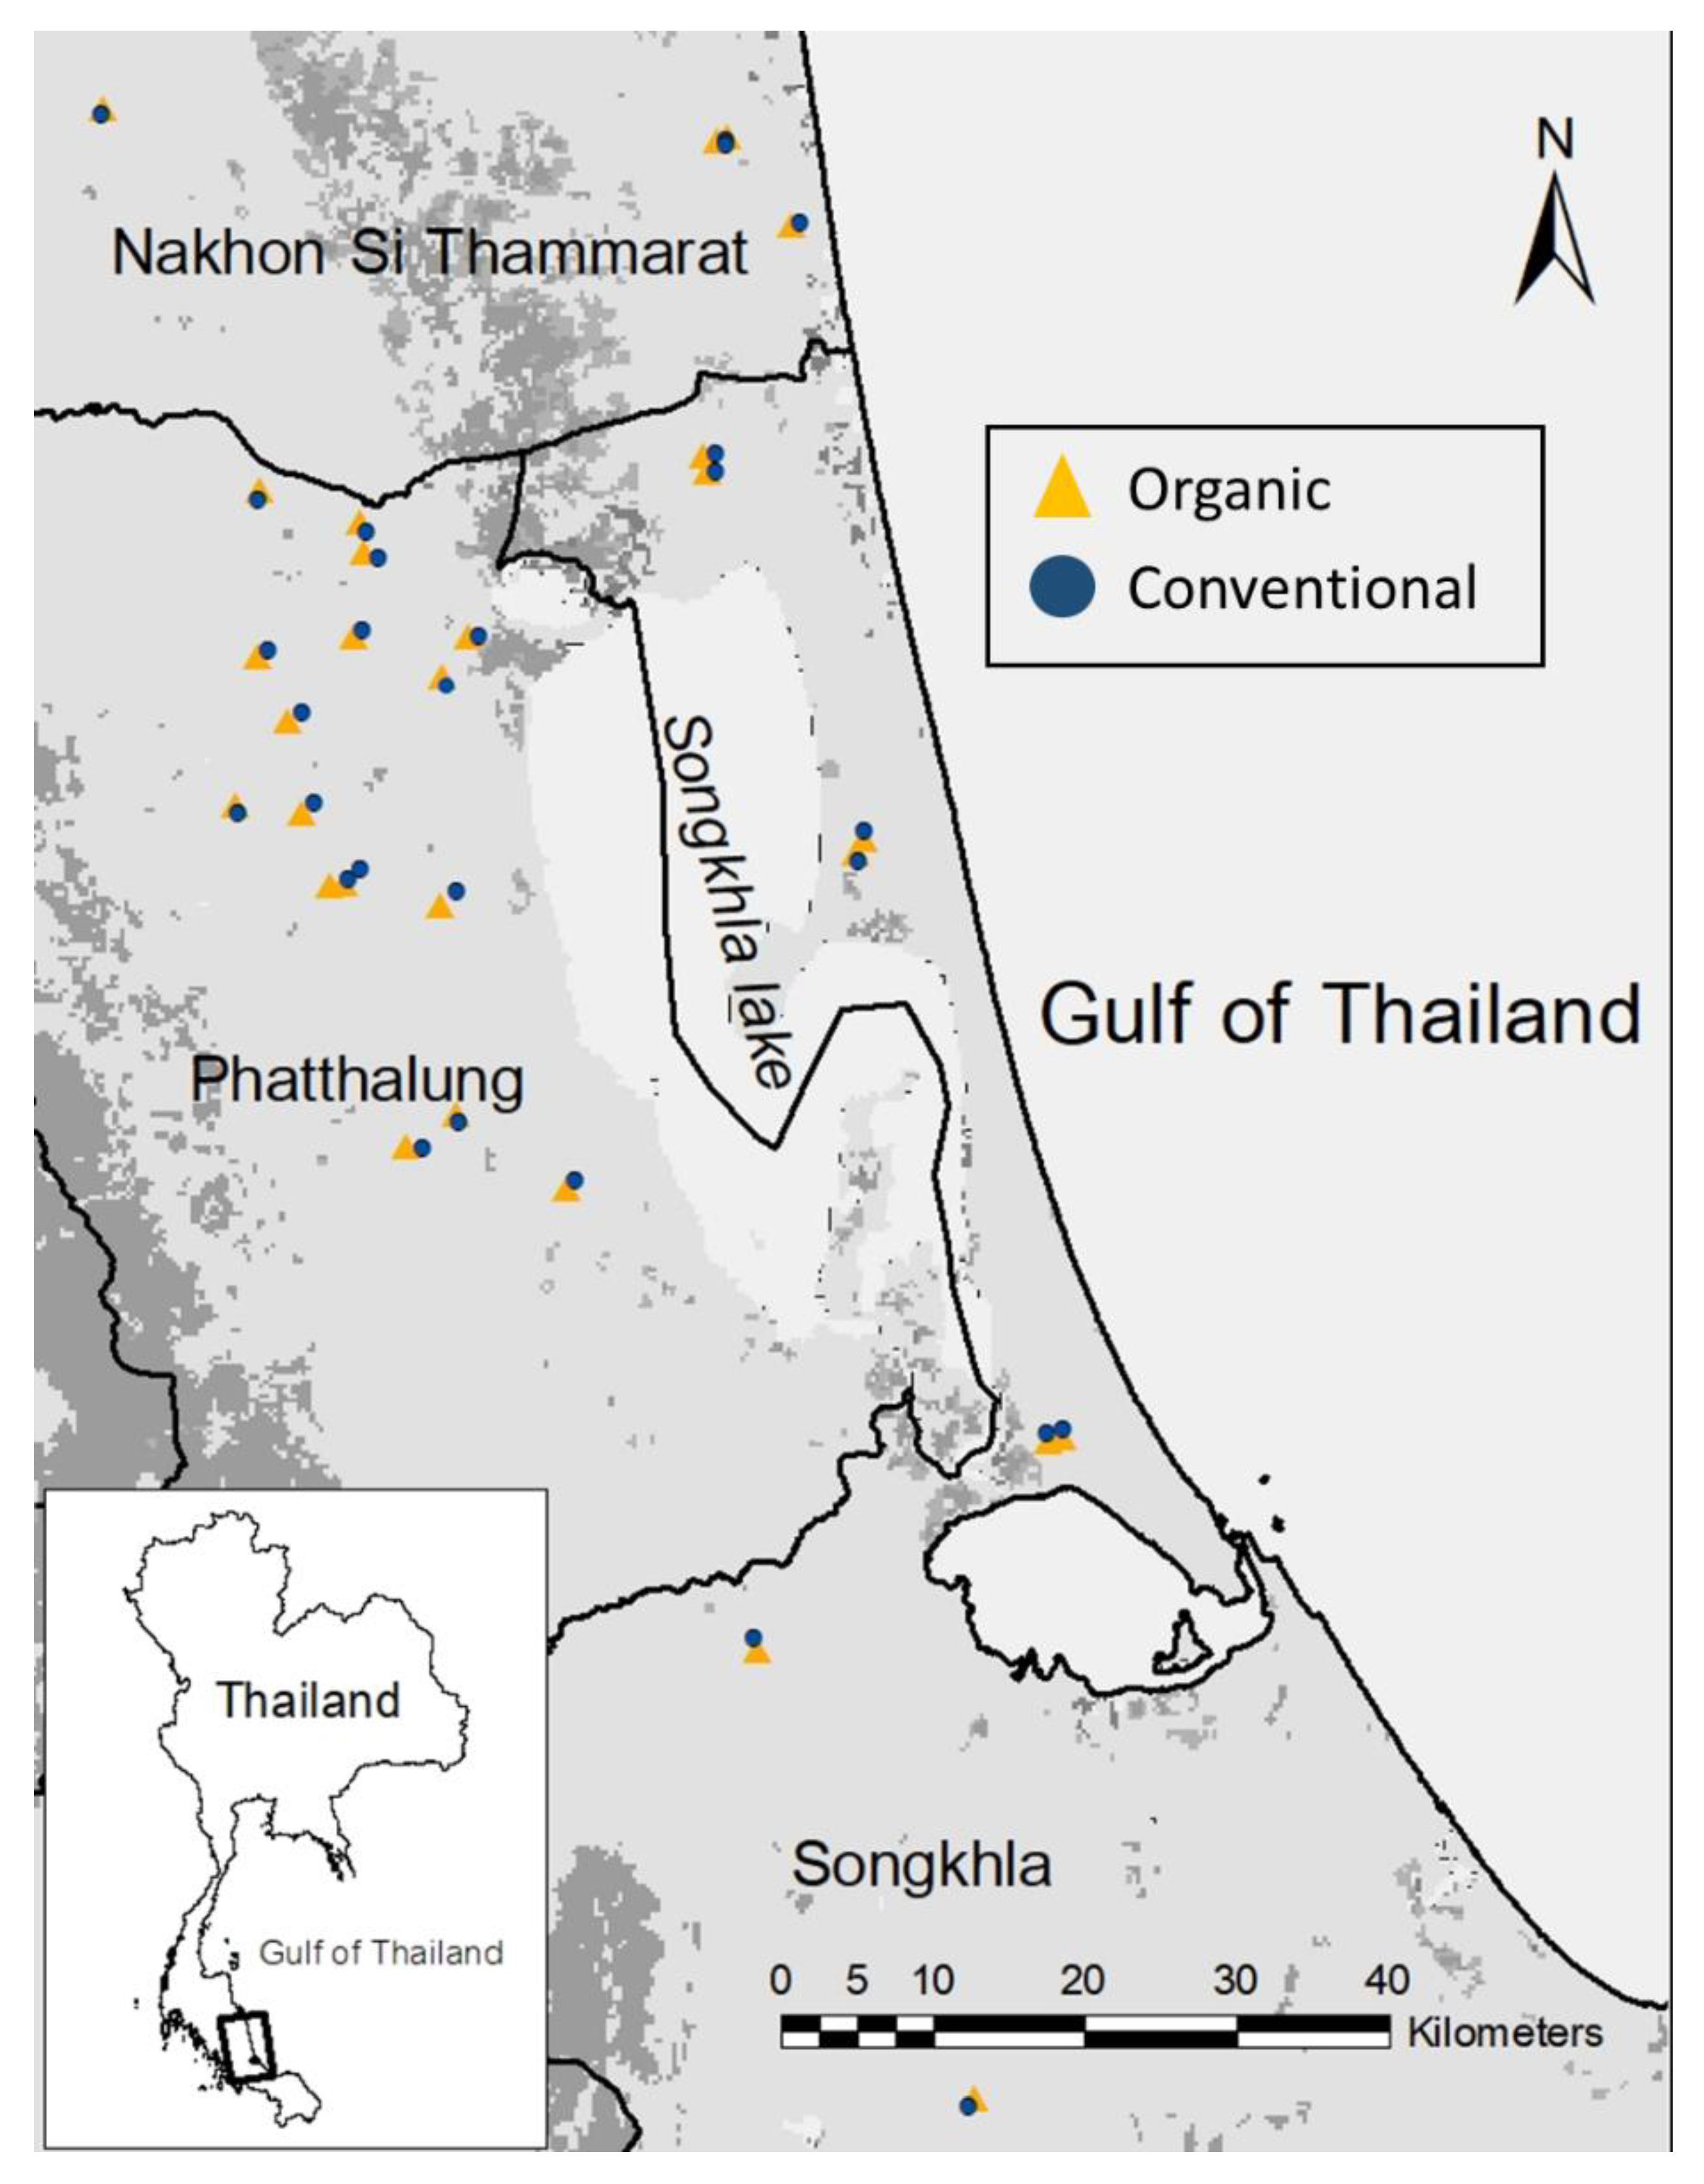
2.1. Study Area
2.2. Sampling Design and Site Selection
2.3. Acoustic Sampling
2.4. Analysis of Echolocation Calls
2.5. Insect Sampling
2.6. Data Analysis
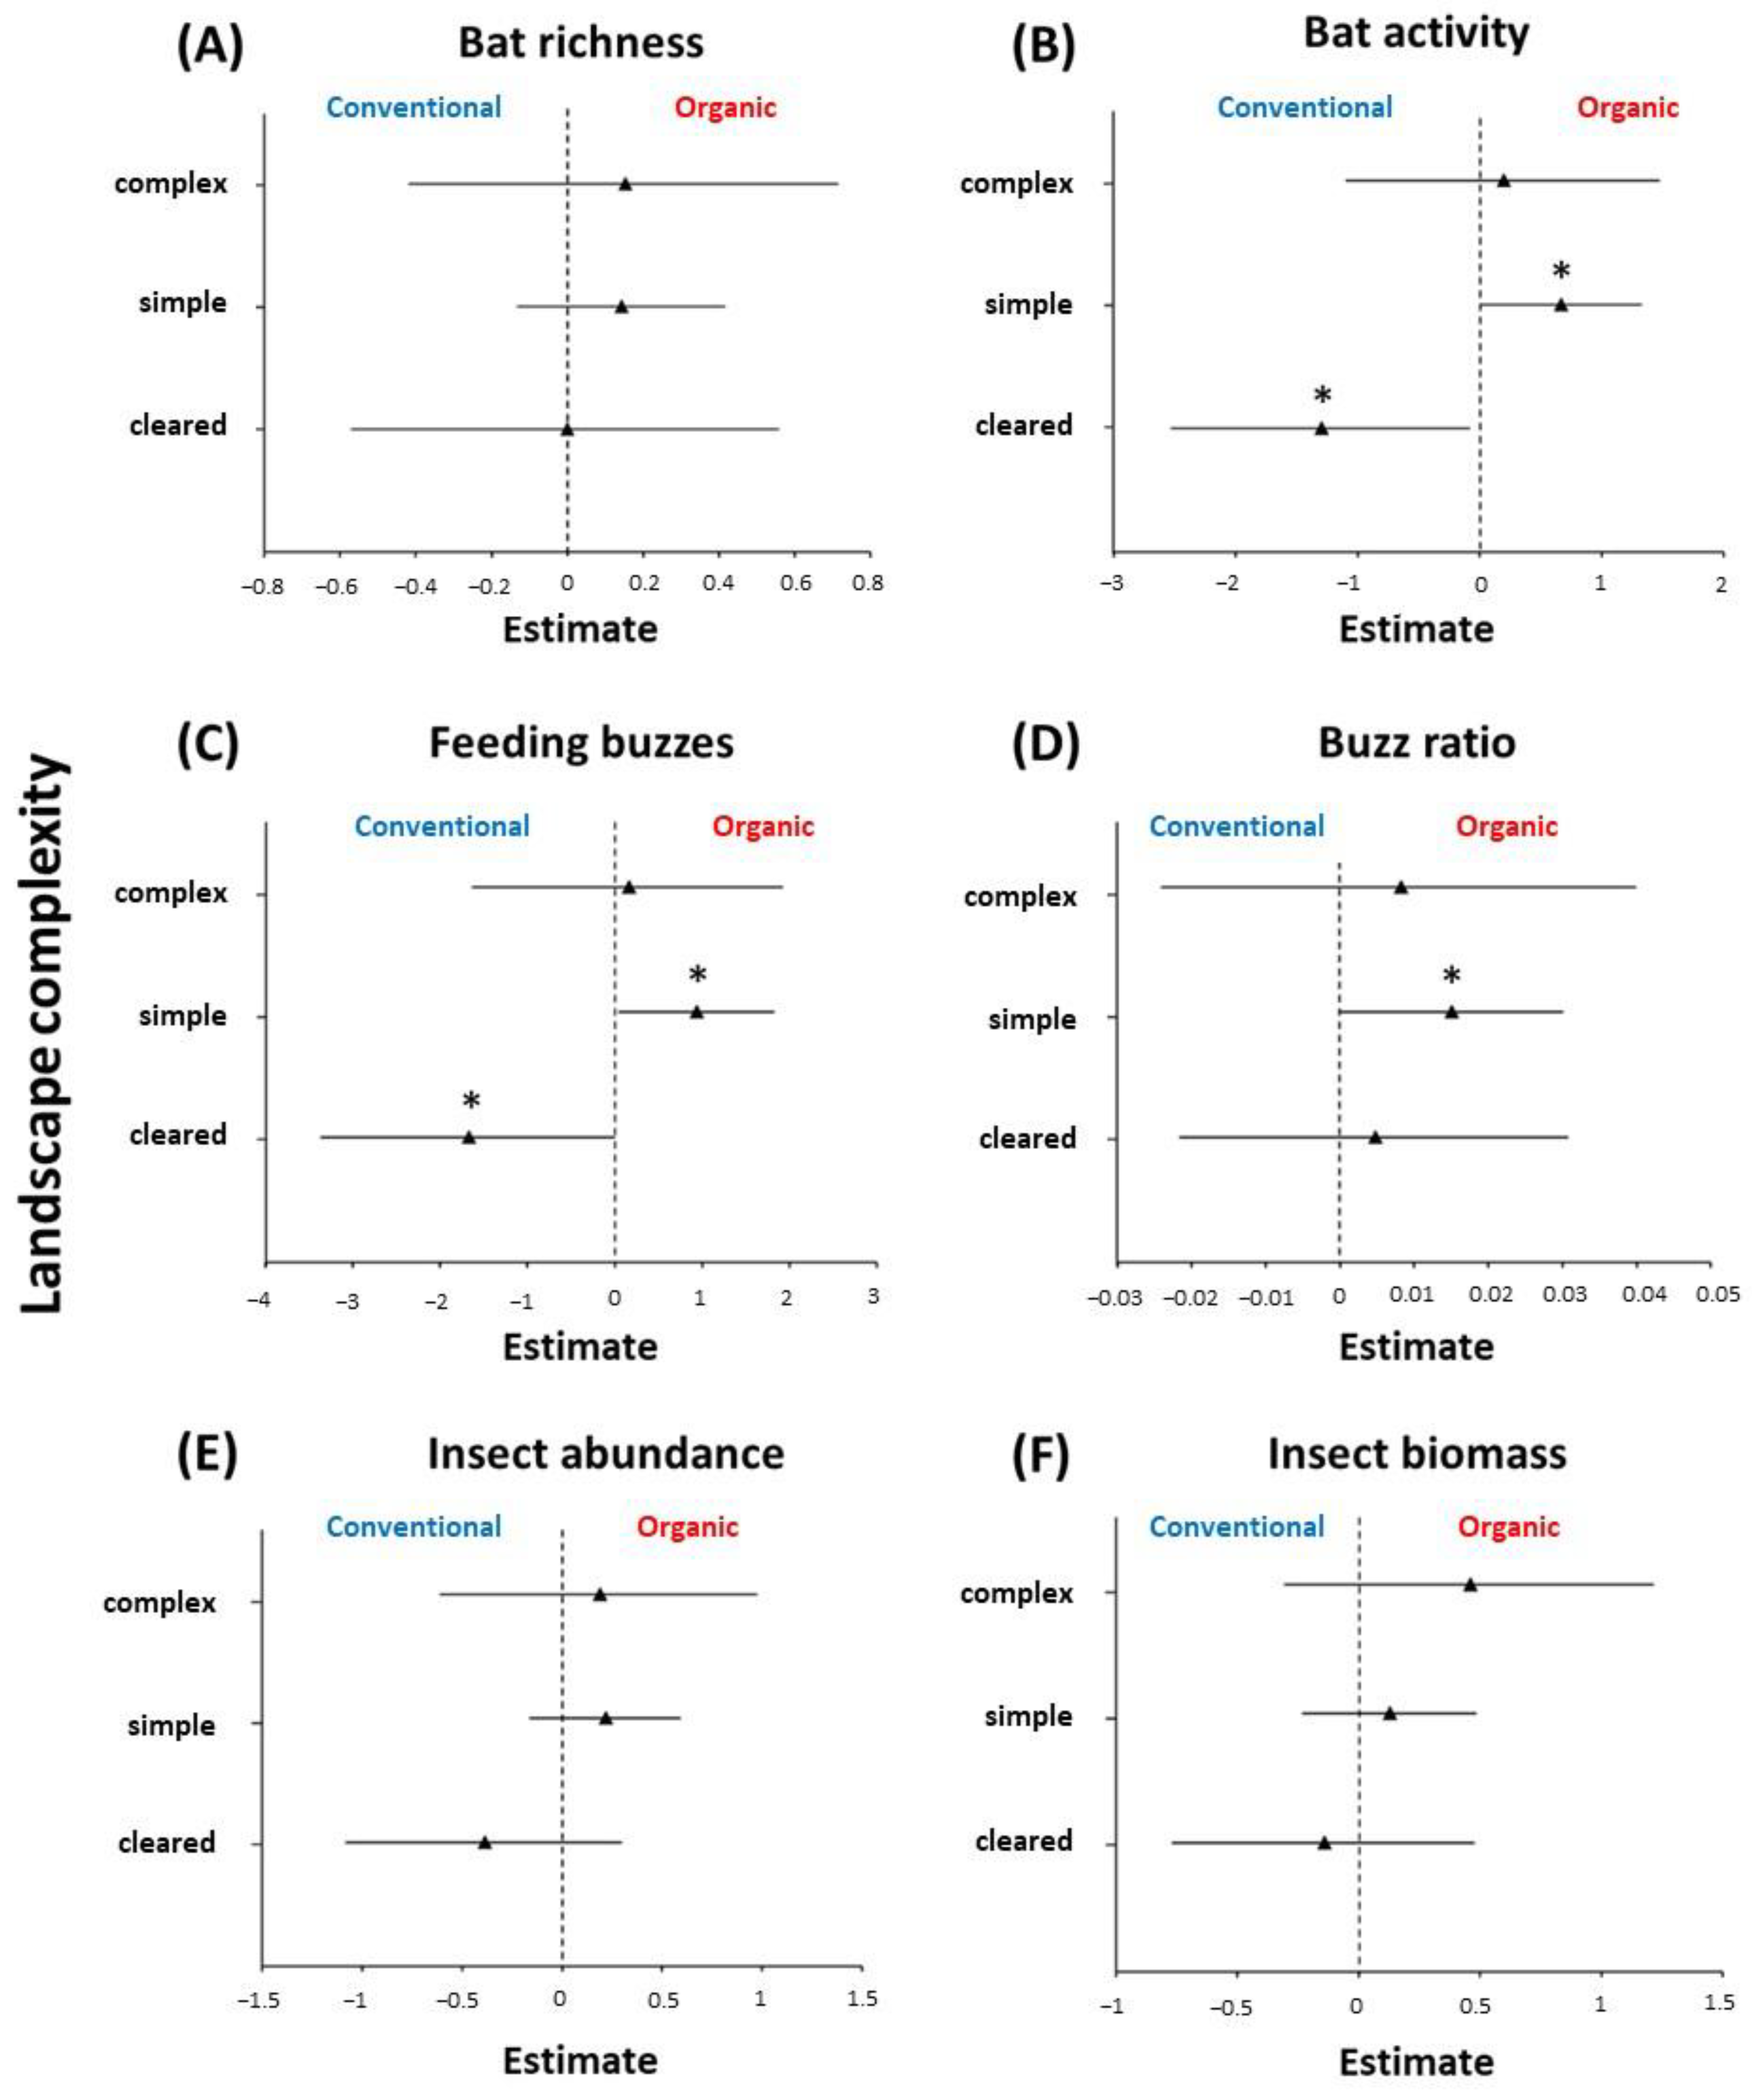
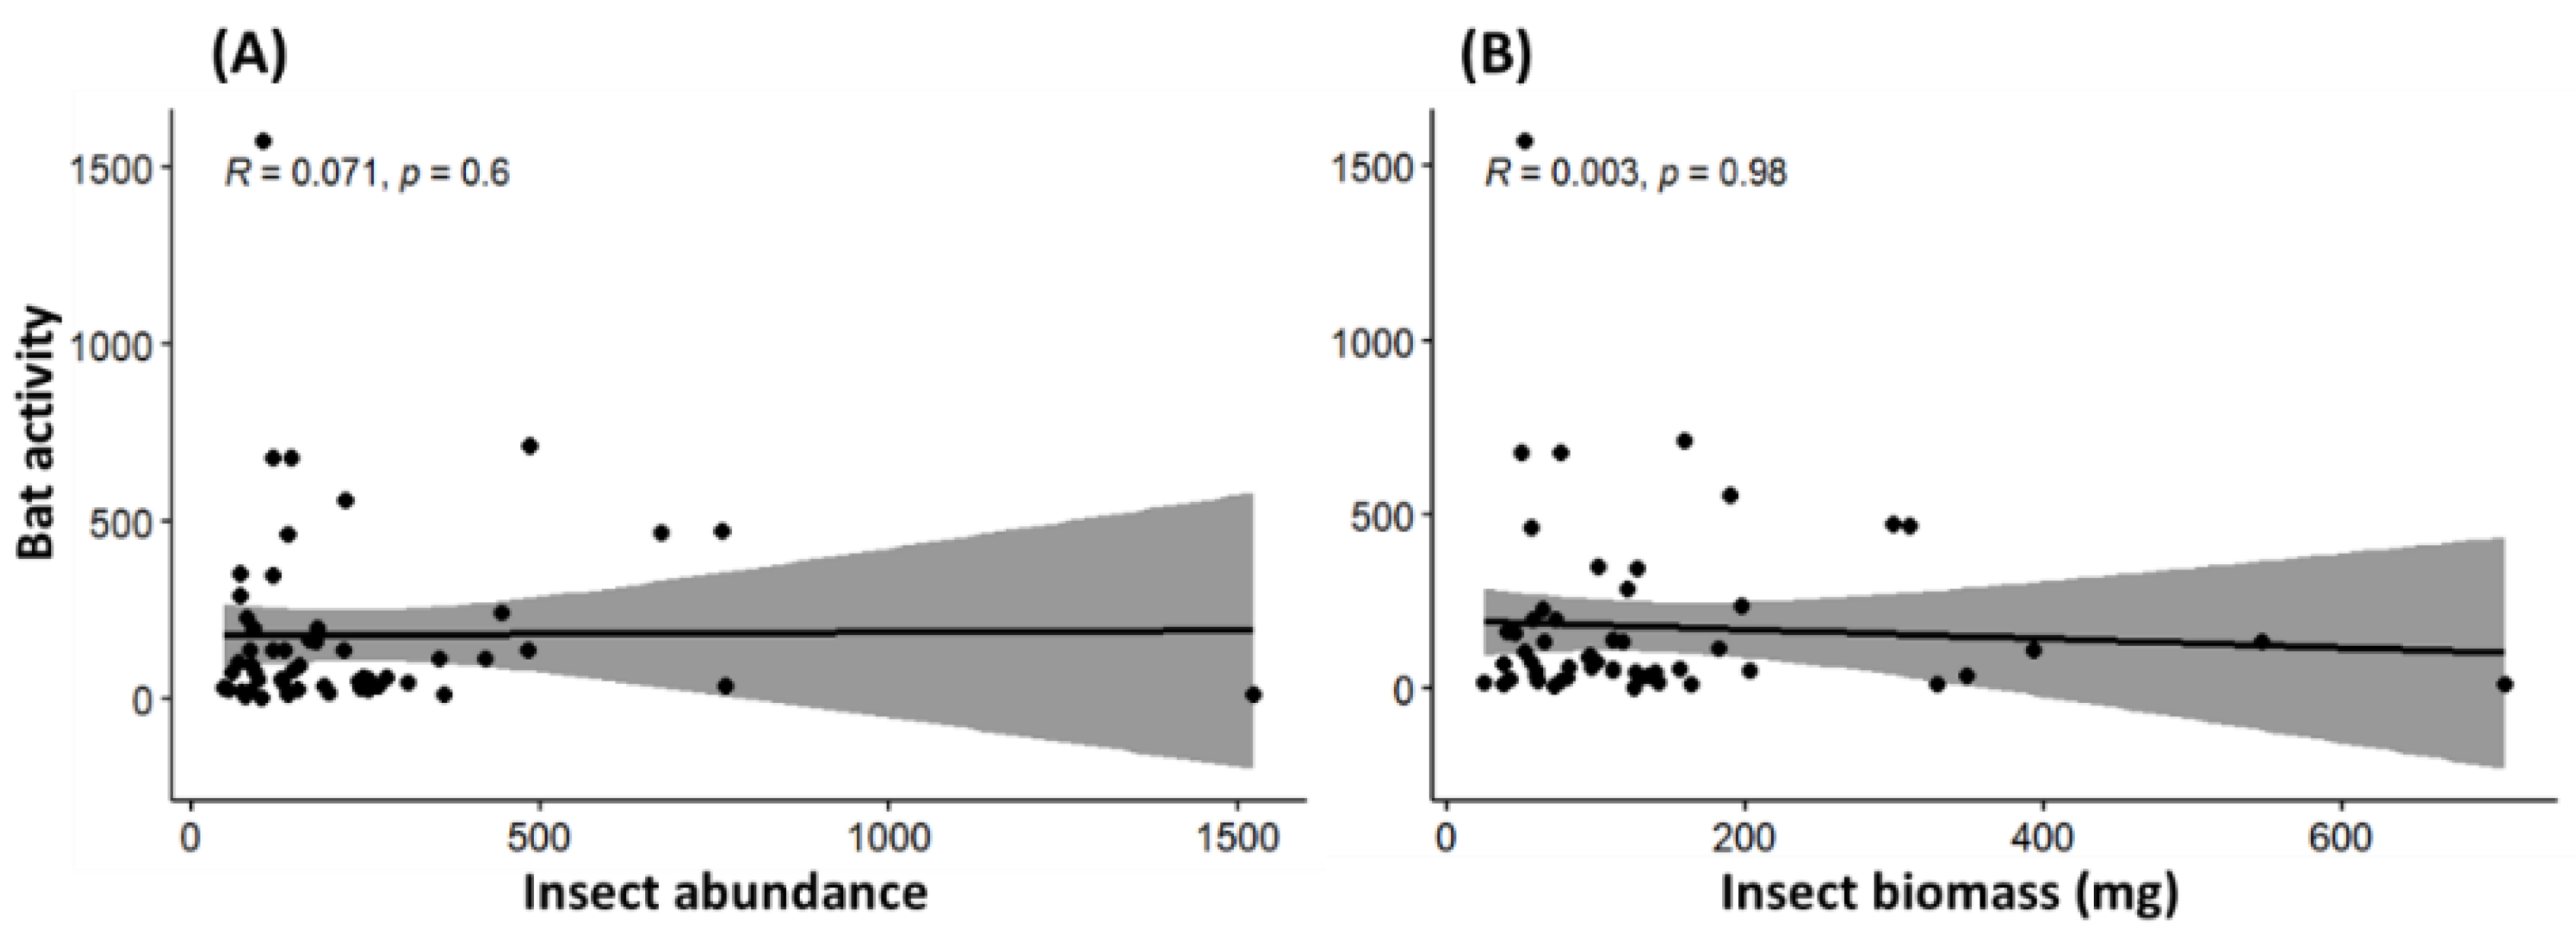
3. Results
4. Discussion
4.1. The Effects of Organic Farming on Bats and Insects
4.2. Response of Insectivorous Bats to Landscape Characteristics
4.3. The Differential Response of Bats According to Species and Guild
4.4. Response of Insectivorous Bats to Extreme Environmental Disturbance
5. Implications for Conservation
Supplementary Materials
Author Contributions
Funding
Institutional Review Board Statement
Data Availability Statement
Acknowledgments
Conflicts of Interest
References
- Godfray, H.C.J.; Beddington, J.R.; Crute, I.R.; Haddad, L.; Lawrence, D.; Muir, J.F.; Pretty, J.; Robinson, S.; Thomas, S.M.; Toulmin, C. Food security: The challenge of feeding 9 billion people. Science 2010, 327, 812–818. [Google Scholar] [CrossRef] [PubMed]
- Sala, O.E.; Chapin, F.S.; Armesto, J.J.; Berlow, E.; Bloomfield, J.; Dirzo, R.; Huber-Sanwald, E.; Huenneke, L.F.; Jackson, R.B.; Kinzig, A.; et al. Global biodiversity scenarios for the year 2100. Science 2000, 287, 1770–1774. [Google Scholar] [CrossRef] [PubMed]
- Jonsson, M.; Straub, C.S.; Didham, R.K.; Buckley, H.L.; Case, B.S.; Hale, R.J.; Gratton, C.; Wratten, S.D. Experimental evidence that the effectiveness of conservation biological control depends on landscape complexity. J. Appl. Ecol. 2015, 52, 1274–1282. [Google Scholar] [CrossRef]
- Achard, F.; Eva, H.D.; Stibig, H.-J.; Mayaux, P.; Gallego, J.; Richards, T.; Malingreau, J.-P. Determination of deforestation rates of the world’s humid tropical forests. Science 2002, 297, 999–1002. [Google Scholar] [CrossRef] [PubMed]
- Kim, D.-H.; Sexton, J.O.; Townshend, J.R. Accelerated deforestation in the humid tropics from the 1990s to the 2000s. Geophys. Res. Lett. 2015, 42, 3495–3501. [Google Scholar] [CrossRef] [PubMed]
- Kingston, T. Research priorities for bat conservation in Southeast Asia: A consensus approach. Biodivers. Conserv. 2010, 19, 471–484. [Google Scholar] [CrossRef]
- Tscharntke, T.; Clough, Y.; Wanger, T.C.; Jackson, L.; Motzke, I.; Perfecto, I.; Vandermeer, J.; Whitbread, A. Global food security, biodiversity conservation and the future of agricultural intensification. Biol. Conserv. 2012, 151, 53–59. [Google Scholar] [CrossRef]
- Whittingham, M.J. The future of agri-environment schemes: Biodiversity gains and ecosystem service delivery? J. Appl. Ecol. 2011, 48, 509–513. [Google Scholar] [CrossRef]
- FiBL Statistics. Data on Organic Area in Worldwide. Available online: https://statistics.fibl.org/world/area-world.html (accessed on 10 December 2021).
- Norton, L.; Johnson, P.; Joys, A.; Stuart, R.; Chamberlain, D.; Feber, R.; Firbank, L.; Manley, W.; Wolfe, M.; Hart, B.; et al. Consequences of organic and non-organic farming practices for field, farm and landscape complexity. Agric. Ecosyst. Environ. 2009, 129, 221–227. [Google Scholar] [CrossRef]
- Froidevaux, J.S.P.; Louboutin, B.; Jones, G. Does organic farming enhance biodiversity in Mediterranean vineyards? A case study with bats and arachnids. Agric. Ecosyst. Environ. 2017, 249, 112–122. [Google Scholar] [CrossRef]
- Long, B.L.; Kurta, A. Activity and diet of bats in conventional versus organic apple orchards in southern Michigan. Can. Field-Nat. 2014, 128, 158–164. [Google Scholar] [CrossRef][Green Version]
- Pocock, M.J.; Jennings, N. Testing biotic indicator taxa: The sensitivity of insectivorous mammals and their prey to the intensification of lowland agriculture. J. Appl. Ecol. 2008, 45, 151–160. [Google Scholar] [CrossRef]
- Wickramasinghe, L.P.; Harris, S.; Jones, G.; Vaughan Jennings, N. Abundance and species richness of nocturnal insects on organic and conventional farms: Effects of agricultural intensification on bat foraging. Conserv. Biol. 2004, 18, 1283–1292. [Google Scholar] [CrossRef]
- Bengtsson, J.; Ahnström, J.; Weibull, A.-C. The effects of organic agriculture on biodiversity and abundance: A meta-analysis. J. Appl. Ecol. 2005, 42, 261–269. [Google Scholar] [CrossRef]
- Fuller, R.J.; Norton, L.R.; Feber, R.E.; Johnson, P.J.; Chamberlain, D.E.; Joys, A.C.; Mathews, F.; Stuart, R.C.; Townsend, M.C.; Manley, W.J.; et al. Benefits of organic farming to biodiversity vary among taxa. Biol. Lett. 2005, 1, 431–434. [Google Scholar] [CrossRef] [PubMed]
- Batáry, P.; Báldi, A.; Kleijn, D.; Tscharntke, T. Landscape-moderated biodiversity effects of agri-environmental management: A meta-analysis. Proc. R. Soc. B 2011, 278, 1894–1902. [Google Scholar] [CrossRef]
- Gabriel, D.; Sait, S.M.; Hodgson, J.A.; Schmutz, U.; Kunin, W.E.; Benton, T.G. Scale matters: The impact of organic farming on biodiversity at different spatial scales. Ecol. Lett. 2010, 13, 858–869. [Google Scholar] [CrossRef]
- Tuck, S.L.; Winqvist, C.; Mota, F.; Ahnström, J.; Turnbull, L.A.; Bengtsson, J. Land-use intensity and the effects of organic farming on biodiversity: A hierarchical meta-analysis. J. Appl. Ecol. 2014, 51, 746–755. [Google Scholar] [CrossRef]
- Tscharntke, T.; Klein, A.M.; Kruess, A.; Steffan-Dewenter, I.; Thies, C. Landscape perspectives on agricultural intensification and biodiversity—Ecosystem service management. Ecol. Lett. 2005, 8, 857–874. [Google Scholar] [CrossRef]
- Tscharntke, T.; Tylianakis, J.M.; Rand, T.A.; Didham, R.K.; Fahrig, L.; Batáry, P.; Bengtsson, J.; Clough, Y.; Crist, T.O.; Dormann, C.F.; et al. Landscape moderation of biodiversity patterns and processes—eight hypotheses. Biol. Rev. 2012, 87, 661–685. [Google Scholar] [CrossRef]
- Concepción, E.D.; Díaz, M.; Baquero, R.A. Effects of landscape complexity on the ecological effectiveness of agri-environment schemes. Landsc. Ecol. 2008, 23, 135–148. [Google Scholar] [CrossRef]
- Birkhofer, K.; Arvidsson, F.; Ehlers, D.; Mader, V.L.; Bengtsson, J.; Smith, H.G. Organic farming affects the biological control of hemipteran pests and yields in spring barley independent of landscape complexity. Landsc. Ecol. 2016, 31, 567–579. [Google Scholar] [CrossRef]
- Winqvist, C.; Bengtsson, J.; Aavik, T.; Berendse, F.; Clement, L.W.; Eggers, S.; Fischer, C.; Flohre, A.; Geiger, F.; Liira, J.; et al. Mixed effects of organic farming and landscape complexity on farmland biodiversity and biological control potential across Europe. J. Appl. Ecol. 2011, 48, 570–579. [Google Scholar] [CrossRef]
- Myers, N.; Mittermeier, R.A.; Mittermeier, C.G.; Da Fonseca, G.A.; Kent, J. Biodiversity hotspots for conservation priorities. Nature 2000, 403, 853–858. [Google Scholar] [CrossRef] [PubMed]
- Toffoli, R.; Rughetti, M. Bat activity in rice paddies: Organic and conventional farms compared to unmanaged habitat. Agric. Ecosyst. Environ. 2017, 249, 123–129. [Google Scholar] [CrossRef]
- Leelapaibul, W.; Bumrungsri, S.; Pattanawiboon, A. Diet of wrinkle-lipped free-tailed bat (Tadarida plicata Buchannan, 1800) in central Thailand: Insectivorous bats potentially act as biological pest control agents. Acta Chiropt. 2005, 7, 111–119. [Google Scholar] [CrossRef]
- Puig-Montserrat, X.; Torre, I.; Lopez-Baucells, A.; Guerrieri, E.; Monti, M.M.; Ràfols-Garcia, R.; Ferrer, X.; Gisbert, D.; Flaquer, C. Pest control service provided by bats in Mediterranean rice paddies: Linking agroecosystems structure to ecological functions. Mamm. Biol. 2015, 80, 237–245. [Google Scholar] [CrossRef]
- Srilopan, S.; Bumrungsri, S.; Jantarit, S. The wrinkle-lipped free-tailed bat (Chaerephon plicatus Buchannan, 1800) feeds mainly on brown planthoppers in rice fields of central Thailand. Acta Chiropt. 2018, 20, 207–219. [Google Scholar] [CrossRef]
- Wickramasinghe, L.P.; Harris, S.; Jones, G.; Vaughan, N. Bat activity and species richness on organic and conventional farms: Impact of agricultural intensification. J. Appl. Ecol. 2003, 40, 984–993. [Google Scholar] [CrossRef]
- Rainho, A.; Palmeirim, J.M. The importance of distance to resources in the spatial modelling of bat foraging habitat. PLoS ONE 2011, 6, e19227. [Google Scholar] [CrossRef]
- Hydro—Informatics Institute. National Hydroinformatics and Climate Data of Songkhla Lake Basin. Available online: http://tiwrm.hii.or.th/web/attachments/25basins/23-songkhla_lake.pdf (accessed on 12 January 2021).
- National Bureau of Agricultural Commodity and Food Standards. Organic Agriculture Part 4: Organic Rice. Available online: https://www.acfs.go.th/standard/download/eng/ORGANIC_RICE_part4.pdf?fbclid=IwAR3iHLemP240Kb00jUktgjsWf2wAQPPokIikuQUxJ_NFI9zBvl3f8w_5LUY (accessed on 15 May 2022).
- Rodríguez-San Pedro, A.; Chaperon, P.N.; Beltrán, C.A.; Allendes, J.L.; Ávila, F.I.; Grez, A.A. Influence of agricultural management on bat activity and species richness in vineyards of central Chile. J. Mammal. 2018, 99, 1495–1502. [Google Scholar] [CrossRef]
- ESA. Land Cover CCI Product User Guide Version 2. Tech. Rep. 2017. Available online: Maps.elie.ucl.ac.be/CCI/viewer/download/ESACCI-LC-Ph2-PUGv2_2.0.pdf (accessed on 2 August 2018).
- Hayes, J.P. Temporal variation in activity of bats and the design of echolocation–monitoring studies. J. Mammal. 1997, 78, 514–524. [Google Scholar] [CrossRef]
- Suksai, P.; Bumrungsri, S. Water bodies are a critical foraging habitat for insectivorous bats in tropical agricultural landscapes of central Thailand. Songklanakarin J. Sci. Technol. 2020, 42, 521–532. [Google Scholar]
- Cruz, J.; Sarmento, P.; Rydevik, G.; Rebelo, H.; White, P.C.L. Bats like vintage: Managing exotic eucalypt plantations for bat conservation in a Mediterranean landscape. Anim. Conserv. 2016, 19, 53–64. [Google Scholar] [CrossRef]
- Russo, D.; Jones, G. Use of foraging habitats by bats in a Mediterranean area determined by acoustic surveys: Conservation implications. Ecography 2003, 26, 197–209. [Google Scholar] [CrossRef]
- Sirami, C.; Jacobs, D.S.; Cumming, G.S. Artificial wetlands and surrounding habitats provide important foraging habitat for bats in agricultural landscapes in the Western Cape, South Africa. Biol. Conserv. 2013, 164, 30–38. [Google Scholar] [CrossRef]
- Bumrungsri, S.; Parson, D. Acoustic Identification of Insectivorous Bats in Southern Thailand; Bat Research Unit, Prince of Songkhla University Songkhla: Songkhla, Thailand, 2005. [Google Scholar]
- Denzinger, A.; Schnitzler, H.U. Bat guilds, a concept to classify the highly diverse foraging and echolocation behaviors of microchiropteran bats. Front. Physiol. 2013, 4, 164. [Google Scholar] [CrossRef]
- Furey, N.M.; Mackie, I.J.; Racey, P.A. The role of ultrasonic bat detectors in improving inventory and monitoring surveys in Vietnamese karst bat assemblages. Curr. Zool. 2009, 55, 327–341. [Google Scholar] [CrossRef]
- Schnitzler, H.-U.; Kalko, E.K.V. Echolocation by Insect-Eating Bats: We define four distinct functional groups of bats and find differences in signal structure that correlate with the typical echolocation tasks faced by each group. BioScience 2001, 51, 557–569. [Google Scholar] [CrossRef]
- Gillam, E.H. Eavesdropping by bats on the feeding buzzes of conspecifics. Can. J. Zool. 2007, 85, 795–801. [Google Scholar] [CrossRef]
- Griffin, D.R.; Webster, F.A.; Michael, C.R. The echolocation of flying insects by bats. Anim. Behav. 1960, 8, 141–154. [Google Scholar] [CrossRef]
- Triplehorn, C.A.; Johnson, N.F. Borror and De-Long’s Introduction to the Study of Insects, 6th ed.; Thompson, Brooks/Cole: Belmont, CA, USA, 2005; pp. 152–744. [Google Scholar]
- Wardhaugh, C.W. Estimation of biomass from body length and width for tropical rainforest canopy invertebrates. Aust. J. Entomol. 2013, 52, 291–298. [Google Scholar] [CrossRef]
- Lumsden, L.F.; Bennett, A.F. Scattered trees in rural landscapes: Foraging habitat for insectivorous bats in south-eastern Australia. Biol. Conserv. 2005, 122, 205–222. [Google Scholar] [CrossRef]
- Phommexay, P.; Satasook, C.; Bates, P.; Pearch, M.; Bumrungsri, S. The impact of rubber plantations on the diversity and activity of understorey insectivorous bats in southern Thailand. Biodivers. Conserv. 2011, 20, 1441–1456. [Google Scholar] [CrossRef]
- Rogers, L.E.; Hinds, W.T.; Buschbom, R.L. A general weight vs. length relationship for insects. Ann. Entomol. Soc. 1976, 69, 387–389. [Google Scholar] [CrossRef]
- Brooks, M.E.; Kristensen, K.; van Benthem, K.J.; Magnusson, A.; Berg, C.W.; Nielsen, A.; Skaug, H.J.; Maechler, M.; Bolker, B.M. GlmmTMB Balances Speed and Flexibility Among Packages for Zero-inflated Generalized Linear Mixed Modeling. R J. 2017, 9, 378–400. [Google Scholar] [CrossRef]
- Lenth, R.; Singmann, H.; Love, J.; Buerkner, P.H.M. Emmeans: Estimated Marginal Means, aka LeastSquares Means R Package. Available online: https://github.com/rvlenth/emmeans (accessed on 24 August 2021).
- Dray, S.; Dufour, A.B. The ade4 Package: Implementing the Duality Diagram for Ecologists. J. Stat. Softw. 2007, 22, 1–20. [Google Scholar] [CrossRef]
- Burnham, K.P.; Anderson, D.R. Model Selection Multimodel Inference: A Practical Information-Theoretic Approach, 2nd ed.; Springer: New York, NY, USA, 2002; pp. 49–97. [Google Scholar]
- Betts, M.G.; Forbes, G.J.; Diamond, A.W.; Taylor, P.D. Independent effects of fragmentation on forest songbirds: An organism-based approach. Ecol Appl. 2006, 16, 1076–1089. [Google Scholar] [CrossRef]
- Hartig, F. DHARMa: Residual Diagnostics for Hierarchical (Multi-Level/Mixed) Regression Models. R Package Version 0.3.2.0. Available online: https://cran.r-project.org/web/packages/DHARMa/index.html (accessed on 24 August 2021).
- Mazerolle, M.J. AICcmodavg: Model Selection and Multimodel Inference Based on (Q)AIC(c). Available online: https://cran.r-project.org/package=AICcmodavg (accessed on 24 August 2021).
- R Core Team. R: A Language and Environment for Statistical Computing; R Foundation for Statistical Computing: Vienna, Austria, 2019. [Google Scholar]
- Davy, C.M.; Russo, D.; Fenton, M.B. Use of native woodlands and traditional olive groves by foraging bats on a Mediterranean island: Consequences for conservation. J. Zool. 2007, 273, 397–405. [Google Scholar] [CrossRef]
- Lesiński, G.; Durka, A.; Rembiałkowska, E. Flight activity of serotine Eptesicus serotinus on organic and conventional farms in central Poland. Zool. Ecol. 2013, 23, 93–96. [Google Scholar] [CrossRef]
- Put, J.E.; Mitchell, G.W.; Fahrig, L. Higher bat and prey abundance at organic than conventional soybean fields. Biol. Conserv. 2018, 226, 177–185. [Google Scholar] [CrossRef]
- Chatupote, W.; Panapitukul, N. Modeling Pesticide and Nutrient Leaching in the Agroecosystems of Rataphum Watershed Area. In Proceedings of the Agrochemical Pollution of Water Resources, Hat Yai, Thailand, 16–18 February 2000. [Google Scholar]
- Charbonnier, Y.; Gaüzère, P.; van Halder, I.; Nezan, J.; Barnagaud, J.-Y.; Jactel, H.; Barbaro, L. Deciduous trees increase bat diversity at stand and landscape scales in mosaic pine plantations. Landsc. Ecol. 2016, 31, 291–300. [Google Scholar] [CrossRef]
- Heim, O.; Treitler, J.T.; Tschapka, M.; Knörnschild, M.; Jung, K. The Importance of Landscape Elements for Bat Activity and Species Richness in Agricultural Areas. PLoS ONE 2015, 10, e0134443. [Google Scholar] [CrossRef] [PubMed]
- Polyakov, A.Y.; Weller, T.J.; Tietje, W.D. Remnant trees increase bat activity and facilitate the use of vineyards by edge-space bats. Agric. Ecosyst. Environ. 2019, 281, 56–63. [Google Scholar] [CrossRef]
- Harvey, C.A.; Medina, A.; Merlo, D.S.; Vílchez, S.; Hernández, B.; Saenz, J.C.; Maes, J.M.; Casanoves, F.; Sinclair, F.L. Patterns of animal diversity in different forms of tree cover in agricultural landscapes. Ecol. Appl. 2006, 16, 1986–1999. [Google Scholar] [CrossRef]
- Medina, A.; Harvey, C.A.; Merlo, D.S.; Vílchez, S.; Hernández, B. Bat diversity and movement in an agricultural landscape in Matiguás, Nicaragua. Biotropica 2007, 39, 120–128. [Google Scholar] [CrossRef]
- Boughey, K.L.; Lake, I.R.; Haysom, K.A.; Dolman, P.M. Improving the biodiversity benefits of hedgerows: How physical characteristics and the proximity of foraging habitat affect the use of linear features by bats. Biol. Conserv. 2011, 144, 1790–1798. [Google Scholar] [CrossRef]
- Frey-Ehrenbold, A.; Bontadina, F.; Arlettaz, R.; Obrist, M.K. Landscape connectivity, habitat structure and activity of bat guilds in farmland-dominated matrices. J. Appl. Ecol. 2013, 50, 252–261. [Google Scholar] [CrossRef]
- Gorresen, P.M.; Willig, M.R.; Strauss, R.E. Multivariate analysis of scale-dependent associations between bats and landscape structure. Ecol. Appl. 2005, 15, 2126–2136. [Google Scholar] [CrossRef]
- Klingbeil, B.T.; Willig, M.R. Guild-specific responses of bats to landscape composition and configuration in fragmented Amazonian rainforest. J. Appl. Ecol. 2009, 46, 203–213. [Google Scholar] [CrossRef]
- Mendes, E.S.; Fonseca, C.; Marques, S.F.; Maia, D.; Pereira, M.J.R. Bat richness and activity in heterogeneous landscapes: Guild-specific and scale-dependent? Landsc. Ecol. 2017, 32, 295–311. [Google Scholar] [CrossRef]
- Müller, J.; Mehr, M.; Bässler, C.; Fenton, M.B.; Hothorn, T.; Pretzsch, H.; Klemmt, H.-J.; Brandl, R. Aggregative response in bats: Prey abundance versus habitat. Oecologia 2012, 169, 673–684. [Google Scholar] [CrossRef] [PubMed]
- Shapiro, J.T.; Monadjem, A.; Röder, T.; McCleery, R.A. Response of bat activity to land cover and land use in savannas is scale-, season-, and guild-specific. Biol. Conserv. 2020, 241, 108245. [Google Scholar] [CrossRef]
- Altringham, J.D. Bats from Evolution to Conservation, 2nd ed.; Oxford University Press: Oxford, UK, 2011; pp. 37–92. [Google Scholar]
- Fukui, D.; Murakami, M.; Nakano, S.; Aoi, T. Effect of emergent aquatic insects on bat foraging in a riparian forest. J. Anim. Ecol. 2006, 75, 1252–1258. [Google Scholar] [CrossRef] [PubMed]
- Lloyd, A.; Law, B.; Goldingay, R. Bat activity on riparian zones and upper slopes in Australian timber production forests and the effectiveness of riparian buffers. Biol. Conserv. 2006, 129, 207–220. [Google Scholar] [CrossRef]
- Rainho, A. Summer foraging habitats of bats in a Mediterranean region of the Iberian Peninsula. Acta Chiropt. 2007, 9, 171–181. [Google Scholar] [CrossRef]
- Lookingbill, T.R.; Elmore, A.J.; Engelhardt, K.A.M.; Churchill, J.B.; Gates, J.E.; Johnson, J.B. Influence of wetland networks on bat activity in mixed-use landscapes. Biol. Conserv. 2010, 143, 974–983. [Google Scholar] [CrossRef]
- Mullin, K.E.; Yoh, N.; Mitchell, S.L.; Basrur, S.; Seaman, D.J.I.; Bernard, H.; Struebig, M.J. Riparian reserves promote insectivorous bat activity in oil palm dominated landscapes. Front. For. Glob. Chang. 2020, 3, 73. [Google Scholar] [CrossRef]
- Katunzi, T.; Soisook, P.; Webala, P.W.; Armstrong, K.N.; Bumrungsri, S. Bat activity and species richness in different land-use types in and around Chome Nature Forest Reserve, Tanzania. Afr. J. Ecol. 2021, 59, 117–131. [Google Scholar] [CrossRef]
- Racey, P.R.; Swift, S.M.; Rydell, J.; Brodie, L. Bats and insects over two Scottish rivers with contrasting nitrate status. Anim. Conserv. 1998, 1, 195–202. [Google Scholar] [CrossRef]
- Ruadreo, N.; Voigt, C.; Bumrungsri, S. Large dietary niche overlap of sympatric open-space foraging bats revealed by carbon and nitrogen stable isotopes. Acta Chiropt. 2018, 20, 329–341. [Google Scholar] [CrossRef]
- Weterings, R.; Wardenaar, J.; Dunnz, S.; Umponstira, C. Dietary analysis of five insectivorous bat species from Kamphaeng Phet, Thailand. Raffles Bull. Zool. 2015, 63, 91–96. [Google Scholar]
- Francis, C.M. A Field Guide to the Mammals of Thailand and South-East Asia; Asia Books: Bangkok, Thailand, 2008; pp. 248–284. [Google Scholar]
- Pavey, C.R.; Burwell, C.J.; Grundwald, J.E.; Marshall, C.J.; Neuweiler, G. Dietary benefits of twilight foraging by the insectivorous bat Hipposideros speoris 1. Biotropica 2001, 33, 670–681. [Google Scholar] [CrossRef]
- Gannon, M.R.; Willig, M.R.; Fleming, T.H.; Racey, P.A. Island in the storm: Disturbance ecology of plant-visiting bats on the hurricane-prone island of Puerto Rico. In Island Bats: Evolution, Ecology, and Conservation; Fleming, T.H., Racey, P.A., Eds.; University of Chicago Press: Chicago, IL, USA, 2009; pp. 281–301. [Google Scholar]
- Pedersen, S.C.; Genoways, H.H.; Freeman, P.W. Notes on bats from Montserrat (Lesser Antilles) with comments concerning the effects of Hurricane Hugo. Carib. J. Sci. 1996, 32, 206–213. [Google Scholar]
- Gannon, M.R.; Willig, M.R. The effects of Hurricane Hugo on bats of the Luquillo Experimental Forest in Puerto Rico. Biotropica 1994, 26, 320–331. [Google Scholar] [CrossRef]
- Jones, K.E.; Barlow, K.E.; Vaughan, N.; Rodríguez-Durán, A.; Gannon, M.R. Short-term impacts of extreme environmental disturbance on the bats of Puerto Rico. Anim. Conserv. 2001, 4, 59–66. [Google Scholar] [CrossRef]
- Wiles, G.J. Current research and future management of Marianas fruit bats (Chiroptera: Pteropodidae) on Guam. Aust. Mammal. 1987, 10, 93–95. [Google Scholar] [CrossRef]
- Carroll, J.B. The conservation and wild status of the Rodrigues fruit bat, Pteropus rodricensis. Myotis 1984, 21–22, 148–154. [Google Scholar]
- Pierson, E.D.; Elmqvist, T.; Rainey, W.E.; Cox, P.A. Effects of tropical cyclonic storms on flying fox populations on the South Pacific Islands of Samoa. Conserv. Biol. 1996, 10, 438–451. [Google Scholar] [CrossRef]
- Sil-Berra, L.M.; Sánchez-Hernández, C.; Romero-Almaraz, M.L.; Reynoso, V.H. Vulnerability to natural disturbance in communities of Neotropical bats: Short-term impact of Hurricane Patricia on the Mexican Pacific Coast. For. Ecol. Manag. 2021, 479, 118596. [Google Scholar] [CrossRef]
- Knutson, T. Global Warming and Hurricanes: An Overview of Current Research Results. Available online: https://www.gfdl.noaa.gov/global-warming-and-hurricanes/ (accessed on 11 May 2022).
- Meemken, E.-M.; Qaim, M. Organic Agriculture, Food Security, and the Environment. Annu. Rev. Resour. Econ. 2018, 10, 39–63. [Google Scholar] [CrossRef]
- Bavec, M.; Bavec, F. Impact of Organic Farming on Biodiversity. In Biodiversity in Ecosystems: Linking Structure and Function; Lo, Y.-H., Blanco, J., Roy, S., Eds.; IntechOpen: London, UK, 2015. [Google Scholar] [CrossRef]


| Taxon | Foraging Guild | Total Activity | Bat Activity (Feeding Activity) | |
|---|---|---|---|---|
| Organic | Conventional | |||
| Myotis horsfieldii | Edge-space | 4037 | 2459 (228) | 1578 (105) |
| Myotis muricola | Edge-space | 938 | 508 (24) | 430 (19) |
| Scotophilus kuhlii | Open-space | 1317 | 895 (9) | 422 (4) |
| Taphozous melanopogon | Open-space | 1304 | 555 (7) | 749 (16) |
| Rhinolophus lepidus | Narrow-space | 1172 | 661 (18) | 511 (15) |
| Rhinolophus affinis | Narrow-space | 56 | 32 (1) | 24 |
| Rhinolophus stheno | Narrow-space | 334 | 214 (7) | 120 (5) |
| Rhinolophus acuminatus | Narrow-space | 10 | 5 | 5 |
| Hipposideros larvatus | Edge-space | 753 | 350 (1) | 403 |
| Hipposideros bicolor | Narrow-space | 8 | 1 | 7 |
| Hipposideros lekaguli | Narrow-space | 26 | 8 | 18 |
| Hipposideros galeritus | Narrow-space | 9 | 9 | |
| Bat unknown | - | 11 | 8 | 3 |
| Order | Total Abundance | Insect Abundance (Insect Biomass) | |
|---|---|---|---|
| Organic | Conventional | ||
| Coleoptera | 4961 (4141.10 mg) | 2095 (1892.59) | 2866 (2248.51) |
| Lepidoptera | 1031 (4783.78 mg) | 598 (2646.06) | 433 (2137.72) |
| Hemiptera | 1737 (1651.37 mg) | 864 (875.24) | 873 (776.13) |
| Diptera | 5015 (4564.60 mg) | 2620 (2523.09) | 2395 (2041.51) |
| Hymenoptera | 123 (136.67 mg) | 36 (41.06) | 87 (95.61) |
| Thysanoptera | 3 (3.15 mg) | 3 (3.15) | 0 (0) |
| Orthoptera | 1 (43.56 mg) | 1 (43.56) | 0 (0) |
| Blattodea | 1 (20.50 mg) | 1 (20.50) | 0 (0) |
| Response Variable | Independent Variable | χ2 | df | p-Value |
|---|---|---|---|---|
| Bat species richness | Farming type (organic vs. conventional) | 1.224 | 1 | n.s. |
| Landscape complexity | 5.809 | 2 | n.s. | |
| Interaction (farming type × landscape complexity) | 0.235 | 2 | n.s. | |
| Total bat activity | Farming type (organic vs. conventional) | 0.729 | 1 | n.s. |
| Landscape complexity | 1.787 | 2 | n.s. | |
| Interaction (farming type × landscape complexity) | 8.168 | 2 | * | |
| Feeding buzzes | Farming type (organic vs. conventional) | 0.960 | 1 | n.s. |
| Landscape complexity | 0.601 | 2 | n.s. | |
| Interaction (farming type × landscape complexity) | 7.828 | 2 | * | |
| Buzz ratio | Farming type (organic vs. conventional) | 4.008 | 1 | * |
| Landscape complexity | 2.155 | 2 | n.s. | |
| Interaction (farming type × landscape complexity) | 0.540 | 2 | n.s. | |
| Total insect abundance | Farming type (organic vs. conventional) | 0.425 | 1 | n.s. |
| Landscape complexity | 1.753 | 2 | n.s. | |
| Interaction (farming type × landscape complexity) | 2.517 | 2 | n.s. | |
| Total insect biomass | Farming type (organic vs. conventional) | 0.717 | 1 | n.s. |
| Landscape complexity | 2.111 | 2 | n.s. | |
| Interaction (farming type × landscape complexity) | 1.561 | 2 | n.s. |
| Response Variable | Independent Variable | Estimate (±SE) | z-Value | p-Value |
|---|---|---|---|---|
| Bat species richness | Percentage of agricultural area within 2 km radius | −0.02 (±0.01) | −2.19 | * |
| Total bat activity | Percentage of forest and seminatural area within 1 km radius | 0.09 (±0.03) | 3.07 | ** |
| Tropical storm disturbance | 1.65 (±0.39) | 4.23 | *** | |
| Feeding buzzes | Distance to nearest limestone outcrop | −0.14 (±0.04) | −3.66 | *** |
| Tropical storm disturbance | 1.07 (±0.37) | 2.86 | ** | |
| Buzz ratio | Distance to nearest limestone outcrop | −0.002 (±0.001) | −2.02 | * |
| Edge-space foragers | Percentage of forest and seminatural area within 1 km radius | 0.13 (±0.04) | 2.99 | ** |
| Tropical storm disturbance | 1.93 (±0.56) | 3.46 | *** | |
| M. horsfieldii activity | Percentage of agricultural area within 2 km radius | −0.16 (±0.06) | −2.72 | ** |
| Tropical storm disturbance | 1.96 (±0.80) | 2.44 | * | |
| M. muricola activity | Distance to nearest water body | −0.16 (±0.05) | −2.93 | ** |
| H. larvatus activity | Percentage of forest and seminatural area within 1 km radius | 0.17 (±0.05) | 3.43 | *** |
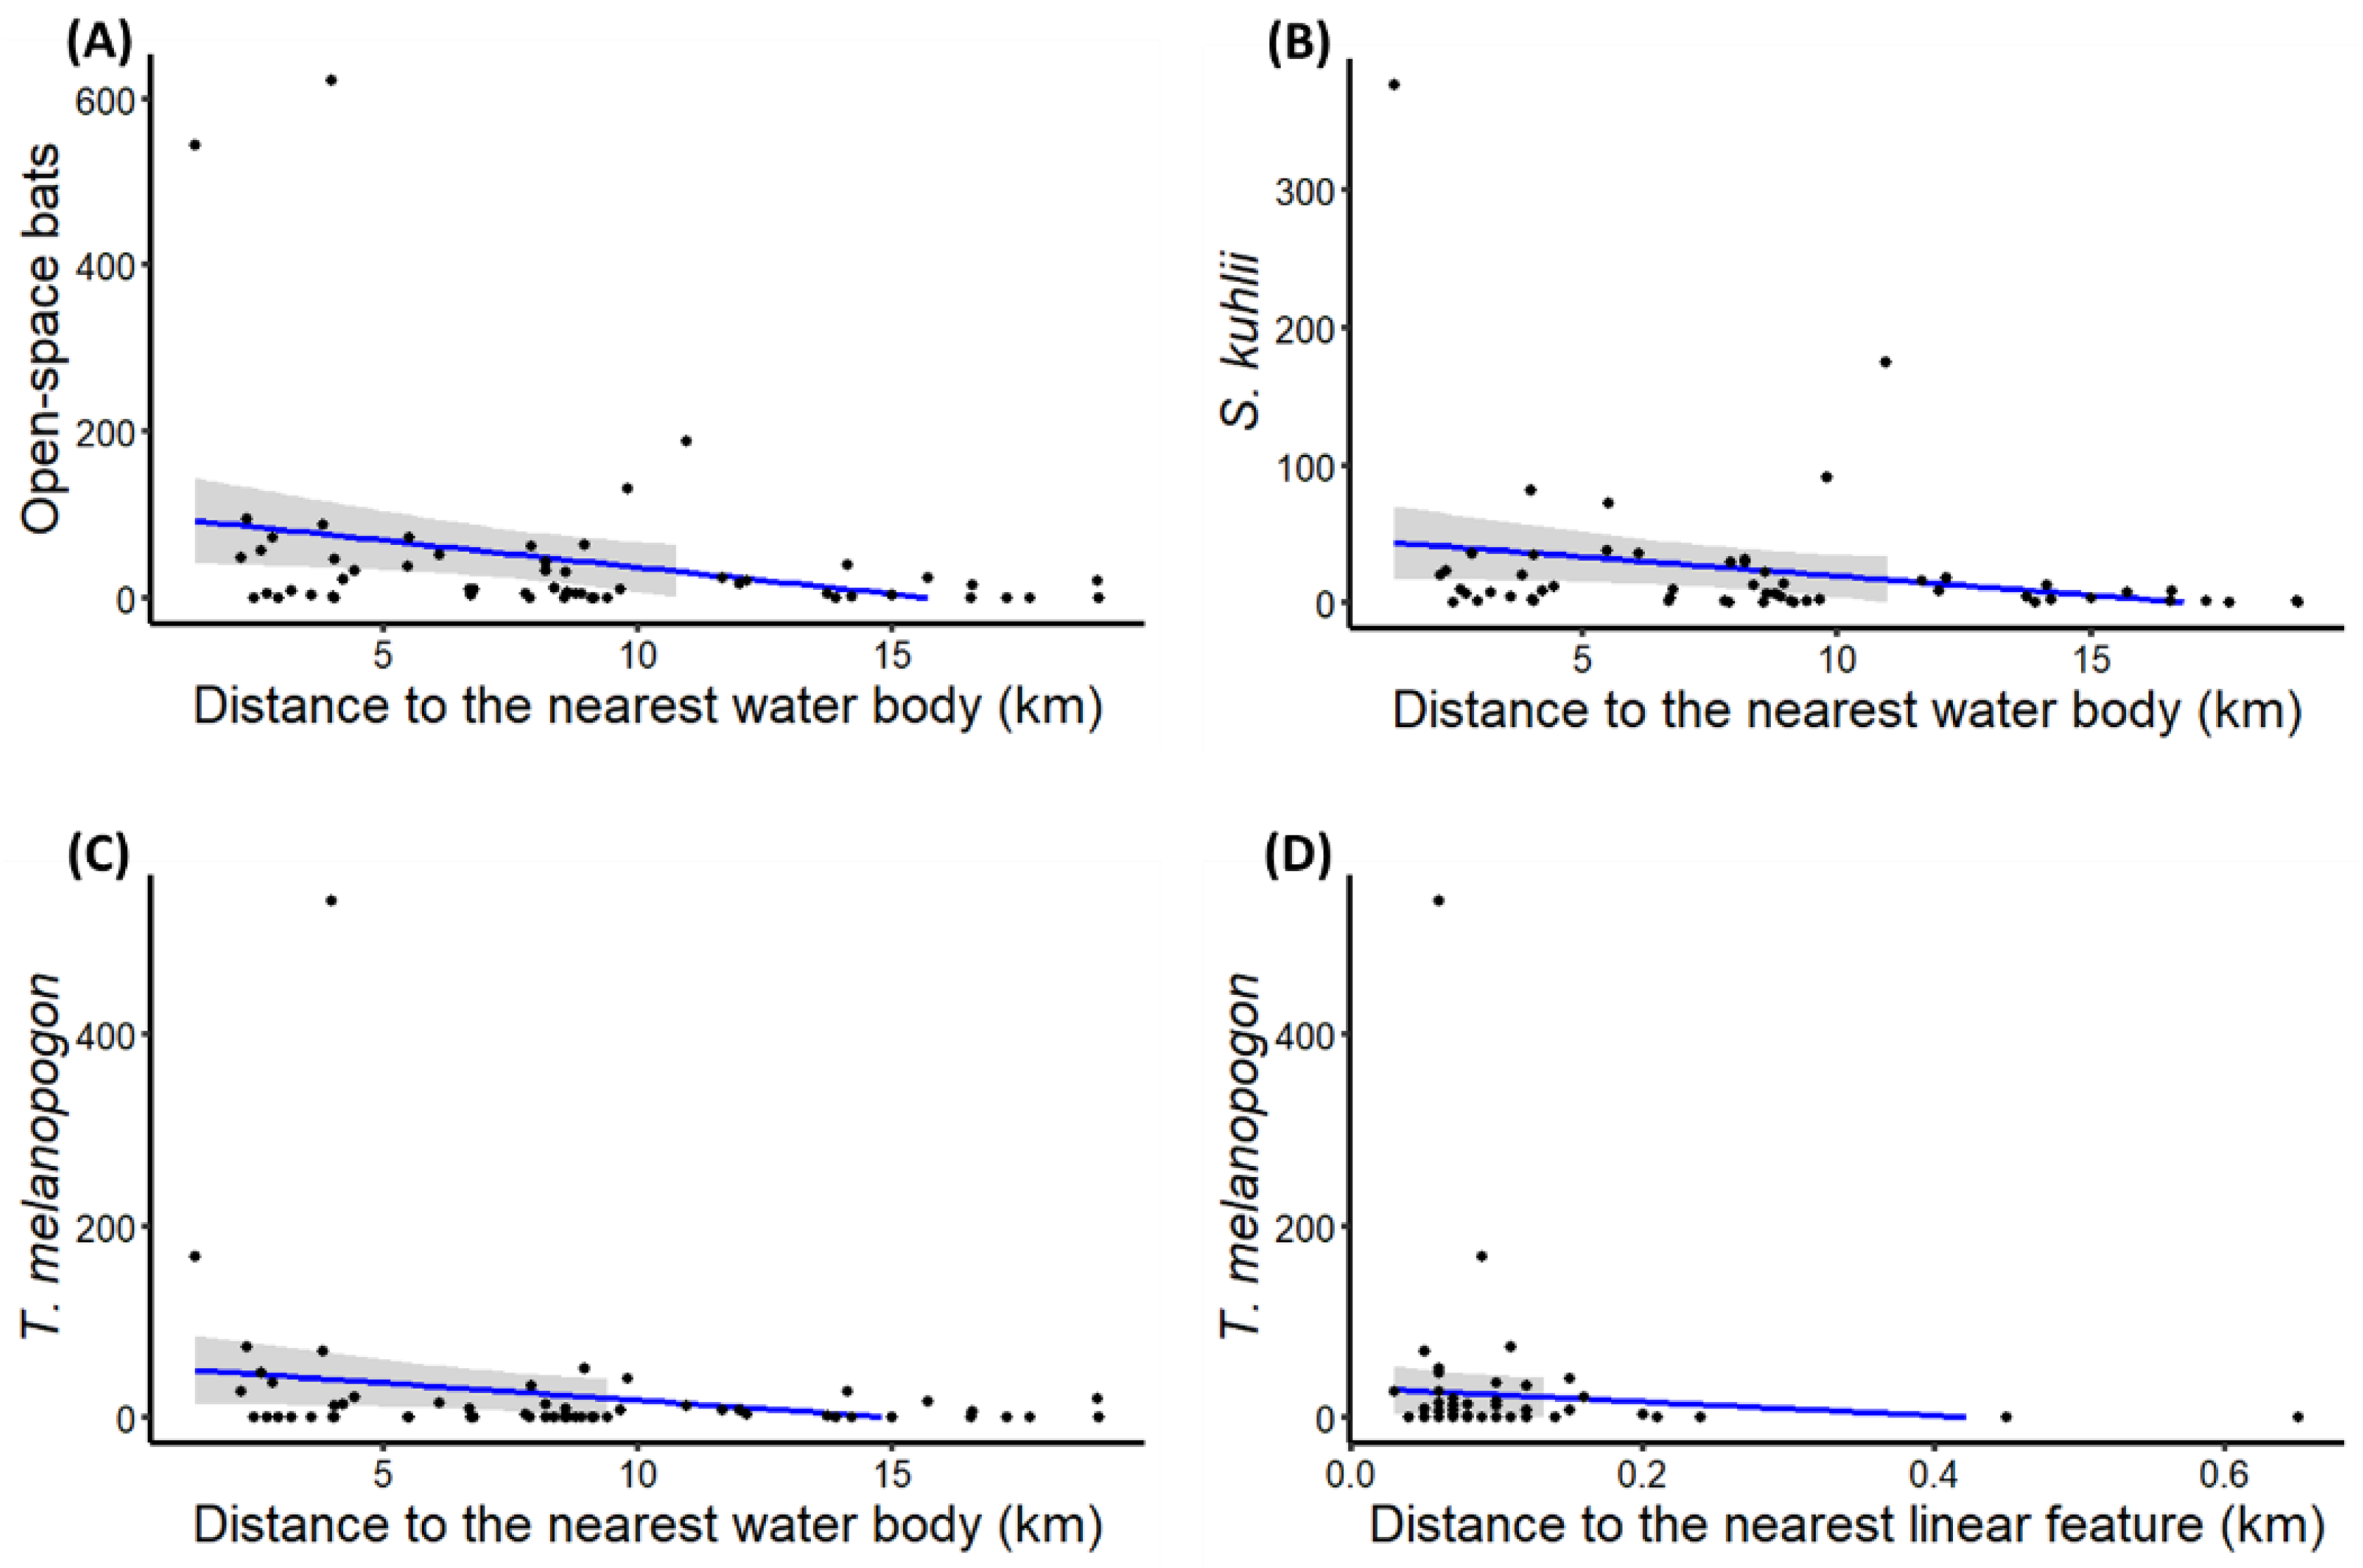
| Open-space foragers | Distance to nearest water body | −0.14 (±0.05) | −2.86 | ** |
| S. kuhlii activity | Distance to nearest water body | −0.15 (±0.05) | −2.97 | ** |
| T. melanopogon activity | Distance to nearest water body | −0.14 (±0.06) | −2.29 | * |
| Distance to linear feature | −12.49 (±5.64) | −2.22 | * | |
| Narrow-space foragers | Percentage of forest and seminatural area within 1 km radius | 0.13 (±0.04) | 3.17 | ** |
| Rhinolophus spp. activity | Percentage of forest and seminatural area within 1 km radius | 0.13 (±0.04) | 3.03 | ** |
Publisher’s Note: MDPI stays neutral with regard to jurisdictional claims in published maps and institutional affiliations. |
© 2022 by the authors. Licensee MDPI, Basel, Switzerland. This article is an open access article distributed under the terms and conditions of the Creative Commons Attribution (CC BY) license (https://creativecommons.org/licenses/by/4.0/).
Share and Cite
Boonchuay, P.; Bumrungsri, S. Bat Activity in Organic Rice Fields Is Higher Than in Conventional Fields in Landscapes of Intermediate Complexity. Diversity 2022, 14, 444. https://doi.org/10.3390/d14060444
Boonchuay P, Bumrungsri S. Bat Activity in Organic Rice Fields Is Higher Than in Conventional Fields in Landscapes of Intermediate Complexity. Diversity. 2022; 14(6):444. https://doi.org/10.3390/d14060444
Chicago/Turabian StyleBoonchuay, Ponsarut, and Sara Bumrungsri. 2022. "Bat Activity in Organic Rice Fields Is Higher Than in Conventional Fields in Landscapes of Intermediate Complexity" Diversity 14, no. 6: 444. https://doi.org/10.3390/d14060444
APA StyleBoonchuay, P., & Bumrungsri, S. (2022). Bat Activity in Organic Rice Fields Is Higher Than in Conventional Fields in Landscapes of Intermediate Complexity. Diversity, 14(6), 444. https://doi.org/10.3390/d14060444