Article

Co-Evaluation of Plant Leaf Nutrient Concentrations and Resorption in Response to Fertilization under Different Nutrient-Limited Conditions

1
Key Laboratory of Vegetation Restoration and Management of Degraded Ecosystems, South China Botanical Garden, Chinese Academy of Sciences, Guangzhou 510650, China
2
Southern Marine Science and Engineering Guangdong Laboratory (Guangzhou), Guangzhou 510301, China
*
Authors to whom correspondence should be addressed.
These authors contributed equally to this work.
Diversity 2022, 14(5), 385; https://doi.org/10.3390/d14050385
Submission received: 25 February 2022 / Revised: 28 April 2022 / Accepted: 8 May 2022 / Published: 12 May 2022

Abstract

:
Plant leaf nutrient concentrations and resorption are sensitive to fertilization, yet their co-responses under different nutrient-limited conditions have not been well studied. We conducted a meta-analysis from a global dataset of 43 reports, including 130 observations of studies with plant leaf nitrogen (N) or phosphorus (P) concentrations and nitrogen resorption efficiency (NRE) or phosphorus resorption efficiency (PRE), in response to fertilization under different nutrient-limited conditions divided by the thresholds of leaf N:P ratio values of 10 and 20. The results showed that N fertilization generally increased leaf N concentration and decreased NRE, with greater magnitudes under N-limited conditions. P fertilization also generally increased leaf P concentration and decreased PRE, with greater magnitudes under P-limited conditions. N fertilization decreased leaf P concentration and increased PRE only under the N-limited condition. Under the P-limited or N and P co-limited conditions, however, N fertilization increased leaf P concentration and did not change PRE. Moreover, P fertilization did not change leaf N concentration under all nutrient-limited conditions but significantly increased NRE under the N-limited or N and P co-limited conditions. These findings suggest that plants cope with fertilization-induced N limitation vs. P limitation at the leaf level with different nutrient-use strategies.

1. Introduction

Leaf nutrient concentration and resorption play an important role in determining plant nutrient-use strategies [1]. High leaf nutrient concentration and low leaf nutrient resorption generally reflect a “resource spending” nutrient use strategy for plants to quickly grow and develop [2]. However, low leaf nutrient concentration and high leaf nutrient resorption usually reflect a “conservative consumption” nutrient use strategy for plant survival and reproduction [3]. Leaf nutrient concentration and stoichiometry also reflect plant nutrient status and the strength of nutrient limitation in plants [4,5]. Moreover, leaf nutrient resorption is a fundamental process through which perennial plants withdraw nutrients from leaves before abscission, which is important for plants to improve nutrient use efficiency and reduce the dependence on external nutrient supply [6]. Nutrient resorption also strongly influences ecosystem nutrient cycling by affecting litter quality and thus litter decomposition rates [7,8]. Therefore, a better study of combined leaf nutrient concentration and nutrient resorption efficiency (NuRE, percentage of nutrient recovered from senescing leaves) is vital for the accuracy of terrestrial biogeochemical models in predicting plant productivity [8].
Nutrient limitation to plant growth is widespread in terrestrial ecosystems, and nitrogen (N) and phosphorus (P) are the most common limiting elements, both individually and in combination [9]. While many studies have concentrated on understanding the nutritional controls of leaf nutrient concentrations and resorption, most focused on leaf N and P concentrations, nitrogen resorption efficiency (NRE) and phosphorus resorption efficiency (PRE) [10,11,12]. Overall, the leaf nutrient concentrations enhanced while NuREs declined with the respective nutrient fertilization on a global scale [13]. Fertilization with N alone or P alone usually breaks the balance between N and P in the soil, causing the shift of relative nutrient limitation. However, the responses of leaf P concentration and PRE to N fertilization or the responses of leaf N concentration and NRE to P fertilization were highly variable [13], showing negative [2], neutral [3,14,15] and positive changes [5,16]. These contrasting responses have previously tried to be attributed to plant growth types, ecosystem types, climate factors, soil nutrient status and fertilization measures [16]. Plants growing under different nutrient limitations usually adopt different nutrient use strategies, with lower leaf nutrient concentration and higher NuRE in infertile than in fertile conditions. Plant nutrient regimes (such as N-limited, N and P co-limited and P-limited conditions) across the world may also significantly influence the response pattern of leaf nutrient concentration and resorption to fertilization, yet this hypothesis has not been well studied.
Here, we explored the combined responses of plant leaf nutrient (N and P) concentrations and NuREs (NRE and PRE) to fertilization by collecting published data from global nutrient (N, P or both) fertilization experiments conducted in field environments, including 130 observations of 43 studies (Figure 1). The thresholds of leaf N:P ratios (for example, 10:1 versus 20:1) have been widely used to indicate N or P limitation indirectly, and N and P co-limitation when 10 < N:P < 20 [9]. This will provide an opportunity for us to evaluate how different nutrient-limited conditions regulate the responses of leaf nutrient concentration and NuRE to fertilization on a global scale. We expected that the responses of leaf nutrient concentration and NuRE to fertilization varied under different nutrient-limited conditions divided by the thresholds of leaf N:P ratios. Specifically, we hypothesized that: (1) N fertilization enhanced leaf N concentration and reduced NRE greater than under N-limited conditions, while P fertilization enhanced leaf P concentration and reduced PRE greater than under P-limited conditions; (2) N fertilization reduced leaf P concentration and enhanced PRE greater than under P-limited conditions, while P fertilization reduced leaf N concentration and enhanced NRE greater than under N-limited conditions; (3) N and P co-fertilization would enhance both leaf nutrient concentrations and reduce NuRE, with greater magnitudes than for leaf N concentration and NRE under N-limited conditions as well as for leaf P concentration and PRE under P-limited condition.

2. Materials and Methods

We searched for published papers reporting the impacts of fertilization on the leaf NRE and PRE, as well as N and P concentrations in green and senesced leaves, using Web of Science and Google Scholar. The searches included combinations of the terms ‘nitrogen fertilization’, ‘nitrogen addition’, ‘nitrogen deposition’, ‘nitrogen enrichment’, ‘phosphorus fertilization’, ‘phosphorus addition’, ‘phosphorus deposition’, ‘phosphorus enrichment’, and ‘nutrient resorption efficiency’, ‘nitrogen resorption efficiency’, ‘phosphorus resorption efficiency’, ‘nitrogen or phosphorus concentrations in green and senesced leaves’. All the original data were extracted from tables and figures in the published papers using GETDATA (http://getdata-graph-digitizer.com/ (accessed on 15 March 2021)).
All published results were systematically reviewed before September 2021. We included studies with N or P fertilization and the combination of N and P fertilization. Only the data including both leaf nutrient concentrations and NuREs from field experiments were included. If the target variables from the same field observation experiment were published in different journal articles, we only used the average values for the analysis. Our data covered the terrestrial ecosystem types of forests, grasslands, wetlands and deserts. We also collected plant growth type, the fertilization source and rates, location (latitude (°) and longitude (°)), climatic factors (i.e., mean annual temperature (MAT, °C) and mean annual precipitation (MAP, mm)) and climate zone (see Supplementary Materials). The threshold of leaf N:P ratios (for example, 10:1 versus 20:1) has been widely used to indicate N or P limitation indirectly. Hence, we further divided the leaf N:P ratio values of 10–20 as the N and P co-limited condition, N:P < 10 as the N-limited condition, and N:P > 20 as the P-limited condition, respectively. The final data set was drawn from 43 unique studies [3,17,18,19,20,21,22,23,24,25,26,27,28,29,30,31,32,33,34,35,36,37,38,39,40,41,42,43,44,45,46,47,48,49,50,51,52,53,54,55,56,57,58] representing 130 observations (Figure 1).
Considering the leaf mass loss during leaf senesces, we corrected the senesced-leaf nutrient concentrations via the mass loss correction factor (MLCF) to compensate for the underestimation of NuRE. In this study, NuRE was recalculated with the following Equations:
N u s e n e s c e d = N u s e n e s c e d   ×   MLCF
NuRE = N u g r e e n N u s e n e s c e d N u g r e e n   ×   100 %
where N u g r e e n and N u s e n e s c e d are nutrient concentrations in green and senesced leaves recalculated with MLCF. MLCF here is a global average value, 0.784 for deciduous plants, 0.78 for evergreen angiosperms, 0.745 for conifers, 0.713 for graminoids and 0.64 for forbs [8].
To examine the effects of fertilization on leaf nutrient concentration and NuRE, we calculated response ratios of each observation by:
RR = ln   ( X e / X c ) = ln ( X e )     ln ( X c )
where RR is the ratio of the mean value of the chosen variable (leaf nutrient concentrations or NuREs) in the treatment group (Xe) to that in the control group (Xc), an index of the effect of the experimental treatment on the target variable.
We used sample size and standard deviations to weigh the RR (w) [59,60], i.e.,
w = 1 v
where,
v = S e 2 n e X e 2   +   S c 2 n c X C 2
where Se and Sc are the standard deviations and ne and nc are the sample sizes for the experimental treatment and the control groups, respectively.
In this meta-analysis, we calculated a weighted response ratio (RR++) from individuals by giving greater weight to studies. The weighted mean log response ratio (RR++) is calculated by:
RR + + = i = 1 m ( R R i × w i ) i = 1 m ( w i )
where i = 1, 2, 3, …, m; with the standard error as:
s ( RR + + ) = 1 i = 1 m w i
The 95% confidence interval for the log response ratio is
95% CI = RR++ ± 1.96 × s(RR++)
The meta-analysis was conducted using “metacont” and “forest” functions in the R package “meta” (https://cran.r-project.org/web/packages/meta/index.html (accessed on 20 February 2022)). Because of the non-Gaussian distribution of the effect sizes, we used nonparametric approaches to test the hypothesis that the mean effect size is not equal to zero (that is, loge(1/1)). We bootstrapped 95% confidence intervals by sampling from the distribution of response ratios 10,000 times with replacements and taking the 2.5th and 97.5th quantiles of the bootstrapped distribution. The fertilization effect was considered to be significant if the 95% confidence interval (CI) of RR++ did not overlap with zero [61]. To quantify the importance of different predictors in determining the response of leaf nutrient concentrations and NuRE to fertilization, we also used the machine learning technique ‘random forests’. We generated 10,000 regression ‘trees’ each recursively portioning the observation into groups, using the “gbm” function in the R package “gbm” (https://cran.r-project.org/web/packages/gbm/index.html (accessed on 20 April 2022)). After the analyses, among the potential influencing factors, including categorical factors (ecosystem type, plant growth type, fertilization types, climate zone and different nutrient-limited conditions) and continuous factors (experimental duration, fertilization application rate, MAT and MAP), we found that the most important influencing factor was the plant nutrient-limited condition (see Figures S3 and S4). Therefore, in this study, we focused on exploring how leaf N or P concentrations and NRE or PRE responded to fertilization under different nutrient-limited conditions. The mean RR++s were then compared under different nutrient-limited conditions using an approach analogous to one-way weighted ANOVA.
All statistical analyses were performed using the R package 4.1.3 software. Packages of ggplot2, meta, maps, mapdata, gbm and svglite were used.

3. Results

3.1. Effects of N Fertilization on Leaf Nutrient Concentrations and Resorption

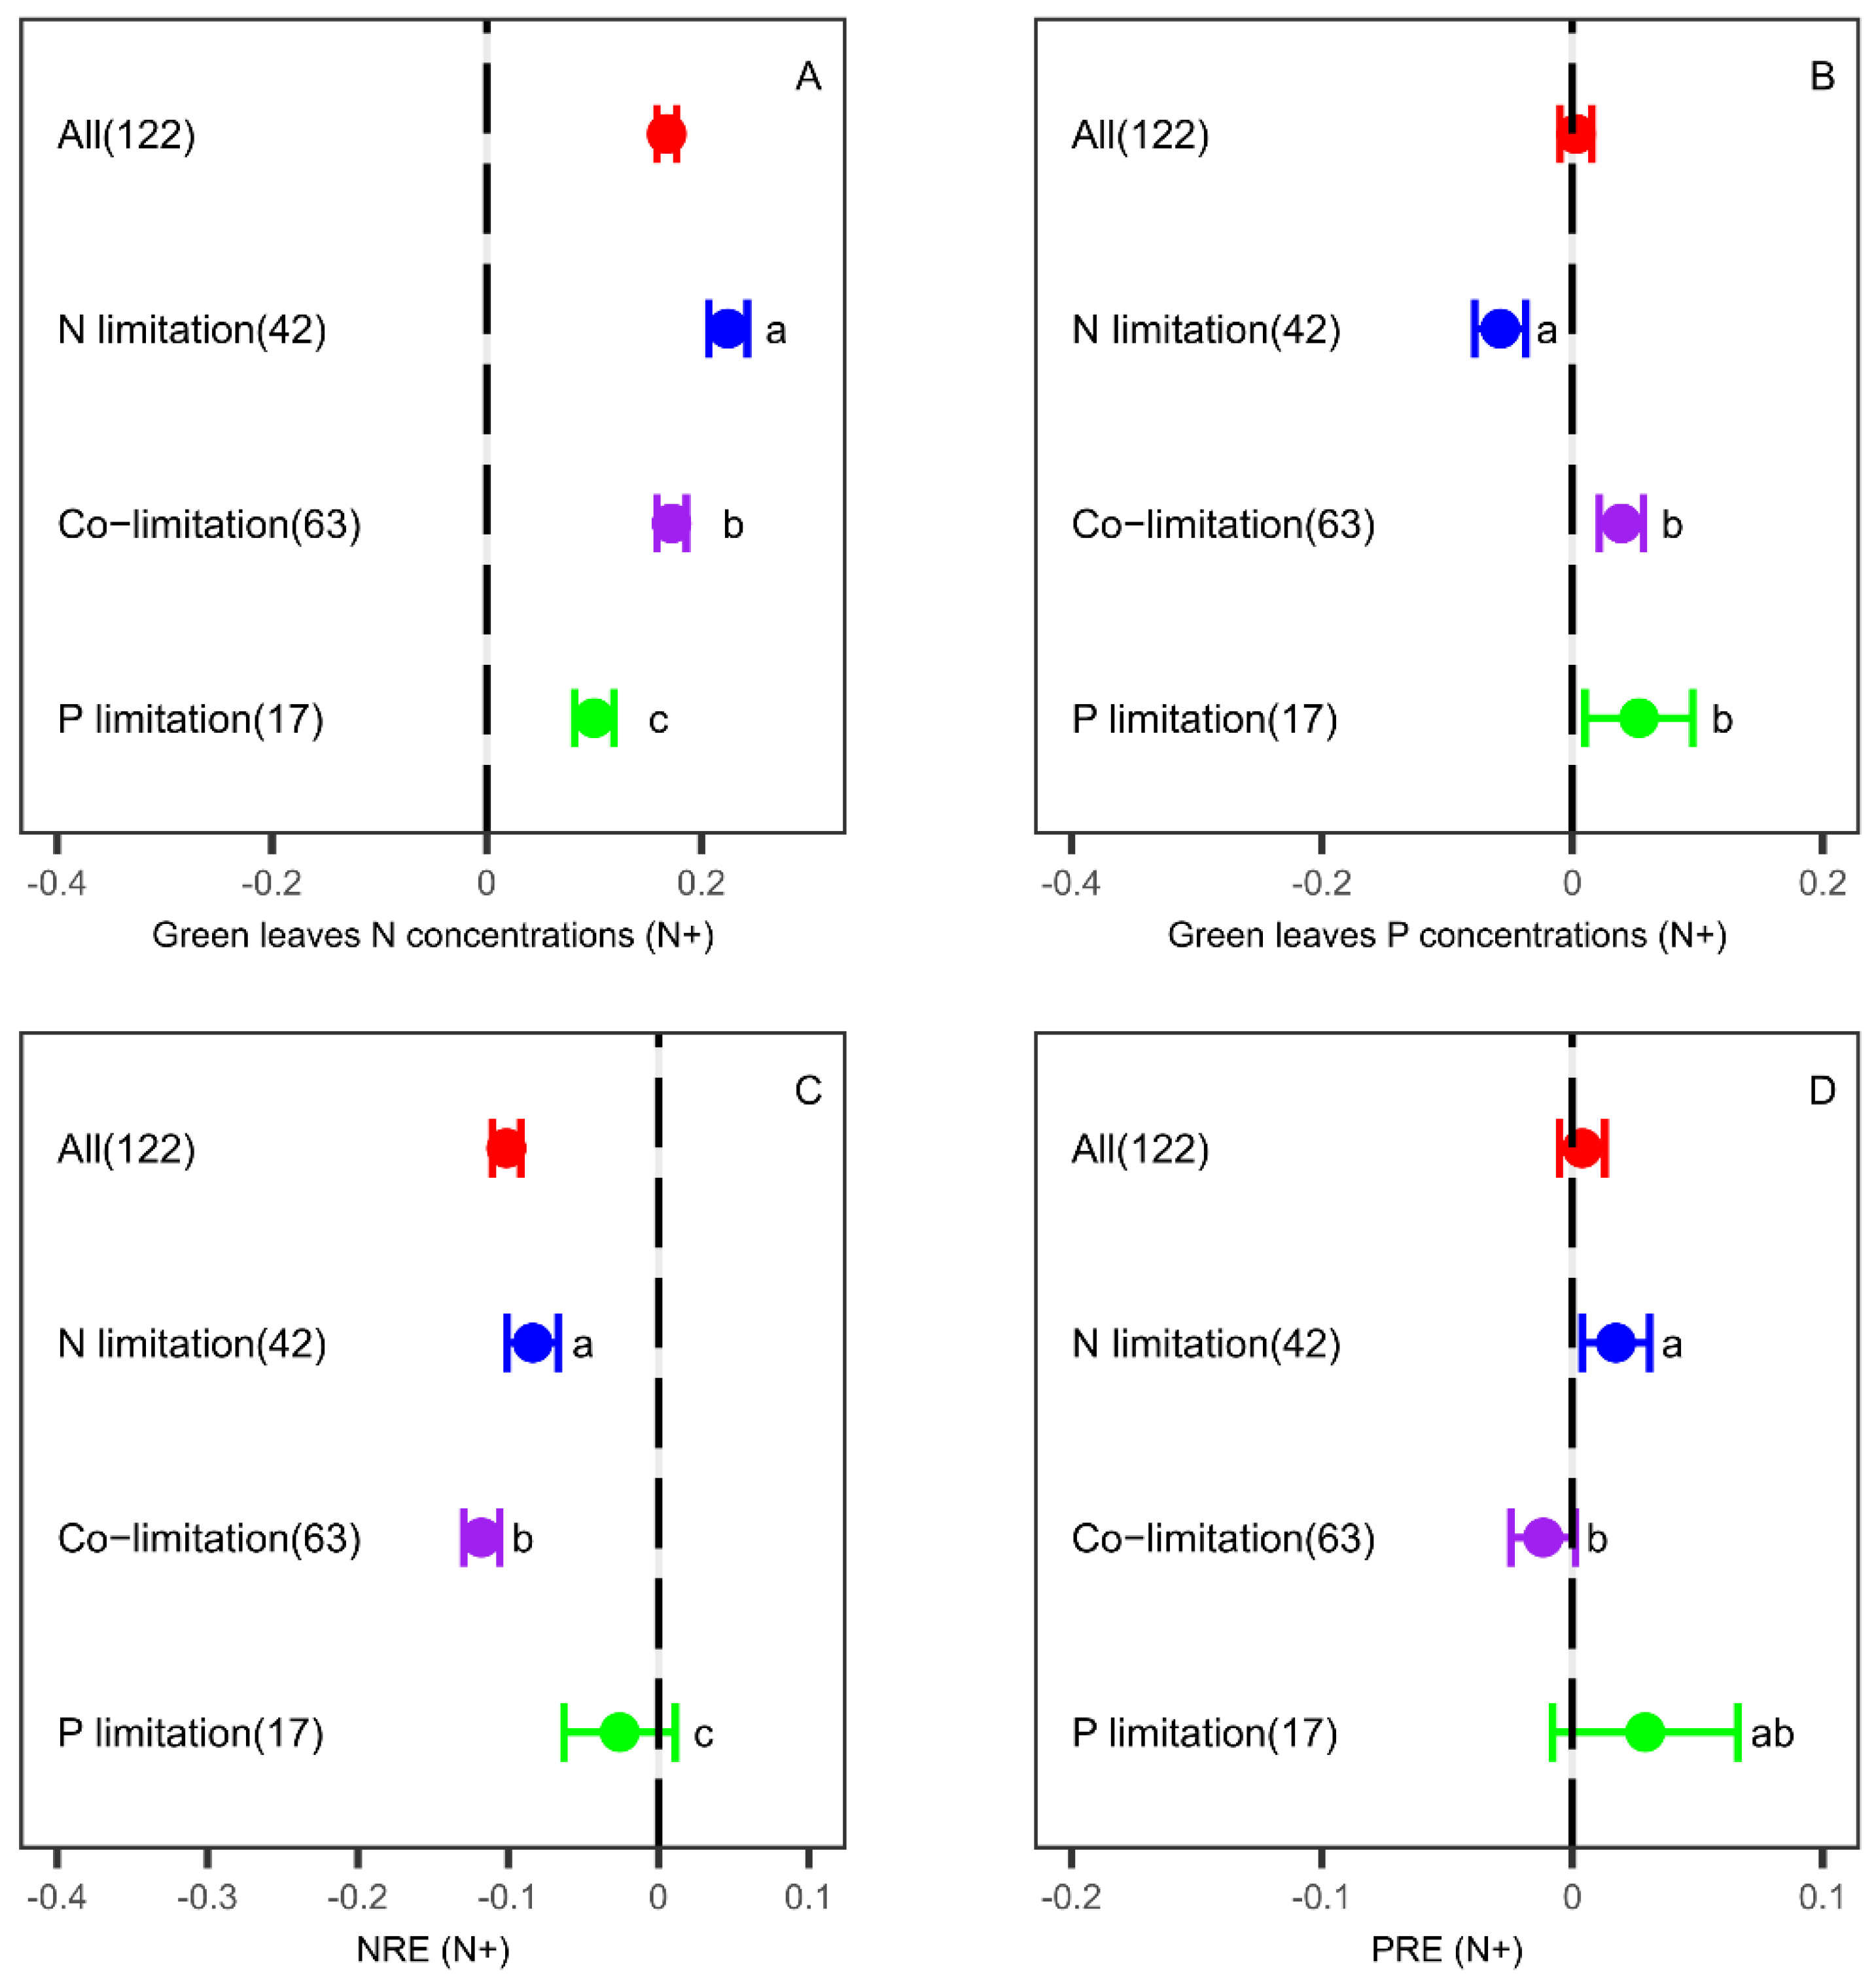
N fertilization significantly increased leaf N concentration in general, with a greater increase under N-limited than P-limited and N and P co-limited conditions (Figure 2A). N fertilization increased leaf P concentration under P limitation and N and P co-limitation but decreased P concentration under N limitation (Figure 2B). N fertilization significantly decreased NRE under N-limited and N and P co-limitation but not under P limitation (Figure 2C). N fertilization did not have a significant effect on PRE under P limitation and N and P co-limitation but significantly increased PRE under N limitation (Figure 2D).

3.2. Effects of P Fertilization on Leaf Nutrient Concentrations and Resorption

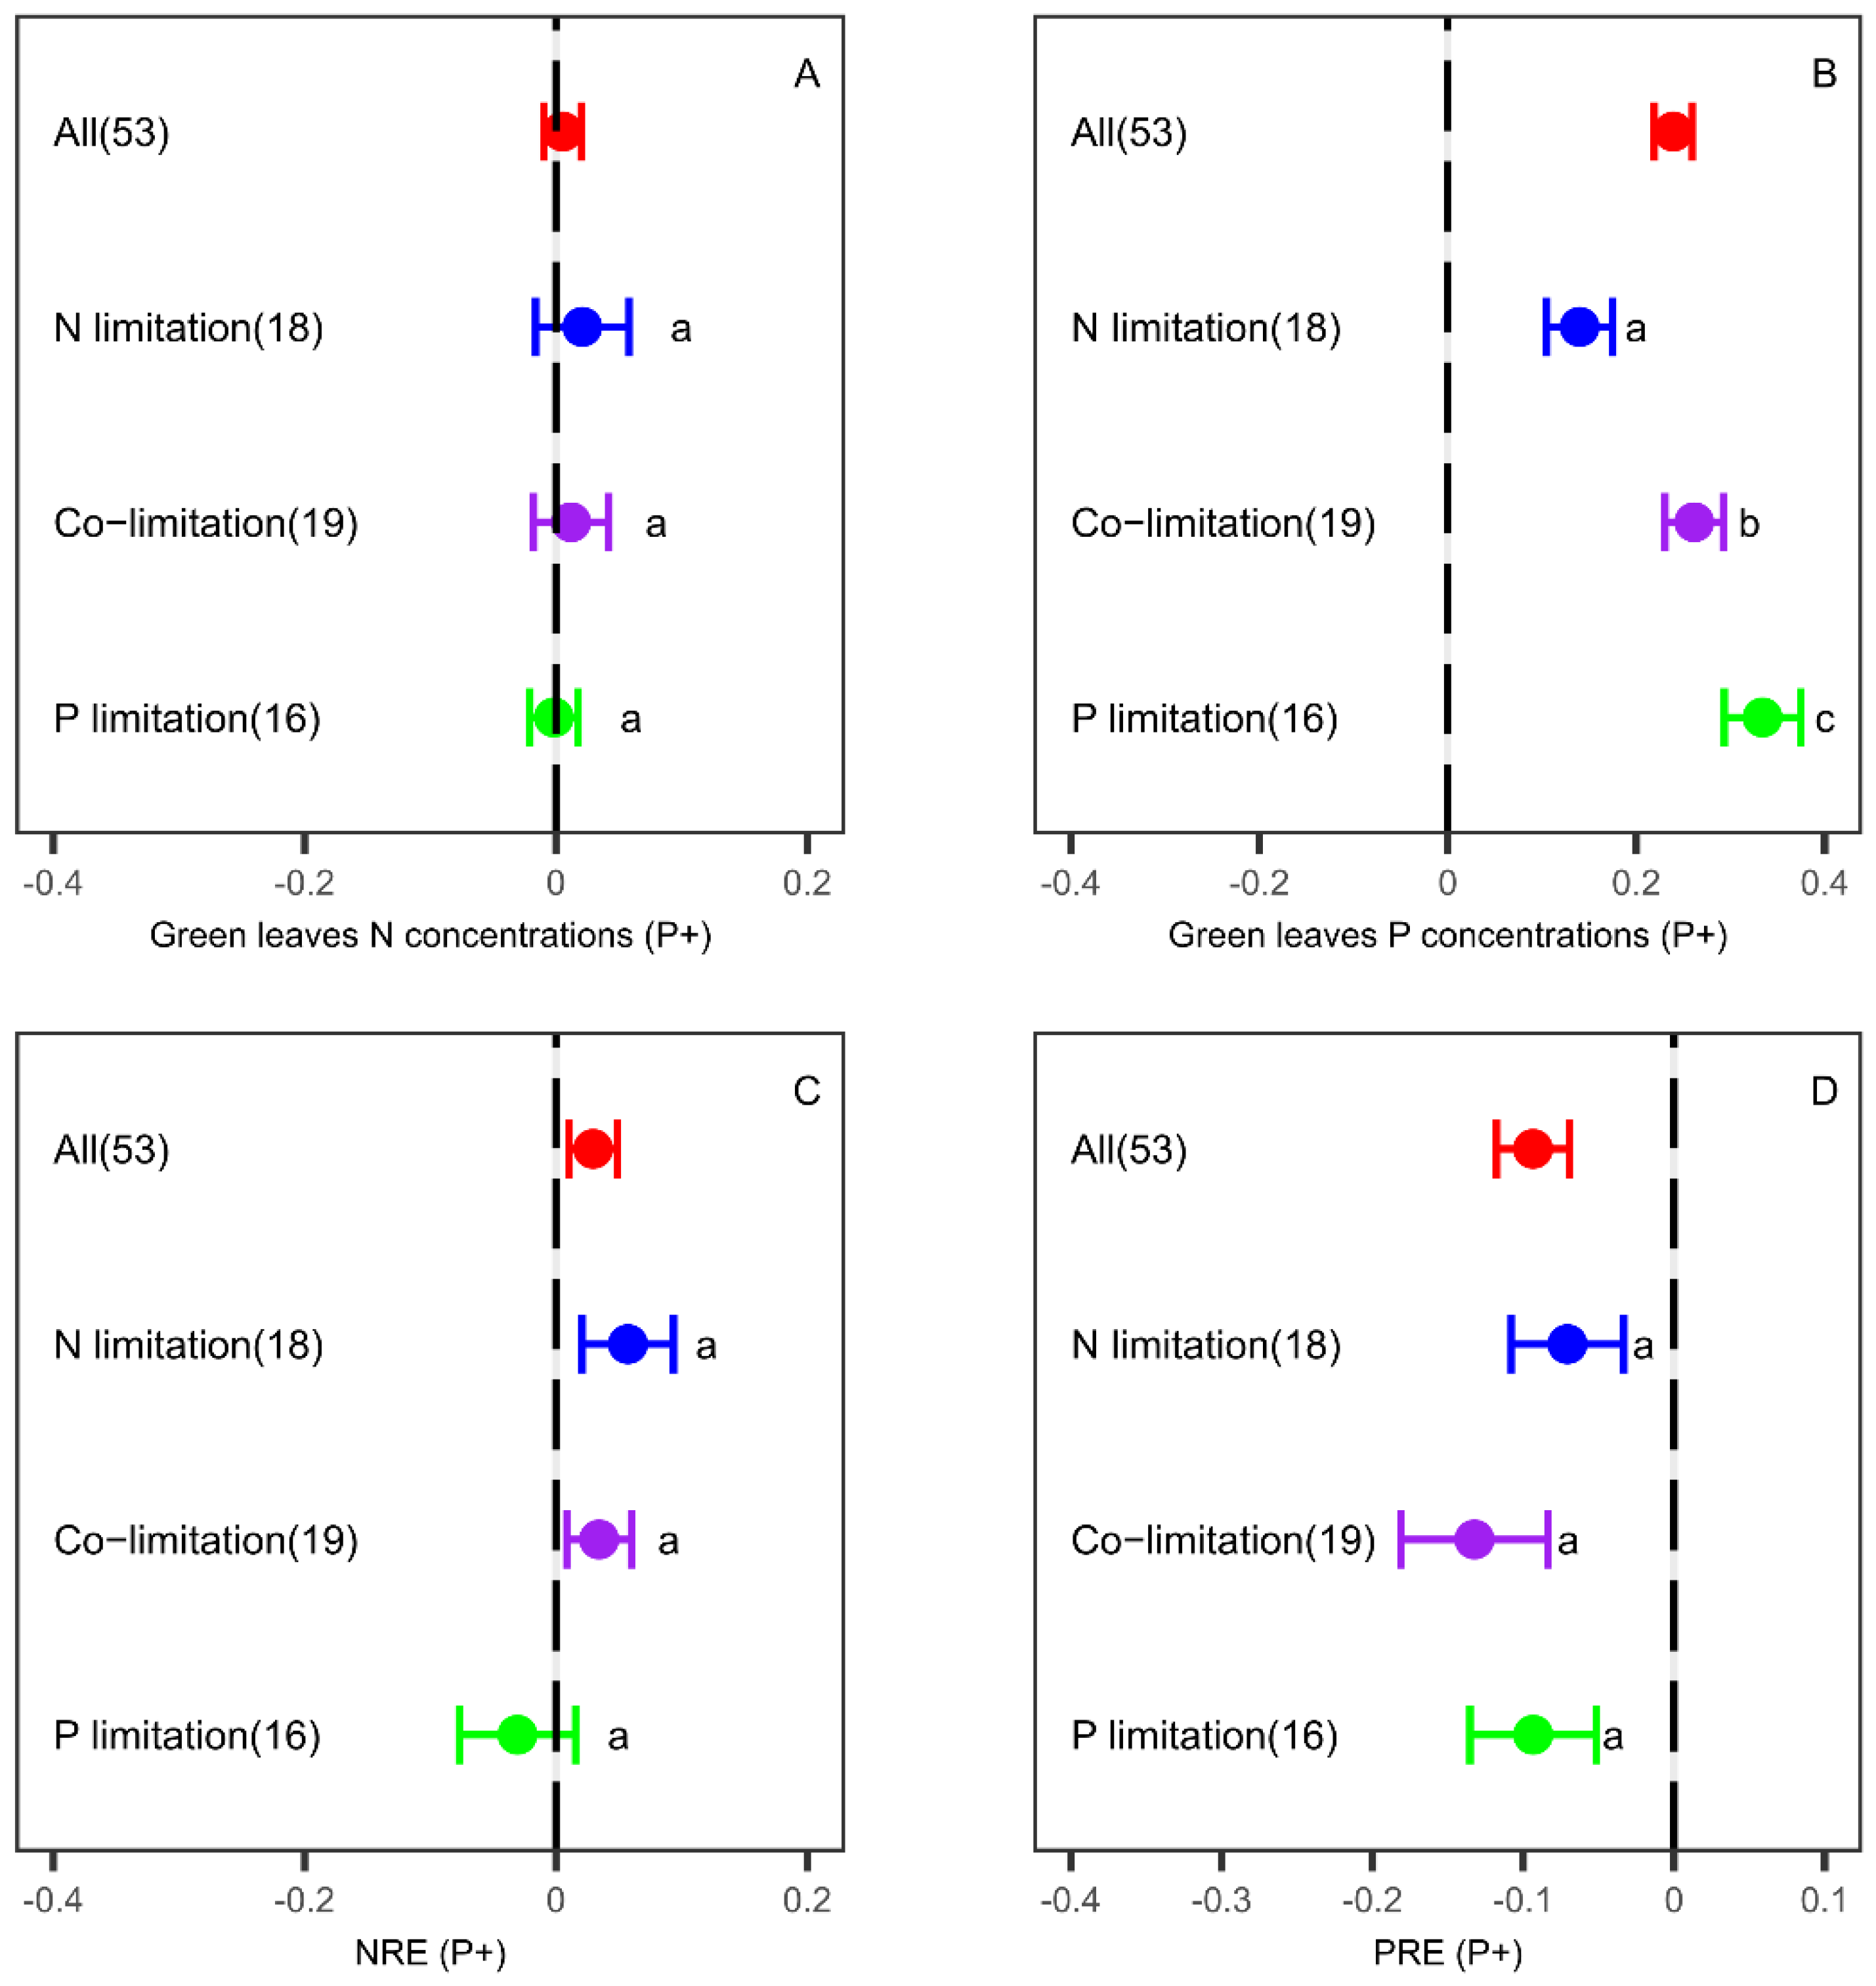
P fertilization did not change leaf N concentration but increased leaf P concentration with a greater increase under P-limited than N-limited and co-limited conditions (Figure 3A,B). P fertilization significantly increased NRE in general, under N-limited and N and P co-limited conditions (Figure 3C). P fertilization decreased PRE significantly under all conditions (Figure 3D).

3.3. Effects of N and P Co-Fertilization on Leaf Nutrient Concentrations and Resorption

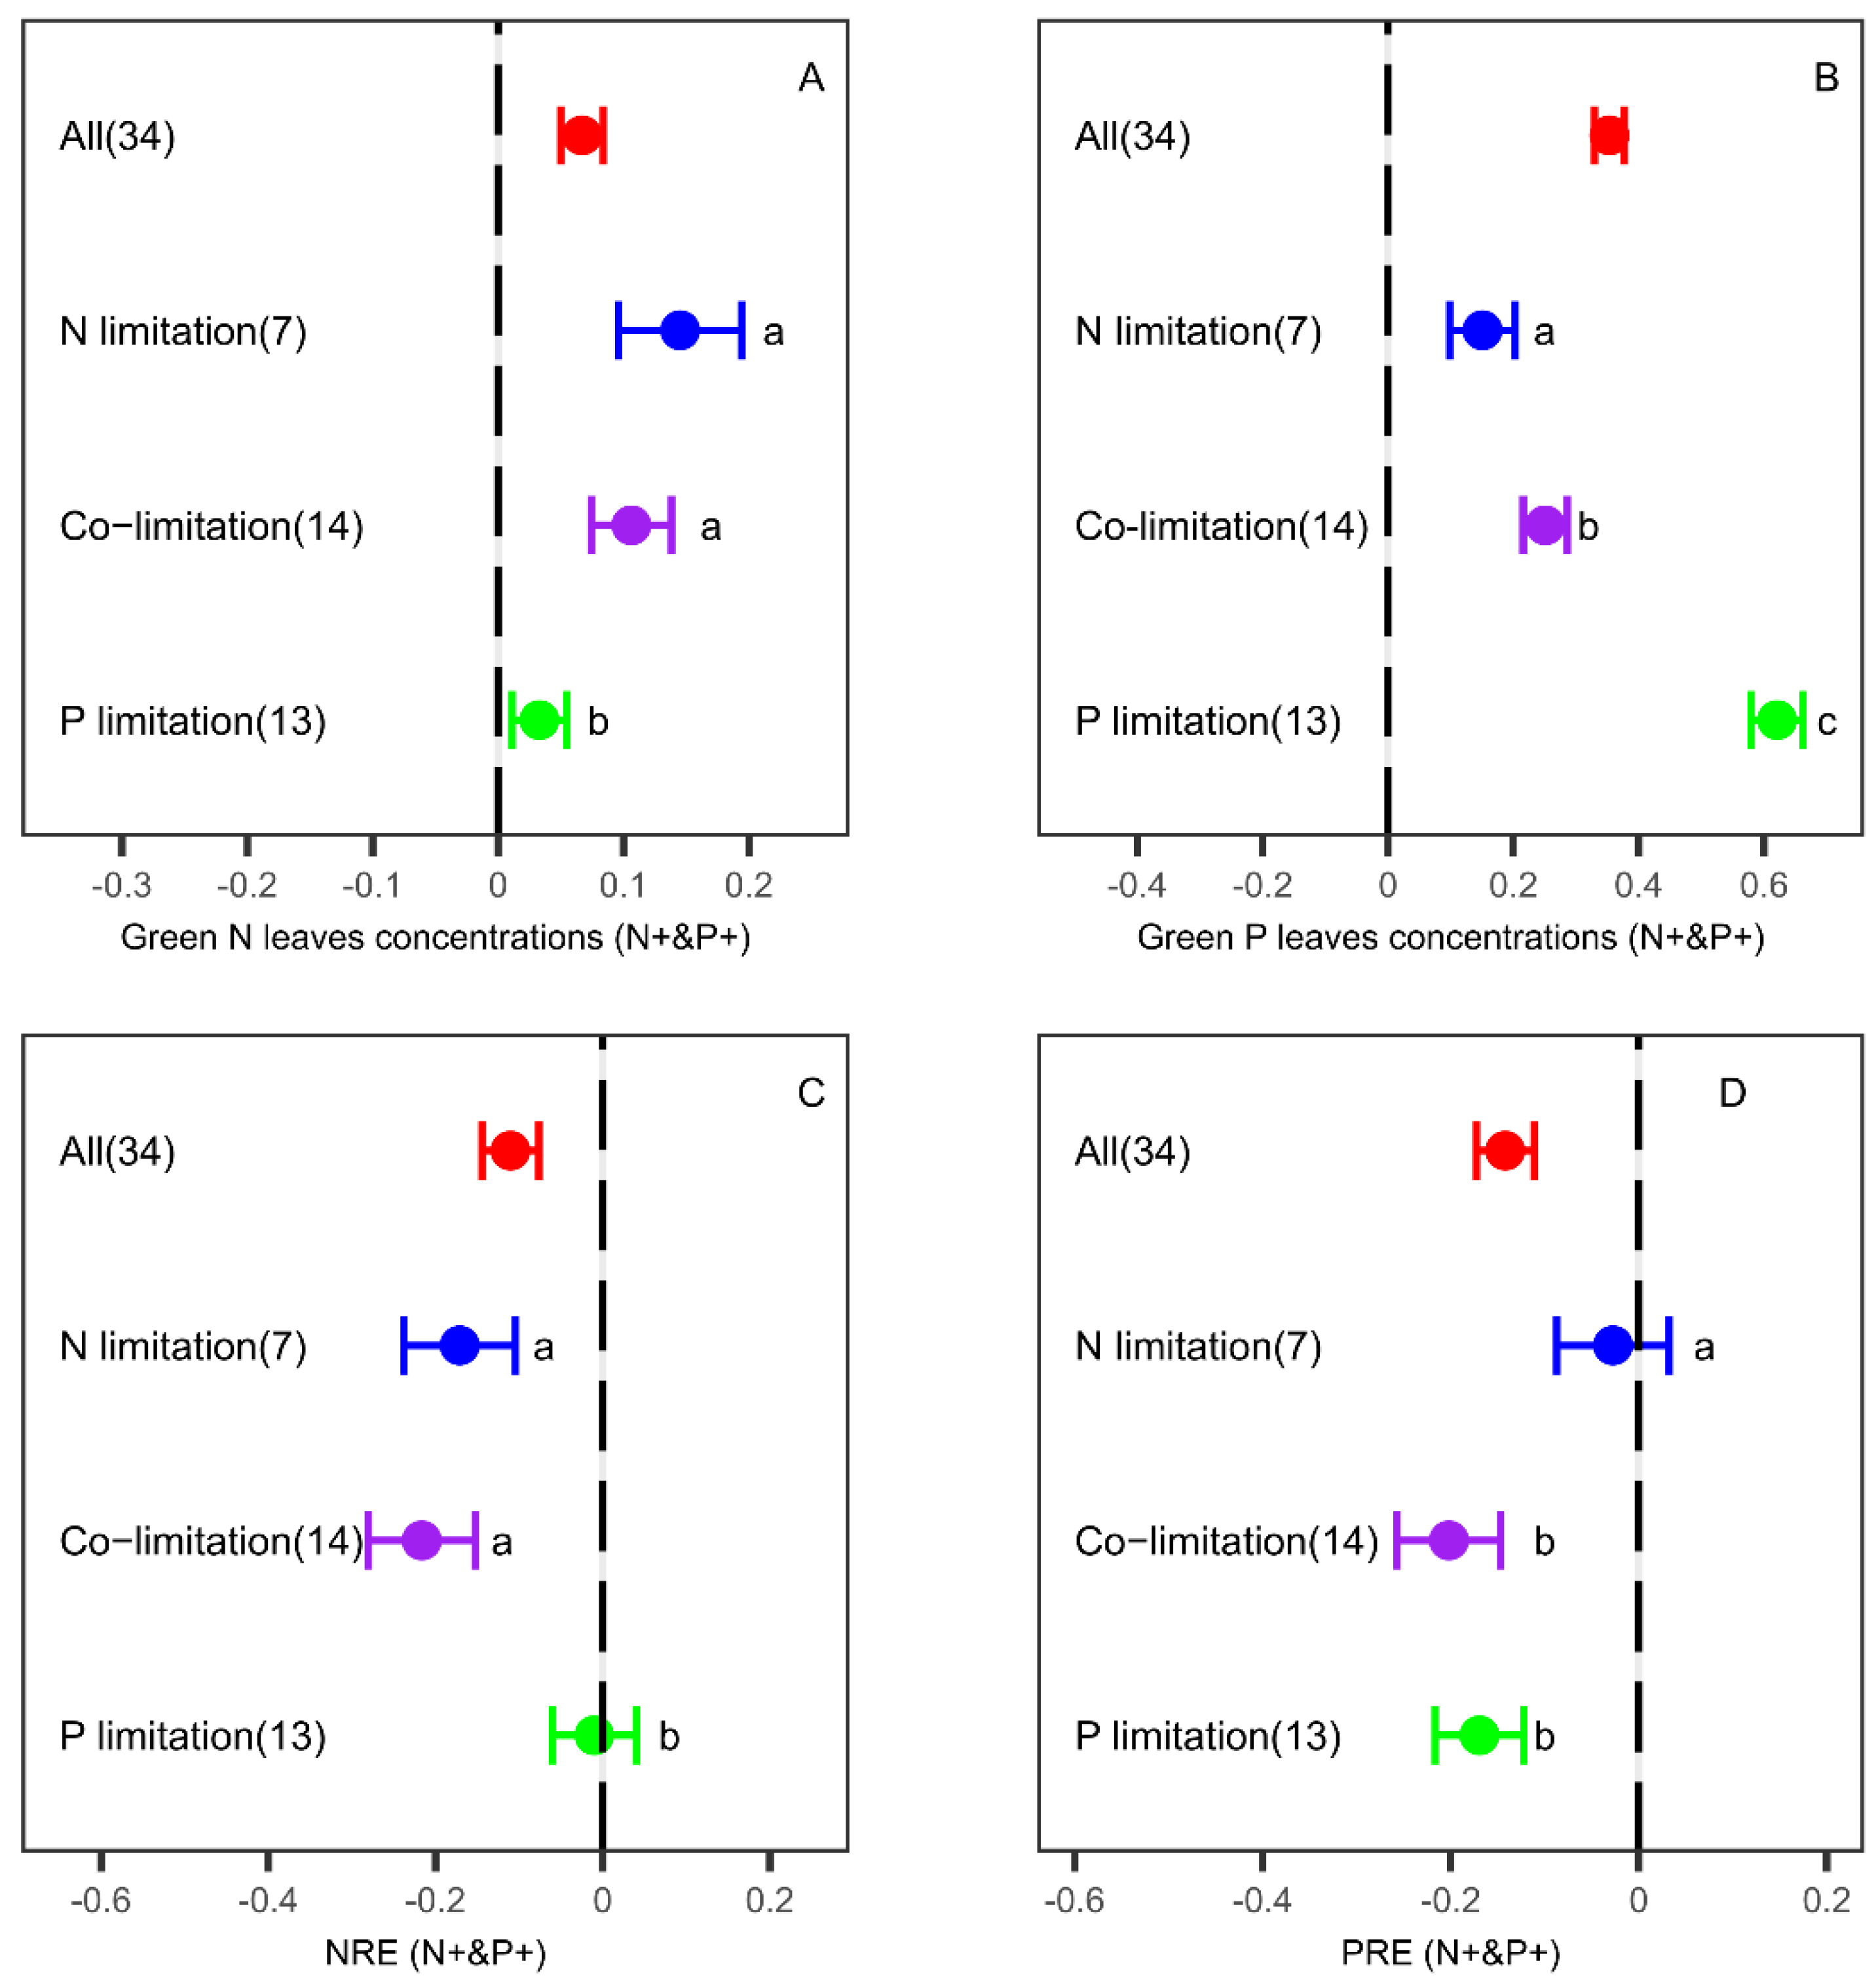
N and P co-fertilization increased leaf N and P concentrations, with greater increases under their respective nutrient-limited conditions (Figure 4A,B). For example, leaf N concentration increased more under N-limited and N and P co-limited conditions than under P limitation. Leaf P concentration increased more under P-limited conditions than under N-limited and N and P co-limited conditions. In general, N and P co-fertilization significantly decreased NRE and PRE (Figure 4C,D). While NRE under P limitation and PRE under N limitation did not show significant responses to N and P co-fertilization, NRE and PRE both decreased significantly in general under other nutrient-limited conditions (Figure 4C,D).

4. Discussion

Similar to the previous meta-analysis study [62], our results showed that, overall, N and P fertilization significantly enhanced their respective leaf nutrient concentrations but significantly reduced NRE and PRE, respectively. Co-fertilization with N and P significantly enhanced both leaf N and P concentrations and significantly reduced both NRE and PRE. These findings confirm that, when increasing nutrient N or P supplies, plants tend to absorb more respective N or P in green leaves and less from senescing leaves.
With the machine learning technique, in this study, we also showed that plant nutrient-limited conditions divided by the thresholds of leaf N:P ratios was the most important predictor in determining the response of leaf nutrient concentrations and NuREs to fertilization. For example, N fertilization generally increased leaf N concentration and decreased NRE, with greater magnitudes under the N-limited condition. P fertilization also generally increased leaf P concentration and decreased PRE, with greater magnitudes under the P-limited condition. This is not surprising and is consistent with our first hypothesis. Plants growing in infertile soils are usually limited by nutrient availability; in order to survive and reproduce, they have to adopt a “conservative consumption” nutrient use strategy with low leaf nutrient concentrations and high NuRE [3]. Fertilization to such infertile soils could significantly improve nutrient availability, thus greatly enhancing leaf nutrient concentrations while reducing NuREs. In contrast, plants growing in fertile soils are not limited by nutrient availability and usually adopt a “resource spending” nutrient use strategy with high leaf nutrient concentrations and low NuREs for fast growth and development [2]. Fertilization of the fertile soils would not significantly promote plant nutrient absorption and growth and thus had relatively less effects on leaf nutrient concentrations and NuREs.
Inputs with N alone or P alone usually induce an imbalance between N and P in the soil, leading to a relatively greater limitation of P and N, respectively [63]. However, plants could regulate leaf nutrient absorption and/or resorption to maintain a balance between N and P in their organs and tissues [64]. In our study, leaf N concentration did not change under all nutrient-limited conditions with P fertilization, but NRE enhanced significantly under the N-limited or N and P co-limited conditions. This suggests that plants might mainly adopt a “conservative consumption” nutrient use strategy with high NRE to alleviate N shortage (N-limited and N and P co-limited conditions) under P fertilization. Intriguingly, we found that N fertilization reduced leaf P concentration and increased PRE only under the N-limited condition. Under the P-limited or N and P co-limited conditions, N fertilization enhanced leaf P concentration and did not change PRE. This suggests that plants alleviate P shortage under N fertilization primarily through improving P absorption from the soil. However, we noted that the responses of PRE to N fertilization between the N-limited condition and the P-limited condition did not significantly differ, hence needing more studies to verify the second hypothesis in the future. The difference in plants that cope with fertilization-induced N vs. P limitation is probably attributed to a greater capacity of the plants to resorb P (upper limit ~90%) than N (upper limit ~80%), as reported by previous studies [1,3,65]. For example, added N could usually stimulate substantial phosphatase activity and enhance soil P availability [66], as the phosphatase enzymes are rich in N. Moreover, plants can develop various strategies to enhance P acquisition and maintain leaf P concentration under the P-limited condition through modifying root morphology, increasing root exudation or interactions with soil microorganisms [67]. However, soil N mineralization is generally thought to be regulated by microbial activity depending largely on temperature, moisture and substrate [68]. Under the N-limited condition, N fertilization has a stronger potential to promote plant growth. The N-stimulated phosphatase activity or increase in soil availability may not meet plant P demand under the N-limited condition, thus enhancing PRE.

5. Conclusions

In general, the leaf nutrient concentrations enhanced while NuREs reduced with the respective nutrient fertilization. With N and P co-fertilization, both leaf N and P concentrations were enhanced under all nutrient-limited conditions, and NRE and PRE were reduced except under P-limited and N-limited conditions, respectively. Furthermore, N fertilization enhanced leaf N concentration and reduced NRE most under the N-limited condition (N:P < 10). Accordingly, P fertilization enhanced leaf P concentration and reduced PRE most under the P-limited condition (N:P > 20). In addition, P fertilization did not change leaf N concentration under all nutrient-limited conditions but significantly enhanced NRE under the N-limited or N and P co-limited conditions. Nitrogen fertilization reduced leaf P concentration and enhanced PRE only under the N-limited condition. Under the P limitation or N and P co-limitation, N fertilization enhanced leaf P concentration and did not change PRE. These findings suggest that plants cope with fertilization-induced N limitation vs. P limitation differently, with different leaf-level nutrient-use strategies, whereas such differential responses in plant nutrient concentrations and NuREs were insufficiently considered in either modeling or experimental frameworks. Therefore, our results foster the understanding of the response patterns and mechanism controls of leaf nutrient concentrations and resorption to fertilization, which may enable us to better predict how nutrient change connects with terrestrial biogeochemical cycles.

Supplementary Materials

The following supporting information can be downloaded at: https://www.mdpi.com/article/10.3390/d14050385/s1, Figure S1: Frequency distribution of the change in nitrogen resorption efficiency (NRE) under natural conditions (a)–(c); and the corresponding change in NRE under N addition (d), P addition (e) and N and P co-addition (f) on a global scale. The curves were fitted by a Gaussian function. Figure S2: Frequency distribution of the change in phosphorus resorption efficiency (PRE) under natural conditions (a)–(c); and the corresponding change in PRE under N addition (d), P addition (e) and N and P co-addition (f) on a global scale. The curves were fitted by a Gaussian function. Figure S3: The relative influence (%) of the effects of nutri. limit. (nutrient limitation, N-limitation, when green leaf N:P < 10, N and P co-limitation, when 10 < N:P < 20 and P-limitation when, N:P > 20), mean annual temperature (MAT), mean annual precipitation (MAP), fer. rate (fertilizer rates), fer. type (fertilizer types), latitude, longitude, species, ecosystem types and climate zones on the RRs (green leaf N and P concentration, NRE and PRE) under N fertilization (N+). Figure S4: The relative influence (%) of the effects of nutri. limit. (nutrient limitation, N-limitation, when green leaf N:P < 10, N and P co-limitation, when 10 < N:P < 20 and P-limitation, when N:P > 20), mean annual temperature (MAT), mean annual precipitation (MAP), fer. rate (fertilizer rate), fer. type (fertilizer types), latitude, longitude, species, ecosystem types and climate types on mean RR (green leaf N and P concentration, NRE and PRE) under P fertilization (P+).

Author Contributions

Conceptualization, J.L. and Q.D.; data collection, M.Z.; data curation and analysis, M.Z. and L.Z.; writing—original draft preparation, M.Z.; writing—review and editing, M.Z., L.Z., X.Y., J.L. and Q.D.; supervision, J.L. and Q.D.; project administration, J.L. and Q.D.; funding acquisition, X.Y. All authors have read and agreed to the published version of the manuscript.

Funding

This study was jointly supported by grants from the Key Special Project for Introduced Talents Team of Southern Marine Science and Engineering Guangdong Laboratory (Guangzhou) (GML2019ZD0408), the National Natural Science Foundation of China (31870461), the “Hundred Talent Program” of South China Botanical Garden at the Chinese Academy of Sciences (Y761031001), the “Young Top-notch Talent” in Pearl River talent plan of Guangdong Province (2019QN01L763), the National Key R&D Program of China (2021YFC3100402) and by the Guangdong Provincial Key R&D Program (2020B1111530004).

Institutional Review Board Statement

Not applicable.

Informed Consent Statement

Not applicable.

Data Availability Statement

The authors confirm that the data supporting the findings of this study are available within the article and its Supplementary Materials.

Conflicts of Interest

The authors declare no conflict of interest.

References

  1. See, C.R.; Yanai, R.D.; Fisk, M.C.; Vadeboncoeur, M.A.; Quintero, B.A.; Fahey, T.J. Soil nitrogen affects phosphorus recycling: Foliar resorption and plant-soil feedbacks in a northern hardwood forest. Ecology 2015, 96, 2488–2498. [Google Scholar] [CrossRef] [PubMed] [Green Version]
  2. Kobe, R.K.; Lepczyk, C.A.; Iyer, M. Resorption Efficiency Decreases with Increasing Green Leaf Nutrients in a Global Data Set. Ecology 2005, 86, 2780–2792. [Google Scholar] [CrossRef]
  3. Lü, X.T.; Reed, S.C.; Yu, Q.; Han, X.G. Nutrient resorption helps drive intra-specific coupling of foliar nitrogen and phosphorus under nutrient-enriched conditions. Plant Soil 2016, 398, 111–120. [Google Scholar] [CrossRef]
  4. Grime, J.P. Benefits of plant diversity to ecosystems] immediate, filter and founder effects. J. Ecol. 1998, 86, 902–910. [Google Scholar] [CrossRef]
  5. Güsewell, S. Nutrient resorption of wetland graminoids is related to the type of nutrient limitation. Funct. Ecol. 2005, 19, 344–354. [Google Scholar] [CrossRef]
  6. Han, W.; Tang, L.; Chen, Y.; Fang, J. Relationship between the relative limitation and resorption efficiency of nitrogen vs phosphorus in woody plants. PLoS ONE 2013, 8, e83366. [Google Scholar] [CrossRef]
  7. Manzoni, S.; Trofymow, J.A.; Jackson, R.B.; Porporato, A. Stoichiometric controls on carbon, nitrogen, and phosphorus dynamics in decomposing litter. Ecol. Monogr. 2010, 80, 89–106. [Google Scholar] [CrossRef]
  8. Vergutz, L.; Manzoni, S.; Porporato, A.; Novais, R.F.; Jackson, R.B. Global resorption efficiencies and concentrations of carbon and nutrients in leaves of terrestrial plants. Ecol. Monogr. 2012, 82, 205–220. [Google Scholar] [CrossRef] [Green Version]
  9. Güsewell, S. N: P ratios in terrestrial plants: Variation and functional significance. New Phytol. 2004, 164, 243–266. [Google Scholar] [CrossRef]
  10. Reich, P.B.; Oleksyn, J. Global patterns of plant leaf N and P in relation to temperature and latitude. Proc. Natl. Acad. Sci. USA 2004, 101, 11001–11006. [Google Scholar] [CrossRef] [Green Version]
  11. Yuan, Z.Y.; Chen, H.Y.H. Global-scale patterns of nutrient resorption associated with latitude, temperature and precipitation. Glob. Ecol. 2009, 18, 11–18. [Google Scholar] [CrossRef]
  12. Sun, X.; Kang, H.; Chen, H.Y.; Bjorn, B.; Samuel, B.F.; Liu, C. Biogeographic patterns of nutrient resorption from Quercus variabilis Blume leaves across China. Plant. Biol. 2016, 18, 505–513. [Google Scholar] [CrossRef] [PubMed]
  13. Yuan, Z.Y.; Chen, H.Y.H. Decoupling of nitrogen and phosphorus in terrestrial plants associated with global changes. Nat. Clim. Chang. 2015, 5, 465–469. [Google Scholar] [CrossRef]
  14. Gerdol, R.; Iacumin, P.; Brancaleoni, L. Differential effects of soil chemistry on the foliar resorption of nitrogen and phosphorus across altitudinal gradients. Funct. Ecol. 2019, 33, 1351–1361. [Google Scholar] [CrossRef]
  15. Wright, I.J.; Westoby, M. Nutrient concentration, resorption and lifespan: Leaf traits of Australian sclerophyll species. Funct. Ecol. 2003, 17, 10–19. [Google Scholar] [CrossRef] [Green Version]
  16. Chang, Y.; Li, N.; Wang, W.; Liu, X.; Du, F.; Yao, D. Nutrients resorption and stoichiometry characteristics of different-aged plantations of Larix kaempferi in the Qinling Mountains, central China. PLoS ONE 2017, 12, e0189424. [Google Scholar] [CrossRef] [Green Version]
  17. Chen, F.-S.; Niklas, K.J.; Liu, Y.; Fang, X.-M.; Wan, S.-Z.; Wang, H. Nitrogen and phosphorus additions alter nutrient dynamics but not resorption efficiencies of Chinese fir leaves and twigs differing in age. Tree Physiol. 2015, 35, 1106–1117. [Google Scholar] [CrossRef] [Green Version]
  18. Feller, I.C.; Lovelock, C.E.; Piou, C. Growth and nutrient conservation in rhizophora mangle in response to fertilization along latitudinal and tidal gradients. Smithson. Contrib. Mar. Sci. 2009, 38, 345–358. [Google Scholar]
  19. Gonzales, K.; Yanai, R. Nitrogen–phosphorous interactions in young northern hardwoods indicate P limitation: Foliar concentrations and resorption in a factorial N by P addition experiment. Oecologia 2019, 189, 829–840. [Google Scholar] [CrossRef]
  20. Huang, G.; Su, Y.-G.; Mu, X.-H.; Li, Y. Foliar nutrient resorption responses of three life-form plants to water and nitrogen additions in a temperate desert. Plant Soil 2018, 424, 479–489. [Google Scholar] [CrossRef]
  21. Huang, J.; Wang, P.; Niu, Y.; Yu, H.; Ma, F.; Xiao, G.; Xu, X. Changes in C:N:P stoichiometry modify N and P conservation strategies of a desert steppe species Glycyrrhiza uralensis. Sci. Rep. 2018, 8, 1–9. [Google Scholar] [CrossRef] [PubMed] [Green Version]
  22. Huang, J.; Yu, H.; Wang, B.; Li, L.; Xiao, G.; Yuan, Z. Nutrient resorption based on different estimations of five perennial herbaceous species from the grassland in inner Mongolia, China. J. Arid Environ. 2012, 76, 1–8. [Google Scholar] [CrossRef]
  23. Kang, J.; Han, G.; Ren, H.; Zhu, Y.; Zhang, X.; Wang, Y. Responses of plant nutrient contents and resorption to warming and nitrogen addition under different precipitation conditions in a desert grassland. Acta Bot. Boreali-Occident. Sin. 2019, 39, 1651–1660. [Google Scholar]
  24. Kong, M.; Kang, J.; Han, C.-L.; Gu, Y.-J.; Siddique, K.H.; Li, F.-M. Nitrogen, Phosphorus, and Potassium Resorption Responses of Alfalfa to Increasing Soil Water and P Availability in a Semi-Arid Environment. Agronomy 2020, 10, 310. [Google Scholar] [CrossRef] [Green Version]
  25. Kou, L.; Wang, H.; Gao, W.; Chen, W.; Yang, H.; Li, S. Nitrogen addition regulates tradeoff between root capture and foliar resorption of nitrogen and phosphorus in a subtropical pine plantation. Trees 2016, 31, 77–91. [Google Scholar] [CrossRef]
  26. Kozovits, A.R.; Bustamante, M.M.C.; Garofalo, C.R.; Bucci, S.; Franco, A.C.; Goldstein, G.; Meinzer, F.C. Nutrient resorption and patterns of litter production and decomposition in a Neotropical Savanna. Funct. Ecol. 2007, 21, 1034–1043. [Google Scholar] [CrossRef]
  27. Li, L.; Gao, X.; Li, X.; Lin, L.; Zeng, F.; Gui, D.; Lu, Y. Nitrogen (N) and phosphorus (P) resorption of two dominant alpine perennial grass species in response to contrasting N and P availability. Environ. Exp. Bot. 2016, 127, 37–44. [Google Scholar] [CrossRef]
  28. Li, L.; Li, X.; Liu, B.; Lei, J.; Yue, Z.; Li, C. Imbalanced stoichiometric patterns in foliar nutrient resorption response to N and P addition in grazing alpine grassland. Acta Oecologica 2019, 102, 103505. [Google Scholar] [CrossRef]
  29. Li, L.; Zeng, D.; Mao, R.; Yu, Z. Nitrogen and phosphorus resorption of Artemisia scoparia, Chenopodium acuminatum, Cannabis sativa, and Phragmites communis under nitrogen and phosphorus additions in a semiarid grassland, China. Plant Soil Environ. 2012, 58, 446–451. [Google Scholar] [CrossRef] [Green Version]
  30. Li, Q.; Lv, J.; Peng, C.; Xiang, W.; Xiao, W.; Song, X. Nitrogen -addition accelerates phosphorus cycling and changes phosphorus use strategy in a subtropical moso bamboo forest. Environ. Res. Lett. 2021, 16, 024023. [Google Scholar] [CrossRef]
  31. Liu, G.; Xing, Y.; Wang, Q.; Wang, L.; Feng, Y.; Yin, Z.; Wang, X.; Liu, T. Long-term nitrogen addition regulates root nutrient capture and leaf nutrient resorption in Larix gmelinii in a boreal forest. Forstwiss. Centralblatt 2021, 140, 763–776. [Google Scholar] [CrossRef]
  32. Lu, J.; Yang, M.; Liu, M.; Lu, Y.; Yang, H. Nitrogen and phosphorus fertilizations alter nitrogen, phosphorus and potassium resorption of alfalfa in the Loess Plateau of China. J. Plant Nutr. 2019, 42, 2234–2246. [Google Scholar] [CrossRef]
  33. Lü, X.-T.; Han, X.-G. Nutrient resorption responses to water and nitrogen amendment in semi-arid grassland of Inner Mongolia, China. Plant Soil 2009, 327, 481–491. [Google Scholar] [CrossRef]
  34. Lu, X.; Kong, D.-L.; Pan, Q.-M.; Simmons, M.E.; Han, X.-G. Nitrogen and water availability interact to affect leaf stoichiometry in a semi-arid grassland. Oecologia 2011, 168, 301–310. [Google Scholar] [CrossRef] [PubMed]
  35. Lü, X.-T.; Reed, S.; Yu, Q.; He, N.-P.; Wang, Z.-W.; Han, X.-G. Convergent responses of nitrogen and phosphorus resorption to nitrogen inputs in a semiarid grassland. Glob. Chang. Biol. 2013, 19, 2775–2784. [Google Scholar] [CrossRef]
  36. Mao, R.; Song, C.-C.; Zhang, X.-H.; Wang, X.-W.; Zhang, Z.-H. Response of leaf, sheath and stem nutrient resorption to 7 years of N addition in freshwater wetland of Northeast China. Plant Soil 2012, 364, 385–394. [Google Scholar] [CrossRef]
  37. Mao, R.; Zeng, D.-H.; Zhang, X.-H.; Song, C.-C. Responses of plant nutrient resorption to phosphorus addition in freshwater marsh of Northeast China. Sci. Rep. 2015, 5, 8097. [Google Scholar] [CrossRef]
  38. Mo, Q.; Zou, B.; Li, Y.; Chen, Y.; Zhang, W.; Mao, R.; Ding, Y.; Wang, J.; Lu, X.; Li, X.; et al. Response of plant nutrient stoichiometry to fertilization varied with plant tissues in a tropical forest. Sci. Rep. 2015, 5, 14605. [Google Scholar] [CrossRef]
  39. Mo, Q.; Chen, Y.; Wang, F.; Zou, B.; Li, Y.; Yu, S.; Li, X.; Li, Z. Nitrogen to phosphorus ratios of two understory plant species in response to nitrogen and phosphorus addition in tropical forest of southern china. Chin. J. Appl. Environ. Biol. 2015, 21, 919–925. [Google Scholar]
  40. Rejmánková, E.; Snyder, J.M. Emergent macrophytes in phosphorus limited marshes: Do phosphorus usage strategies change after nutrient addition? Plant Soil 2008, 313, 141–153. [Google Scholar] [CrossRef]
  41. Ren, H.; Kang, J.; Yuan, Z.; Xu, Z.; Han, G. Responses of nutrient resorption to warming and nitrogen fertilization in contrasting wet and dry years in a desert grassland. Plant Soil 2018, 432, 65–73. [Google Scholar] [CrossRef]
  42. Ren, H.; Xu, Z.; Huang, J.; Lü, X.; Zeng, D.-H.; Yuan, Z.; Han, X.; Fang, Y. Increased precipitation induces a positive plant-soil feedback in a semi-arid grassland. Plant Soil 2014, 389, 211–223. [Google Scholar] [CrossRef]
  43. Servais, S.; Kominoski, J.S.; Davis, S.E.; Gaiser, E.E.; Pachόn, J.; Troxler, T.G. Effects of Nutrient-Limitation on Disturbance Recovery in Experimental Mangrove Wetlands. Wetlands 2018, 39, 337–347. [Google Scholar] [CrossRef]
  44. Shen, F.-F.; Li, Y.-Y.; Liu, W.-F.; Duan, H.-L.; Fan, H.-B.; Hu, L.; Meng, Q.-Y. Responses of nitrogen and phosphorus resorption from leaves and branches to long-term nitrogen deposition in a Chinese fir plantation. Chin. J. Plant Ecol. 2018, 42, 926–937. [Google Scholar] [CrossRef] [Green Version]
  45. Shen, Y.; Yang, X.; Sun, X.; Chen, W.; Yang, G.; Liu, N.; Chen, J.; Zhang, Y. Increased precipitation modulates the influence of nitrogen and litter inputs on the nutrient resorption proficiency rather than efficiency of Leymus chinensis. Plant Ecol. 2017, 219, 217–230. [Google Scholar] [CrossRef]
  46. Shi, B.; Ling, X.; Cui, H.; Song, W.; Gao, Y.; Sun, W. Response of nutrient resorption ofleymus chinensisto nitrogen and phosphorus addition in a meadow steppe of northeast china. Plant Biol. 2020, 22, 1123–1132. [Google Scholar] [CrossRef]
  47. Su, Y.; Luo, Y.; Geng, F.; Han, W.; Zhu, Y.; Li, K.; Liu, X. Response of stoichiometric characteristics of nitrogen and phosphorus in plant leaves in an alpine grasslands to nitrogen deposition in the tianshan mountains. Arid. Zone Res. 2019, 36, 430–436. [Google Scholar]
  48. Su, Y.; Ma, X.; Le, J.; Li, K.; Han, W.; Liu, X. Decoupling of nitrogen and phosphorus in dominant grass species in response to long-term nitrogen addition in an Alpine Grassland in Central Asia. Plant Ecol. 2021, 222, 261–274. [Google Scholar] [CrossRef]
  49. Wan, X.B.; Wang, Q.G.; Yan, G.-Y.; Xing, Y.J. Response of ecological stoichiometric characteristics and photosynthetic characteristics of plant leaves to long-term n deposition in natural secondary forest. Bull. Bot. Res. 2019, 39, 407–420. [Google Scholar]
  50. Wang, B.; Huang, G.; Ma, J.; Li, Y. Responses of nutrients resorption of five desert ephemeral plants to water and nitrogen additions. J. Desert Res. 2016, 36, 415–422. [Google Scholar]
  51. Wang, F.-C.; Fang, X.-M.; Wang, G.G.; Mao, R.; Lin, X.-F.; Wang, H.; Chen, F.-S. Effects of nutrient addition on foliar phosphorus fractions and their resorption in different-aged leaves of Chinese fir in subtropical China. Plant Soil 2019, 443, 41–54. [Google Scholar] [CrossRef]
  52. Yan, T.; Qu, T.; Song, H.; Ciais, P.; Piao, S.; Sun, Z.; Zeng, H. Contrasting effects of N addition on the N and P status of understory vegetation in plantations of sapling and matureLarix principis-rupprechtii. J. Plant Ecol. 2018, 11, 843–852. [Google Scholar] [CrossRef]
  53. Yang, H. Effects of nitrogen and phosphorus addition on leaf nutrient characteristics in a subtropical forest. Trees 2017, 32, 383–391. [Google Scholar] [CrossRef]
  54. Zhang, Q.; Xie, J.; Lyu, M.; Xiong, D.; Wang, J.; Chen, Y.; Li, Y.; Wang, M.; Yang, Y. Short-term effects of soil warming and nitrogen addition on the N:P stoichiometry of Cunninghamia lanceolata in subtropical regions. Plant Soil 2016, 411, 395–407. [Google Scholar] [CrossRef]
  55. Zhang, Y.; Yang, G.-S.; Shi, F.-X.; Mao, R. Biomass allocation between leaf and stem regulates community-level plant nutrient resorption efficiency response to nitrogen and phosphorus additions in a temperate wetland of Northeast China. J. Plant Ecol. 2020, 14, 58–66. [Google Scholar] [CrossRef]
  56. Zhao, Q.; Liu, X.; Hu, Y.; Zeng, D. Effects of nitrogen addition on nutrient allocation and nutrient resorption efficiency in larix gmelinii. Sci. Silvae Sin. 2010, 46, 14–19. [Google Scholar]
  57. Zheng, J.; She, W.; Zhang, Y.; Bai, Y.; Qin, S.; Wu, B. Nitrogen enrichment alters nutrient resorption and exacerbates phosphorus limitation in the desert shrub artemisia ordosica. Ecol. Evol. 2018, 8, 9998–10007. [Google Scholar] [CrossRef] [Green Version]
  58. Zheng, L.-L.; Zhao, Q.; Sun, Q.-Y.; Liu, L.; Zeng, D.-H. Nitrogen addition elevated autumn phosphorus retranslocation of living needles but not resorption in a nutrient-poor Pinus sylvestris var. Mongolica plantation. For. Ecol. Manag. 2020, 468, 118174. [Google Scholar] [CrossRef]
  59. Lin, L. Hybrid test for publication bias in meta-analysis. Stat. Methods Med. Res. 2020, 29, 2881–2899. [Google Scholar] [CrossRef]
  60. Peng, Y.; Guo, D.; Yang, Y. Global patterns of root dynamics under nitrogen enrichment. Glob. Ecol. Biogeogr. 2017, 26, 102–114. [Google Scholar] [CrossRef]
  61. Luo, Y.; Hui, D.; Zhang, D. Elevated carbon dioxide stimulates net accumulations of carbon and nitrogen in terrestrial ecosystems: A meta-analysis. Ecology 2006, 87, 53–63. [Google Scholar] [CrossRef] [PubMed] [Green Version]
  62. Yuan, Z.Y.; Chen, H. Negative effects of fertilization on plant nutrient resorption. Ecology 2015, 96, 373–380. [Google Scholar] [CrossRef] [PubMed]
  63. Penuelas, J.; Poulter, B.; Sardans, J.; Ciais, P.; van der Velde, M.; Bopp, L.; Boucher, O.; Godderis, Y.; Hinsinger, P.; Llusia, J.; et al. Human-induced nitrogen-phosphorus imbalances alter natural and managed ecosystems across the globe. Nat. Commun. 2013, 4, 2934. [Google Scholar] [CrossRef] [Green Version]
  64. Houlton, B.Z.; Wang, Y.P.; Vitousek, P.M.; Field, C.B. A unifying framework for dinitrogen fixation in the terrestrial biosphere. Nature 2008, 454, 327–330. [Google Scholar] [CrossRef] [PubMed]
  65. Reichert, T.; Rammig, A.; Fuchslueger, L.; Lugli, L.F.; Quesada, C.A.; Fleischer, K. Plant phosphorus-use and -acquisition strategies in Amazonia. New Phytol. 2022, 234, 1126–1143. [Google Scholar] [CrossRef] [PubMed]
  66. Marklein, A.R.; Houlton, B.Z. Nitrogen inputs accelerate phosphorus cycling rates across a wide variety of terrestrial ecosystems. New Phytol. 2012, 193, 696–704. [Google Scholar] [CrossRef]
  67. Wen, Z.; Li, H.; Shen, J.; Rengel, Z. Maize responds to low shoot P concentration by altering root morphology rather than increasing root exudation. Plant. Soil 2017, 416, 377–389. [Google Scholar] [CrossRef]
  68. Zhang, S.; Zheng, Q.; Noll, L.; Hu, Y.; Wanek, W. Environmental effects on soil microbial nitrogen use efficiency are controlled by allocation of organic nitrogen to microbial growth and regulate gross N mineralization. Soil Biol. Biochem. 2019, 135, 304–315. [Google Scholar] [CrossRef]
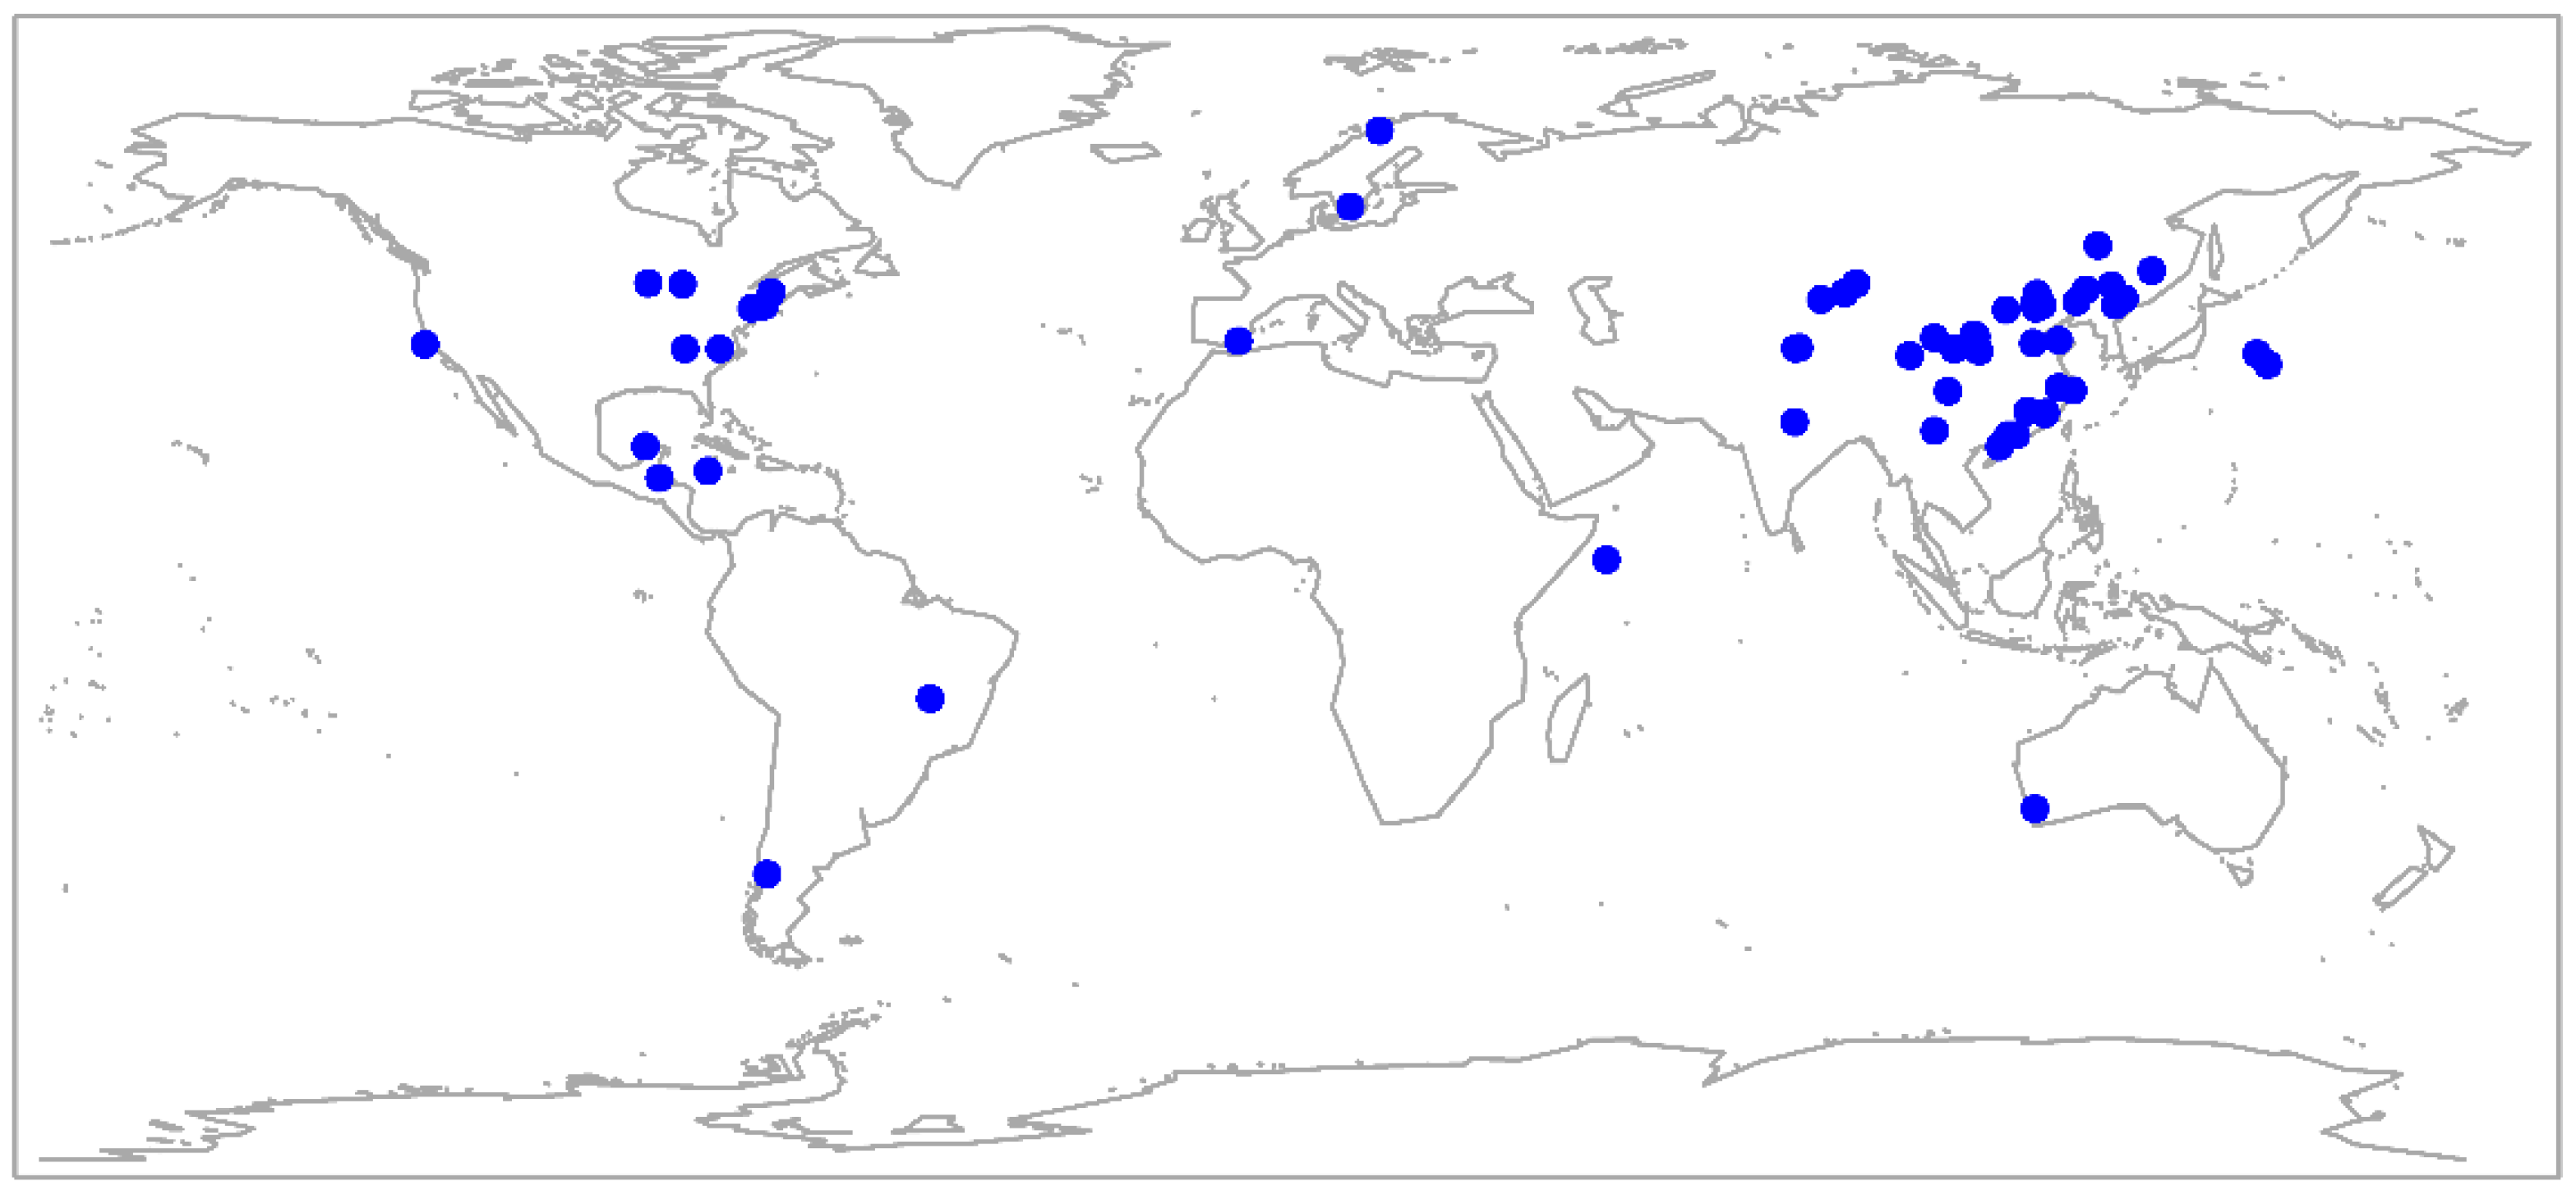
Figure 1. Global distribution of sites included in this study. The blue points represent each data sampling site around the world.
Diversity 14 00385 g001
Figure 2. Responses of leaf nitrogen (A) and phosphorus (B) concentrations, nitrogen resorption efficiency (NRE) (C) and phosphorus resorption efficiency (PRE) (D) to N fertilization (N+). Error bars are the 95% confidence intervals of the mean. Different letters indicate the significant differences among different nutrient limitations under N fertilization. The red (bule, purple and green) points represent leaf N (P/NRE/PRE) in general, under N limitation, co-limitation and P limitation, respectively.
Diversity 14 00385 g002
Figure 3. Responses of leaf nitrogen (A) and phosphorus (B) concentrations, nitrogen resorption efficiency (NRE) (C) and phosphorus resorption efficiency (PRE) (D) to P fertilization (P+). Error bars are the 95% confidence intervals of the mean. Different letters indicate the significant differences among different nutrient limitations under P fertilization. The red (bule, purple and green) points represent leaf N (P/NRE/PRE) in general, under N limitation, co-limitation and P limitation, respectively.
Diversity 14 00385 g003
Figure 4. Responses of leaf nitrogen (A) and phosphorus (B) concentrations, nitrogen resorption efficiency (NRE) (C) and phosphorus resorption efficiency (PRE) (D) to the combination of N and P fertilization (N+ & P+). Error bars are the 95% confidence intervals of the mean. Different letters indicate the significant differences among different nutrient limitations under N and P co-fertilization. The red (bule, purple and green) points represent leaf N (P/NRE/PRE) in general, under N limitation, co-limitation and P limitation, respectively.
Diversity 14 00385 g004
Publisher’s Note: MDPI stays neutral with regard to jurisdictional claims in published maps and institutional affiliations.