
Genetic Diversity and Population Structure of Portunustrituberculatus in Released and Wild Populations Based on Microsatellite DNA Markers from the Yangtze Estuary


Abstract
:1. Introduction
2. Materials and Methods
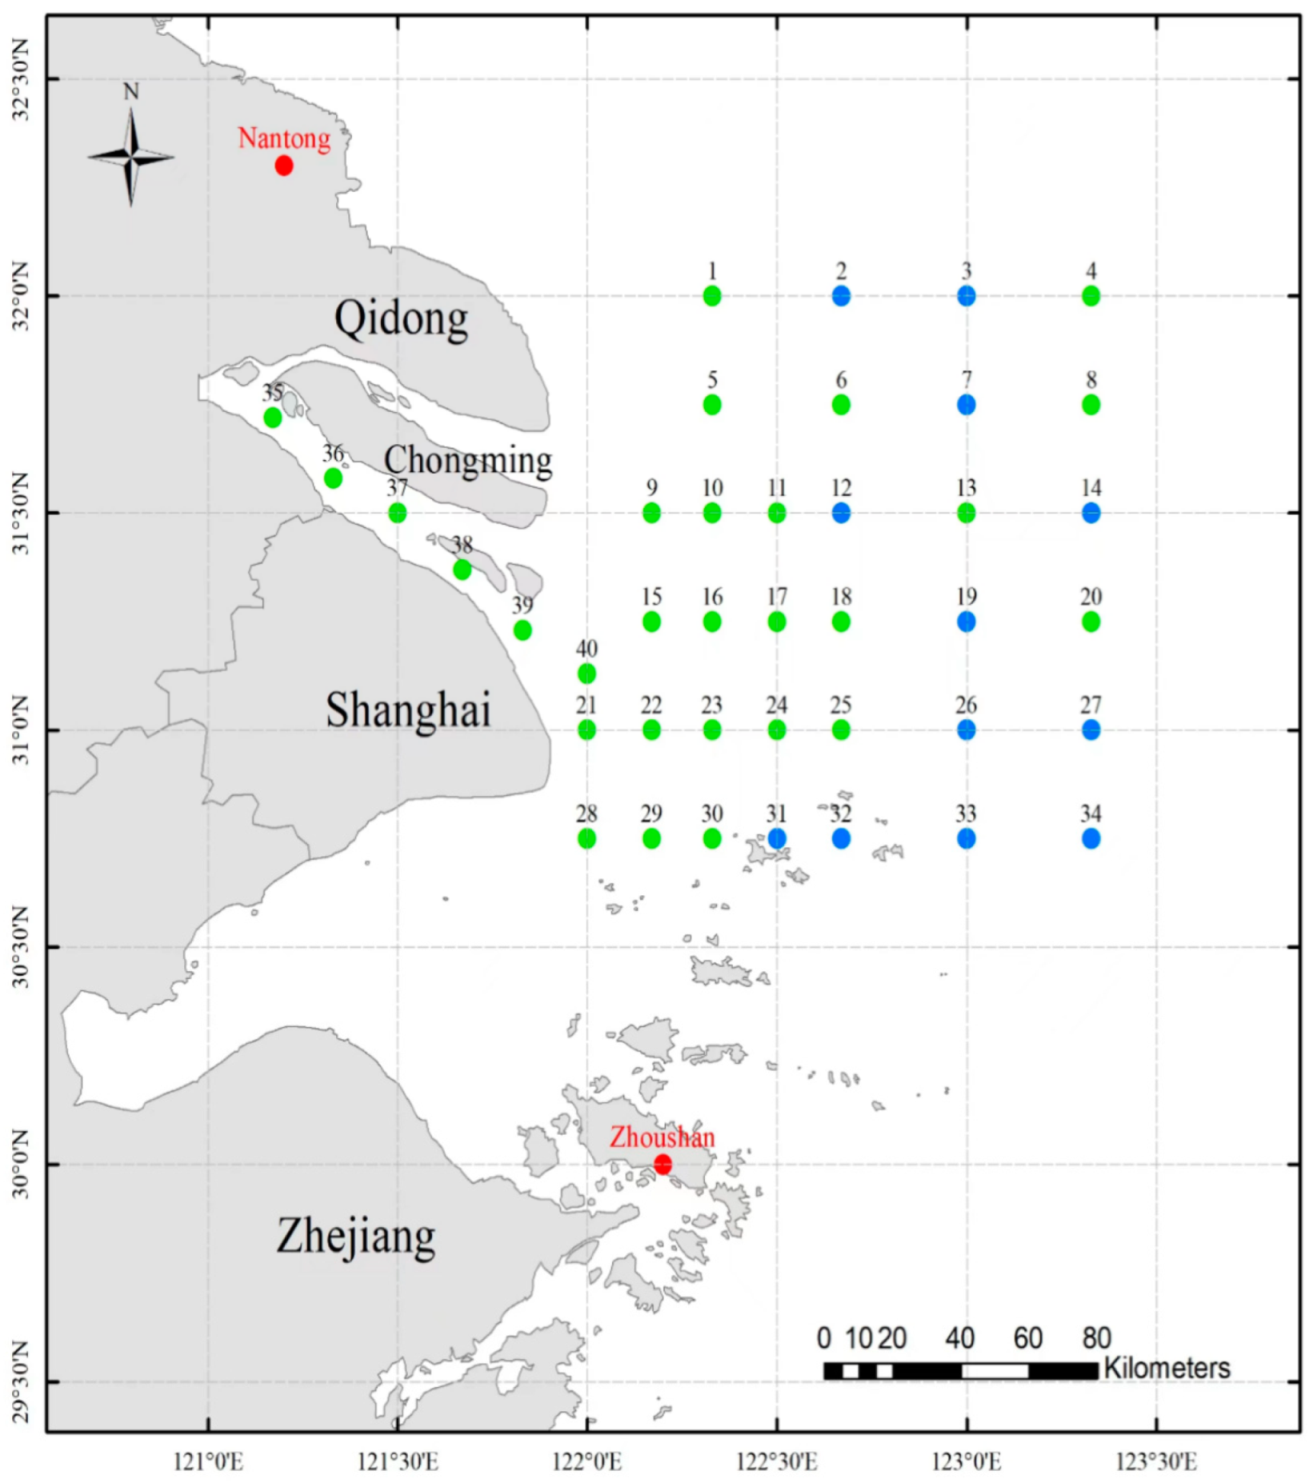
2.1. Sample Collection and DNA Extraction
2.2. Microsatellite Polymerase Chain Reaction Amplification
2.3. Data Analysis
3. Results
3.1. Genetic Diversity Analysis for Wild and Aritificially Bred Crabs Caught in Yangtze Estuary
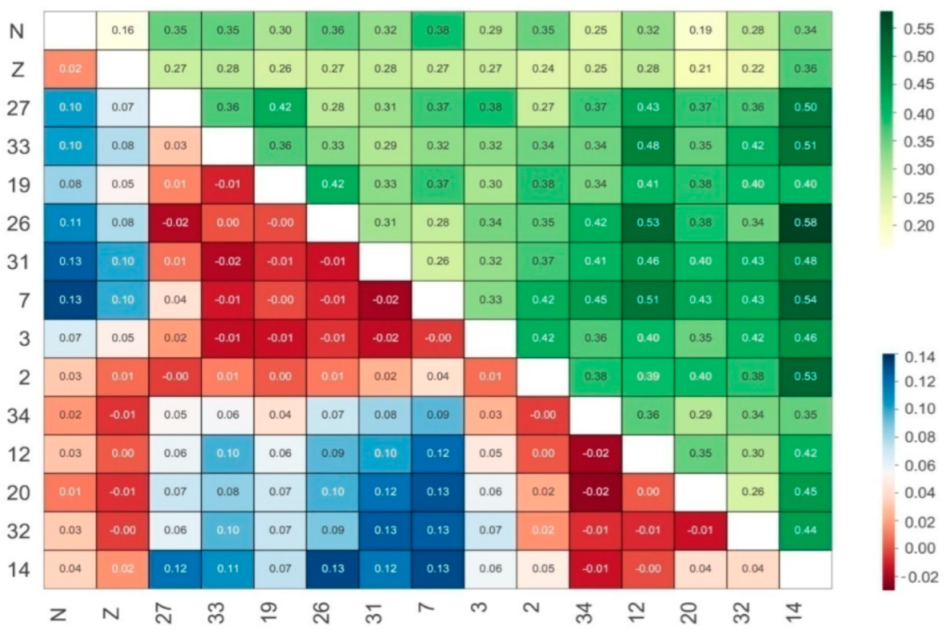
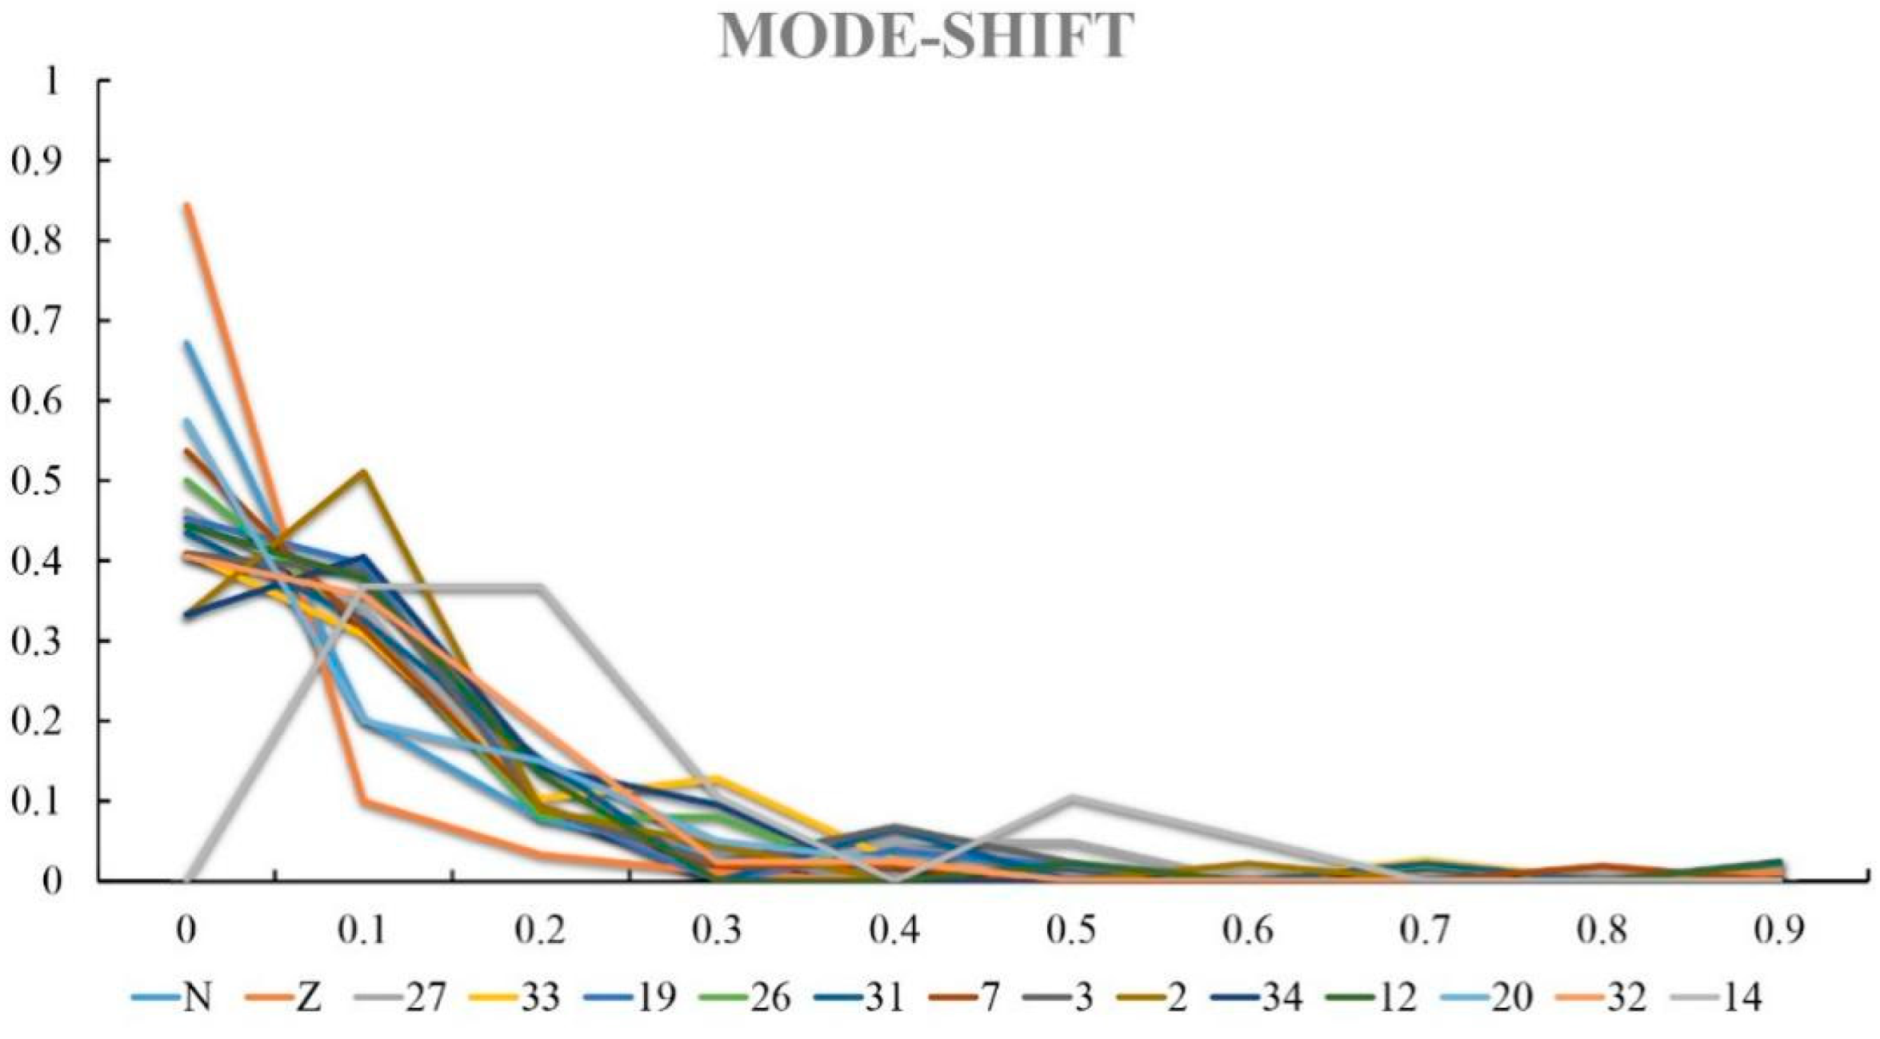
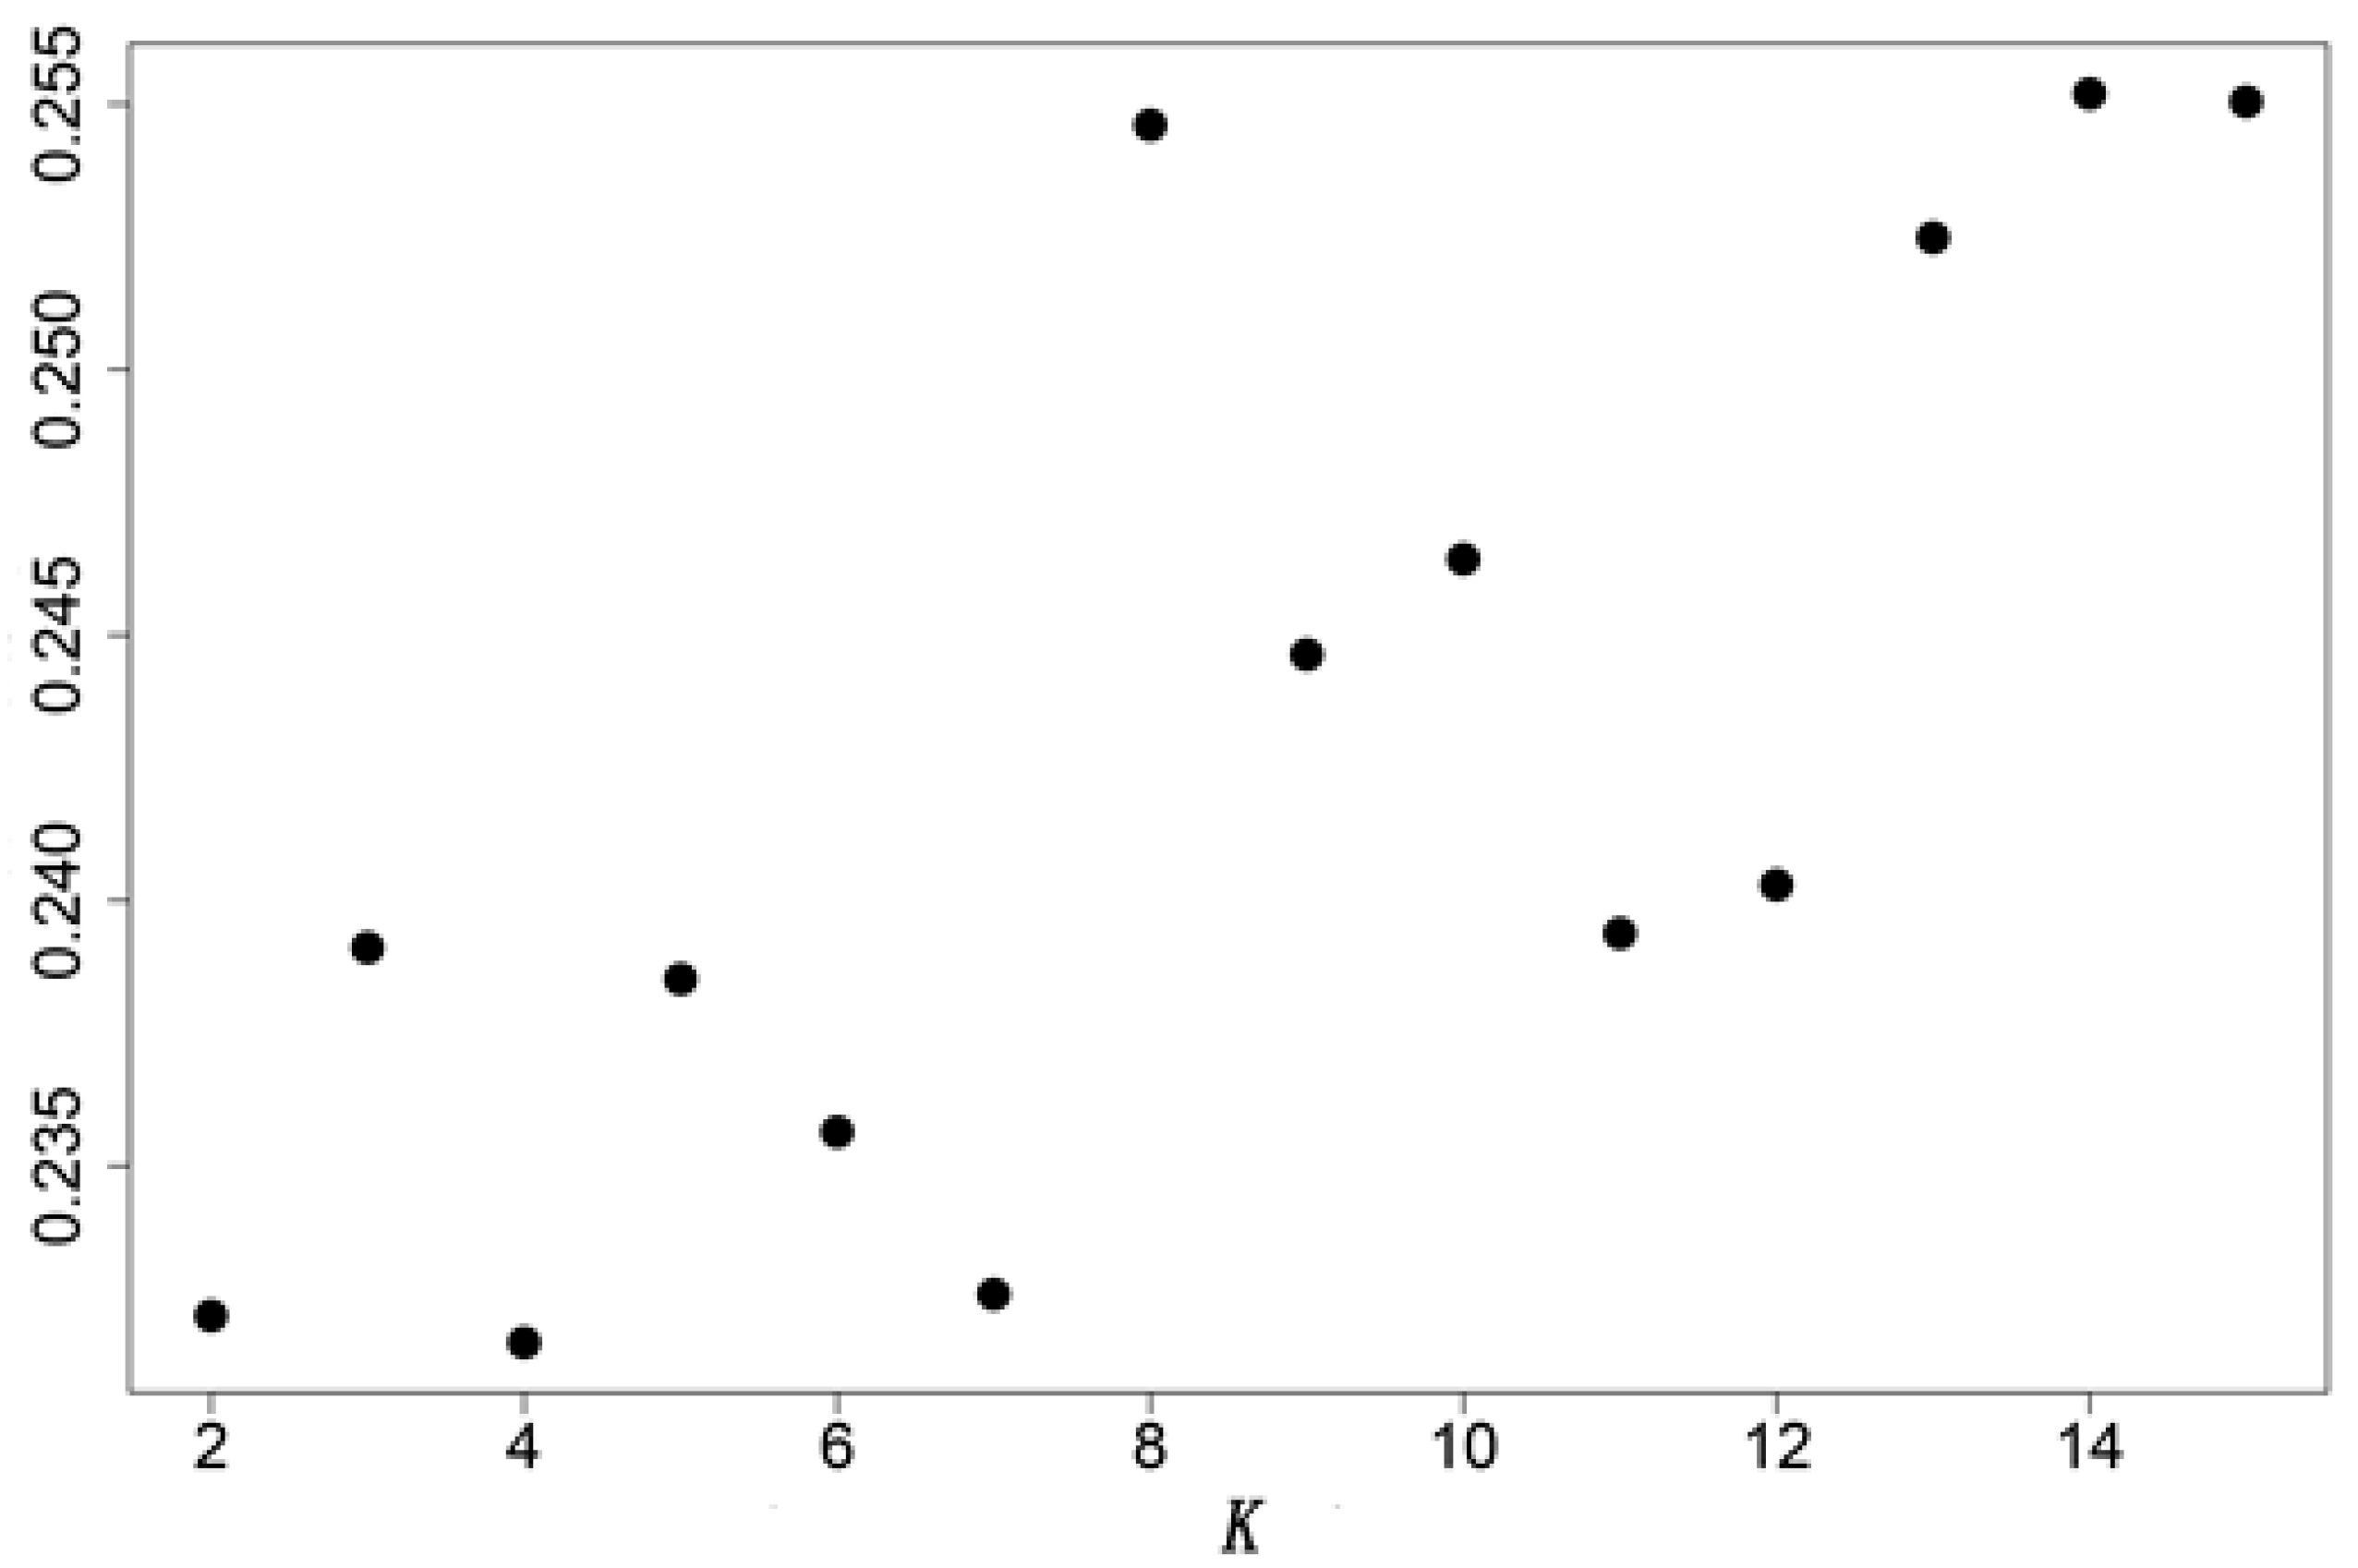
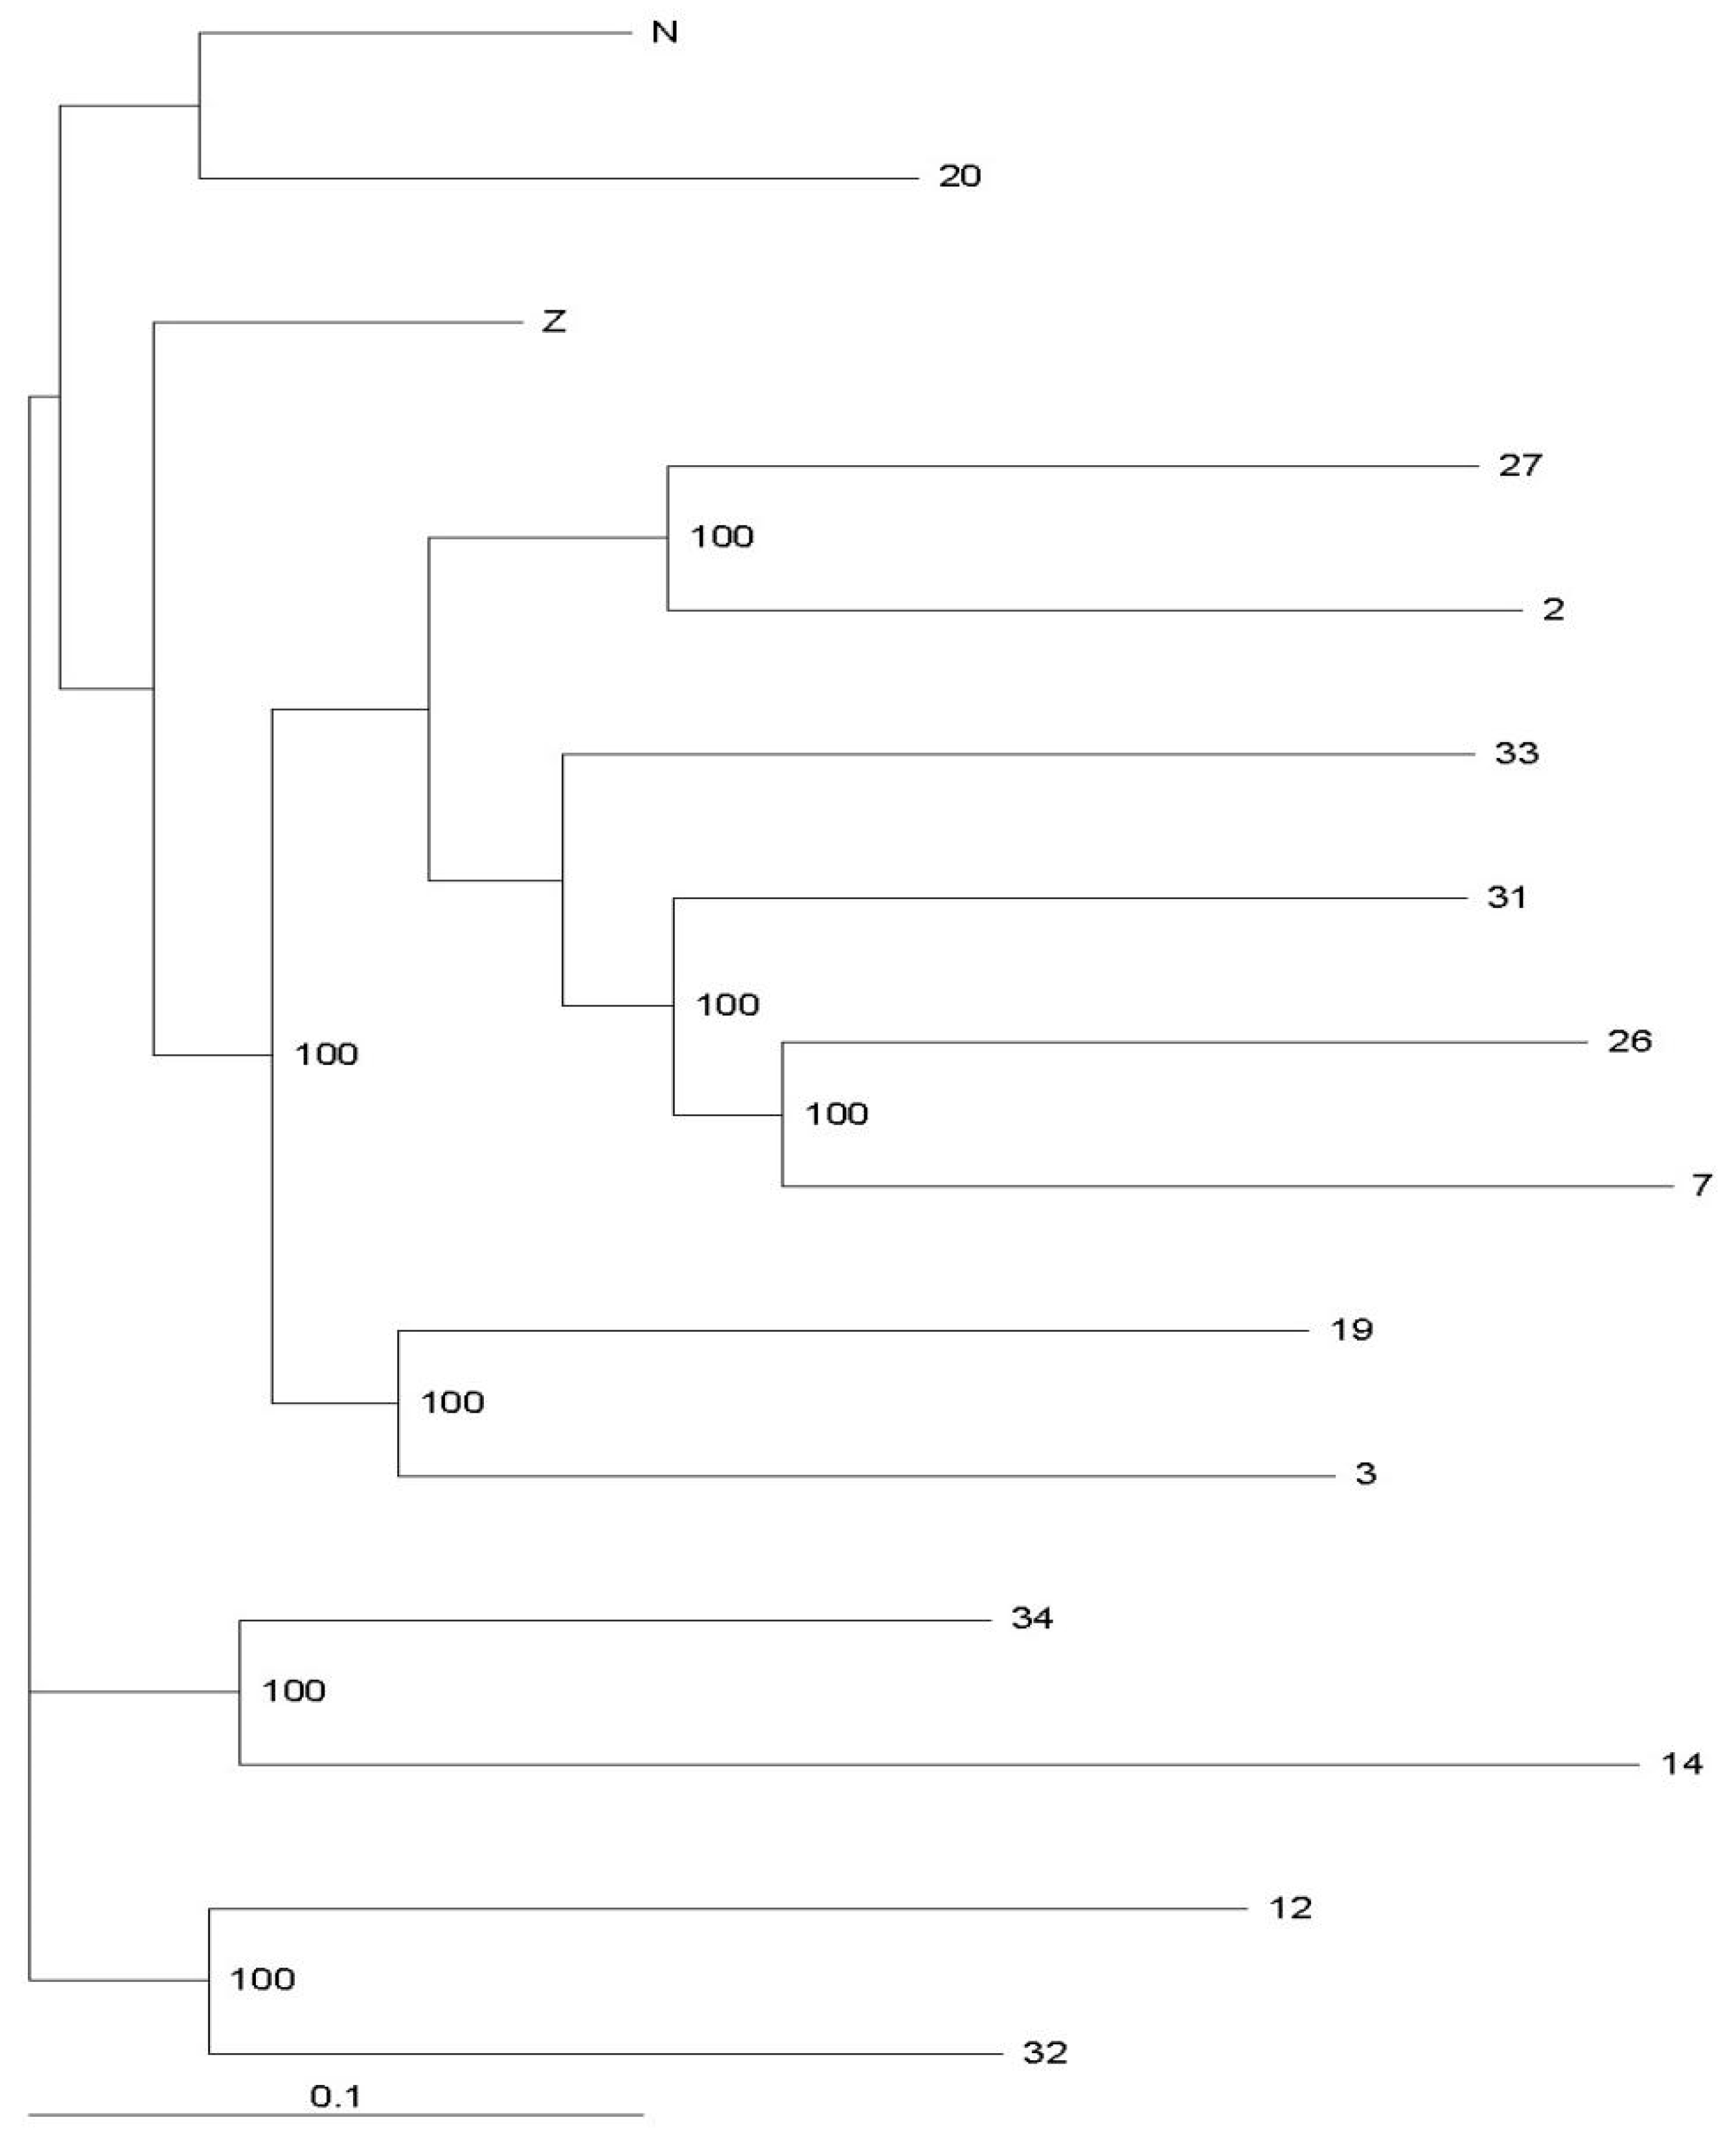
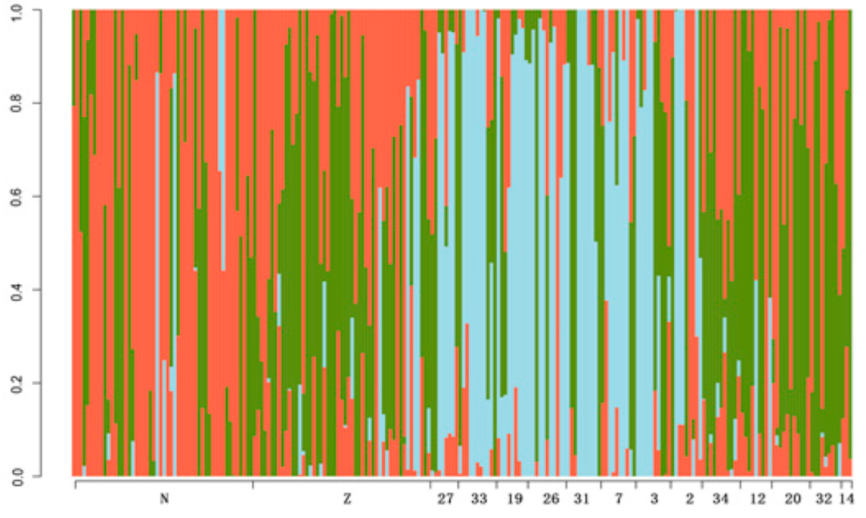
3.2. Genctic Population Structure Analysis for Wild and Bred Populations of P. trituberculatus
4. Discussion
Author Contributions
Funding
Institutional Review Board Statement
Informed Consent Statement
Data Availability Statement
Acknowledgments
Conflicts of Interest
References
- Sakai, T. Crabs of Japan and the Adjacent Seas; Kodansha Ltd.: Tokyo, Japan, 1976; pp. 1–773. [Google Scholar]
- Yang, F.; Xu, H.T.; Dai, Z.M.; Yang, W.J. Molecular characterization and expression analysis of vitellogenin in the marine crab Portunus trituberculatus. Comp. Biochem. Physiol. Part B Biochem. Mol. Biol. 2005, 142, 456–464. [Google Scholar] [CrossRef] [PubMed]
- Dai, A. Primary investigation on the fishery biology of Portunus trituberculatus. Mar. Fish. 1997, 25, 136–141. (In Chinese) [Google Scholar]
- Huang, Q.; Ling, J.; Sheng, F. Composition and distribution of shrimps in the coastal area of the Northern East China Sea in summer. Mar. Fish. 2009, 3, 237–242. (In Chinese) [Google Scholar]
- Bartley, D.M.; Bell, J. Restocking. Stock enhancement, and sea ranching: Arenas of progress. Rev. Fish. Sci. 2008, 16, 357–365. [Google Scholar] [CrossRef]
- Bell, J.D.; Bartley, D.M.; Lorenzen, K.; Loneragan, N.R. Restocking and stock enhancement of coastal fisheries: Potential, problems and progress. Fish. Res. 2006, 80, 1–8. [Google Scholar] [CrossRef]
- Chen, Y. Discussion on the mark method of juvenile crab with Portunus trituberculatus. Fish. Sci. 1991, 10, 26–28. (In Chinese) [Google Scholar]
- Liang, C. A Preliminary Study of the Yangtze River Terrestrial Input Change and Response of the Estuarine Ecological Environment. Master’s Thesis, Chinese Academy of Sciences (Institute of Oceanology), Qingdao, China, 2013. (In Chinese). [Google Scholar]
- Ren, Q.; Xian, W.; Zhang, Y.; Liu, C.; Li, W. Invertebrate assemblage structure associated with key environmental factors in the waters across the Yangtze River Estuary. China. Chin. J. Appl. Ecol. 2018, 29, 3067–3077. (In Chinese) [Google Scholar] [CrossRef]
- Yu, C.; Song, H.; Yao, G. Geographical distribution and faunal analysis of crab resources in the East China Sea. J. Zhejiang Ocean. Univ. 2003, 22, 108–113. (In Chinese) [Google Scholar]
- China Fishery Statistical Yearbook; Ministry of Agriculture and Rural Affairs of the Peoples’ Republic of China: Beijing, China, 2018; pp. 22–27.
- Xu, K.; Zhou, Y.; Zhu, W.; Jiang, R.; Wang, Y.; Li, P.; Zhou, S.; Zhang, Y.; Zhang, H.; Hu, C. Stocking effectiveness of hatchery-released Portunus trituberculatus in the Dongtou sea area of Zhejiang Province. J. Zhejiang Univ. (Agric. Life Sci.) 2018, 44, 373–380. (In Chinese) [Google Scholar] [CrossRef]
- Ortega-Villaizn Romo, M.D.M.; Suzuki, S.; Nakajima, M.; Taniguchi, N. Genetic evaluation of inter individual relatedness for brood stock management of the rare species barfin flounder Verasper moseri using microsatellite DNA markers. Fish. Sci. 2006, 72, 33–39. [Google Scholar] [CrossRef]
- Escalante, M.A.; García-De-León, F.J.; Dillman, C.B.; Anabelia, D.L.S.C.; George, A.; Irene, B.S.; Ruiz-Luna, A.; Mayden, R.L.; Manel, S. Genetic introgression of cultured rainbow trout in the Mexican native trout complex. Conserv. Genet. 2014, 15, 1063–1071. [Google Scholar] [CrossRef]
- Borrell, Y.J.; Alvarez, J.; Blanco, G.; Murguía, A.; Lee, D.; Fernández, C.; Martinez, C.; Cotano, C.; Alvarez, P.; Prado, J. A parentage study using microsatellite loci in a pilot project for aquaculture of the European anchovy Engraulis encrasicolus L. Aquaculture 2011, 310, 305–311. [Google Scholar] [CrossRef]
- Sekino, M.; Hara, M. Microsatellite DNA loci in Pacific abalone Haliotis discus discus (Mollusca, Gastropoda, Haliotidae). Mol. Ecol. Resour. 2010, 1, 8–10. [Google Scholar] [CrossRef]
- Cui, Z.; Liu, Y.; Wang, H.; Wu, D.; Luan, W.; Tan, F.; Huang, M. Isolation and characterization of microsatellites in Portunus trituberculatus. Conserv. Genet. Resour. 2012, 4, 251–255. [Google Scholar] [CrossRef]
- Kellander, M.; Riley, M.; Liu, C. GeneMarker®® Software for Multiplex Ligation-Dependent Probe Amplification (MLPA™); SoftGenetics LLC: State College, PA, USA, 2002. [Google Scholar]
- Francis, C.Y.; Rong, C.Y.; Boyle, T. POPGENE, Microsoft Window-Based Freeware for Population Genetic Analysis; University of Alberta: Edmonton, AB, Canada, 1999. [Google Scholar]
- Goudet, J. FSTAT Version 2.9.3.: A computer program to calculate F-statistics. J. Hered. 1995, 86, 485–486. [Google Scholar] [CrossRef]
- Rousset, F. Genepop’007: A complete reimplementation of the Genepop software for Windows and Linux. Mol. Ecol. Resour. 2008, 8, 103–106. [Google Scholar] [CrossRef]
- Saitou, N.; Nei, M. The neighbor-joining method: A new method for reconstructing phylogenetic trees. Mol. Biol. Evol. 1987, 4, 406–425. [Google Scholar] [CrossRef]
- Felsenstein, J. Confidence limits on phylogenies: An approach using the bootstrap. Evolution 1985, 39, 783–791. [Google Scholar] [CrossRef]
- Oosterhout, C.V.; Hutchinson, W.F.; Wills, D.; Shipley, P. Micro-checker: Software for identifying and correcting genotyping errors in microsatellite data. Mol. Ecol. Notes 2004, 4, 535–538. [Google Scholar] [CrossRef]
- Piry, S.; Luikart, G.; Cornuet, J.M. Computer note. BOTTLENECK: A computer program for detecting recent reductions in the effective size using allele frequency data. J. Hered. 1999, 90, 502–503. [Google Scholar] [CrossRef]
- Peterson, A.C.; Garza, J.C.; Valdes, A.M.; Slatkin, M.; Freimer, N.B. Mutational processes of simple-sequence repeat loci in human populations. Proc. Natl. Acad. Sci. USA 1994, 91, 3166–3170. [Google Scholar] [CrossRef] [Green Version]
- Cornuet, J.M.; Luikart, G. Description and power analysis of two tests for detecting recent population bottlenecks from allele frequency data. Genetics 1996, 144, 2001–2014. [Google Scholar] [CrossRef] [PubMed]
- Luikart, G.; Cornuet, J.M. Empirical evaluation of a test for identifying recently bottlenecked populations from allele frequency data. Conserv. Biol. 1998, 12, 228–237. [Google Scholar] [CrossRef]
- Rice, W.R. Analyzing Tables of Statistical Tests. Evolution 1989, 43, 223–225. [Google Scholar] [CrossRef]
- Frichot, E.; François, O. LEA: An R package for landscape and ecological association studies. Methods Ecol. Evol. 2015, 6, 925–929. [Google Scholar] [CrossRef]
- Boca, S.M.; Huang, L.; Rosenberg, N.A. On the heterozygosity of an admixed population. J. Math. Biol. 2020, 81, 1217–1250. [Google Scholar] [CrossRef]
- Yang, X.; Qian, L.; Wu, H.; Fan, Z.; Wang, C. Population differentiation, bottleneck and selection of Eurasian perch (Perca fluviatilis L.) at the Asian edge of its natural range. Biochem. Syst. Ecol. 2012, 40, 6–12. [Google Scholar] [CrossRef]
- Yu, C.; Song, H.; Yao, G. Assessment of the crab stock biomass in the continental shelf waters of the East China Sea. J. Fish. China 2004, 28, 41–46. (In Chinese) [Google Scholar]
- Sun, Y.; Yan, Y.; Sun, J. Larvae development of the swimming crab Portunus trituberculatus. J. Fish. China 1984, 8, 219–226. (In Chinese) [Google Scholar]
- Kitada, S.; Kishino, H. Lessons learned from Japanese marine finfish stock enhancement programmes. Fish. Res. 2006, 80, 101–112. [Google Scholar] [CrossRef]
- Segovia-Viadero, M.; Serrão, E.; Canteras-Jordana, J.; González-Wanguemert, M. Do hatchery-reared sea urchins pose a threat to genetic diversity in wild populations? Heredity 2016, 116, 378–383. [Google Scholar] [CrossRef] [PubMed] [Green Version]
- Kitada, S. Economic, ecological and genetic impacts of marine stock enhancement and sea ranching: A systematic review. Fish Fish. 2018, 19, 511–532. [Google Scholar] [CrossRef] [Green Version]
- Dong, S.; Kong, J.; Zhang, Q.; Liu, P.; Wang, R. Pedigree tracing of Fenneropenaeus chinensis by microsatellite DNA marker genotyping. Acta Oceanol. Sin. 2006, 5, 151–157. [Google Scholar] [CrossRef]
- Imai, H.; Fujii, Y.; Karakawa, J.; Yamamoto, S.; Numachi, K.I. Analysis of the population structure of the swimming crab, Portunus trituberculatus in the coastal waters of Okayama Prefecture, by RFLPs in the whole region of mitochondrial DNA. Fish. Sci. 1999, 65, 655–656. [Google Scholar] [CrossRef] [Green Version]
- Wang, G.; Jin, S.; Zheng, L.; Chen, Y. Tissue specificity and biochemical genetic analysis of isozyme on cultured Portunus trituberculatus stock. J. Oceanogr. Taiwan Strait 2005, 24, 474–480. [Google Scholar]
- Liu, Y.; Liu, R.; Ye, L.; Liang, J.; Xuan, F.; Xu, Q. Genetic differentiation between populations of swimming crab Portunus trituberculatus along the coastal waters of the East China Sea. Hydrobiologia 2009, 618, 125–137. [Google Scholar] [CrossRef]
- Xu, Q.; Liu, R.; Liu, Y. Genetic population structure of the swimming crab, Portunus trituberculatus in the East China Sea based on mtDNA 16S rRNA sequences. J. Exp. Mar. Biol. Ecol. 2009, 371, 121–129. [Google Scholar] [CrossRef]
- Guo, E.; Liu, Y.; Cui, Z.; Li, X.; Cheng, Y.; Wu, X. Genetic variation and population structure of swimming crab (Portunus trituberculatus) inferred from mitochondrial control region. Mol. Biol. Rep. 2012, 39, 1453–1463. [Google Scholar] [CrossRef]
- Liu, H.; Lv, H.; Cui, F. Parental contribution and genetic diversity between broodstock and offsprings in swimming crab (Portunus trituberculatus) releasing into natural waters. Fish. Sci. 2016, 35, 614–619. (In Chinese) [Google Scholar] [CrossRef]
- Supmee, V.; Sawusdee, A.; Sangthong, P.; Suppapan, J. Population genetic structure of blue swimming crab (Portunus pelagicus) in the Gulf of Thailand. Biodiversitas J. Biol. Divers. 2020, 21, 4260–4268. [Google Scholar] [CrossRef]
- Lee, H.J.; Lee, D.H.; Yoon, S.J.; Kim, D.H.; Kim, S.G.; Hyun, Y.S.; Min, G.S.; Chung, K.W. Characterization of 20 microsatellite loci by multiplex PCR in swimming crab, Portunus trituberculatus. Genes Genom. 2013, 35, 77–85. [Google Scholar] [CrossRef]
- Duan, B.; Liu, W.; Li, S.; Yu, Y.; Guan, Y.; Mu, S.; Li, Z.; Ji, X.; Kang, X. Microsatellite analysis of genetic diversity in wild and cultivated Portunus trituberculatus in Bohai Bay. Mol. Biol. Rep. 2022, 49, 2543–2551. [Google Scholar] [CrossRef] [PubMed]
- Liu, Q.; Cui, F.; Hu, P.; Yi, G.; Ge, Y.; Liu, W.; Yan, H.; Wang, L.; Liu, H.; Song, J. Using of microsatellite DNA profiling to identify hatchery-reared seed and assess potential genetic risks associated with large-scale release of swimming crab, Portunus trituberculatus, in Panjin, China. Fish. Res. 2018, 207, 187–196. [Google Scholar] [CrossRef]
- Duan, B.; Mu, S.; Guan, Y.; Li, S.; Yu, Y.; Liu, W.; Li, Z.; Ji, X.; Kang, X. Genetic diversity and population structure of the swimming crab (Portunus trituberculatus) in China seas determined by genotyping-by-sequencing (GBS). Aquaculture 2022, 555, 738233. [Google Scholar] [CrossRef]
- Dai, A.; Yang, S.; Song, Y. Marine Crabs in China Sea; Marine Publishing Company: Beijing, China, 1986; pp. 194–196. [Google Scholar]
- Xue, J.; Du, N.; Nai, W. The researches on the Portunus trituberculatus in China. East China Sea 1997, 15, 60–64. (In Chinese) [Google Scholar]
- Liu, B.; Zhang, X.; Wang, Z.; Li, W.; Zhang, Q.; Liu, Q.; Liu, W.; Zhang, L.; Liu, Y.; Wang, C. Genetic pattern fluctuations in wild swimming crab populations, under the influence of continuous mass stock enhancement. Fish. Res. 2021, 243, 106075. [Google Scholar] [CrossRef]
- Hui, M.; Shi, G.; Sha, Z.; Liu, Y.; Cui, Z. Genetic population structure in the swimming crab, Portunus trituberculatus and its implications for fishery management. J. Mar. Biol. Assoc. UK 2019, 99, 891–899. [Google Scholar] [CrossRef] [Green Version]


| Location | Geographic Coordinates | Sample Size | Depth (Meters under the Sea) |
|---|---|---|---|
| 2 | 32° N, 122°40′ E | 9 | 34 |
| 3 | 32° N, 123° E | 10 | 39 |
| 7 | 31°45′ N, 123° E | 10 | 34 |
| 12 | 31°30′ N, 122°40′ E | 10 | 27 |
| 14 | 31°30′ N, 123°20′ E | 4 | 32 |
| 19 | 31°15′ N, 123° E | 10 | 44 |
| 20 | 31°15′ N, 123°20′ E | 11 | 54 |
| 26 | 31° N, 123° E | 10 | 59 |
| 27 | 31° N, 123°20′ E | 10 | 62 |
| 31 | 30°45′ N, 122°30′ E | 10 | 11 |
| 32 | 30°45′ N, 122°40′ E | 10 | 33 |
| 33 | 30°45′ N, 123° E | 10 | 50 |
| 34 | 30°45′ N, 123°20′ E | 10 | 55 |
| Locus | Repeat Motif | Primer Sequence (5′-3′) | Tm (°C) | Number of Alleles | Allele Range (bp) |
|---|---|---|---|---|---|
| E17 | (TG)12 | F:ATAAATATCTTGGAAGCCCTCA R:ACGCCACATAGAACACTCACTC | 55 | 7 | 247–301 |
| PN22 | (GT)29 | F:CAATGCGGGATGTAACGG R:CTTGTGGCGGTCGCTTCT | 59 | 11 | 255–307 |
| PN24 | (CA)32 | F:ATAAATATCTTGGAAGCCCTCA R:ATGGCTGTTCCGCTATGC | 55 | 14 | 114–174 |
| H4 | (TC)26 | F:AATCACTTCACTACACCTTTT R:CTTGATGGGTGGCAGTCT | 58 | 12 | 225–325 |
| H20 | (TC)4-(CT)7-(TC)4 | F:GCTTTTCTATTCATCCACCA R:TCCTTTCTATCAGCCACTCA | 58 | 14 | 300–383 |
| P04 | (TG)28 | F:GCCACTATCTTGCTGAGGTTGA R:CCATAGCACGAACACTTTTGA | 60 | 17 | 208–290 |
| Location | Sample Size | Parameter | Locus | Total | Average | |||||
|---|---|---|---|---|---|---|---|---|---|---|
| E17 | PN22 | PN24 | H4 | H20 | P04 | |||||
| N | 52 | Na | 5 | 3 | 21 | 12 | 10 | 13 | 64 | 10.667 |
| Rs | 3.765 | 1.634 | 6.186 | 5.371 | 4.445 | 4.941 | 26.342 | 4.390 | ||
| I | 1.451 | 0.365 | 2.662 | 2.174 | 1.790 | 2.048 | 10.490 | 1.748 | ||
| Ho | 0.942 | 0.000 | 0.923 | 0.647 | 0.577 | 0.192 | 3.282 | 0.547 | ||
| He | 0.748 | 0.179 | 0.922 | 0.878 | 0.798 | 0.841 | 4.366 | 0.728 | ||
| Fis | −0.262 | 1.000 | −0.001 | 0.265 | 0.279 | 0.773 | 2.054 | 0.342 | ||
| Z | 49 | Na | 10 | 2 | 26 | 19 | 16 | 17 | 90 | 15 |
| Rs | 4.105 | 1.507 | 6.841 | 5.730 | 5.450 | 6.264 | 29.897 | 4.983 | ||
| I | 1.671 | 0.283 | 3.022 | 2.481 | 2.306 | 2.631 | 12.394 | 2.066 | ||
| Ho | 0.694 | 0.000 | 0.689 | 0.469 | 0.653 | 0.271 | 2.776 | 0.463 | ||
| He | 0.765 | 0.152 | 0.955 | 0.888 | 0.871 | 0.927 | 4.556 | 0.759 | ||
| Fis | 0.093 | 1.000 | 0.281 | 0.474 | 0.252 | 0.710 | 2.810 | 0.468 | ||
| 2 | 9 | Na | 6 | 2 | 9 | 8 | 11 | 9 | 45 | 7.5 |
| Rs | 4.407 | 1.989 | 7.378 | 6.000 | 6.490 | 5.827 | 32.091 | 5.349 | ||
| I | 1.586 | 0.637 | 2.164 | 2.008 | 2.293 | 2.062 | 10.749 | 1.792 | ||
| Ho | 0.667 | 0.000 | 1.000 | 0.714 | 0.778 | 0.444 | 3.603 | 0.601 | ||
| He | 0.811 | 0.471 | 0.978 | 0.923 | 0.941 | 0.909 | 5.032 | 0.839 | ||
| Fis | 0.186 | 1.000 | −0.026 | 0.241 | 0.182 | 0.526 | 2.109 | 0.352 | ||
| 3 | 10 | Na | 5 | 3 | 12 | 7 | 8 | 9 | 44 | 7.333 |
| Rs | 3.691 | 2.648 | 6.605 | 4.465 | 5.313 | 5.721 | 28.443 | 4.741 | ||
| I | 1.344 | 0.943 | 2.351 | 1.608 | 1.917 | 2.056 | 10.220 | 1.703 | ||
| Ho | 0.700 | 0.000 | 0.778 | 0.300 | 0.500 | 0.400 | 2.678 | 0.446 | ||
| He | 0.732 | 0.611 | 0.941 | 0.774 | 0.879 | 0.900 | 4.836 | 0.806 | ||
| Fis | 0.045 | 1.000 | 0.182 | 0.625 | 0.444 | 0.569 | 2.865 | 0.478 | ||
| 7 | 10 | Na | 7 | 2 | 13 | 9 | 14 | 9 | 54 | 9 |
| Rs | 4.715 | 1.898 | 6.870 | 5.193 | 6.654 | 5.559 | 30.889 | 5.148 | ||
| I | 1.696 | 0.500 | 2.484 | 1.899 | 2.455 | 2.013 | 11.047 | 1.841 | ||
| Ho | 0.800 | 0.000 | 0.900 | 0.600 | 0.900 | 0.300 | 3.500 | 0.583 | ||
| He | 0.811 | 0.337 | 0.958 | 0.847 | 0.937 | 0.890 | 4.779 | 0.796 | ||
| Fis | 0.014 | 1.000 | 0.064 | 0.303 | 0.041 | 0.675 | 2.097 | 0.350 | ||
| 12 | 10 | Na | 6 | 2 | 12 | 8 | 9 | 8 | 45 | 7.5 |
| Rs | 3.970 | 1.400 | 6.788 | 5.622 | 5.456 | 5.873 | 29.109 | 4.852 | ||
| I | 1.407 | 0.199 | 2.399 | 1.909 | 1.983 | 2.043 | 9.939 | 1.657 | ||
| Ho | 0.667 | 0.100 | 0.444 | 0.429 | 0.600 | 0.000 | 2.240 | 0.373 | ||
| He | 0.719 | 0.100 | 0.954 | 0.890 | 0.879 | 0.915 | 4.457 | 0.743 | ||
| Fis | 0.077 | 0.000 | 0.549 | 0.538 | 0.329 | 1.000 | 2.493 | 0.416 | ||
| 14 | 4 | Na | 3 | 1 | 6 | 3 | 4 | 3 | 20 | 3.333 |
| Rs | 3.000 | 1.000 | 6.000 | 3.000 | 4.000 | 3.000 | 20.000 | 3.333 | ||
| I | 1.082 | 0.000 | 1.733 | 0.900 | 1.213 | 1.040 | 5.968 | 0.995 | ||
| Ho | 0.250 | 0.000 | 1.000 | 0.250 | 0.250 | 0.000 | 1.750 | 0.292 | ||
| He | 0.750 | 0.000 | 0.929 | 0.607 | 0.750 | 0.714 | 3.750 | 0.625 | ||
| Fis | 0.700 | NA | −0.091 | 0.625 | 0.700 | 1.000 | 2.934 | 0.587 | ||
| 19 | 10 | Na | 4 | 4 | 14 | 10 | 10 | 11 | 53 | 8.833 |
| Rs | 3.297 | 3.156 | 6.919 | 6.168 | 5.908 | 6.315 | 31.763 | 5.294 | ||
| I | 1.194 | 1.110 | 2.528 | 2.207 | 2.138 | 2.276 | 11.452 | 1.909 | ||
| Ho | 0.700 | 0.300 | 0.800 | 0.800 | 0.600 | 0.300 | 3.500 | 0.583 | ||
| He | 0.695 | 0.642 | 0.958 | 0.926 | 0.911 | 0.932 | 5.063 | 0.844 | ||
| Fis | −0.008 | 0.546 | 0.172 | 0.143 | 0.353 | 0.690 | 1.896 | 0.316 | ||
| 20 | 11 | Na | 5 | 1 | 8 | 9 | 8 | 10 | 41 | 6.833 |
| Rs | 3.322 | 1.000 | 5.353 | 5.361 | 5.172 | 5.966 | 26.174 | 4.362 | ||
| I | 1.225 | 0.000 | 1.930 | 1.927 | 1.895 | 2.174 | 9.150 | 1.525 | ||
| Ho | 0.636 | 0.000 | 0.400 | 0.556 | 0.546 | 0.364 | 2.501 | 0.417 | ||
| He | 0.680 | 0.000 | 0.884 | 0.863 | 0.870 | 0.913 | 4.210 | 0.702 | ||
| Fis | 0.067 | NA | 0.561 | 0.370 | 0.385 | 0.614 | 1.997 | 0.399 | ||
| 26 | 10 | Na | 5 | 2 | 11 | 13 | 10 | 9 | 50 | 8.333 |
| Rs | 3.839 | 1.976 | 6.307 | 6.870 | 5.643 | 5.599 | 30.234 | 5.039 | ||
| I | 1.400 | 0.611 | 2.245 | 2.484 | 2.059 | 2.025 | 10.825 | 1.804 | ||
| Ho | 0.900 | 0.000 | 0.778 | 0.600 | 0.700 | 0.300 | 3.278 | 0.546 | ||
| He | 0.758 | 0.442 | 0.928 | 0.958 | 0.884 | 0.895 | 4.865 | 0.811 | ||
| Fis | −0.200 | 1.000 | 0.170 | 0.386 | 0.217 | 0.677 | 2.250 | 0.375 | ||
| 27 | 10 | Na | 5 | 2 | 10 | 8 | 8 | 8 | 41 | 6.833 |
| Rs | 3.526 | 1.999 | 6.392 | 5.827 | 4.894 | 5.239 | 27.877 | 4.646 | ||
| I | 1.226 | 0.687 | 2.144 | 2.033 | 1.735 | 1.875 | 9.700 | 1.617 | ||
| Ho | 0.333 | 0.000 | 0.857 | 0.556 | 0.889 | 0.333 | 2.968 | 0.495 | ||
| He | 0.660 | 0.523 | 0.923 | 0.915 | 0.797 | 0.869 | 4.688 | 0.781 | ||
| Fis | 0.510 | 1.000 | 0.077 | 0.407 | −0.123 | 0.631 | 2.502 | 0.417 | ||
| 31 | 10 | Na | 4 | 3 | 13 | 6 | 10 | 10 | 46 | 7.667 |
| Rs | 3.047 | 2.298 | 6.708 | 4.244 | 5.805 | 6.168 | 28.270 | 4.712 | ||
| I | 1.106 | 0.687 | 2.441 | 1.540 | 2.108 | 2.207 | 10.090 | 1.682 | ||
| Ho | 0.600 | 0.100 | 0.500 | 0.300 | 0.700 | 0.200 | 2.400 | 0.400 | ||
| He | 0.658 | 0.416 | 0.947 | 0.784 | 0.900 | 0.926 | 4.632 | 0.772 | ||
| Fis | 0.092 | 0.769 | 0.486 | 0.630 | 0.232 | 0.793 | 3.002 | 0.500 | ||
| 32 | 10 | Na | 7 | 1 | 9 | 7 | 12 | 7 | 43 | 7.167 |
| Rs | 4.638 | 1.000 | 5.941 | 4.465 | 6.301 | 5.304 | 27.649 | 4.608 | ||
| I | 1.691 | 0.000 | 2.091 | 1.608 | 2.303 | 1.887 | 9.579 | 1.597 | ||
| Ho | 0.800 | 0.000 | 0.333 | 0.500 | 0.700 | 0.000 | 2.333 | 0.389 | ||
| He | 0.821 | 0.000 | 0.915 | 0.774 | 0.926 | 0.884 | 4.320 | 0.720 | ||
| Fis | 0.027 | NA | 0.650 | 0.366 | 0.254 | 1.000 | 2.297 | 0.459 | ||
| 33 | 10 | Na | 5 | 2 | 9 | 5 | 10 | 8 | 39 | 6.5 |
| Rs | 3.680 | 1.976 | 6.308 | 3.819 | 5.643 | 5.285 | 26.711 | 4.452 | ||
| I | 1.331 | 0.611 | 2.107 | 1.399 | 2.059 | 1.904 | 9.410 | 1.568 | ||
| Ho | 0.600 | 0.000 | 0.429 | 0.556 | 0.500 | 0.100 | 2.184 | 0.364 | ||
| He | 0.721 | 0.442 | 0.934 | 0.771 | 0.884 | 0.868 | 4.621 | 0.770 | ||
| Fis | 0.176 | 1.000 | 0.561 | 0.292 | 0.448 | 0.890 | 3.367 | 0.561 | ||
| 34 | 10 | Na | 6 | 3 | 7 | 6 | 13 | 7 | 42 | 7.000 |
| Rs | 4.226 | 1.800 | 5.978 | 4.755 | 6.708 | 5.304 | 28.771 | 4.795 | ||
| I | 1.543 | 0.394 | 1.834 | 1.631 | 2.441 | 1.887 | 9.731 | 1.622 | ||
| Ho | 0.400 | 0.100 | 0.600 | 0.571 | 0.900 | 0.000 | 2.571 | 0.429 | ||
| He | 0.790 | 0.195 | 0.911 | 0.835 | 0.947 | 0.884 | 4.562 | 0.760 | ||
| Fis | 0.507 | 0.500 | 0.368 | 0.333 | 0.053 | 1.000 | 2.761 | 0.460 | ||
Publisher’s Note: MDPI stays neutral with regard to jurisdictional claims in published maps and institutional affiliations. |
© 2022 by the authors. Licensee MDPI, Basel, Switzerland. This article is an open access article distributed under the terms and conditions of the Creative Commons Attribution (CC BY) license (https://creativecommons.org/licenses/by/4.0/).
Share and Cite
Yue, L.; Wang, Y.; Xian, W.; Zhang, H. Genetic Diversity and Population Structure of Portunustrituberculatus in Released and Wild Populations Based on Microsatellite DNA Markers from the Yangtze Estuary. Diversity 2022, 14, 374. https://doi.org/10.3390/d14050374
Yue L, Wang Y, Xian W, Zhang H. Genetic Diversity and Population Structure of Portunustrituberculatus in Released and Wild Populations Based on Microsatellite DNA Markers from the Yangtze Estuary. Diversity. 2022; 14(5):374. https://doi.org/10.3390/d14050374
Chicago/Turabian StyleYue, Longtao, Yibang Wang, Weiwei Xian, and Hui Zhang. 2022. "Genetic Diversity and Population Structure of Portunustrituberculatus in Released and Wild Populations Based on Microsatellite DNA Markers from the Yangtze Estuary" Diversity 14, no. 5: 374. https://doi.org/10.3390/d14050374
APA StyleYue, L., Wang, Y., Xian, W., & Zhang, H. (2022). Genetic Diversity and Population Structure of Portunustrituberculatus in Released and Wild Populations Based on Microsatellite DNA Markers from the Yangtze Estuary. Diversity, 14(5), 374. https://doi.org/10.3390/d14050374