
High Conservation Value of an Urban Population of a State-Endangered Turtle


Abstract
:1. Introduction
2. Materials and Methods
2.1. Study Species
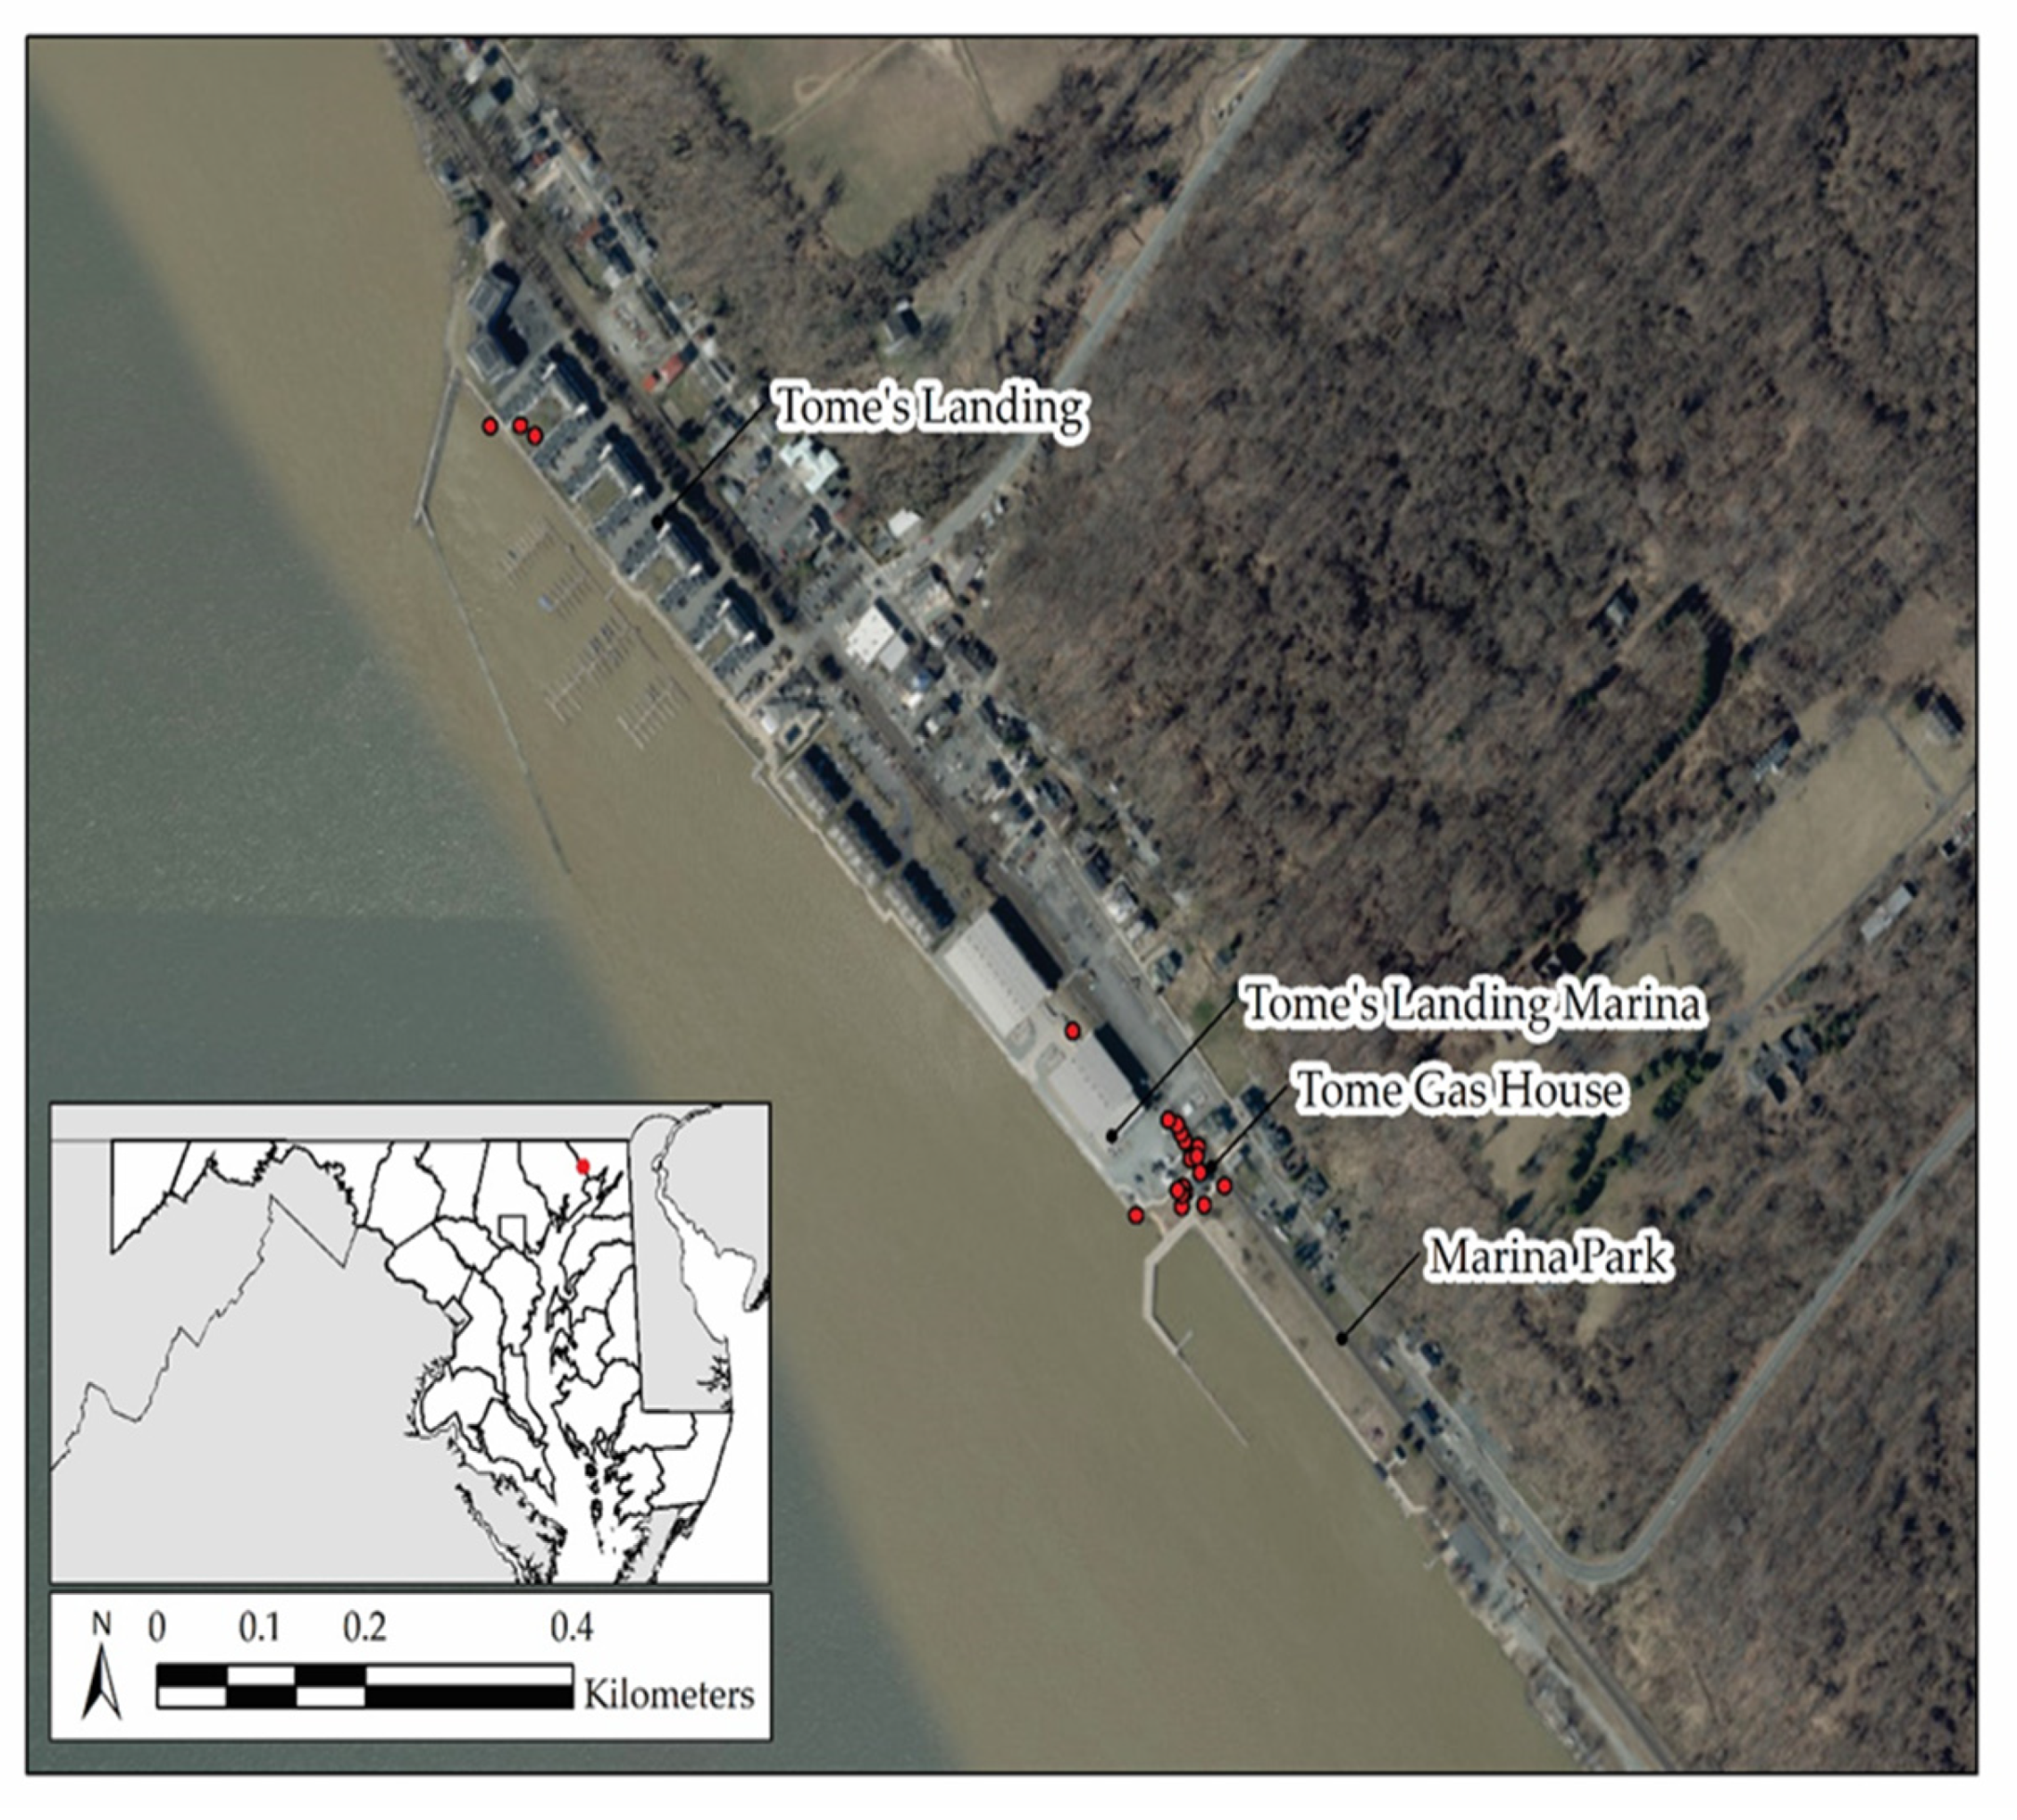
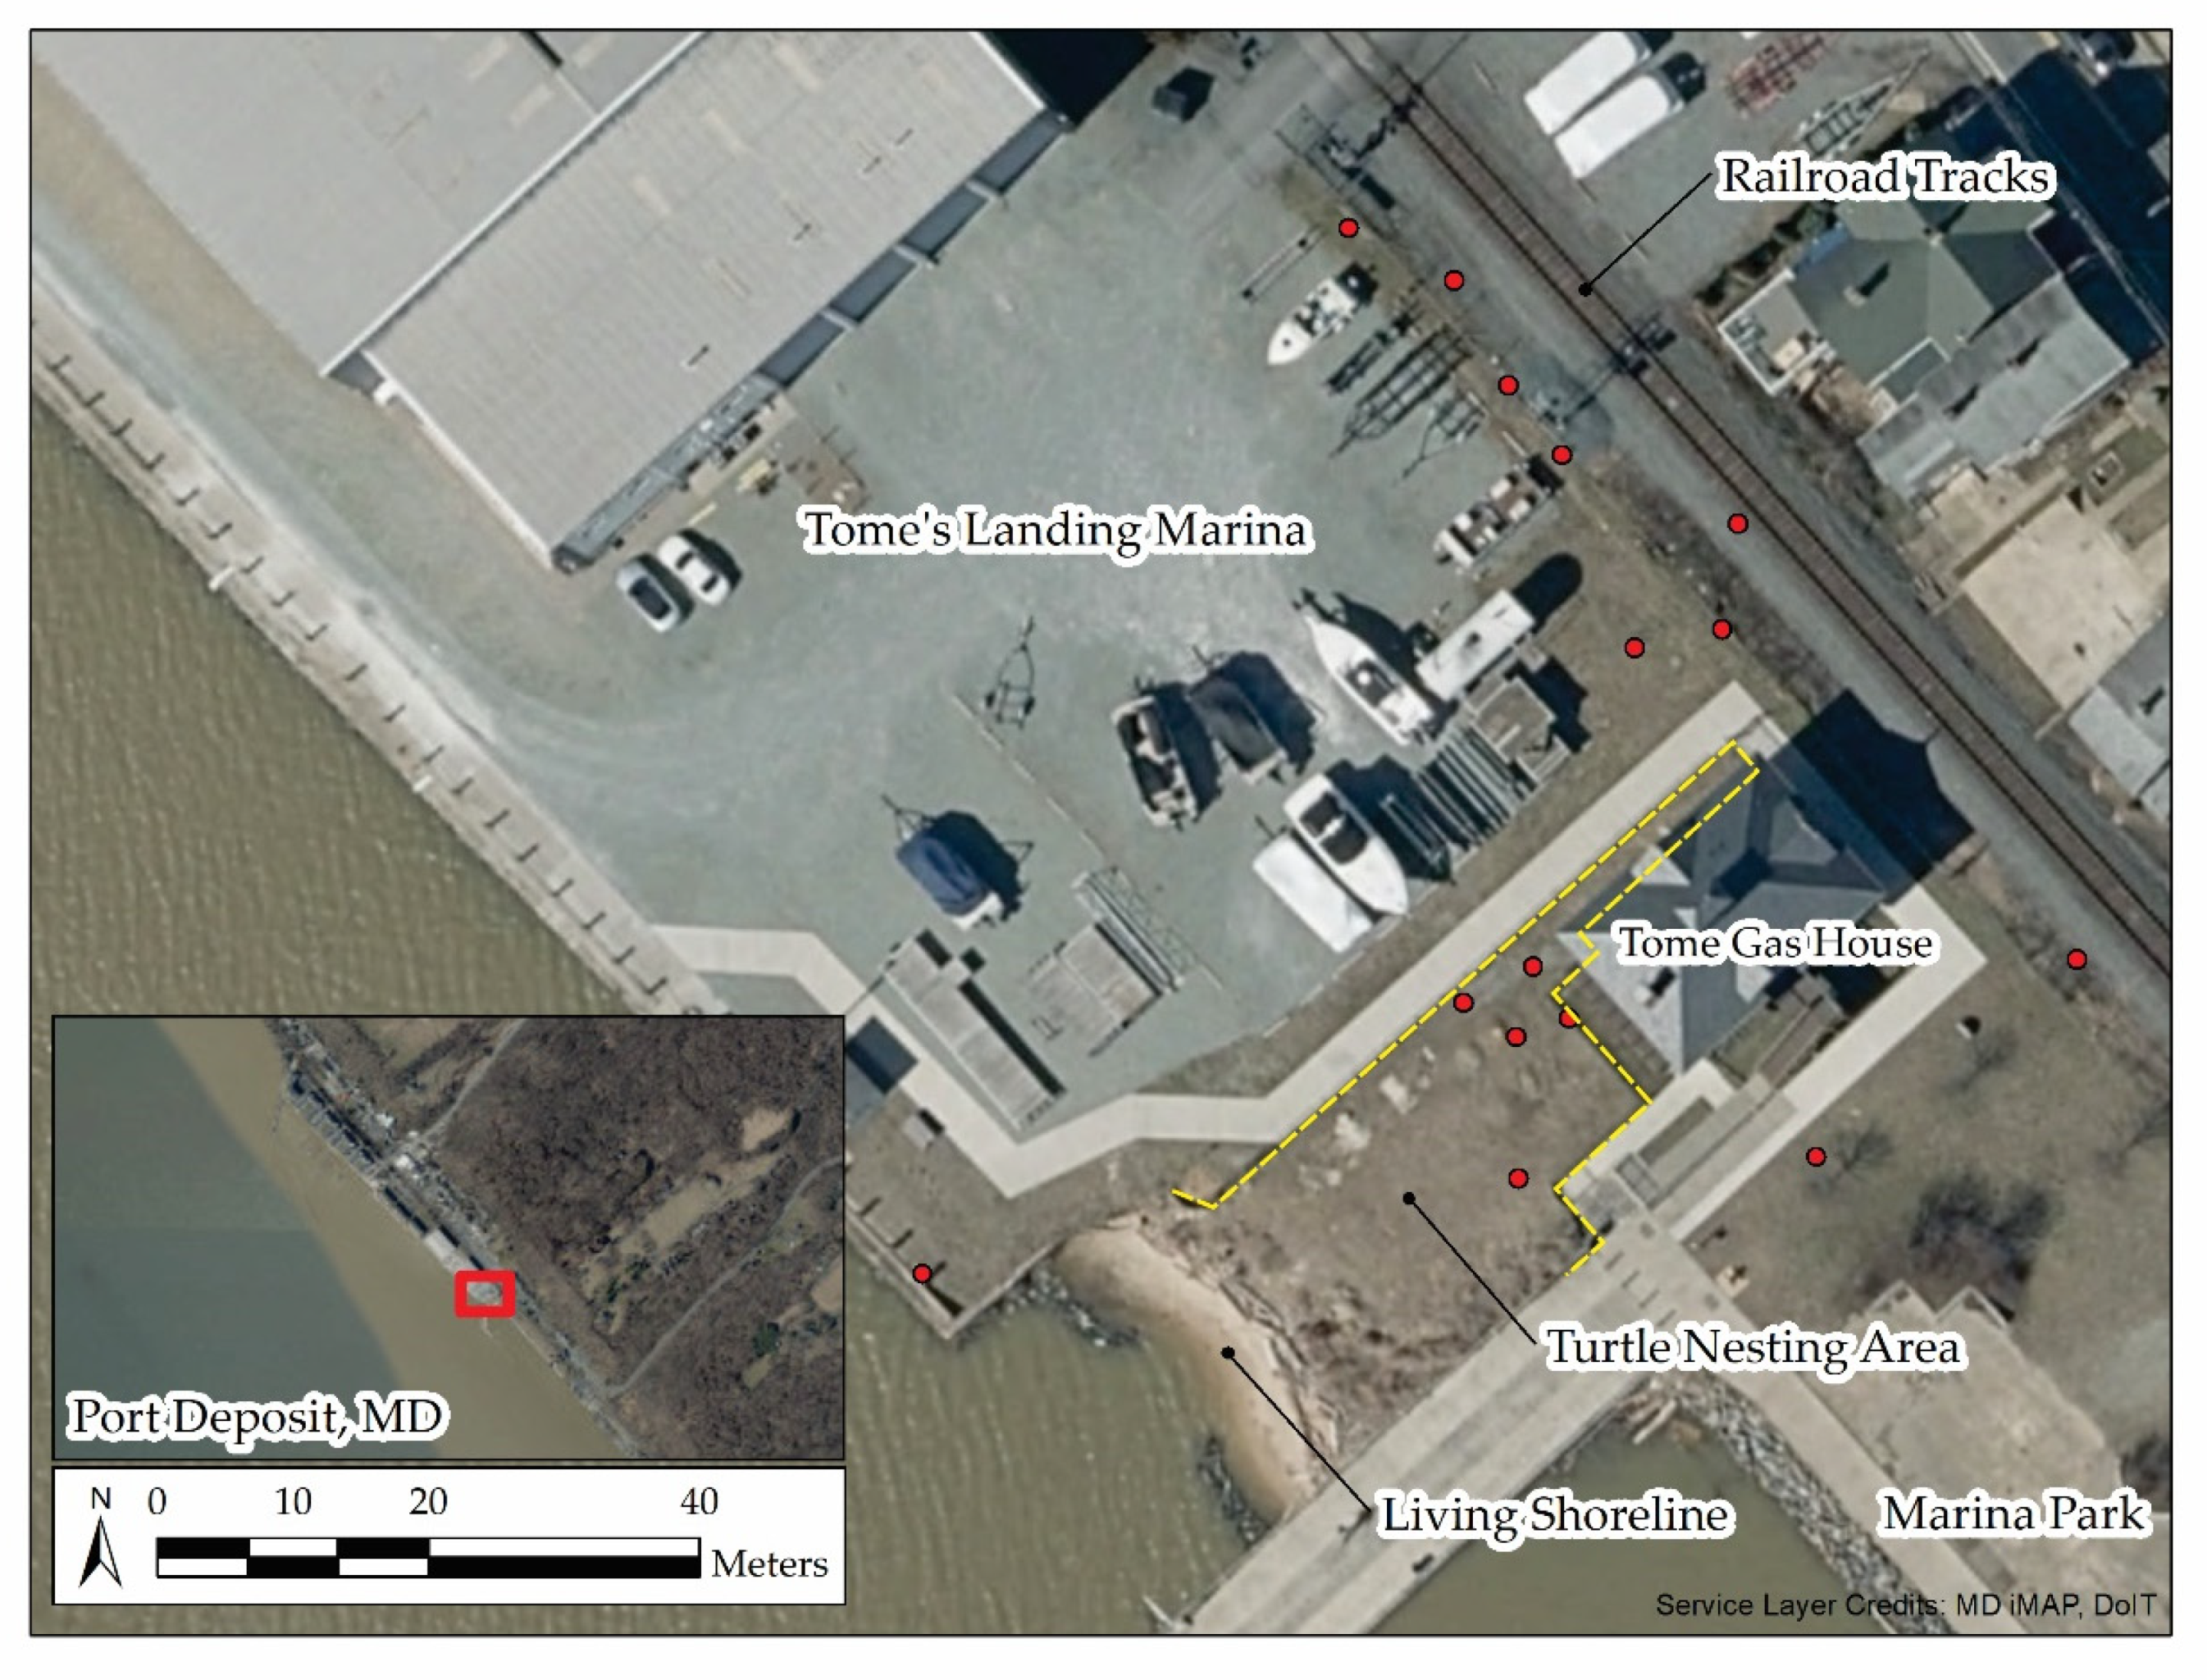
2.2. Study Area
2.3. Observations of Nesting
2.4. Handling and Marking
2.5. Population Size and Survival
3. Results
3.1. Timing of Nesting, Nesting Effort, and Population Characterization
3.2. Population Size and Survival Estimates
3.3. Nest Location and Success
3.4. Disturbances from Residents and Visitors
4. Discussion
4.1. Persistence of a Nesting Population in an Urban Environment
4.2. Importance to Population Viability
4.3. Constraints of Nesting in an Urban Environment
4.4. Comparisons with Other Populations
Supplementary Materials
Author Contributions
Funding
Institutional Review Board Statement
Informed Consent Statement
Data Availability Statement
Acknowledgments
Conflicts of Interest
References
- Gibbons, J.W.; Scott, D.E.; Ryan, T.J.; Buhlmann, K.A.; Tuberville, T.D.; Metts, B.S.; Greene, J.L.; Mills, T.; Leiden, Y.; Poppy, S.; et al. The global decline of reptiles, deja vu amphibians. Bioscience 2000, 50, 653–656. [Google Scholar] [CrossRef] [Green Version]
- Lovich, J.E.; Ennen, J.R.; Agha, M.; Gibbons, J.W. Where have all the turtles gone, and why does it matter? BioScience 2018, 68, 771–781. [Google Scholar] [CrossRef] [Green Version]
- Mitchell, J.C.; Klemens, M.W. Primary and Secondary Effects of Habitat Alteration. In Turtle Conservation; Klemens, M.W., Ed.; Smithsonian Institution Press: Washington, DC, USA, 2000; pp. 5–32. [Google Scholar]
- Byer, N.W.; Smith, S.A.; Seigel, R.A. Microgeographic variation in bog turtle nesting ecology. J. Herpetol. 2018, 52, 228–233. [Google Scholar] [CrossRef]
- Valenzuela, N.; Literman, R.; Neuwald, J.L.; Mizoguchi, B.; Iverson, J.B.; Riley, J.L.; Litzgus, J.D. Extreme thermal fluctuations from climate change unexpectedly accelerate demographic collapse of vertebrates with temperature-dependent sex determination. Sci. Rep. 2019, 9, 4254. [Google Scholar] [CrossRef] [PubMed] [Green Version]
- Steen, D.A.; Gibbs, J.P. Effects of roads on the structure of freshwater turtle populations. Conserv. Biol. 2004, 18, 1143–1148. Available online: http://www.jstor.org/stable/3589187 (accessed on 14 March 2022). [CrossRef]
- Moore, M.J.C.; Seigel, R.A. No place to nest or bask: Effects of human disturbance on the nesting and basking habits of yellow-blotched map turtles (Graptemys flavimaculata). Biol. Conserv. 2006, 130, 386–393. [Google Scholar] [CrossRef]
- Howell, H.J.; Seigel, R.A. The effects of road mortality on small, isolated turtle populations. J. Herpetol. 2019, 53, 39–46. [Google Scholar] [CrossRef]
- Mitchell, J.C.; Brown, R.E.J.; Bartholomew, B. (Eds.) Urban Herpetology; Society for the Study of Amphibians and Reptiles: Salt Lake City, UT, USA, 2008. [Google Scholar]
- Vanek, J.; Glowacki, G. Assessing the impacts of urbanization on sex ratios of painted turtles (Chrysemys picta). Diversity 2019, 11, 72. [Google Scholar] [CrossRef] [Green Version]
- Garber, S.D.; Burger, J. A 20-yr study documenting the relationship between turtle decline and human recreation. Ecol. Appl. 1995, 5, 1151–1162. [Google Scholar] [CrossRef]
- Knight, A.W.; Gibbons, J.W. Food of a painted turtle, Chrysemys picta in a polluted river. Am. Midl. Nat. 1968, 80, 558–562. [Google Scholar] [CrossRef]
- Lindeman, P.V. Comparative life history of painted turtle (Chrysemys picta) in two habitats in the inland Pacific Northwest. Copeia 1996, 1, 114–130. [Google Scholar] [CrossRef]
- Souza, F.L.; Abe, A.S. Feeding ecology, density and biomass of the freshwater turtle, Phrynops geoffroanus, inhabiting a polluted urban river in south-eastern Brazil. J. Zool. Soc. Lond. 2000, 252, 437–446. [Google Scholar] [CrossRef]
- Spinks, P.Q.; Pauly, G.B.; Crayon, J.J.; Shaffer, H.B. Survival of the western pond turtle (Emys marmorata) in an urban California environment. Biol. Conserv. 2003, 113, 257–267. [Google Scholar] [CrossRef] [Green Version]
- Plummer, M.V.; Mills, N.E. Structure of an Urban Population of Softshell Turtles (Apalone spinifera) Before and After Severe Stream Alterations. In Urban Herpetology; Mitchell, J.C., Brown, R.E.J., Bartholomew, B., Eds.; Society for the Study of Amphibians and Reptiles: Salt Lake City, UT, USA, 2008; pp. 95–105. [Google Scholar]
- Ryan, T.J.; Conner, C.A.; Douthitt, B.A.; Sterrett, S.C.; Salsbury, C.M. Movement and habitat use of two aquatic turtles. Urban Ecosyst. 2008, 11, 213–225. [Google Scholar] [CrossRef]
- Foley, S.M.; Price, S.J.; Dorcas, M.E. Nest-site selection and nest depredation of semi-aquatic turtles on golf courses. Urban Ecosys. 2012, 15, 489–497. [Google Scholar] [CrossRef]
- Powell, R.; Conant, R.; Collins, J.T. Peterson Field Guide to Reptiles and Amphibians of Eastern and Central North America; Houghton Mifflin: Boston, MA, USA, 2014. [Google Scholar]
- Lindeman, P.V. The Map Turtle and Sawback Atlas: Ecology, Evolution, Distribution, and Conservation; University of Oklahoma Press: Norman, OK, USA, 2013. [Google Scholar]
- Vogt, R.C.; Bulté, G.; Iverson, J.B. Graptemys geographica (LeSueur 1817)—Northern Map Turtle, Common Map Turtle. Chelonian Res. Monogr. 2018, 104, 1–18. [Google Scholar] [CrossRef]
- Richards-Dimitrie, T.; Temple-Miller, K.G.; Roosenburg, W.M. Northern Map Turtle. In Reptiles of Ohio; Davis, J.G., Lipps, G., Jr., Wynn, D., Armitage, B.J., Matson, T.O., Pfingsten, R.A., Caldwell, C., Eds.; Ohio Biological Survey: Columbus, OH, USA, 2021; pp. 179–200. [Google Scholar]
- Richards-Dimitrie, T.M. Spatial Ecology and Diet of Maryland Endangered Northern Map Turtles (Graptemys geographica) in an Altered River System: Implications for Conservation and Management. Master’s Thesis, Towson University, Towson, MD, USA, 2011. [Google Scholar]
- Richards-Dimitrie, T.; Gresens, S.E.; Smith, S.A.; Seigel, R.A. Diet of Northern Map Turtles (Graptemys geographica): Sexual differences and potential impacts of an altered river system. Copeia 2013, 2013, 477–484. [Google Scholar] [CrossRef]
- Ernst, C.H.; Barbour, R.W.; Hershey, M.F. A new coding system for hardshelled turtles. Trans. Ky. Acad. Sci. 1974, 35, 27–28. [Google Scholar]
- Anderson, K.P.; Byer, N.W.; McGehee, R.J.; Richards-Dimitrie, T. A new system for marking hatchling turtles using visible implant elastomer. Herpetol. Rev. 2015, 46, 25–27. [Google Scholar]
- White, G.C.; Burnham, K.P. Program MARK: Survival estimation from populations of marked animals. Bird Study 1999, 46, S120–S139. [Google Scholar] [CrossRef]
- Marchand, M.N.; Litvaitis, J.A. Effects of habitat feature and land-scape composition on the population structure of a common aquatic turtle in a region undergoing rapid development. Conserv. Biol. 2004, 18, 758–767. [Google Scholar] [CrossRef]
- Bowne, D.; Cosentino, B.; Anderson, L.; Bloch, C.P.; Cooke, S.; Crumrine, P.; Dallas, J.; Doran, A.; Dosch, J.; Druckenbrod, D.; et al. Effects of urbanization on the population structure of freshwater turtles across the United States. Conserv. Biol. 2018, 46, 1150–1161. [Google Scholar] [CrossRef] [PubMed]
- Lambert, M.R.; Steen, D.A. Reexamining effects of urbanization on population structure of freshwater turtles: Response to Bowne et al. Conserv. Biol. 2019, 33, 1193–1196. [Google Scholar] [CrossRef]
- Jones, R.L. Long-term trends in ringed sawback (Graptemys oculifera): Growth, survivorship, sex ratios, and population sizes in the Pearl River, Mississippi. Chelonian Conserv. Biol. 2017, 16, 215–228. [Google Scholar] [CrossRef]
- Bulté, G.; Blouin-Demers, G. Does sexual bimaturation affect the cost of growth and the operational sex ratio in an extremely size-dimorphic reptile? Ecoscience 2009, 16, 175–182. [Google Scholar] [CrossRef]
- Bulté, G.; Carriére, M.A.; Blouin-Demers, G. Impact of recreational power boating on two populations of northern map turtles (Graptemys geographica). Aquat. Conserv. Mar. Freshw. Ecosyst. 2010, 20, 31–38. [Google Scholar] [CrossRef]
- Nagle, R.D.; Lutz, C.L.; Pyle, A.L. Overwintering in the nest by hatchling map turtles (Graptemys geographica). Can. J. Zool. 2004, 82, 1211–1218. [Google Scholar] [CrossRef]
- Nagle, R.D.; Congdon, J.D. Reproductive ecology of Graptemys geographica of the Juniata River in central Pennsylvania, with recommendations for conservation. Herpetol. Conserv. Biol. 2016, 11, 232–243. [Google Scholar]
- Freedberg, S.; Ewert, M.A.; Ridenhour, B.J.; Neiman, M.; Nelson, C.E. Nesting fidelity and molecular evidence for natal homing in the freshwater turtle, Graptemys kohnii. Proc. Biol. Sci. 2005, 272, 1345–1350. [Google Scholar] [CrossRef] [Green Version]


| Year | No of Females | No of Nests | Predation % | Nest Success |
|---|---|---|---|---|
| 2009 | 3 | - | - | - |
| 2010 | 2 | - | - | - |
| 2011 | 4 | 5 | 0% | 100% |
| 2012 | 7 | 4 | 0% | 100% |
| 2013 | 9 | 8 | 0% | 100% |
| 2014 | 6 | 7 | 0% | 100% |
| 2015 | 11 | 8 | 0% | 50% |
| 2017 | 8 | 2 | 0% | 100% |
| 2018 | 7 | 6 | 0% | 100% |
| Model | AICc | DeltaAICc | AICc Wt. | #No of Para. | Deviance |
|---|---|---|---|---|---|
| {Phi(t)p(.)pent(.)N(.)} | 4332.6402 | 0.0000 | 0.5000 | 11 | 4188.9071 |
| {Phi(t)p(.)pent(.)N(t)} | 4332.6402 | 0.0000 | 0.5000 | 11 | 4188.9071 |
| {Phi(t)p(.)pent(t)N(.)} | 4356.2622 | 23.6220 | 0.0000 | 18 | 4186.0426 |
| {Phi(t)p(.)pent(t)N(t)} | 4356.2622 | 23.6220 | 0.0000 | 18 | 4186.0426 |
| {Phi(.)p(.)pent(.)N(.)} | 7113.1043 | 2780.4641 | 0.0000 | 4 | 6988.5869 |
| {Phi(.)p(.)pent(.)N(t)} | 7113.1043 | 2780.4641 | 0.0000 | 4 | 6988.5869 |
| 2013 | 2014 | 2015 |
|---|---|---|
| 1.06 | 62.4 | 19.0 |
| 31.6 | 7.6 | 19.6 |
| 47.9 | 14.7 | 22.0 |
| 50.4 | 41.9 | 22.1 |
| 59.7 | 59.7 | 23.2 |
| 53.8 | 40.5 | 4.3 |
| 57.4 | 60.3 | 9.5 |
| 52.9 | - | 18.0 |
| Mean: 44.3 ± 6.88 m | 41.0 ± 8.43 m | 17.2 ± 2.38 m |
Publisher’s Note: MDPI stays neutral with regard to jurisdictional claims in published maps and institutional affiliations. |
© 2022 by the authors. Licensee MDPI, Basel, Switzerland. This article is an open access article distributed under the terms and conditions of the Creative Commons Attribution (CC BY) license (https://creativecommons.org/licenses/by/4.0/).
Share and Cite
Durkin, B.P.; Richards-Dimitrie, T.M.; Anderson, K.P.; Howell, H.J.; Seigel, R.A. High Conservation Value of an Urban Population of a State-Endangered Turtle. Diversity 2022, 14, 354. https://doi.org/10.3390/d14050354
Durkin BP, Richards-Dimitrie TM, Anderson KP, Howell HJ, Seigel RA. High Conservation Value of an Urban Population of a State-Endangered Turtle. Diversity. 2022; 14(5):354. https://doi.org/10.3390/d14050354
Chicago/Turabian StyleDurkin, Brian P., Teal M. Richards-Dimitrie, Kaite P. Anderson, Hunter J. Howell, and Richard A. Seigel. 2022. "High Conservation Value of an Urban Population of a State-Endangered Turtle" Diversity 14, no. 5: 354. https://doi.org/10.3390/d14050354
APA StyleDurkin, B. P., Richards-Dimitrie, T. M., Anderson, K. P., Howell, H. J., & Seigel, R. A. (2022). High Conservation Value of an Urban Population of a State-Endangered Turtle. Diversity, 14(5), 354. https://doi.org/10.3390/d14050354