Article

Impact of Invasive Weeds on the Diversity and Dissimilarity of Bird Communities in Forested Areas

by
Emilia Grzędzicka
Institute of Systematics and Evolution of Animals, Polish Academy of Sciences, Sławkowska 17, 31-016 Kraków, Poland
Diversity 2022, 14(3), 229; https://doi.org/10.3390/d14030229
Submission received: 2 February 2022 / Revised: 14 March 2022 / Accepted: 18 March 2022 / Published: 20 March 2022
(This article belongs to the Special Issue Birds in Temperate and Tropical Forests)

Abstract

:
Caucasian hogweeds, mainly the Sosnowsky’s hogweed Heracleum sosnowskyi and the giant hogweed Heracleum mantegazzianum, create one of the most problematic plant invasions in the world. Due to their large size (weeds reaching 4–5 meters in height), they seem to be herbaceous plants that can threaten birds living in forest stands. This research quantified the structure and diversity of the forest birds’ community in forests with varying areas of invasive hogweeds located in south-eastern Poland. Changes in the accompanying non-forest birds’ community were also assessed. The study addressed the following questions: 1. How does the invaded area correlate with the abundance of forest birds? 2. How do communities and species respond to invaded vegetation? 3. How do the invading plants affect the various types of diversity of forest and non-forest birds? It turned out that both surveyed bird communities had a lower alpha diversity in invaded sites. Only forest birds, not able to change their location easily, formed a unique community (i.e., had a higher beta diversity) near invaders. Forest birds showed unchanged functional diversity based on the relative bird abundance and their connection, or lack of it, with the forest development phases. The effect of hogweeds on the abundance of forest birds was more negative in severely invaded areas with anthropogenic habitats. Non-forest birds showed higher species loss near the invasion, constant beta diversity and decreased functional diversity. This study is important as the forest is a climax community in the temperate zone, and unused open areas become spontaneously overgrown with young forests. Weeds disseminating after crop abandonment can highly and commonly affect forest and non-forest bird communities co-occurring in this type of overgrowing area.

1. Introduction

Biological invasions are among the biggest environmental problems threatening global biodiversity, believed to be the second-largest cause of modern biodiversity loss after habitat destruction [1]. Invasion science is becoming an increasingly important interdisciplinary field that treats invaded areas as a system for testing fundamental hypotheses for applied ecology [2,3]. Alien invasive plants can alter the abundance, species richness and diversity of natives, as well as accompanying ecosystem processes and functions [4,5,6]. The overall goal of any invader’s management seems to be restoring a particular affected ecosystem service, functional trait, species diversity, community structure or abundance of protected species [7]. The biggest challenge in the field of invasion ecology is the high complexity of the ecosystems where both biotic and abiotic factors determine the impacts of invasions. There is a need to study complex changes in native communities facing invasions, as well as in the surrounding environment, concerning the richness and diversity of natives to learn about the mechanisms of the invasion impacts to adjust the strategy of removing the invading species.
Previous studies concerned the impact of invasions in severely invaded areas and tested environmental changes by studying invaders significantly altering given ecosystems, such as invading herbaceous plants in the meadows [8]. This assumption attempted to test the diversity-stability hypothesis [9], the diversity-invasibility hypothesis [10,11,12,13] and gave tools for the management of invasive plants in open areas [14]. However, this means that the impacts of alien weeds were assessed mainly in the environments where native species, for example, those connected with meadows, quickly lose their habitat without adaptations when facing herbaceous invaders. Research should be conducted on the influence of those invaders on native communities, which react weakly to the invasion or face it at the initial stages of its severity. This study aimed to investigate the unknown impact of the invasive weeds on the community, where they theoretically should not threaten the crucial natives, as not changing the main vegetation physiognomy. Specifically, the unexplored impact of invasive herbaceous weeds growing in wooded areas on forest bird communities was checked.
Forests are increasingly affected by biological invasions. Species invading forests include both woody and herbaceous plants [15], although so far mainly woody invasive plants have been the subject of research in this respect [16,17,18]. The example invasion impact on canopy birds, aerial foragers and ground nesters was negative, although shrub nesters showed a positive response to invaded vegetation [19]. Herbaceous plants have usually not been considered as potentially threatening biodiversity in forests, although, for example, it was shown that bird species diversity, species richness and abundance were lower at high densities of herbaceous Lantana plants [20]. This is because the role of herbaceous plants in forest communities connected with the stand is usually treated as small, as their development in the lowest part of the forest can be suppressed by shrubs and trees. However, their role may be downplayed. An example is the large Caucasian hogweeds—herbaceous plants reaching 4–5 meters in height that have great potential to affect forest communities. Two Caucasian hogweeds common in Europe have been indicated as negatively affecting forest communities—the giant hogweed Heracleum mantegazzianum [15] and the Sosnowsky’s hogweed Heracleum sosnowskyi—the second one already known as negatively affecting the abundance of tree birds [21], as well as tree/bush insectivorous birds [22].
The other threats to forest biodiversity include fragmentation reducing the forest sizes, as well as their increasingly frequent division by roads [23]. These are threats of anthropogenic origin, most common in suburban and rural lands confirming that land-use changes are among threats to biodiversity [24,25]. The suburban zones and rural lands are appropriate for many weeds, including invasive Caucasian hogweeds [26,27,28]. Sosnowsky’s hogweed and giant hogweed were planted as crops but recently (during about the last 30 years of the invasion) started to form problematic populations supported by the elements of anthropogenic origin [28,29]. The presented research identified whether the impact of these herbaceous invasive plants concerns forest birds.
As mentioned, the influence of invasive plants is reflected not only in the modified species richness and abundance but also in the ecosystem processes and functions [4,5,6], which constitutes the wider background to species changes. The mean species richness on a given site is alpha diversity, while richness differentiated between environments is beta diversity. This study assessed not only species richness on sites (alpha diversity) but also the beta diversity of bird communities between environments (forested and others). Due to the impact of invaders on entire ecosystems in the meaning of the sites’ systems, there is a need to study the impact of invasion on both alpha and beta diversity, because these measures are related. Moreover, biodiversity and its threats are organized into multiple, partly orthogonal facets, and relying on the species richness alone is insufficient [30,31]. Thus, this study also analyzed changes in functional diversity. Functional diversity, treated as the diversity of traits within the community, is a modern way to incorporate species’ ecological characteristics into biodiversity assessment [32,33,34]. This approach is based on the assumption that ecological traits (species characteristics that describe their relationships with the environment) are related to ecosystem processes and services [35,36]. Functional diversity also varies over anthropogenic changes, revealing the imprint of niche-related processes on biodiversity patterns [37,38,39]. Here, the influence of the invasive weeds’ presence on the functional diversity reflected by the forest and non-forest species relative abundance and occurrence, as well their connection, or lack of it, with the forest development phases was examined.
The general concept of the research was to investigate the impact of invasive herbaceous plants on forest bird communities in forested areas at the initial stage of forest succession. In one of the analyses, the influence of the presence of anthropogenic habitats on the invasion effects was considered. As the studied ecosystems were the forests in a mosaic of habitats, including open habitats, it was not enough to study the responses of forest birds to plant invasion. There were also indicated changes of the non-forest birds’ community, which with weeds of such a physiognomy as that of Caucasian hogweeds might support the abundance of ecotone or bush birds in forests at the initial stage of succession. This approach is very important because the forest is a climax habitat in a temperate zone—abandoned open areas usually spontaneously overgrow with forest, likely affecting non-forest species. Weeds disseminating after crop abandonment can highly affect various bird communities in this type of forested area.
In this study, the author quantified bird community structure (i.e., the number of species and their relative abundances) and diversities (alpha, beta, functional) in fragmented young forests in south-eastern Poland with varying areas of invasive Caucasian hogweeds. Specifically, the following questions were addressed: 1. How does the invaded area correlate with the abundance of forest birds and the presence of anthropogenic habitats? 2. How do communities of forest and non-forest birds and individual species respond to invaded vegetation? 3. How does the presence of invading plants affect the various types of diversity of forest and non-forest birds?
It was predicted that the anthropogenic land use interacting with severely invaded areas would be associated with the decreasing abundance of forest birds. It was expected that the presence of the biggest invasive weeds in Europe would be associated with lower alpha diversity and species richness in forest and non-forest bird communities. The invading weeds would decrease the functional diversity of non-forest and forest birds and would affect the beta diversity due to the potential influence on bird movement creating a unique bird community in each environment.

2. Materials and Methods
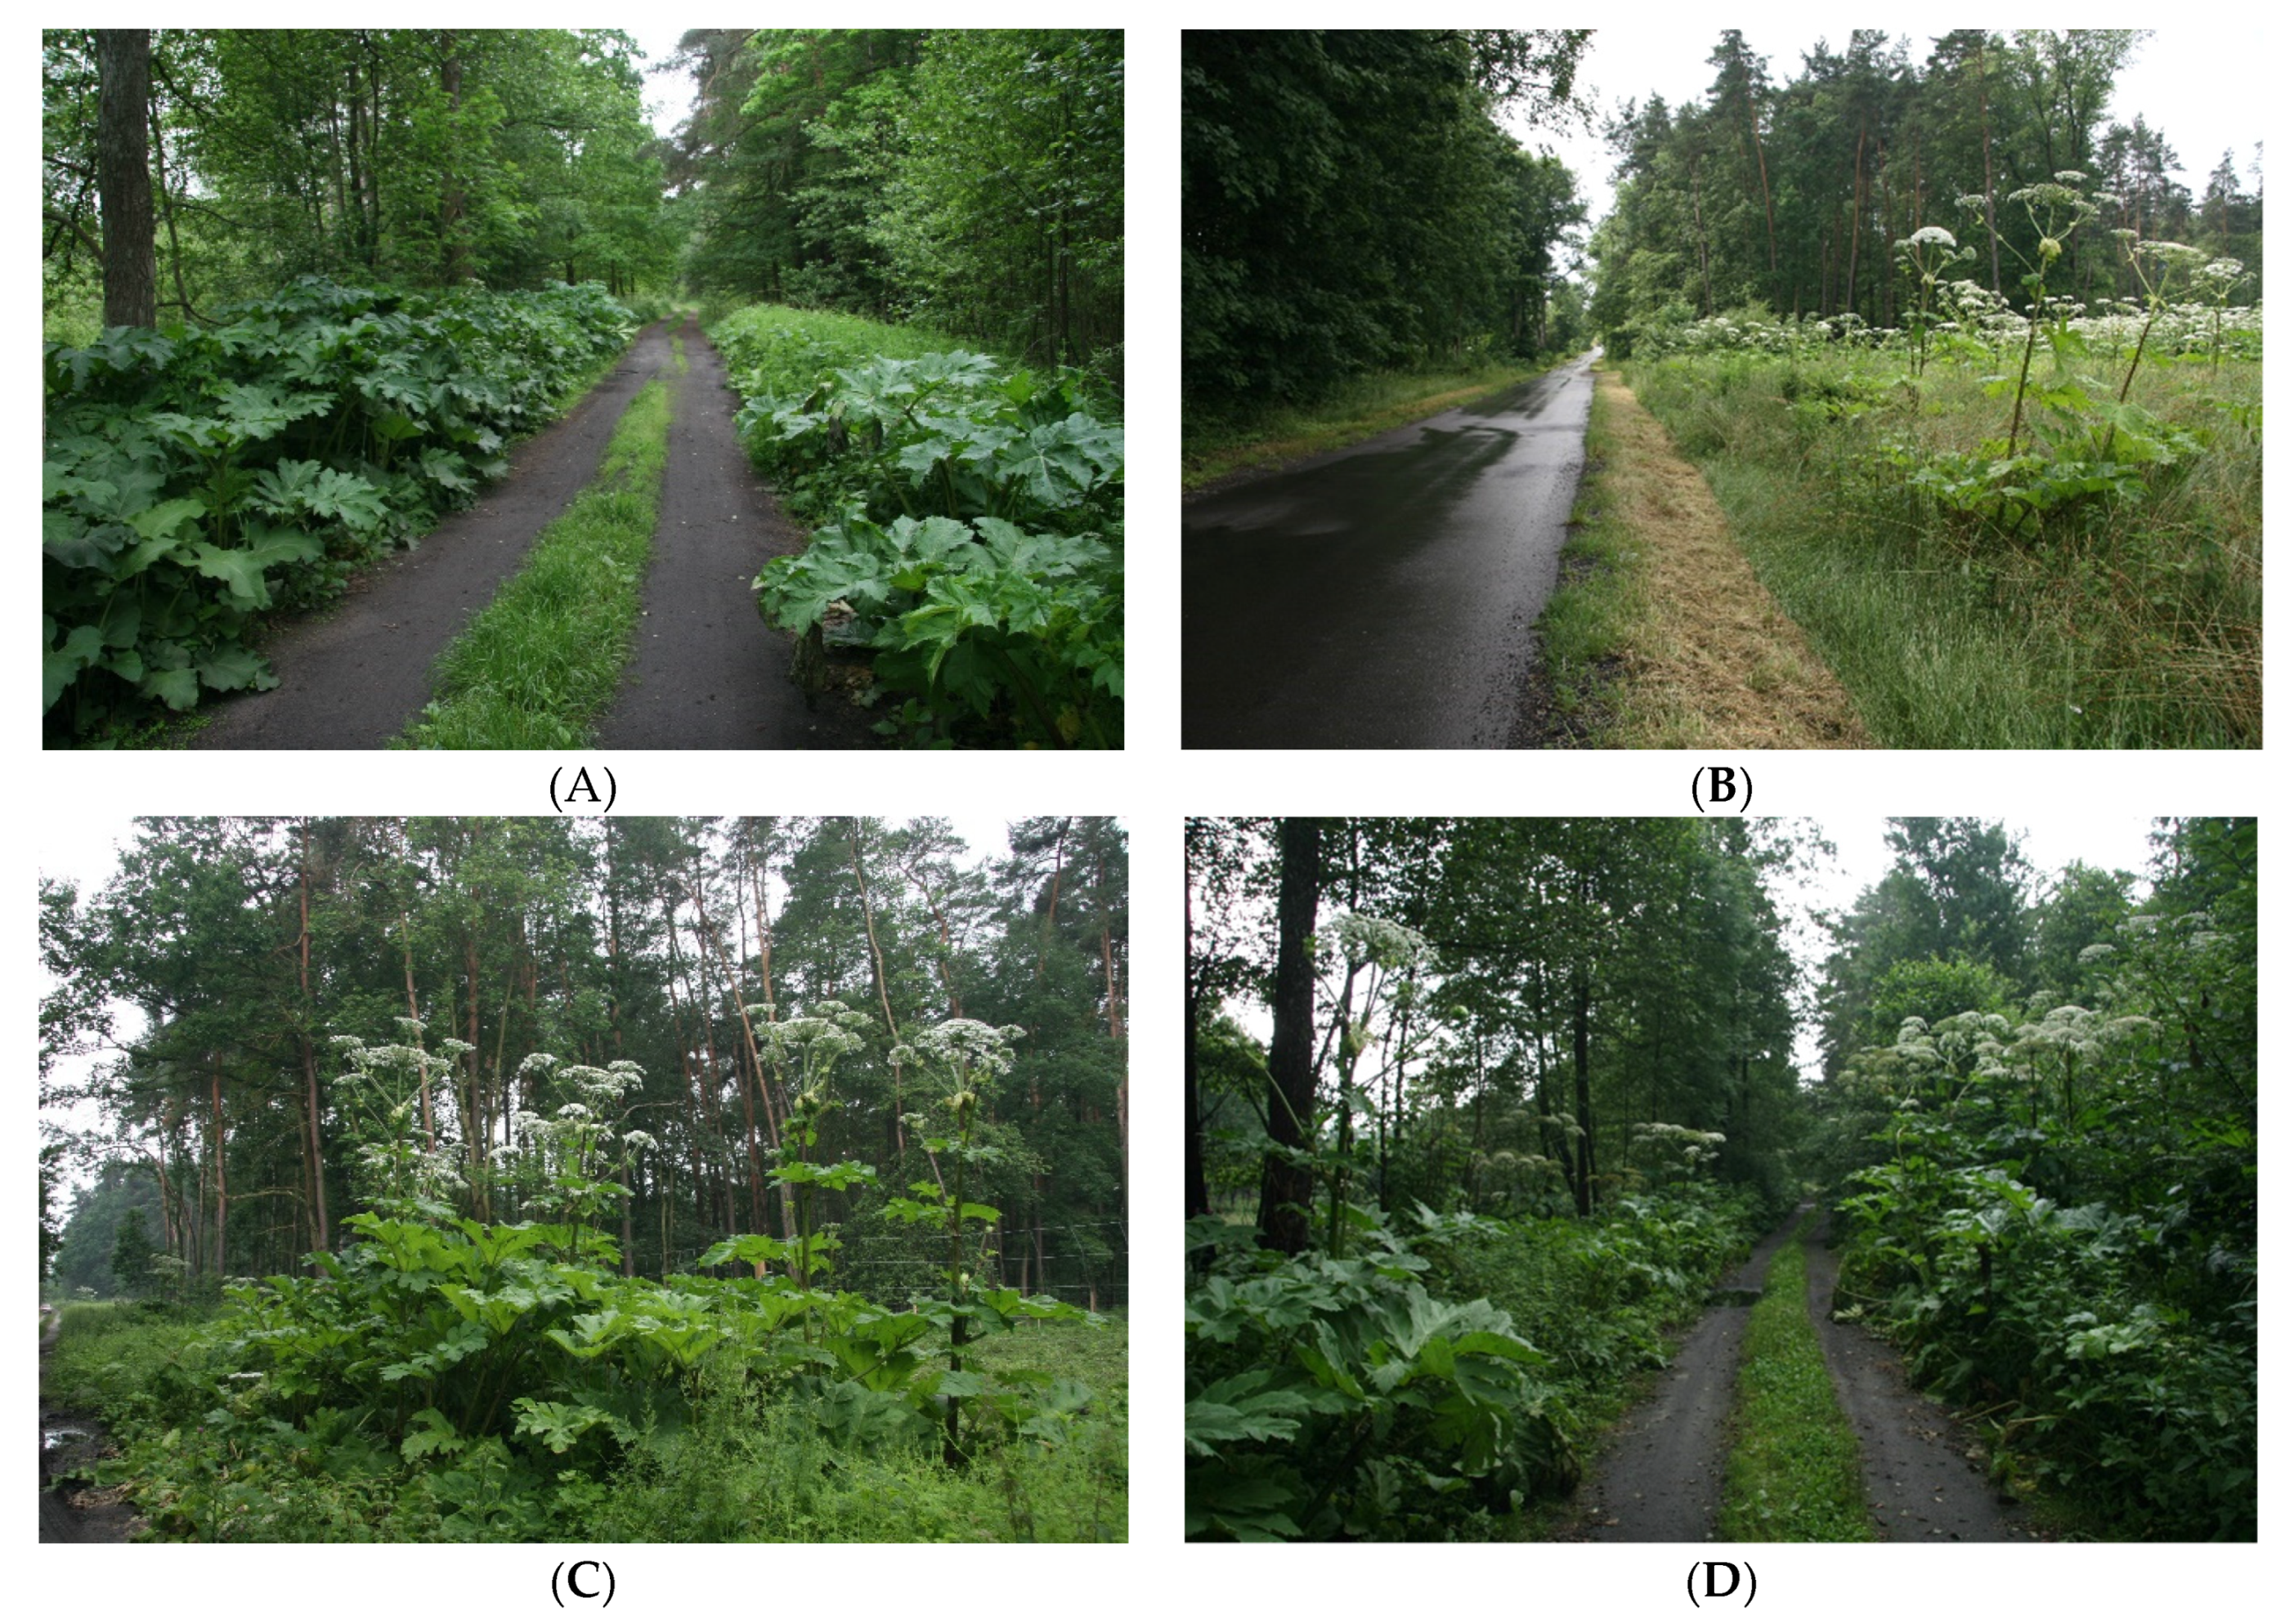
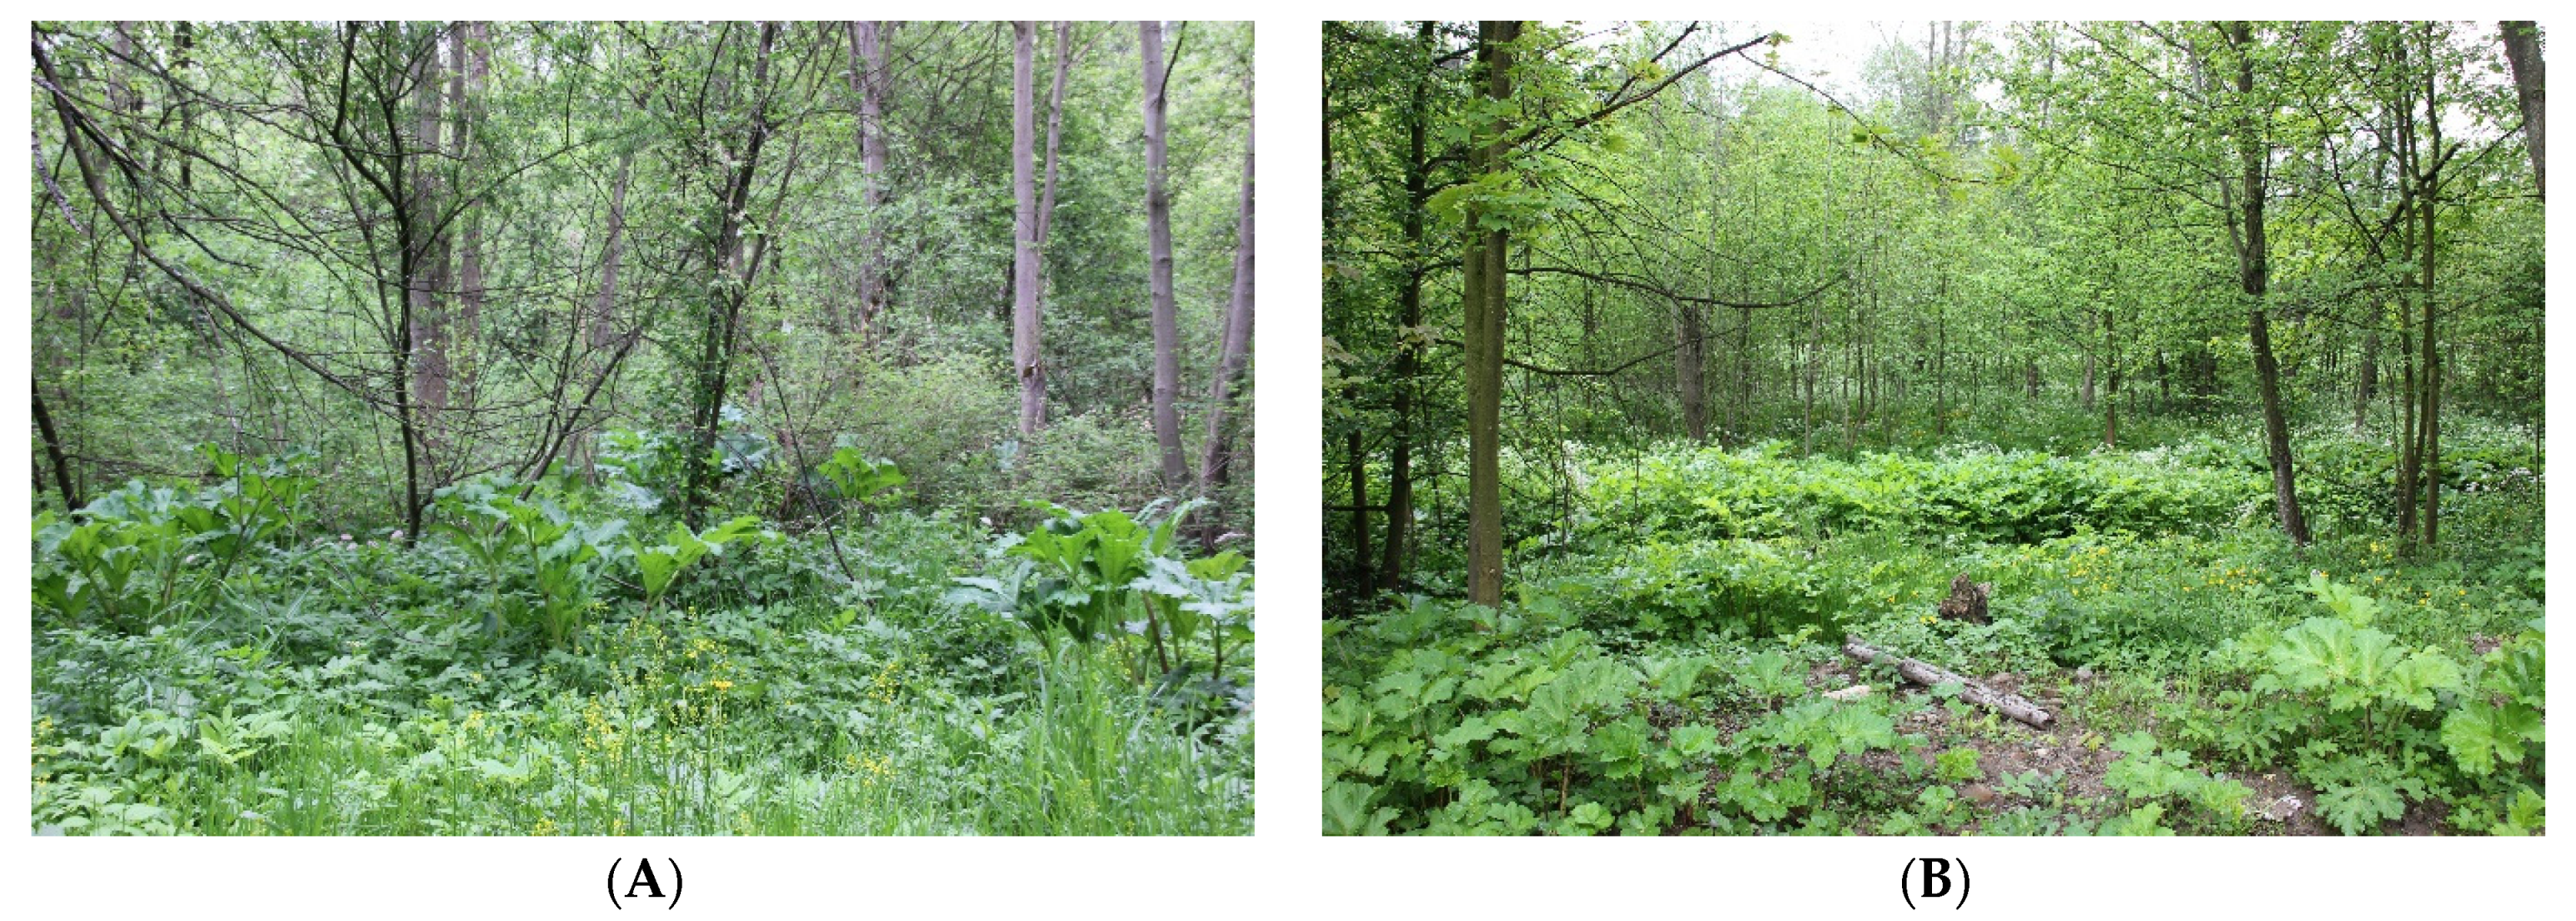
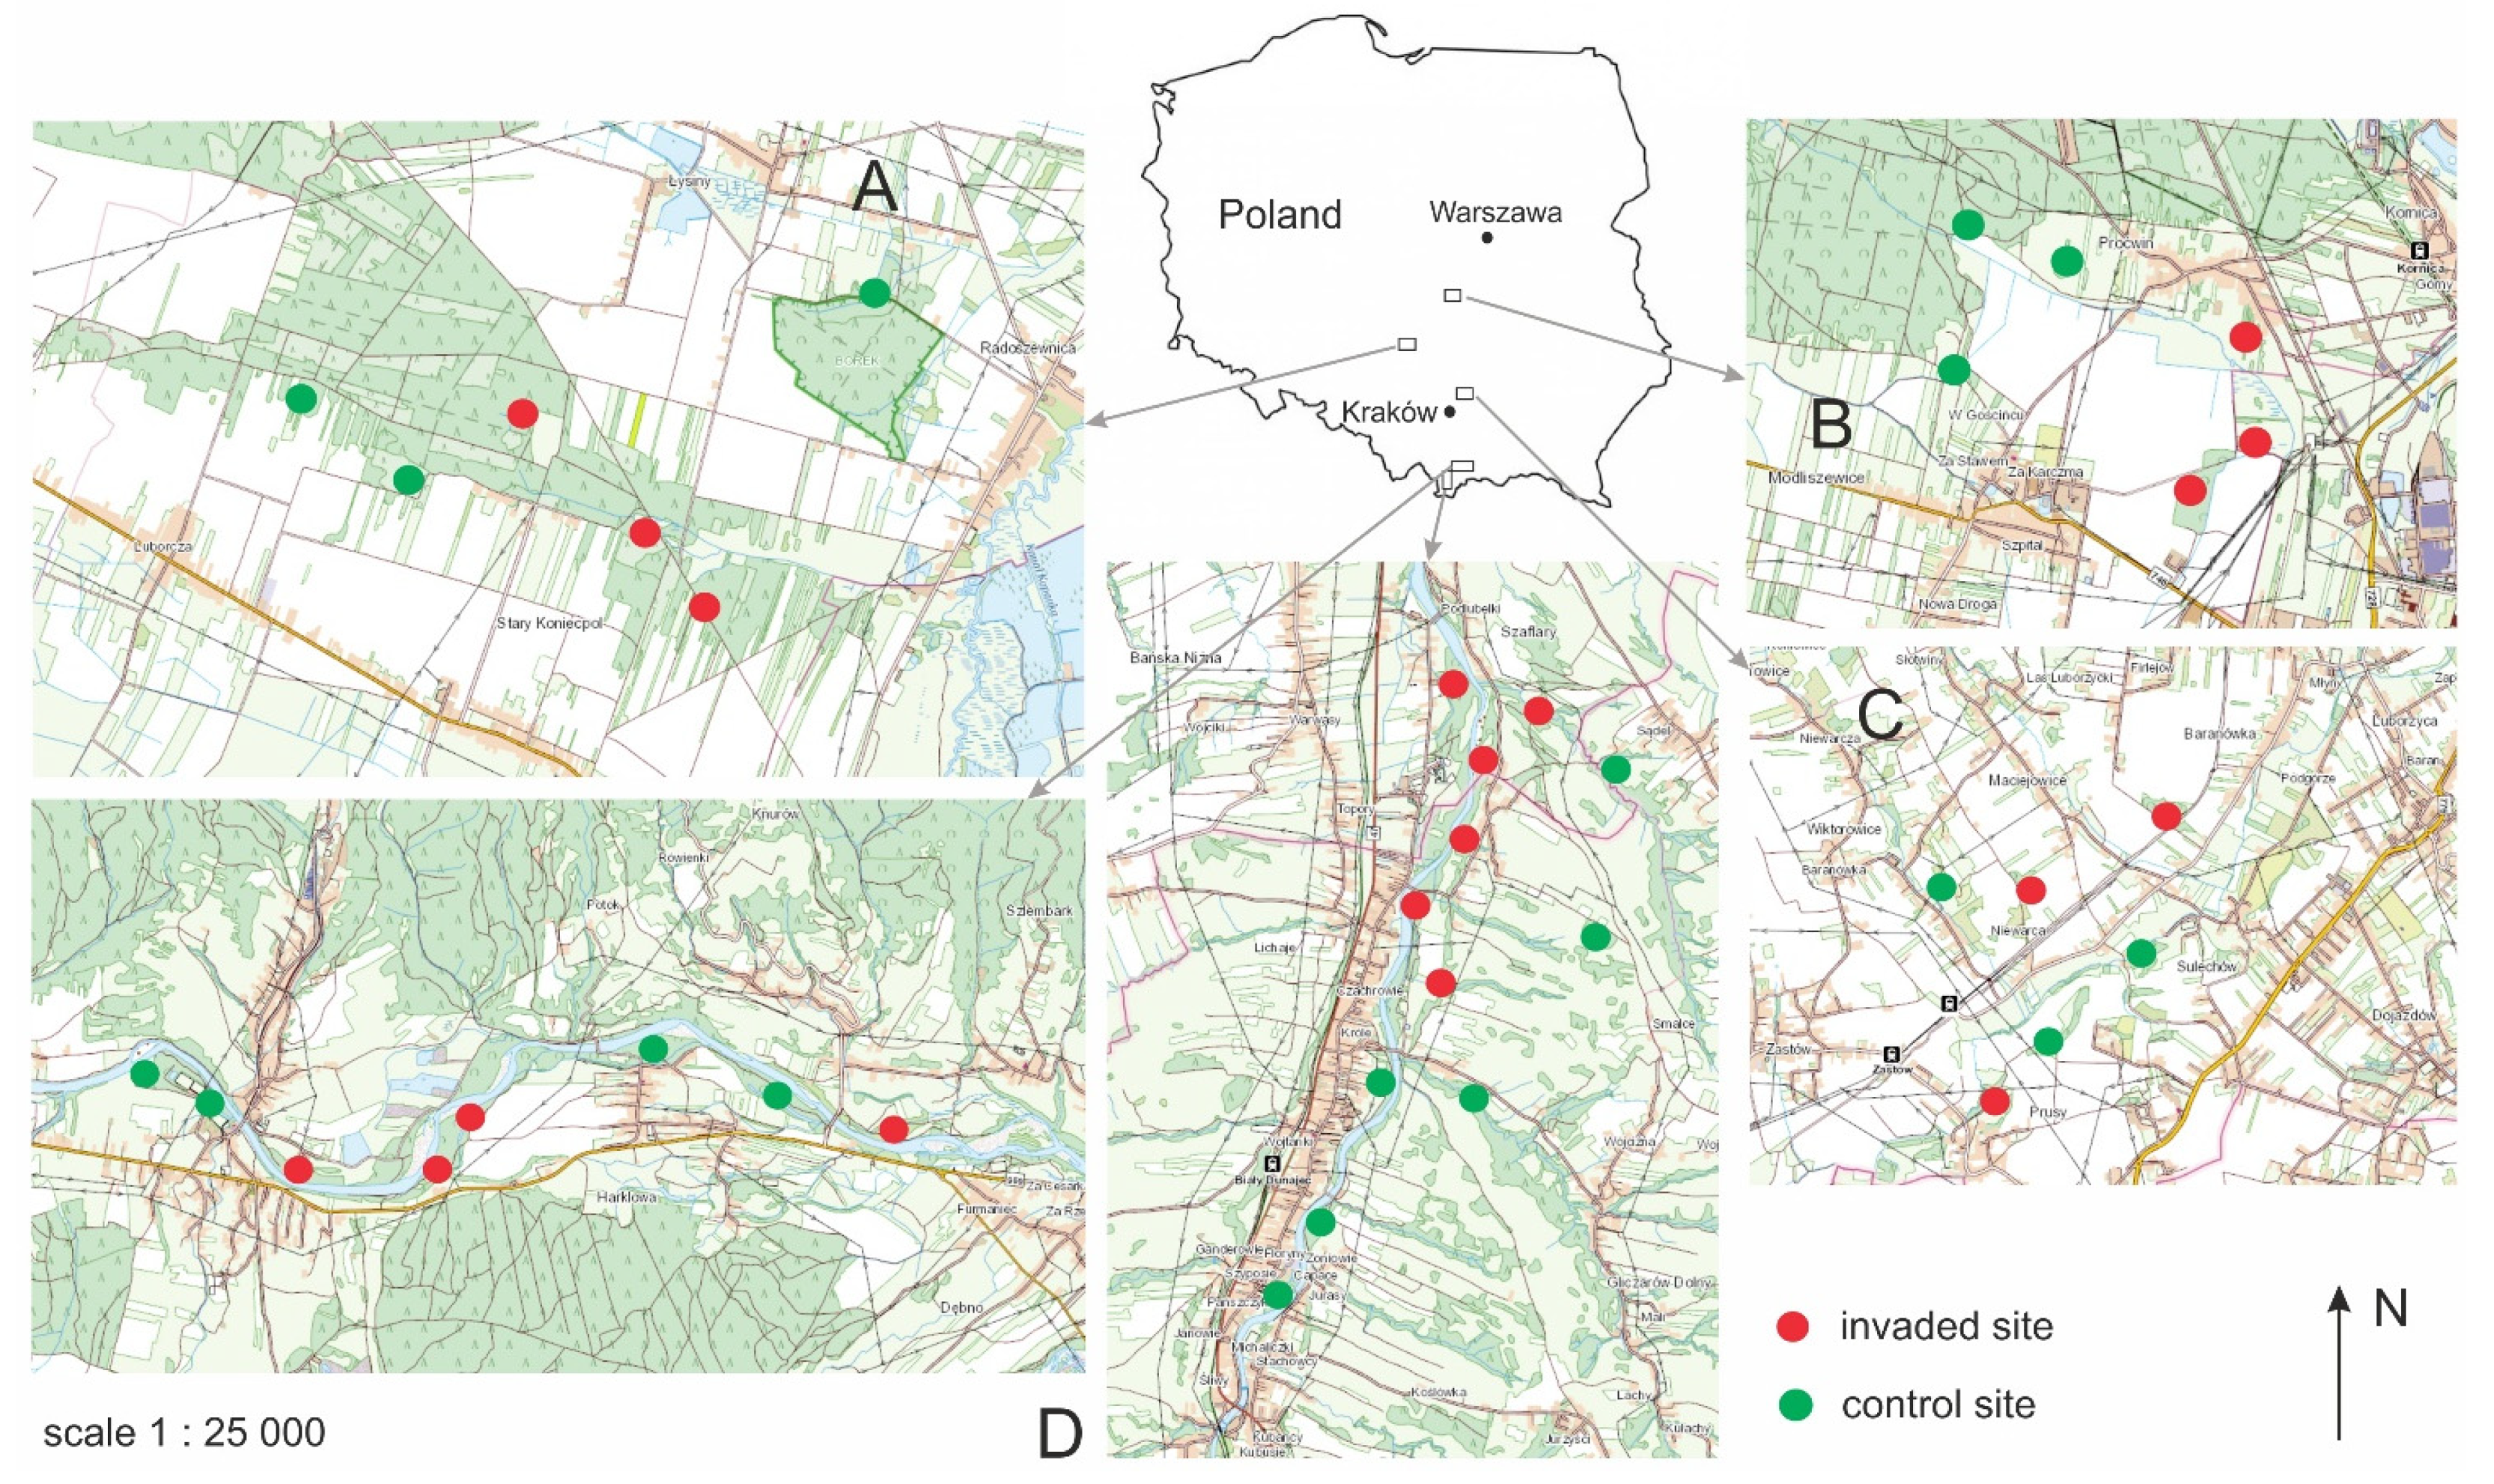
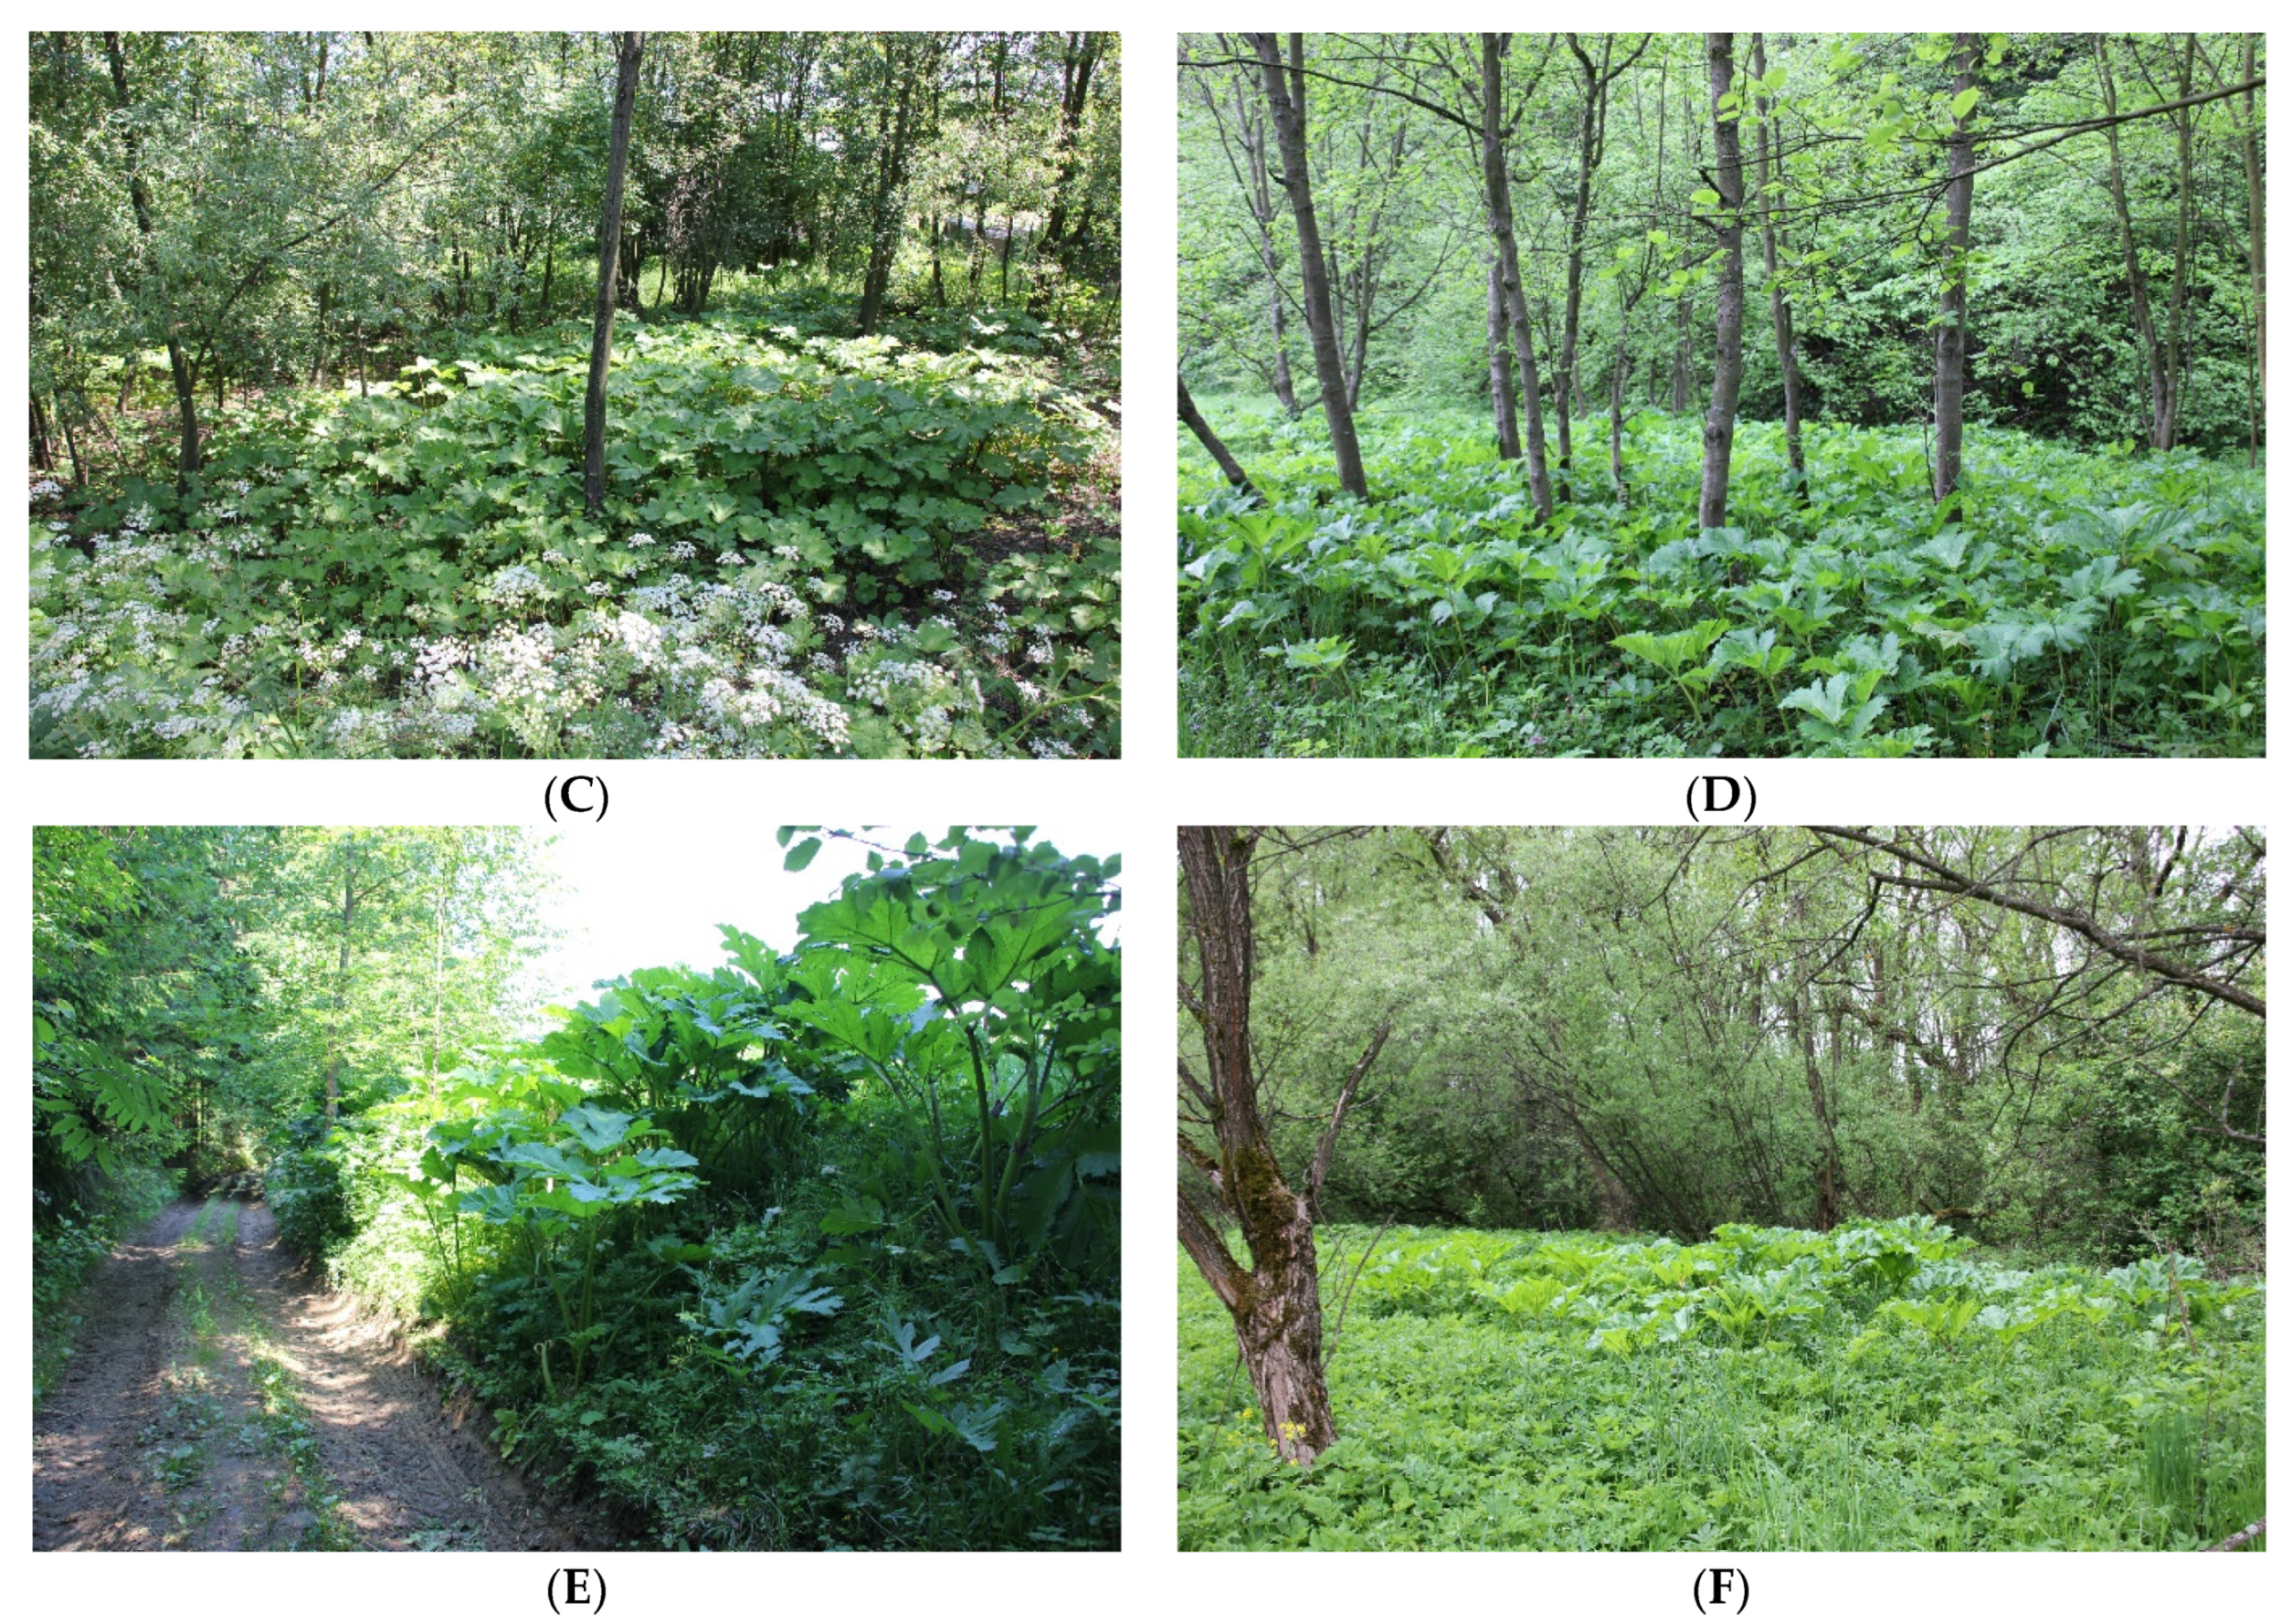
2.1. Study Sites

The focal invasive plants were two species of hogweeds, giant hogweed H. mantegazzianum and Sosnowsky’s hogweed H. sosnowskyi, originating from the Caucasus region, used as crops and melliferous species, mainly in the former Soviet Union. After the fall of communism in the late 1980s and early 1990s with agriculture regression, crops were inadequately liquidated. The invaders spread along river valleys, roads and railway lines.
The research was conducted in south-eastern Poland and the chosen study sites (see the map: Figure 1) were located in four different regions: Figure 1A—A region with one of the largest compact areas of Caucasian hogweeds (mainly Sosnowsky’s hogweeds) in Poland which remained after a former state-owned collective farm near Koniecpol, located in a forest glade and spreading along roads in surrounding forests (see photographs, Figure 2). In this region, 6 study sites were chosen. Figure 1B—A region with a former state-owned collective farm near Końskie, where 6 study sites were chosen. Figure 1C—A hilly region north-east from Kraków along Baranówka river valley and close to the railway line Kraków–Warszawa, where common Sosnowsky’s hogweeds come from one former experimental plantation, while rare giant hogweeds grow along the railway line—in this region, 6 study sites were chosen. Figure 1D—The most southern 20 sites along two rivers (Dunajec and White Dunajec) with forests and bush woods surrounded by mountains and without croplands—in this area, the Sosnowsky’s hogweed invasion comes from experimental plantations and private lands and is currently among the biggest and most problematic in Poland (Figure 3).
For this study, N = 38 sites were selected in forested areas located in habitat mosaic (Figure 1), half of which had invasive Caucasian hogweeds (mostly Sosnowsky’s hogweeds identified by the morphology of mature fruits, with the possibility of rare giant hogweeds in two regions—see above). The presented results are part of research including 70 sites in south-eastern Poland set in pairs (control, Heracleum), but most of them were located in open or bushy areas. Each study site was a circle with a radius of 100 m (i.e., covering 3.14 ha). The distance between site centers within a given pair varied from 540 m to 6 km and the distances of site centers of adjacent pairs were from 550 m to 70 km. Control sites were randomly selected by choosing the area with a similar habitat mosaic (including the comparable share of anthropogenic habitats) as those with invading hogweeds, but not closer than 500 m from the Heracleum site to avoid a double survey of the same birds at different sites. When choosing the study sites, the following landscape criteria were taken into account: 1. Bird community similarity and probability of the presence of birds from the same communities on control and invaded sites. No control surveys were performed in separated and too distant forest complexes so that the study would show invasion effects rather than differences between environments; 2. The location of invaded and control sites in similar habitat mosaic. Although in three pairs, controls were at the edge of the forest, and the invaded areas were in isolated parts of the forest (Figure 1B), it was in the one former forest complex, still connected with bushes and groups of young trees. Searching for controls in distant locations would be a mistake in this situation. In the case of a single pair, control was located in an isolated part of the forest as opposed to the other invaded and control sites in the same region (Figure 1A), as parts of the largest forest were enclosed surfaces and contained seedling and tree plantations.

2.2. Bird Survey

Bird surveys were conducted five times on each of N = 38 study sites in 2020–2021, resulting in N = 190 field surveys on all sites. In the year 2020, the birds were surveyed on two dates when Caucasian hogweeds were developed and could affect birds but also to accurately define a sufficient site for the study (1st survey: 7 May–15 June 2020 before hogweeds’ flowering; 2nd survey: 16 June–10 July 2020 during the flowering period), with a minimum interval of 14 days between survey dates at a given site. In the year 2021, birds were surveyed three times including the period when earlier bird species were detectable with a separate survey in the first two weeks of May to detect all possible species on sites: 1st survey: 19–27 April 2021, 2nd survey: 6–21 May 2021, 3rd survey: 1–24 June 2021, with a minimum interval of 14 days between survey dates at a given site.
During the surveys, all heard and seen bird individuals were recorded on the map when a researcher was standing on a point at the site center, slowly turning around during the survey. After 10 min, the researcher went to the edge of the 100 m circle-site and complemented the survey when moving slowly from edge to edge through the center of the site (it was possible as the largest patches of invasion were intentionally not located in the site centers, and there were paths accessible for people on sites). This was to notice the birds that may have been missed during the 10 min survey from the point. It took 5 min to get from the central point to the edge while moving from edge to edge took 10 min. Therefore, the total time spent on surveying on site during one visit was 25 min. The surveys were performed from sunrise until 11 a.m. [40]. The maximum count for each species was considered as its abundance at a study site [41]. From 2020, the results concerned two surveys, and from 2021, the results concerned three surveys.
There were excluded aerial feeders (common swift Apus apus), shorebirds, gulls, terns and raptors [42], as they probably did not use habitats invaded by Caucasian hogweeds actively. The same was with species connected with water (e.g., common kingfisher Alcedo atthis, white-throated dipper Cinclus cinclus, grey heron Ardea cinerea) and just flying around (e.g., white stork Ciconia ciconia, black stork Ciconia nigra). To avoid the problem of accidentally modified bird diversity by the closer or farther presence of countryside, urban breeders (house sparrow Passer domesticus, black redstart Phoenicurus ochruros, jackdaw Corvus monedula, barn swallow Hirundo rustica, house martin Delichon urbicum) were not taken into account. Birds were sorted into the forest and non-forest communities based on species requirements and field observations (Table A1, Appendix A). The classification was determined by the dominant habitat in the breeding season, supported by field observations in the study sites, e.g., the dominating common starling Sturnus vulgaris is a cavity-nesting bird nesting in mature trees and treated as a forest species, although it is connected with open areas starting from late summer. In the case of Eurasian blackcap Sylvia atricapilla, the most common nest sites were observed in young deciduous forests, hence its classification to the forest community, even if it could also nest in shrubs surrounded by open areas. Ecotone birds such as the cuckoo Cuculus canorus and fieldfare Turdus pilaris were classified as non-forest birds, as the forest is not their sufficient habitat.

2.3. Habitat Measurements

For each study site, a satellite map in Google Maps was used to measure the areas (in tenths of square meters) of eight types of landscape elements within a radius of 100 m around each survey point (covering the area of 3.14 ha, N = 38): meadows, ruderal habitats, buildings, agriculture (i.e., used and abandoned croplands), forests, bushes, roads, water (stream, river). During fieldwork, the sites were carefully viewed, and habitats were marked on the paper maps separately each year. The habitats of the open landscape (meadows, ruderal ones) were summed up and defined as “open areas”, while bushes, groups of trees and forests as “overgrown areas”. Roads, buildings and agriculture were taken together as “anthropogenic areas”. In this study, “anthropogenic areas” were mostly areas of roads and paths (N = 28 sites), although also buildings (N = 8 sites) and agriculture (N = 4 sites), as it was assumed that they reflected human pressure similarly. The number of habitat patches on each site was counted. Habitats divided by line elements were separate patches.
The area of invasion on Heracleum sites was the ninth habitat variable mapped during fieldwork. Then, the areas of invaded patches were measured in Google Maps individually in a 100 m radius from the bird survey point and summed per site. If the invaded area and native habitats overlapped (e.g., native trees were above invaders), the invasion on a given site was subtracted from the area of other habitats, i.e., no invaded patch was included as invasion and natural habitat. It was not determined whether the invaded area was within an open or overgrown habitat, as it was difficult to define, e.g., the invaded area in a forest clearing as a forest or open habitat, the same as invaders near groups of trees or shrubs growing in meadows or agricultural lands. It was sometimes difficult to determine what habitat in invaded areas without invasion might be, while uninvaded habitats were relatively easy to classify as open or overgrown ones. The measured invaded areas, therefore, were applied to all habitats on study sites. If the measurements from 2021 differed from those from 2020, this was included in the database. The only differences were in the increase or decrease of the invasion area by a few square meters recorded on five sites.

2.4. Data Analyses

Before the analyses, the bird abundance/species richness and environmental data were (1) tested for normality using the Shapiro–Wilk test, (2) evaluated for the presence of outliers by preparing scatterplots, (3) evaluated for multicollinearity using the “vif” function in the “performance” package [43] after selection of the predictors intended to use in the model and (4) tested for habitat differences concerning variables important for this study between invaded and control sites. All dependent variables prepared for models (abundance of all, forest and non-forest birds, species richness/number of species of all, forest and non-forest birds) were normally distributed. There were no outliers. In all cases, the variance inflation factor (VIF) was below 2.0 indicating low multicollinearity [44] of predictors. Descriptive statistics of the areas of habitats on the sites from both groups were prepared in the “dplyr” package [45]. Kruskal–Wallis test calculated on habitat measurements from the year 2020 indicated a lack of differences in habitat areas and a number of patches between Heracleum and control sites in any of those measures (Table A2, Appendix A). In 2021, most of the measurements were the same (see above).
To investigate the responses of bird communities to the presence of invaded vegetation, there were performed linear mixed models using “lme4” package [46] with “lmer” function testing differences between invaded and control sites in the abundance and species richness of the forest, non-forest and all birds detected on study sites. In these models, “site ID” (identification of a given site—control or invaded—used for bird surveys in each year) and “year” (2020, 2021) were treated as random effects. A single predictor was the group (control, Heracleum) used as a nominal variable (factor). The estimation method was the restricted maximum likelihood, while the chosen link function was identity.
One another LMM model was prepared to test the effects of forest area, invasion area and anthropogenic area on the abundance of forest birds. This model was performed also using “lme4” package [46] with “lmer” function, where the fit of the model was REML, while “site ID” and “year” were treated as the random effects. The chosen explanatory variables were habitat measures: forest area, anthropogenic area, invasion area and interactions between habitat variables. Before calculating the final model, its fit was checked using “glmulti” package [47] testing whether models with the chosen predictors (habitat variables) were among the best-fitted options shown by Akaike’s information criterion (AIC). In the formula testing the fit, all possible two-way interactions between habitat variables were taken into account. In the final version, there was used the best-fitted option of the model.
To calculate the diversity indices, a database was prepared summarizing the results of all surveys of birds. For each study site (N = 38), the highest abundances of individual species from two years were selected, i.e., based on N = 190 field surveys on all sites. Alpha diversity reflecting species richness on sites was calculated with the Simpson index, the values of which were compared between the groups using the Kruskal–Wallis test. Beta diversity was counted in “vegan” [48] and “betapart” [49] packages using the “beta.pair” function calculating distances on the matrix of bird species occurrence at individual study sites. In this case, the Sorensen distance was chosen, and the obtained multiple-site dissimilarities reflected the sum of the spatial turnover and the nestedness components of beta diversity (i.e., the general beta diversity). The mean distances to the centroid reflecting community dissimilarity were compared between groups (control, Heracleum) using the one-way analysis of variance. Beta diversity was considered in the analyses since it accurately represents variation in species composition across different communities.
Functional diversity (FD) was expressed as a functional distance between each species representing forest or non-forest bird community based on their relative abundance on a given site and organized as a matrix. It was calculated using Gower’s distance [50] based on a “gowdis” function in the “FD” package [51,52]. Gower’s distance is a flexible distance-based measure that can incorporate multiple variable types and reflects partial dissimilarities across individuals. Here, the species dissimilarities were calculated using Gower’s distance because traits had continuous (i.e., relative abundance) as well as binary (occurrence, i.e., presence or absence) data. The Gower’s distance can be used to measure how different groups are. The distance matrix prepared per each group of sites evaluated pair-wise functional similarity between species on control and Heracleum sites based on the mentioned species abundance/occurrence data. In this case, the obtained FD was compared between the groups (control, Heracleum) with the Welch t-test. The second functional diversity indicator was based on a categorical variable reflecting the relationship, or lack of it, of a given species with the phases of forest appearance and development. The ranks of this trait were as follows: 1—bird connected with open areas, 2—ecotone species, 3—species living in a young forest, 4—bird living in a mature forest. Ranks were assigned to individual species according to their behavior on sites during fieldwork, as well as species habitat requirements. Ranks were assigned to species when it was observed on the site (otherwise the data was zero) and as a whole organized as a matrix of species on sites. Then, using the “dbFD” function in the “FD” package [51,52] there were computed data frames containing the community-level weighted trait values, CWM [53] expressed as means per species used to find out which species were responsible for the changes in a community near the invasion (included in Table A1, Appendix A). CWMs were compared between groups (control, Heracleum) using the Welch t-test. In general, functional diversity indices consider distinct components of diversity, in this case, related to species abundance and species habitat traits with the aspect of species occurrence [54,55].
The results of LMMs were visualized using scatterplots prepared within the “ggplot2” package [56], Appendix B, as well as with column graphs prepared using “dplyr” [45] and “ggplot2” [56] packages. The tested group differences of the diversity indices were visualized using boxplots. To explore differences between forest and non-forest bird communities in the diversity and dissimilarity on control and invaded sites, the “vegan” package [48] was chosen to illustrate the relationships between species and the presence of invasion via a Detrended Correspondence Analysis (DCA). It was computed the natural logarithm of 1 + arg based on the species matrix using the “decorana” function. Species were grouped using the nominal variable (control, Heracleum) and were used to prepare the graph with the “ordihull” command. The positions of species were additionally marked with dots based on the species scores. The relative strengths of the DCA axes (marked as lambda λ) were given as eigenvalues. The extent of invasion in the whole bird communities based on the distance across sites was expressed by the “polygon” option and scaled to plots with species.
All statistical analyses were prepared using the R 4.0.4 software [57].

3. Results

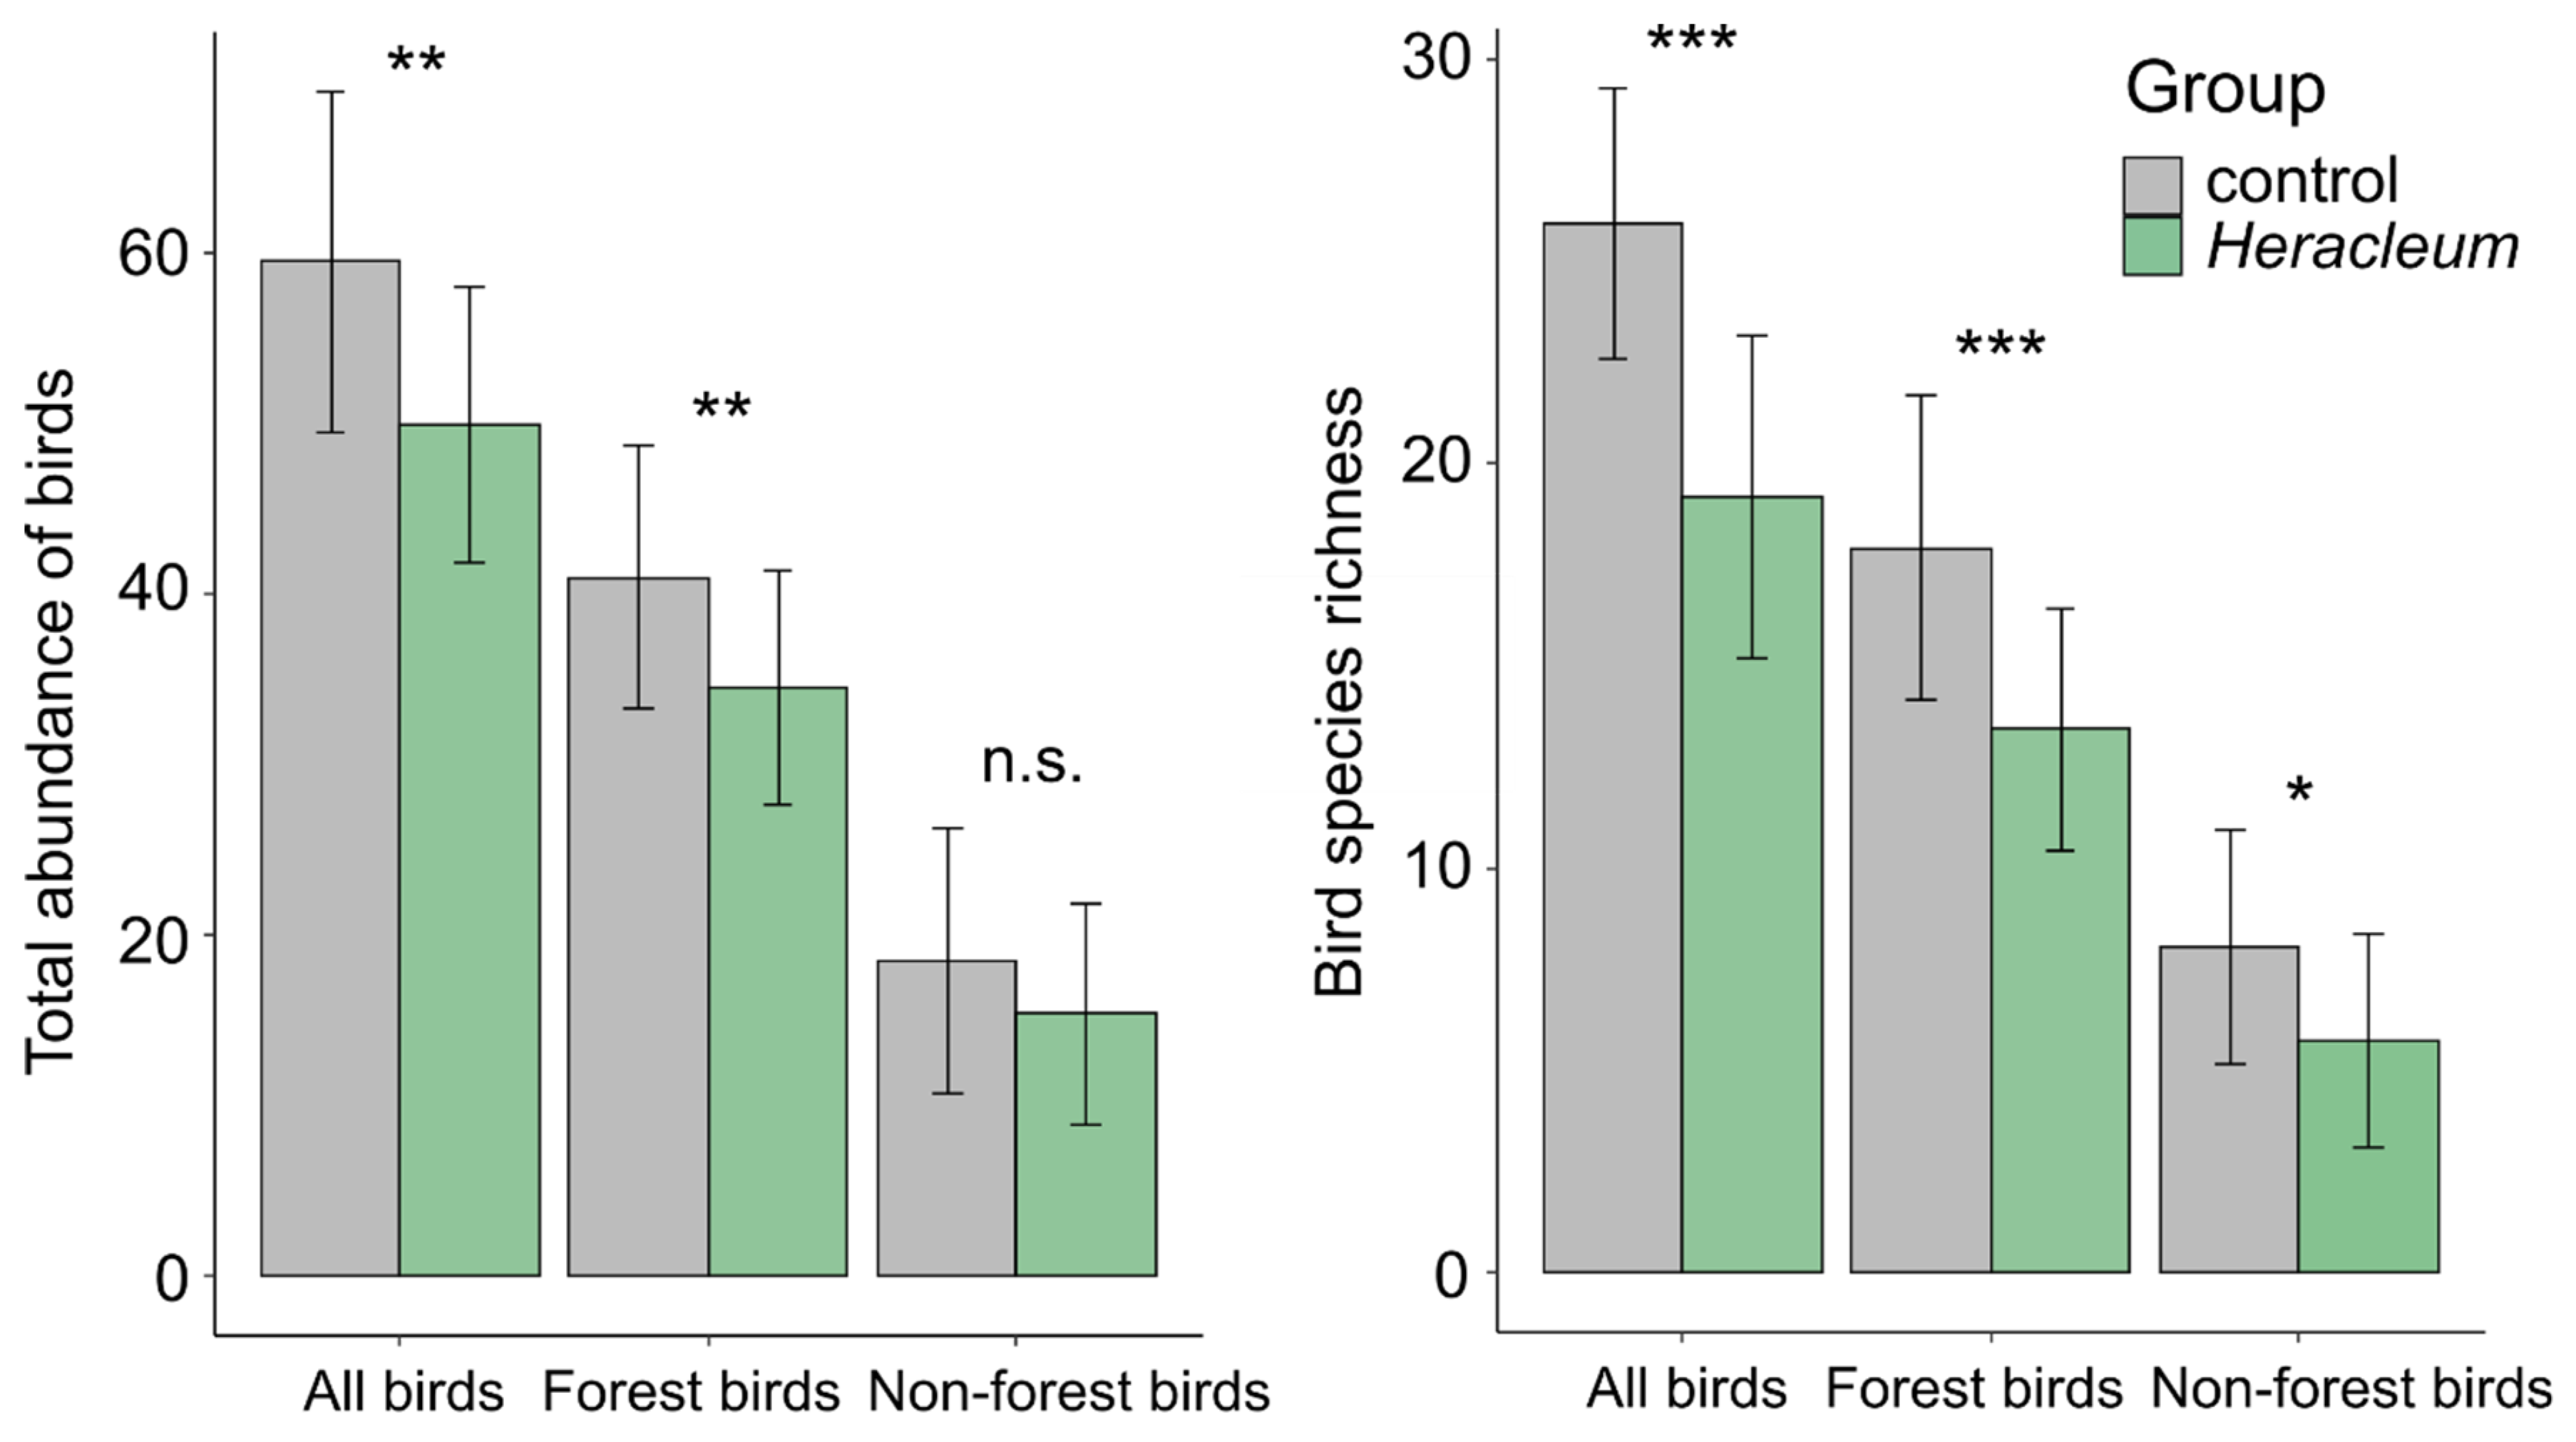
3.1. Impact of the Invading Weed Presence on the Bird Abundance and Species Richness

Based on summarized results from two years, a total of 70 bird species were observed actively using habitats on study sites, 69 species (1366 bird individuals) were recorded on control sites and 65 species (1065 bird individuals) on Heracleum sites (Table A1, Appendix A). Regarding the community association, there were 895 forest birds and 471 non-forest birds on control sites, as well as 713 forest birds and 352 non-forest birds on Heracleum sites. The control sites were dominated by common starling, great tit Parus major—forest species, and fieldfare—non-forest species, while the invaded sites hosted a large abundance of common whitethroat Sylvia communis—non-forest bird, Eurasian blackcap and common starling—forest species (Table A1).
The presence of Caucasian hogweeds impacted the abundance of all birds, forest birds, although not the abundance of non-forest birds (Figure 4). Specifically, at the sites with hogweeds was lower abundance of all birds (LMM: Estimate ± SE = −8.95 ± 3.00, t = −2.98, p = 0.005) and forest birds (−6.25 ± 2.22, t = −2.82, p = 0.007), which was not the case of non-forest birds (−2.56 ± 2.52, t = −1.01, p = 0.316). At the sites with hogweeds, the number of species from all groups was lower in comparison with controls (Figure 4). Specifically, the presence of invaders was connected with lower species richness of all birds (−6.45 ± 1.24, t = −5.18, p < 0.001), forest species (−4.39 ± 1.09, t = −4.02, p < 0.001), as well as non-forest species (−2.13 ± 0.90, t = −2.36, p = 0.023).

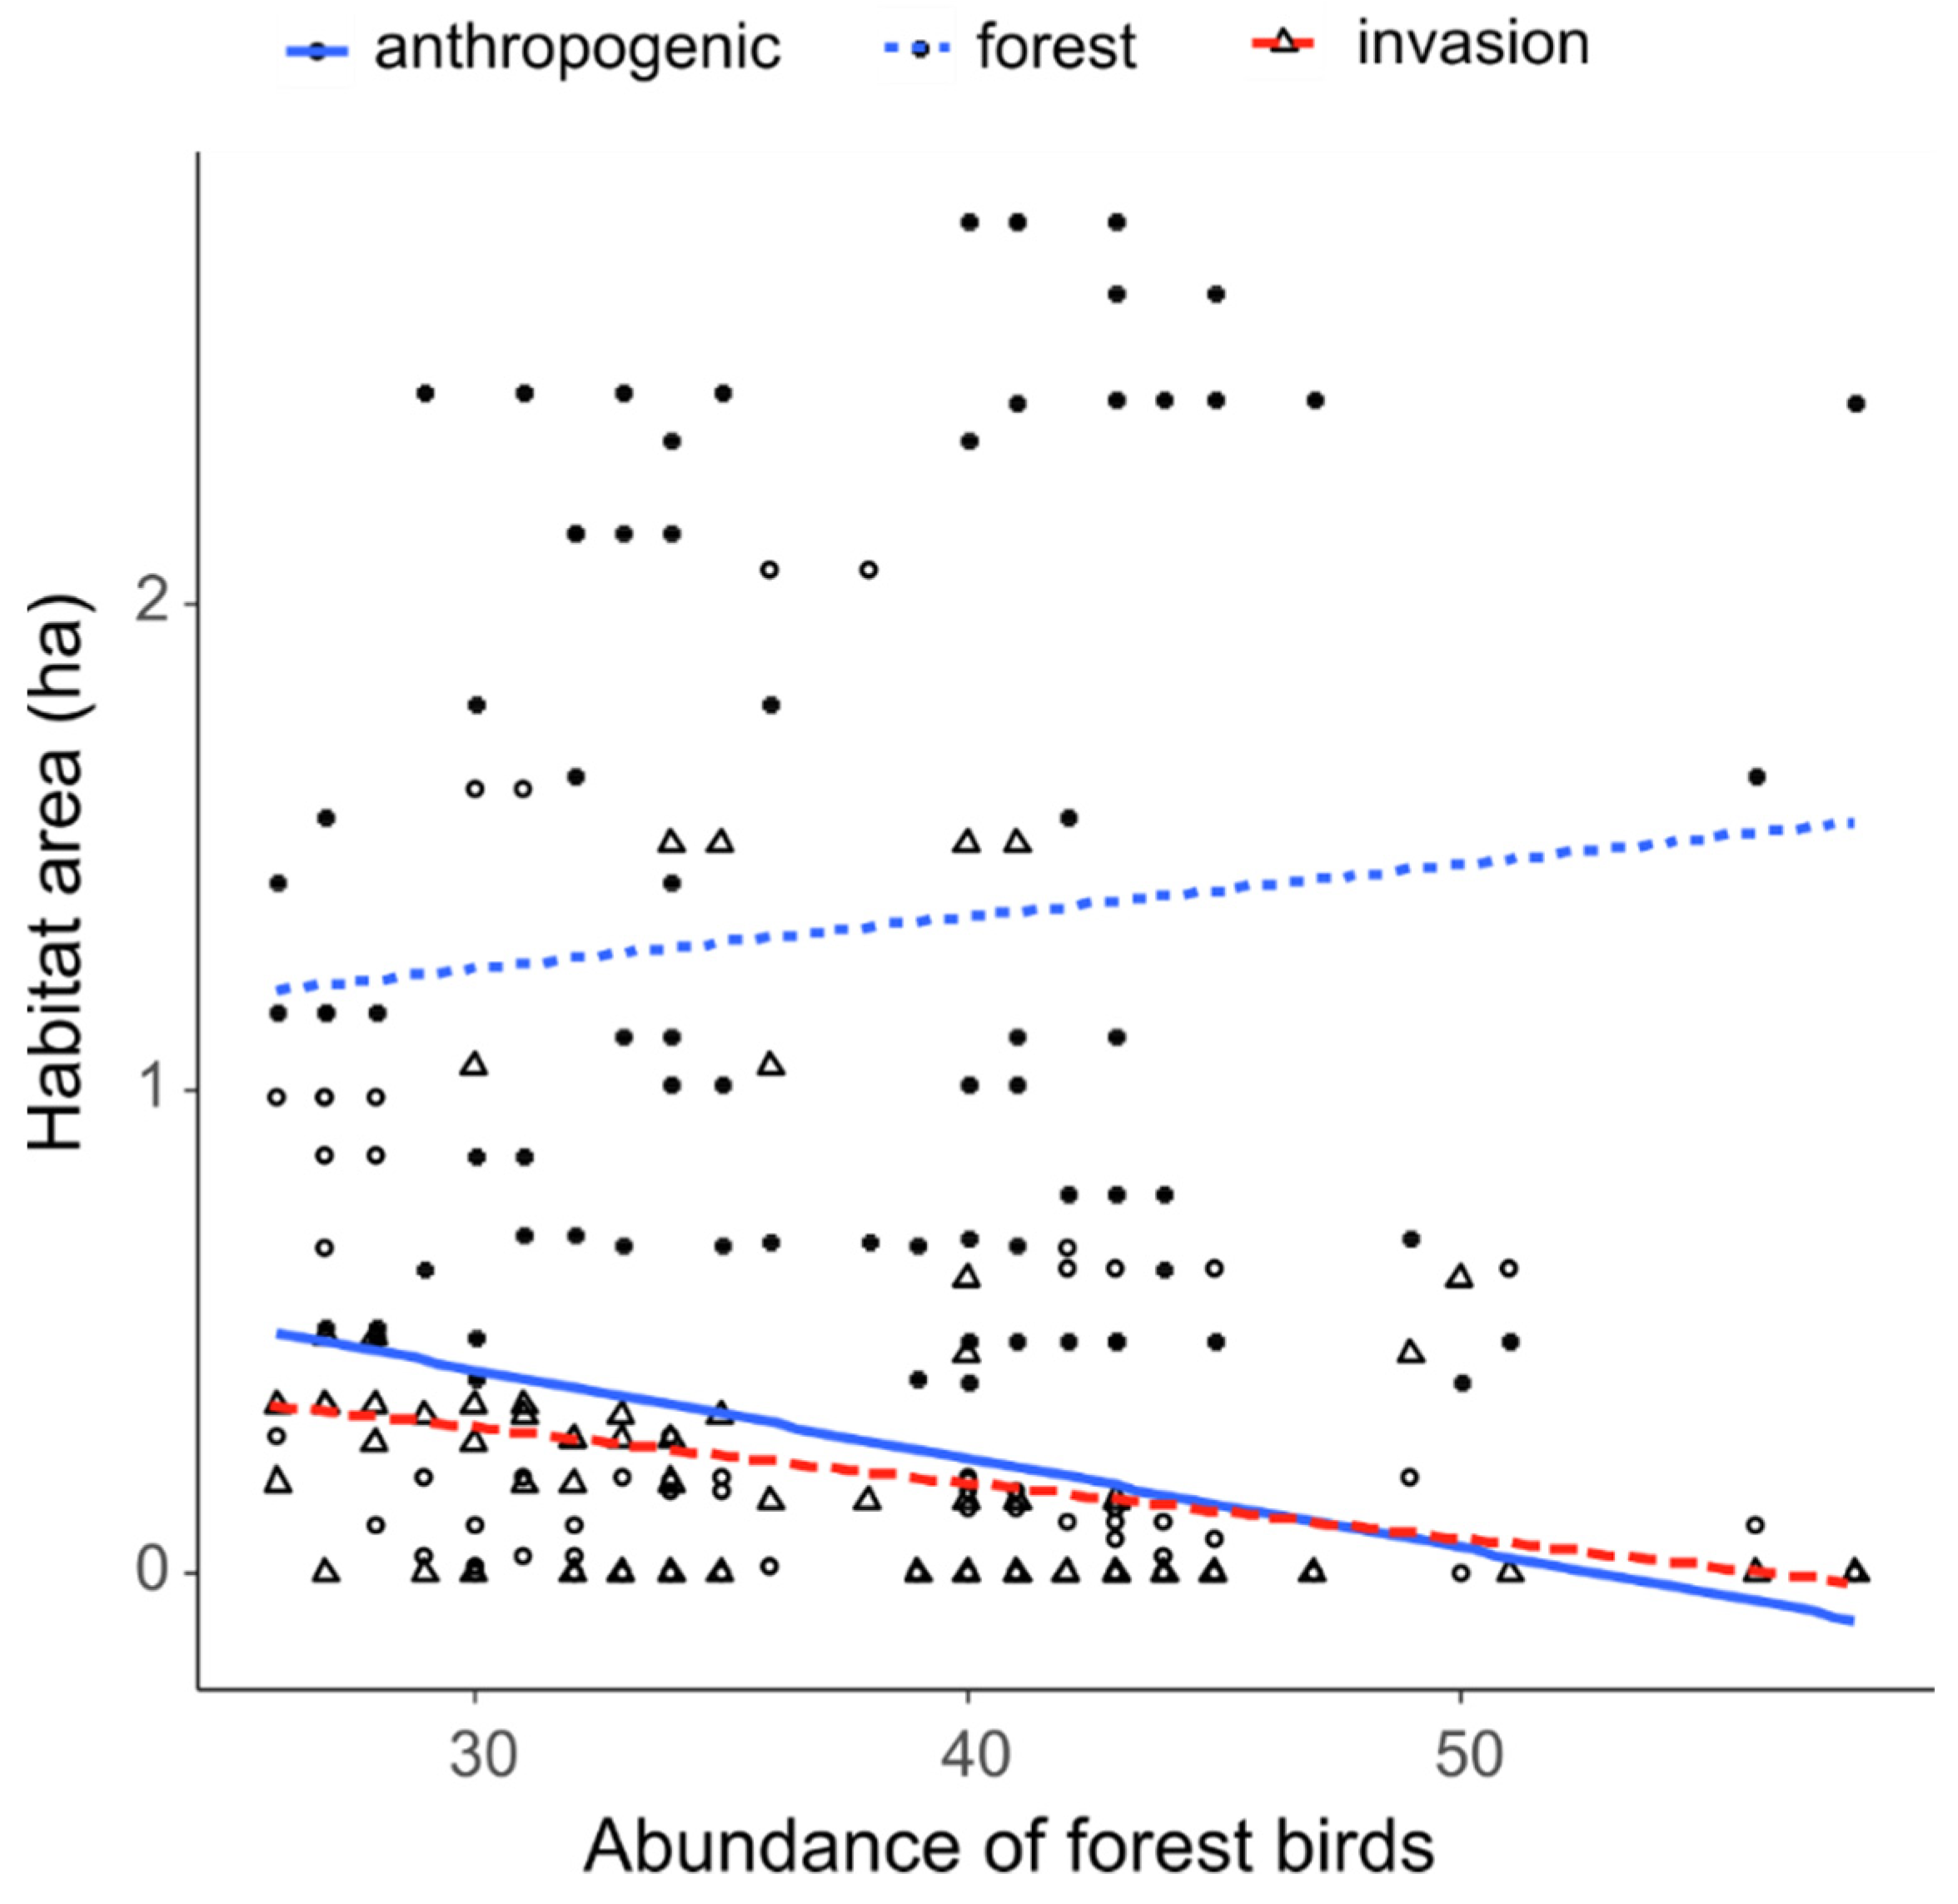
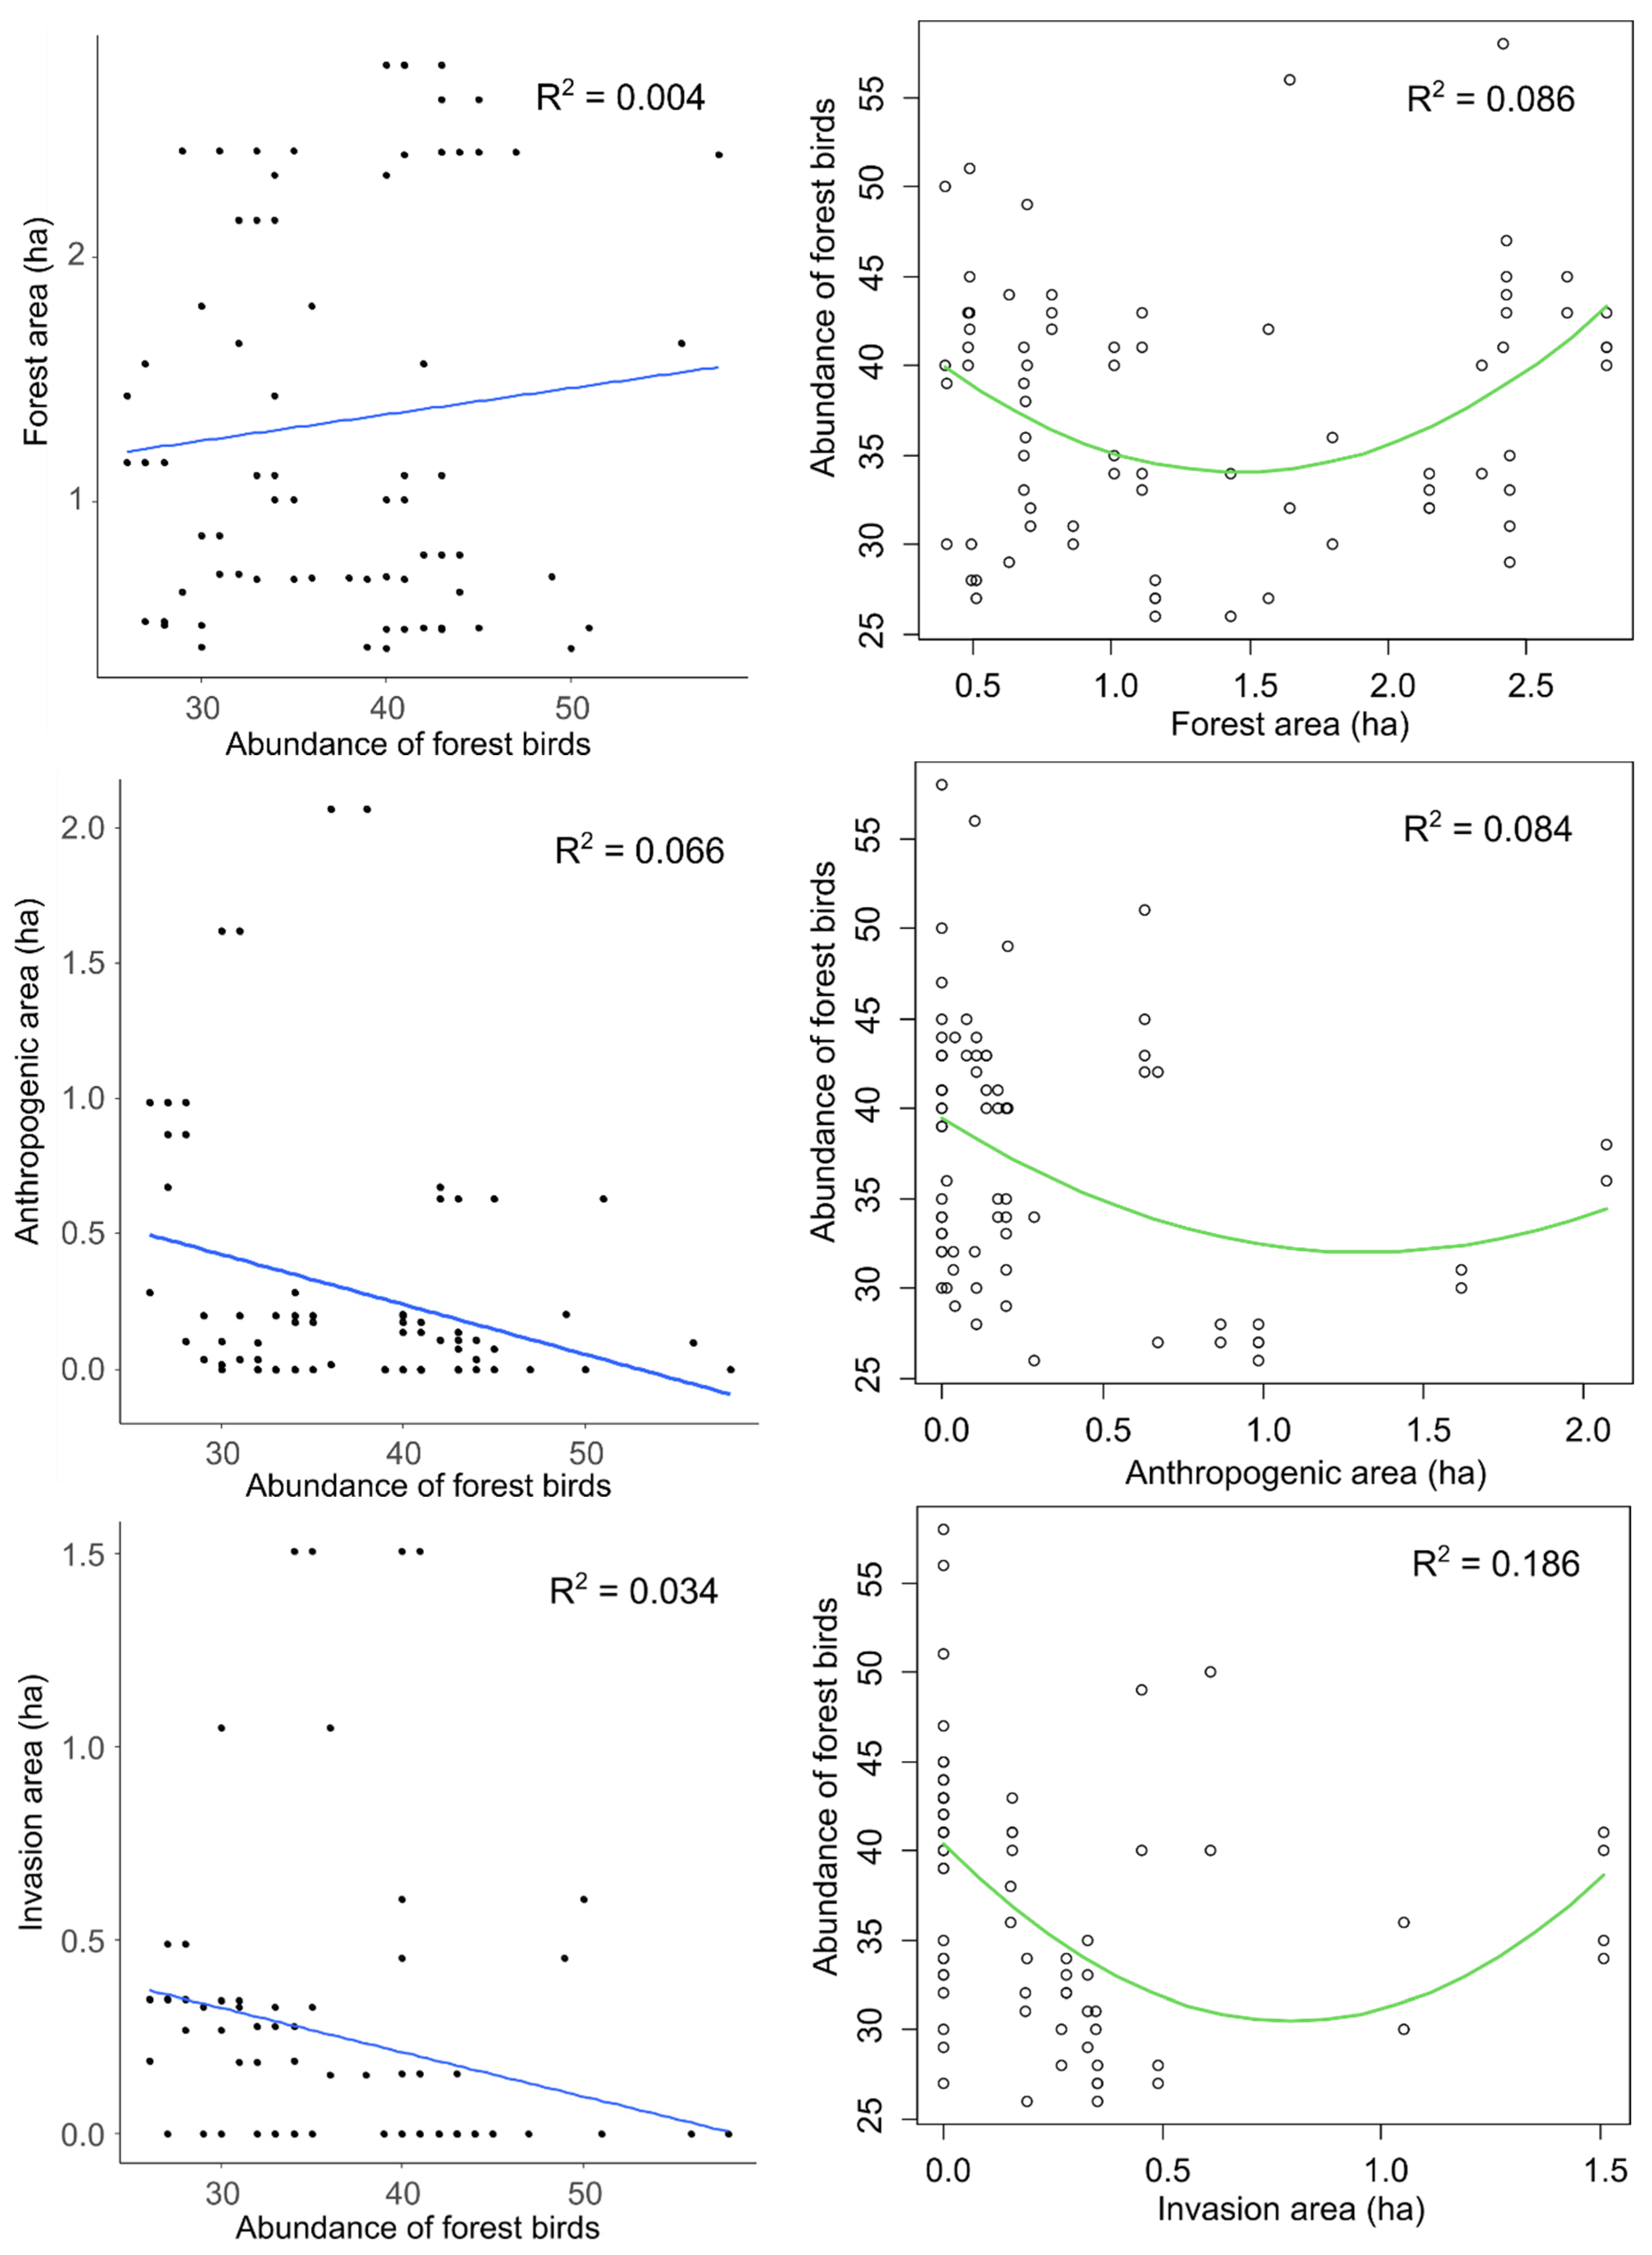
3.2. Impact of Invaded Area, Forest Area and Anthropogenic Area on Forest Birds

The LMM model showed a significant influence of all tested two-way interactions of habitat variables on the abundance of forest birds (Table 1). The abundance of forest birds increased with the increasing forest area and the decreasing invaded area (Figure 5). Along with this dependence, the increasing anthropogenic area reduced the abundance of forest birds, as it was connected to the invaded area and negatively related to the forest area (Figure 5). The positive estimates of single predictors’ impacts on the dependent variable (Table 1) were due to their non-linear effects that better explained the relationships than the linear negative influences of invasive and anthropogenic areas, as well as the positive influence of forest area (Figure A1, Appendix B). Although the linear impact of invasion area on the abundance of forest birds was negative, in the non-linear option it could be beneficial for these birds above 1.0 ha, the same as anthropogenic area when it constituted more than 1.5. ha. The abundance of forest birds decreased when the forest area was in the range of 0.5–1.5 ha and the presence of forest strongly supported those birds above 1.5 ha (Appendix B).

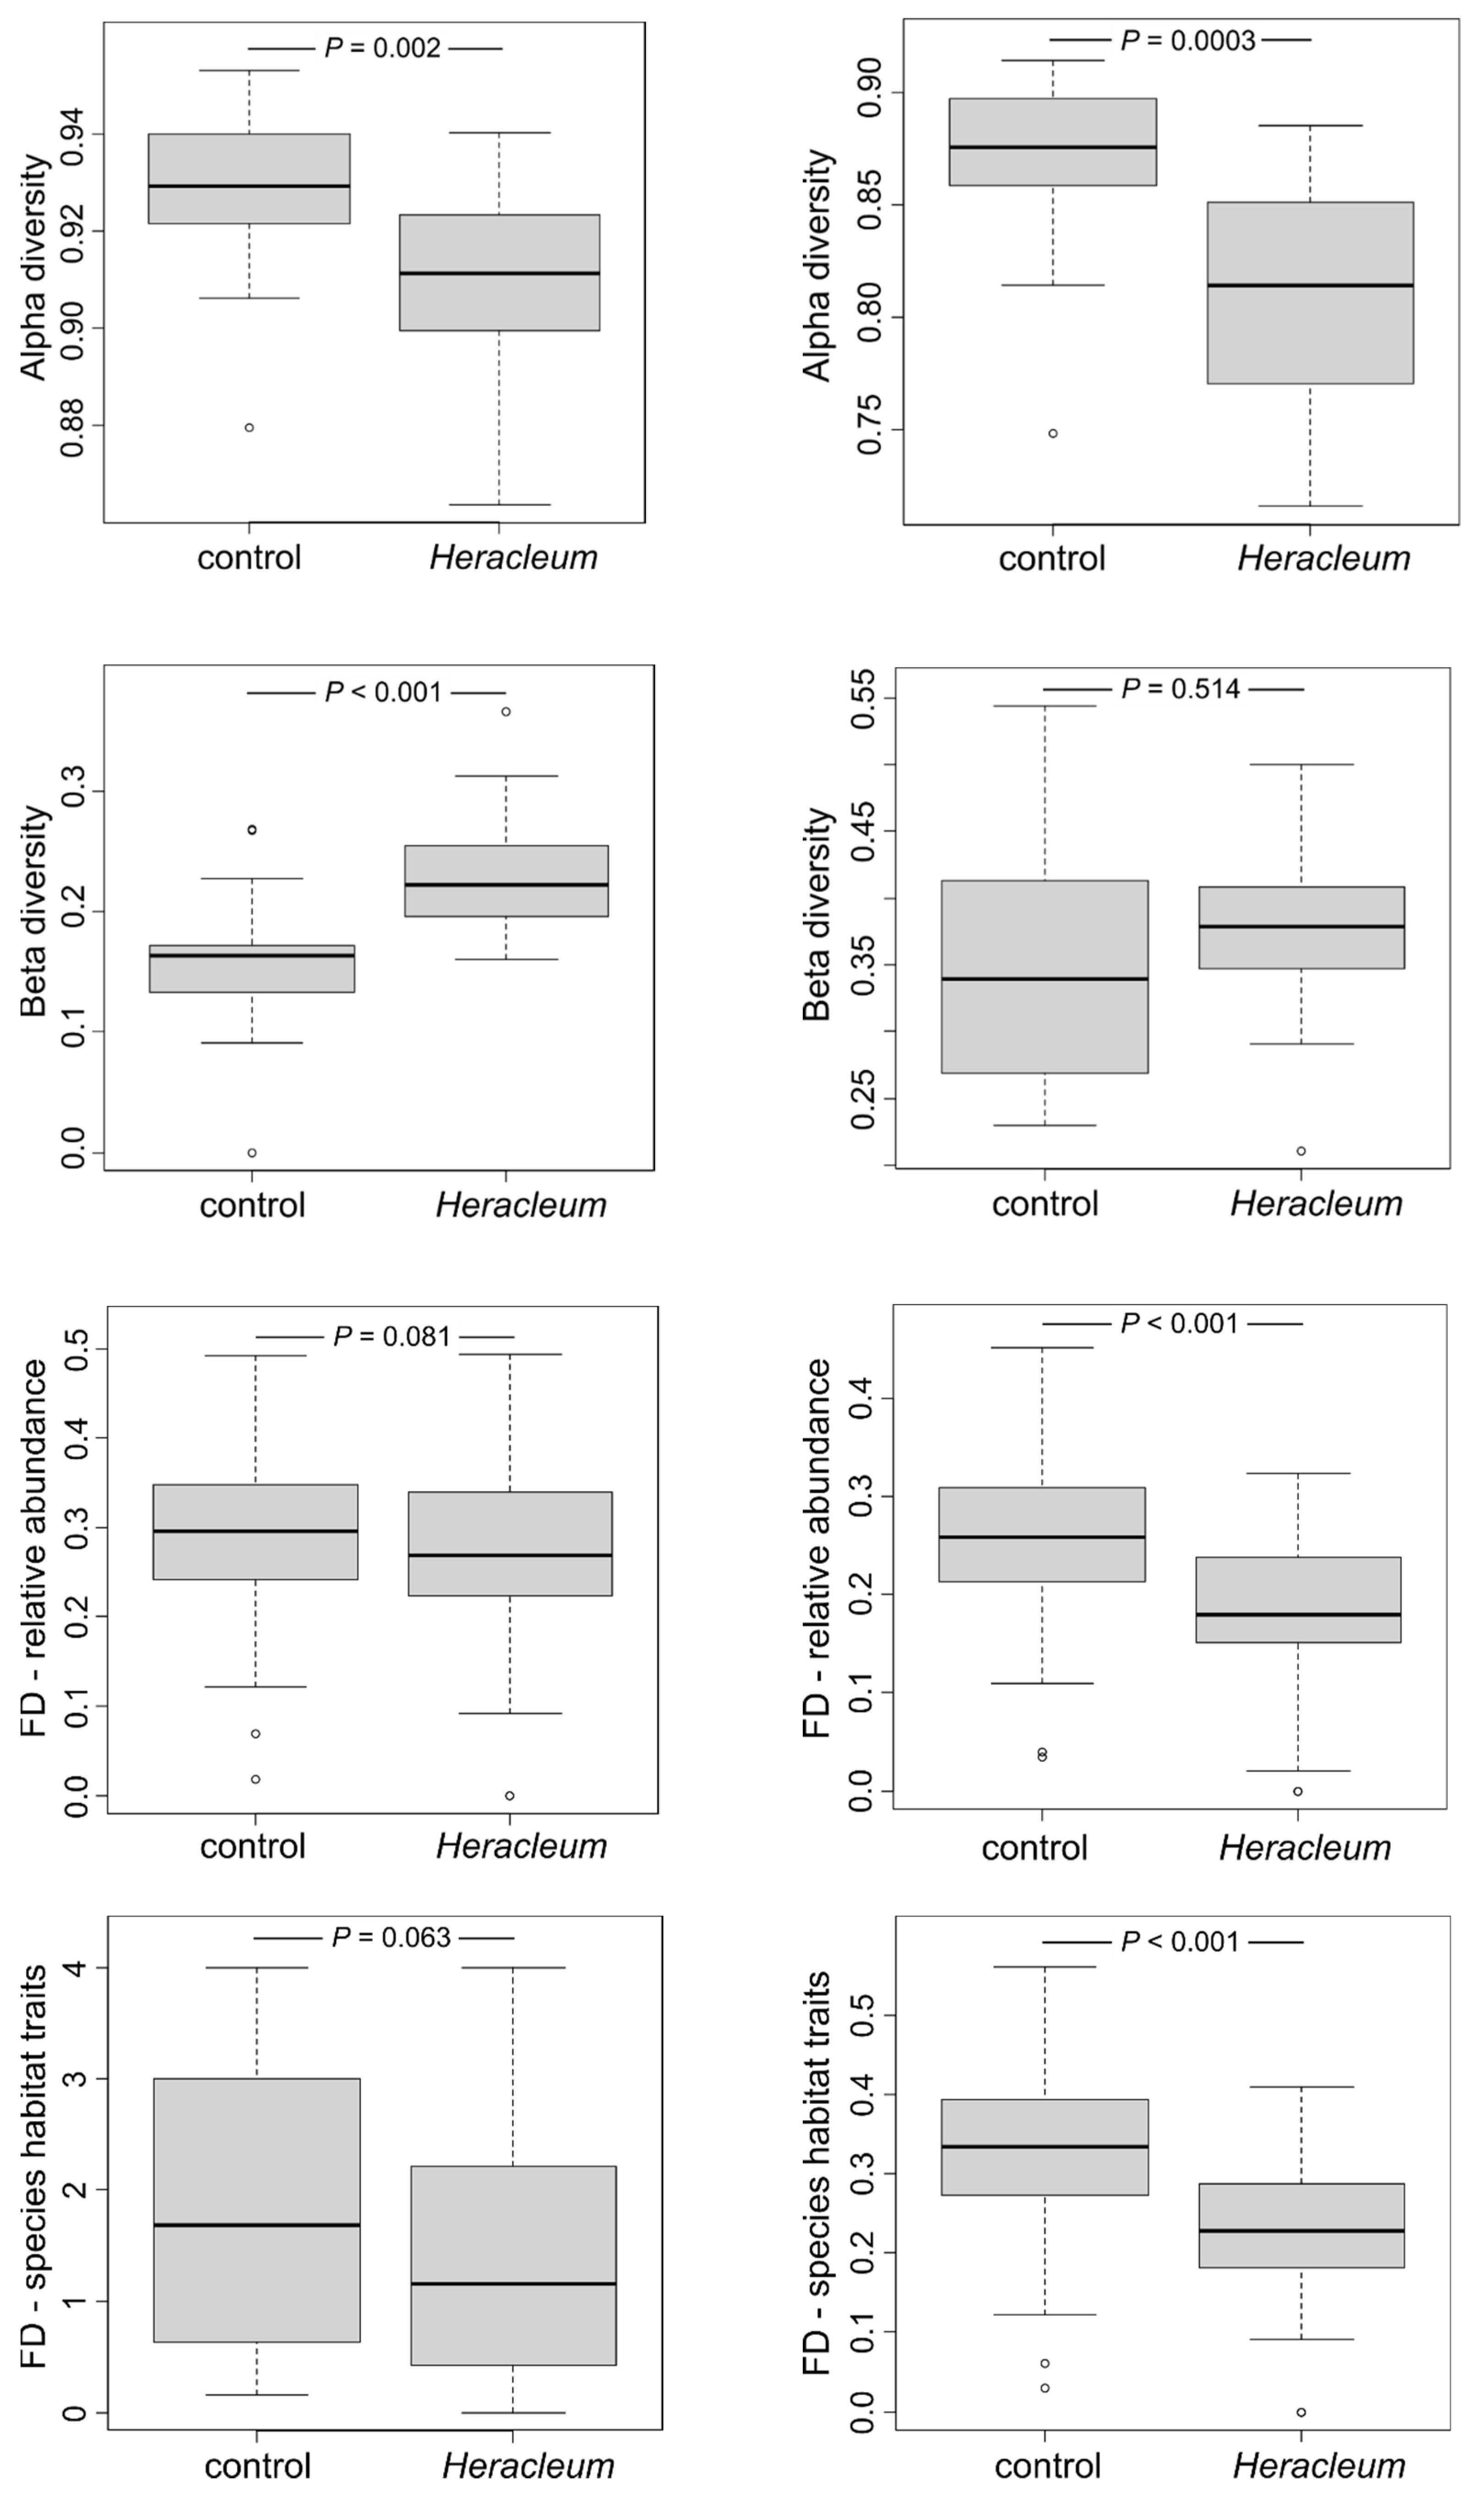
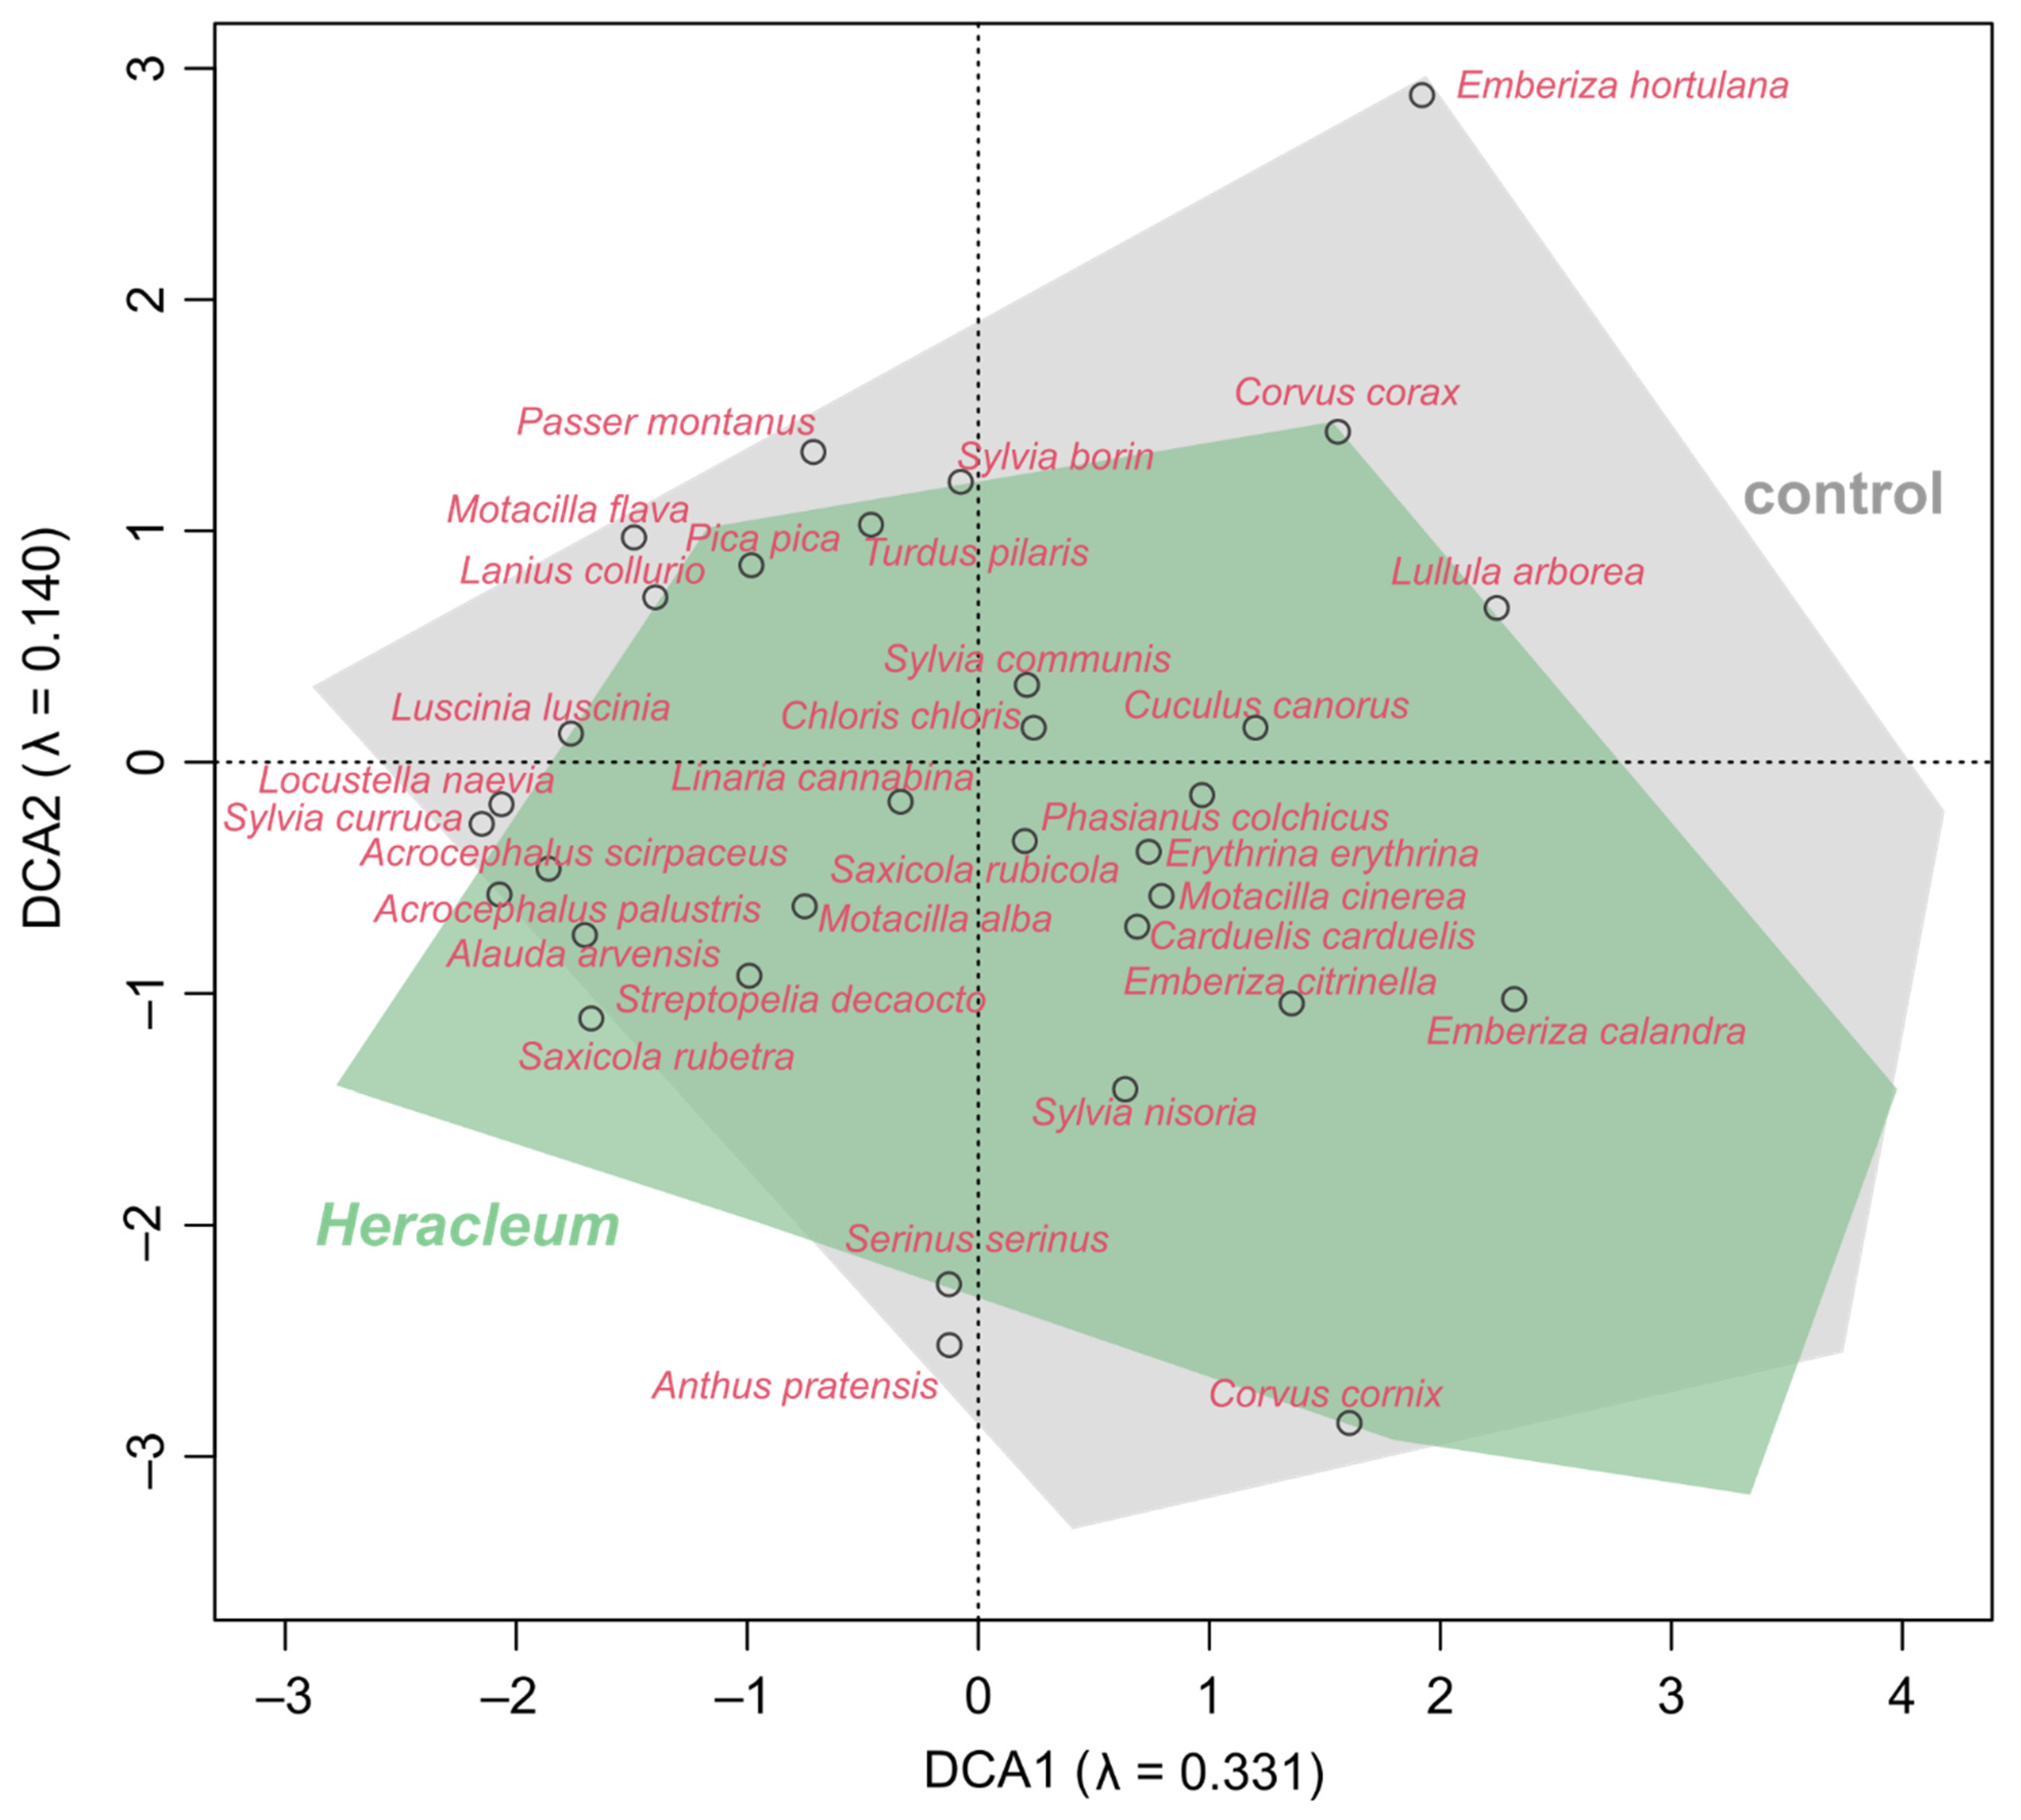
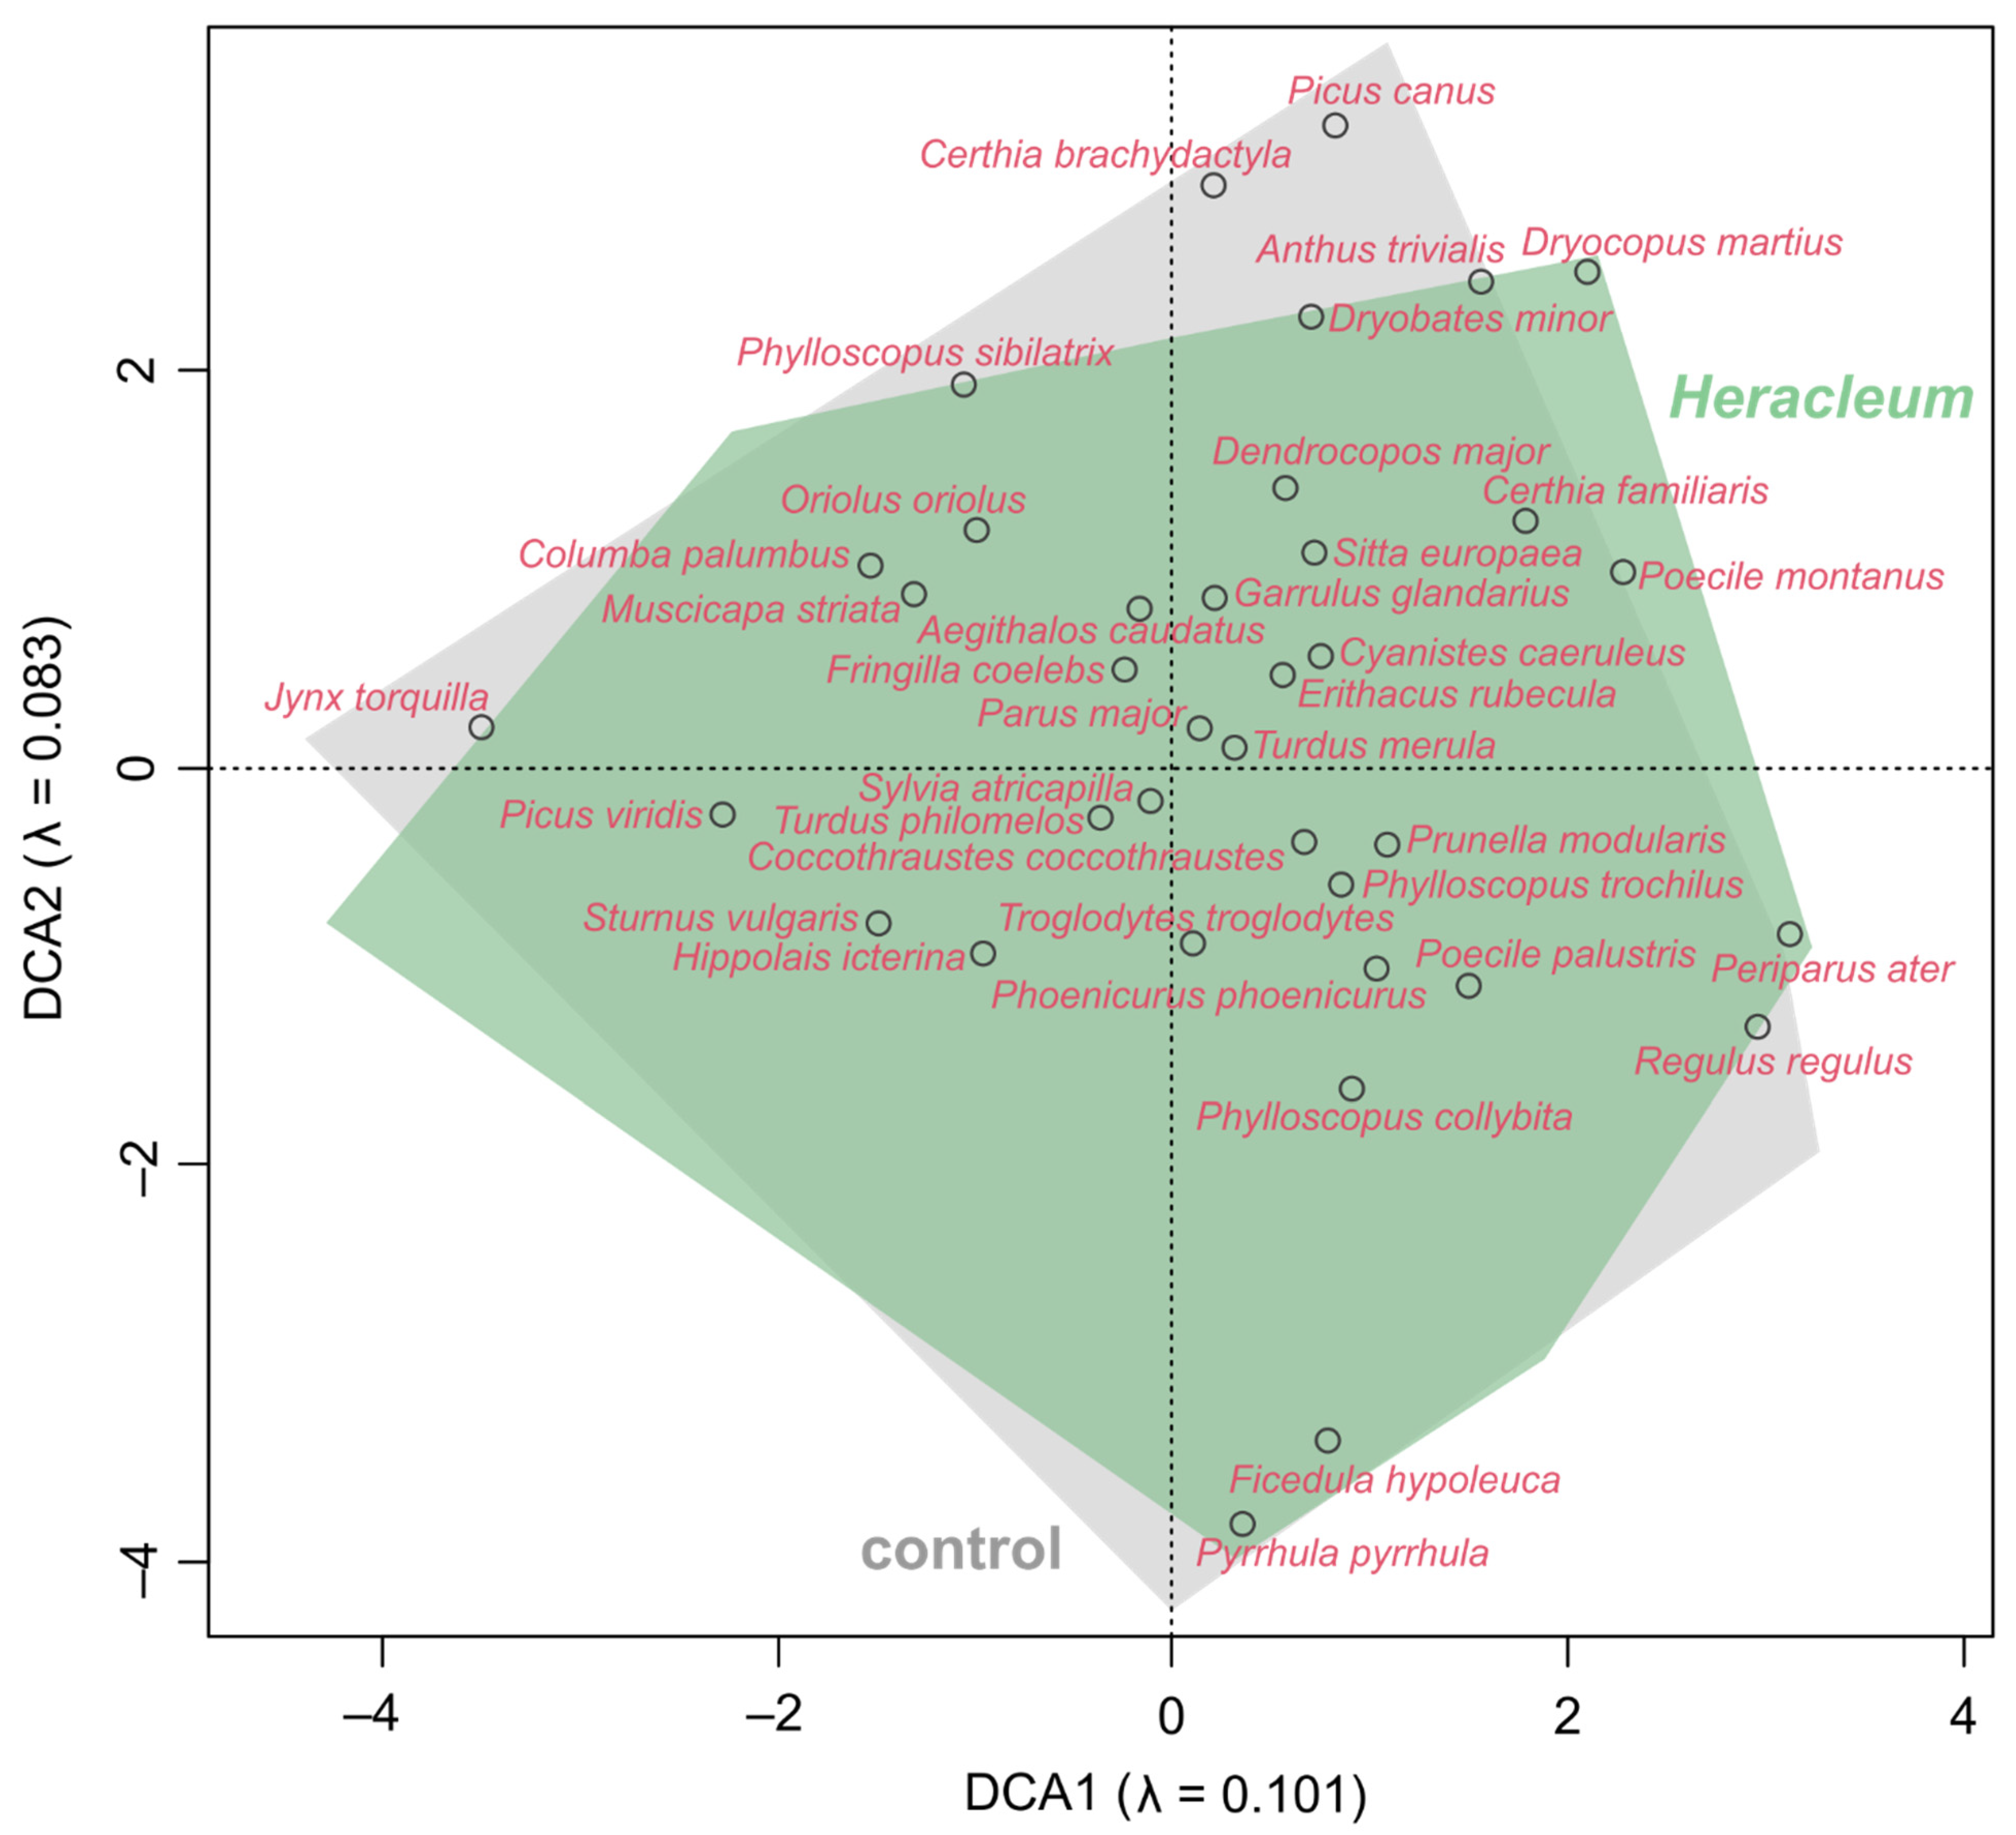
3.3. Impact of Invading Weeds on the Bird Communities’ Diversity and Dissimilarity

This research indicated that the alpha diversity was lower on sites with Caucasian hogweeds than on controls in both forest and non-forest birds. Concerning the beta diversity, it was shown that in the presence of invasion, forest birds formed a significantly different community than in the control areas, while there was no such effect in the case of non-forest birds (Figure 6). In the presence of hogweeds, habitats accessible to non-forest birds were occupied by species habitually close to those missing or less abundant ones in comparison with control sites, for example, lesser whitethroat Sylvia curruca on control sites could have been replaced by common whitethroat S. communis or barred warbler S. nisoria in invaded sites (Figure 7, Table A1, Appendix A). In the case of forest birds, those associated with stumps and mature trees such as woodpeckers were absent (grey-headed woodpecker Picus canus) or less abundant (Eurasian wryneck Jynx torquilla, lesser spotted woodpecker Dryobates minor, European green woodpecker Picus viridis) near hogweeds (Figure 8, Table A1). Forests with invasion had a lower abundance of typical forest species, e.g., Eurasian jay Garrrulus glandarius, European robin Erithacus rubecula, wood warbler Phylloscopus sibilatrix, Eurasian wren Troglodytes troglodytes in those locations less related to mature forests than on control sites (CWMs, Table A1). DCA graphs showed that in the case of non-forest birds more species were missing from invaded sites compared to control ones (Figure 7) than in a similar situation in forest species (Figure 8). Typical forest species occurred in both groups of sites (Figure 7), which was reflected by the lack of differences in functional diversity (FD) based on the relative abundance and habitat traits of those birds in comparison between groups (Figure 6). In contrast, functional diversity was lower in the case of non-forest birds living in invaded areas (Figure 6).

4. Discussion

The conducted research showed that, as predicted, larger invaded areas in combination with anthropogenic areas decreased the abundance of forest birds along with the decreasing forest area. Both forest and non-forest birds showed reduced alpha diversity in the vicinity of invading plants. It turned out, however, that both of these communities unexpectedly differed in terms of other diversity indicators. Invaded forests resulted in the development of a unique forest bird community despite the lack of changes in its functional diversity in comparison with the control sites. Despite greater losses in the number of species in the case of non-forest birds, these birds did not create a unique community, but their functional diversity decreased near invasion. Considering that the studied invasive plants were large weeds, these differences are quite intuitive as they indicated that the change in habitat physiognomy resulting from the presence of herbaceous invaders was more negative for non-forest than forest birds. On the other hand, the conducted research is the first one indicating the described changes in the forest bird community.
The background for the most important results is the changes in species number and abundance of birds from various communities. The presence of invading weeds significantly reduced the number of species of both forest and non-forest birds, and in the case of forest birds also their abundance. This is not an obvious result, because the influence of exotic vegetation on birds was neutral in about 48% of the studies included in the review [58], so the conducted research followed the uncommon trend of the negative impact of invasive plants on birds known from about 26% articles [58]. In this study, the abundance of non-forest birds did not change in the invaded sites compared to controls. As the presence of plant invasion has reduced the abundance of all birds and species, changes in forest bird community reflected the overall trend more than non-forest birds. However, it should be mentioned that this was partly due to the selection of study sites in forested areas. The lack of influence of invading plants on the abundance of non-forest birds could be undetectable in this case (too small non-forest area), as the negative impact of Caucasian hogweeds on birds in open areas has already been demonstrated in a larger number of various sites in the other conducted research [21]. Non-forest bird community was included in this study only as an accompanying component of forest birds’ community, appearing in areas adjacent to forests before they are covered with trees. Non-forest birds could not be underestimated, as some species could appear in the forests via invading plants. The described assumption is important for the further interpretation of the differences between communities in changes of diversities.
Despite the similarly negative impact of invasive Caucasian hogweeds on the alpha diversity of both forest and non-forest birds, the influence of the studied invasion had different effects on the beta and functional diversity of individual communities. Unexpectedly, although herbaceous invaders did not reach the forest canopy, the studied invasion affected the beta diversity of forest birds and this was the community that developed a unique species list in forested areas, not non-forest birds. This is surprising since most of the species that were lacking in invaded areas were non-forest birds, not forest birds, although invading plants appearing in forests are also known as having diverse ecological roles, including the negative ones [15]. In the case of forest birds, functional diversity did not change significantly near invasion, which suggests that forests with hogweeds did not lack key species from the forest birds community. This may be related to the mentioned position and height of invasive weeds, too low to pose a significant threat to forest birds associated with high treetops. The DCA graph indicated that typical forest bird species still lived in wooded areas, and the changes mainly concerned specific species requiring mature forest, that lived in younger forests near the invaders. This may mean that forest birds were forced to such changes in the community. At the same time, modification in the physiognomy of the forest habitat in lower parts of the forest could change the proportions of forest birds occurring there.
Given that alpha diversity described species diversity within an environment, and beta diversity between environments [59], the obtained results indicated that in the case of non-forest birds, the lack of specific species in the environment might be replaced by other habitually close non-forest birds and hence no differences in beta diversity when invaded and control sites were compared. Moreover, in previous studies on Caucasian hogweeds, it was found that ground/herb dwellers showed weaker responses to invasion in forested areas because among invasive plants growing in lower densities, they could find patches of natural habitats near the ground [21]. For forest birds, the availability of other forested areas possible to be used in the case of plant invasion was probably limited. This was because the research was conducted in specific forests—small in surface, located in the mosaic of habitats, usually surrounded by open areas. However, these are the typical forests with invasive weeds. Forest birds assembling in isolated developing complexes probably could not easily change their habitat in the event of the emergence of invasive weeds. Although this explained the forced changes in beta diversity of the forest bird community, it can also mean that the combination of forest and weeds in such an environment has created a kind of ecological trap for forest birds.
This study showed that in the case of non-forest birds, the pattern of alpha and functional diversity changing near plant invasion was the same, while in the case of forest birds, the changes in alpha and functional diversity contrasted with each other. In the case of non-forest birds, this can be interpreted in such a way that most of the species in this community inhabited only one of the different habitats forming a mosaic of open areas with shrubs and an ecotone zone. The levels of these habitats varied and even if some species could replace the ones missing, for example in shrubs, at the same time other species were losing their habitat by invasion, for example, open-area birds. Although it is quite surprising that a forest community that lost its species richness in invaded sites also created a unique species composition and did not show significant negative responses in functional diversities based on birds’ relative abundance and relationship (or lack of it) with forest maturity, the forest is not a mosaic of different habitats. Despite the modification of habitat requirements of some forest birds and the reduced abundance of some typical forest species, the community did not lose access to a specific habitat after the appearance of invading weeds. This seems to explain the presence of a functionally unchanged unique community despite the significant regression of the species diversity. This result represents a new contribution to the understanding of the diversities of communities living in forested and invaded areas. In other earlier studies, species richness was opposed to all facets of functional diversity along most of the investigated land-use change axes. Studies showing incongruences between taxonomic and functional diversity have warned against relying on species richness as a surrogate of all facets of biodiversity [32,60], which was confirmed in this work. This is also in line with the recommendation of considering simultaneously multiple taxonomic and trait-based indices [30,33]. The presence of weeds in open areas significantly changed the functional diversity of non-forest birds, despite the attractiveness of such areas for generalists, e.g., common whitethroat. However, it did not change the functional variability of the forest community, which was less mobile.
Most importantly, the repeated opposition of species and functional diversity showed that divergent land-use dynamics can favor different aspects of bird communities to the detriment of others and dependency. For example, the encroachment of shrubs into open areas that were functionally rich in bird communities led to the loss of typical desert species while creating favored conditions for generalists (e.g., finches) [61]. The spatial dependence of habitats could have influenced the results also in the presented research. The high abundance of forest birds in forested areas around 0.5 ha decreased with increasing forest area to 1.5 ha, and at the same time increased with increasing invasion of 1.0–1.5 ha. This may have been due to the fact that the small forest complexes were too young to be overgrown by weeds and predominantly complexes of around 1.0–1.5 ha may have arisen at the same time as the current severely invaded areas, formerly known as crops. These two types of habitats developing together since the beginning may now coexist in space in an opposite way affecting the abundance of forest birds. In this case, the invasion could appear both within the forests and in adjacent open areas because no distinction was made in what habitat the invaders grew in.
The invariable functional diversity of forest birds, despite the presence of invasive weeds, could also result from the fact that herbaceous plants will always affect forests to a lesser extent than open areas, e.g., meadows. Scientists studying the influence of invasive species on forest plant communities found an overlap of species composition among invaded and non-invaded forests and low impacts of invasive species on taxonomic diversity and functional richness. They found no impacts of invasions on plant functional diversity components. In contrast, they found that the natural regeneration of forest-forming tree species reached lower densities in invaded than non-invaded forest types. Sub-canopy and shrub species paradoxically reached higher densities in invaded than non-invaded forest types. Thus, sometimes invasive species can support the natural regeneration of sub-canopy and shrub species [62]. Since the presented research concerned young, changing forests, this may explain the lack of changes in functional diversity of forest birds, which, paradoxically, despite the presence of invasive weeds, likely found the necessary resources near the herbaceous plant invaders.

5. Conclusions

In conclusion, the conducted research indicated a so far unknown mechanism of the influence of invasive herbaceous plants of large sizes on the forest bird community. Invasive weeds growing on the outskirts and in small-sized forests at a young age significantly reduced the alpha diversity of forest birds, their abundance, as well as caused the formation of a unique forest bird community with unchanged functional diversity. This was most likely due to the limited possibilities of habitat change. Non-forest birds have not developed a unique community in the neighborhood, and a greater loss of species suggested their habitat loss or physiognomic changes of sites in the face of invasion. The conducted research has shown that herbaceous weeds affect not only non-forest but also forest bird communities, which suggests the need to remove invaders from various habitats. It is particularly recommended to remove weeds from open areas and forests of approximately 1.0–1.5 ha, which may have started to develop with the abandonment of the weeds, which facilitated the invasion.

Funding

The research was funded by the National Science Centre in Kraków, Poland, grant Sonatina-2 to E.G., grant number UMO-2018/28/C/NZ8/00283.

Institutional Review Board Statement

Not applicable.

Informed Consent Statement

Not applicable.

Data Availability Statement

Data are available from the author upon request. The data are not publicly available due to the author’s policy of saving unpublished data for future publications.

Acknowledgments

The author would like to thank two anonymous referees and the Editor, Jan Riegert, for suggestions that helped improve the manuscript. The author kindly thanks Jiří Reif for useful suggestions to the conducted research and the prepared article.

Conflicts of Interest

The author declares no conflict of interest.

Appendix A

Table A1. List of 70 bird species observed during research on N = 38 sites that were sorted into two communities. Species habitat traits were the community-level weighted trait values, CWMs, reflecting functional diversity (see Section 2.4. Data analyses). The blue color indicates which species might have been responsible for the functional diversity of the forest bird community, while the red color applies to non-forest birds in the same context.
SpeciesBird AbundanceSpecies Habitat Traits, CWMsCommunity
TotalControl
Sites
Heracleum
Sites
Control SitesHeracleum Sites
Sturnus vulgaris16286763.793.79forest
Parus major13979604.004.00forest
Turdus pilaris12573521.681.37non-forest
Turdus merula13970693.002.84forest
Sylvia atricapilla15069813.583.63forest
Fringilla coelebs14269733.843.37forest
Turdus philomelos11160513.002.68forest
Sylvia communis13952871.001.00non-forest
Columba palumbus6042183.262.05forest
Carduelis carduelis8742451.001.00non-forest
Erithacus rubecula5936233.051.79forest
Dendrocopos major5635212.952.26forest
Phylloscopus collybita6334292.051.89forest
Garrulus glandarius5933263.582.95forest
Cyanistes caeruleus4832162.531.26forest
Alauda arvensis5332210.000.00non-forest
Coccothraustes coccothraustes4929202.211.58forest
Emberiza calandra382990.000.00non-forest
Hippolais icterina5126251.000.00forest
Phasianus colchicus4326173.002.68non-forest
Troglodytes troglodytes3824143.211.68forest
Phylloscopus trochilus5223292.052.21forest
Sitta europaea261970.580.53forest
Lanius collurio3619173.161.26non-forest
Saxicola rubetra3319140.000.00non-forest
Emberiza citrinella3319141.001.00non-forest
Oriolus oriolus3418161.581.16forest
Pica pica261791.050.42non-forest
Streptopelia decaocto171520.840.21non-forest
Cuculus canorus181531.370.32non-forest
Phylloscopus sibilatrix2414102.051.26forest
Aegithalos caudatus191360.740.32forest
Motacilla cinerea191270.740.42non-forest
Corvus cornix131120.740.10non-forest
Motacilla alba2111100.000.00non-forest
Sylvia borin14950.630.32non-forest
Jynx torquilla12841.680.84forest
Picus viridis11831.680.63forest
Dryobates minor11831.260.47forest
Passer montanus8800.320.00non-forest
Linaria cannabina10820.420.10non-forest
Ficedula hypoleuca11740.840.84forest
Anthus trivialis9720.790.32forest
Pyrrhula pyrrhula9720.630.16forest
Muscicapa striata10640.210.10forest
Phoenicurus phoenicurus9630.000.00forest
Prunella modularis8620.210.42forest
Regulus regulus12660.000.00forest
Corvus corax7610.840.63non-forest
Lullula arborea7610.630.47non-forest
Luscinia luscinia10640.000.00non-forest
Saxicola rubicola9631.260.42non-forest
Erythrina erythrina14680.000.00non-forest
Poecile montanus9540.630.32forest
Motacilla flava5500.000.00non-forest
Acrocephalus palustris13490.000.00non-forest
Sylvia curruca3300.320.00non-forest
Anthus pratensis3300.000.00non-forest
Serinus serinus5320.000.00non-forest
Picus canus2200.260.00forest
Dryocopus martius3210.420.21forest
Periparus ater4220.210.21forest
Certhia familiaris4220.000.00forest
Acrocephalus scirpaceus4220.420.42non-forest
Chloris chloris6240.000.00non-forest
Poecile palustris2110.160.16forest
Certhia brachydactyla1100.000.00forest
Locustella naevia1100.210.00non-forest
Emberiza hortulana1100.000.00non-forest
Sylvia nisoria2020.000.00non-forest
Table A2. Differences in the area of habitat variables between control and Heracleum sites (in a radius of 100 m from surveying points) in all sites (N = 38) checked by Kruskal–Wallis test.
Habitat VariablesControlHeracleumχ2dfp
Mean ± SD, Range (ha *)Mean ± SD, Range (ha *)
100 m Radius
Forest area1.360 ± 0.86, 0.405–2.6501.220 ± 0.78, 0.401–2.7900.00210.961
Number of patches8.380 ± 4.41, 3–16.0007.860 ± 3.35, 3–16.0000.01510.903
Open area1.140 ± 0.82, 0–2.2900.639 ± 0.68, 0–2.0102.80510.094
Overgrown area1.680 ± 0.68, 0.850–2.6501.450 ± 0.67, 0.554–2.7900.98910.319
Anthropogenic area Invasion area0.150 ± 0.23, 0–0.672
-
0.468 ± 0.67, 0–2.070
0.455 ± 0.38, 0.153–1.510
2.103
-
1
0.147
-
* excluding number of patches.

Appendix B

The relationships between single predictors and dependent variable shown by the LMM model (Table 1, Section 3.2. Impact of invaded area, forest area and anthropogenic area on forest birds) were additionally presented on plots (see below). Due to the fact that relationships between the abundance of forest birds (dependent variable) and invaded and anthropogenic areas were negative (Figure 5 and Figure A1), while the accompanying estimates were positive (Table 1), there were assessed non-linear relationships between the dependent variable and those predictors. It was investigated whether the influence of given habitat areas on the dependent variable was linear or not using the quadratic model option in the linear model formula (“lm” function) available in the R 4.0.4 basic statistic formulas. If the influence of habitat variable on the dependent variable was significantly stronger in the case of quadratic habitat^2 value than its linear counterpart, the quadratic variable more appropriately explained the relationship, which was in line with a positive estimate in the main LMM. The difference between linear and quadratic relationships was assessed by comparison of R-squared between two linear models with a particular dependent variable—one model had only linear value as a predictor and the second one was polynomial with both linear and quadratic values. The values of R-squared in both linear and non-linear options of relationships (in all cases higher in the second option) were shown on plots.
Figure A1. Plots showing the relationships between habitat variables used as predictors in the main LMM (Table 1) and the abundance of forest birds; the values of R-squared showed that in all cases the non-linear options better explained the relationships and reflected positive estimates in LMM.
Diversity 14 00229 g0a1

References

  1. Vitousek, P.M.; D’Antonio, C.M.; Loope, L.L.; Westbrooks, R. Biological invasions as global environmental change. Am. Sci. 1996, 84, 468–478. [Google Scholar]
  2. Ricciardi, A.; Blackburn, T.M.; Carlton, J.T.; Dick, J.T.A.; Hulme, P.E.; Iacarella, J.C.; Jeschke, J.M.; Liebhold, A.M.; Lockwood, J.L.; MacIsaac, H.J.; et al. Invasion Science: A Horizon Scan of Emerging Challenges and Opportunities. Trends Ecol. Evol. 2017, 32, 464–474. [Google Scholar] [CrossRef] [PubMed] [Green Version]
  3. Pyšek, P.; Hulme, P.E.; Simberloff, D.; Bacher, S.; Blackburn, T.M.; Carlton, J.T.; Dawson, W.; Essl, F.; Foxcroft, L.C.; Genovesi, P.; et al. Scientists’ warning on invasive alien species. Biol. Rev. 2020, 95, 1511–1534. [Google Scholar] [CrossRef] [PubMed]
  4. Ehrenfeld, J.G. Ecosystem consequences of biological invasions. Ann. Rev. Ecol. Evol. Syst. 2010, 41, 59–80. [Google Scholar] [CrossRef] [Green Version]
  5. Vila, M.; Espinar, J.L.; Hejda, M.; Hulme, P.E.; Jarošík, V.; Maron, J.L.; Pergl, J.; Schaffner, U.; Sun, Y.; Pyšek, P. Ecological impacts of invasive alien plants: A meta-analysis of their effects on species, communities and ecosystems. Ecol. Lett. 2011, 14, 702–708. [Google Scholar] [CrossRef] [PubMed]
  6. Schirmel, J.; Bundschuh, M.; Entling, M.H.; Kowarik, I.; Buchholz, S. Impacts of invasive plants on resident animals across ecosystems, taxa, and feeding types: A global assessment. Global Chang. Biol. 2016, 22, 594–603. [Google Scholar] [CrossRef] [PubMed]
  7. Buckley, Y.M. The role of research for integrated management of invasive species, invaded landscapes and communities. J. Appl. Ecol. 2008, 45, 397–402. [Google Scholar] [CrossRef]
  8. Gaskin, J.F.; Espeland, E.; Johnson, C.D.; Larson, D.L.; Mangold, J.M.; McGee, R.A.; Milner, C.; Paudel, S.; Pearson, D.E.; Perkins, L.B.; et al. Managing invasive plants on Great Plains grasslands: A discussion of current challenges. Rang. Ecol. Manag. 2021, 78, 235–249. [Google Scholar] [CrossRef]
  9. Elton, C.S. The Ecology of Invasions by Animals and Plants; Springer: Boston, MA, USA, 1958. [Google Scholar]
  10. Case, T.K. Invasion resistance arises in strongly interacting species-rich model competition communities. Proc. Nat. Acad. Sci. USA 1990, 87, 9610–9614. [Google Scholar] [CrossRef] [PubMed] [Green Version]
  11. Law, R.; Morton, R.D. Permanence and the assembly of ecological communities. Ecology 1996, 77, 762–775. [Google Scholar] [CrossRef]
  12. Rejmánek, M. Species richness and resistance to invasion. In Biodiversity and Ecosystem Processes in Tropical Forests; Orians, G.G., Dirzo, R., Cushman, J.H., Eds.; Springer: Berlin, Germany, 1996; pp. 153–172. [Google Scholar]
  13. Tilman, D. Community invisibility, recruitment limitation and grassland biodiversity. Ecology 1997, 78, 81–92. [Google Scholar] [CrossRef]
  14. Firn, J.; Price, J.N.; Whalley, R.D. Using strategically applied grazing to manage invasive alien plants in novel grasslands. Ecol. Process 2013, 2, 26. [Google Scholar] [CrossRef] [Green Version]
  15. Liebhold, A.M.; Brockerhoff, E.G.; Kalisz, S.; Nuñez, M.A.; Wardle, D.A.; Wingfield, M.J. Biological invasions in forest ecosystems. Biol. Invasions 2017, 19, 3437–3458. [Google Scholar] [CrossRef]
  16. Hanzelka, J.; Reif, J. Effects of vegetation structure on the diversity of breeding bird communities in forest stands of non-native black pine (Pinus nigra A.) and black locust (Robinia pseudoacacia L.) in the Czech Republic. For. Ecol. Manag. 2016, 379, 102–113. [Google Scholar] [CrossRef]
  17. Hejda, M.; Hanzelka, J.; Kadlec, T.; Štrobl, M.; Pyšek, P.; Reif, J. Impacts of an invasive tree across trophic levels: Species richness, community composition and resident species’ traits. Divers. Distrib. 2017, 23, 997–1007. [Google Scholar] [CrossRef]
  18. Kroftová, M.; Reif, J. Management implications of bird responses to variation in non-native/native tree ratios within central European forest stands. For. Ecol. Manag. 2017, 391, 330–337. [Google Scholar] [CrossRef]
  19. Schneider, S.C.; Miller, J.R. Responses of avian communities to invasive vegetation in urban forest fragments. Condor 2014, 116, 459–471. [Google Scholar] [CrossRef]
  20. Aravind, N.A.; Rao, D.; Ganeshaiah, K.N.; Shaanker, R.U.; Poulsen, J.G. Impact of the invasive plant, Lantana camara, on bird assemblages at Malé Mahadeshwara Reserve Forest, South India. Trop. Ecol. 2010, 51, 325–338. [Google Scholar]
  21. Grzędzicka, E.; Reif, J. Impacts of an invasive plant on bird communities differ along a habitat gradient. GECCO 2020, 23, e01150. [Google Scholar] [CrossRef]
  22. Grzędzicka, E.; Reif, J. The impact of Sosnowsky’s Hogweed on feeding guilds of birds. J. Ornithol. 2021, 162, 1115–1128. [Google Scholar] [CrossRef]
  23. Wade, T.G.; Riitters, K.H.; Wickham, J.D.; Jones, K.B. Distribution and causes of global forest fragmentation. Conserv. Ecol. 2003, 7, 7. [Google Scholar] [CrossRef]
  24. Sala, O.E.; Chapin, F.S., III; Armesto, J.J.; Berlow, E.; Bloomfield, J.; Dirzo, R.; Huber-Sanwald, E.; Huenneke, L.F.; Jackson, R.B.; Kinzig, A.; et al. Global biodiversity scenarios for the year 2100. Science 2000, 287, 1770–1774. [Google Scholar] [CrossRef] [PubMed]
  25. Montanarella, L.; Scholes, R.; Brainich, A. The IPBES Assessment Report on Land Degradation and Restoration; IPBES: Bonn, Germany, 2018. [Google Scholar]
  26. Nielsen, C.; Ravn, H.P.; Nentwig, W.; Wade, M. (Eds.) The Giant Hogweed Best Practice Manual. Guidelines for the Management and Control of an Invasive Weed in Europe; Forest & Landscape Denmark: Hoersholm, Denmark, 2005; p. 44. [Google Scholar]
  27. Henry, P.; Le Lay, G.; Goudet, J.; Guisan, A.; Jahodová, S.; Besnard, G. Reduced genetic diversity, increased isolation and multiple introductions of invasive giant hogweed in the western Swiss Alps. Mol Ecol. 2009, 18, 2819–2831. [Google Scholar] [CrossRef] [PubMed]
  28. Chadin, I.; Dalke, I.; Zakhozhiy, I.; Malyshev, R.; Madi, E.; Kuzivanova, O.; Kirillov, D.; Elsakov, V. Distribution of the invasive plant species Heracleum sosnowskyi Manden. in the Komi Republic (Russia). PhytoKeys 2017, 77, 71–80. [Google Scholar] [CrossRef] [PubMed] [Green Version]
  29. Renčo, M.; Jurová, J.; Gömöryová, E.; Čerevková, A. Long-Term Giant Hogweed Invasion Contributes to the Structural Changes of Soil Nematofauna. Plants 2021, 10, 2103. [Google Scholar] [CrossRef] [PubMed]
  30. McGill, B.; Enquist, B.; Weiher, E.; Westoby, M. Rebuilding community ecology from functional traits. Trends Ecol. Evol. 2006, 21, 178–185. [Google Scholar] [CrossRef]
  31. Bellard, C.; Bertelsmeier, C.; Leadley, P.; Thuiller, W.; Courchamp, F. Impacts of climate change on the future of biodiversity. Ecol. Lett. 2012, 15, 365–377. [Google Scholar] [CrossRef] [PubMed] [Green Version]
  32. Devictor, V.; Mouillot, D.; Meynard, C.; Jiguet, F.; Thuiller, W.; Mouquet, N. Spatial mismatch and congruence between taxonomic, phylogenetic and functional diversity: The need for integrative conservation strategies in a changing world. Ecol. Lett. 2010, 13, 1030–1040. [Google Scholar] [CrossRef] [PubMed]
  33. Cadotte, M.W.; Carscadden, K.; Mirotchnick, N. Beyond species: Functional diversity and the maintenance of ecological processes and services. J. Appl. Ecol. 2011, 48, 1079–1087. [Google Scholar] [CrossRef]
  34. Carmona, C.P.; de Bello, F.; Mason, N.W.H.; Lepš, J. Traits without borders: Integrating functional diversity across scales. Trends Ecol. Evol. 2016, 31, 382–394. [Google Scholar] [CrossRef]
  35. Tilman, D.; Knops, J.; Wedin, D.; Reich, P.; Ritchie, M.; Siemann, E. The Influence of functional diversity and composition on ecosystem processes. Science 1997, 277, 1300–1302. [Google Scholar] [CrossRef] [Green Version]
  36. Newbold, T.; Hudson, L.N.; Arnell, A.P.; Contu, S.; De Palma, A.; Ferrier, S.; Hill, S.L.; Hoskins, A.J.; Lysenko, I.; Phillips, H.R.; et al. Has land use pushed terrestrial biodiversity beyond the planetary boundary? A global assessment. Science 2016, 353, 288–291. [Google Scholar] [CrossRef] [PubMed]
  37. Oliveira, B.F.; Machac, A.; Costa, G.C.; Brooks, T.M.; Davidson, A.D.; Rondinini, C.; Graham, C.H. Species and functional diversity accumulate differently in mammals. Global Ecol. Biogeogr. 2016, 25, 1119–1130. [Google Scholar] [CrossRef]
  38. Barnagaud, J.; Kissling, W.D.; Constantinos, T.; Fisikopoulos, V.; Villéger, S.; Sekercioglu, C.H. Biogeographical, environmental and anthropogenic determinants of global patterns in bird taxonomic and trait turnover. Global Ecol. Biogeogr. 2017, 26, 1190–1200. [Google Scholar] [CrossRef]
  39. Le Provost, G.; Badenhausser, I.; Le Bagousse-Pinguet, Y.; Clough, Y.; Henckel, L.; Violle, C.; Bretagnolle, V.; Roncoroni, M.; Manning, P.; Gross, N. Land-use history impacts functional diversity across multiple trophic groups. Proc. Natl. Acad. Sci. USA 2020, 117, 1573–1579. [Google Scholar] [CrossRef] [PubMed]
  40. Hanowski, J.M.; Niemi, G.J. Experimental Design Considerations for Establishing an Off-Road, Habitat-specific Bird Monitoring Program Using Point Counts. In USDA Forest Service General Technical Report PSW-GTR-149; US Department of Agriculture, Forest Service, Pacific Southwest Research Station: Albany, NY, USA, 1995. [Google Scholar]
  41. Jiguet, F. Method-learning caused first-time observer effect in a newly-started breeding bird survey. Hous. Theor. Soc. 2009, 56, 253–258. [Google Scholar] [CrossRef]
  42. Deikumah, J.P.; Kwafo, R.; Konadu, V.A. Land use types influenced avian assemblage structure in a forest-agriculture landscape in Ghana. Ecol. Evol. 2017, 7, 8685–8697. [Google Scholar] [CrossRef] [PubMed]
  43. Lüdecke, D.; Makowski, D.; Waggoner, P.; Patil, I. Performance: Assessment of Regression Models Performance. Available online: https://CRAN.R-project.org/package=performance/ (accessed on 13 September 2021).
  44. Kim, J.H. Multicollinearity and misleading statistical results. Korean J. Anesthesiol. 2019, 72, 558–569. [Google Scholar] [CrossRef] [PubMed] [Green Version]
  45. Wickham, H.; François, R.; Henry, L.; Müller, K. Dplyr: A Grammar of Data Manipulation. R Package Version 1.0.5. Available online: https://CRAN.R-project.org/package=dplyr (accessed on 11 March 2021).
  46. Bates, D.; Maechler, M.; Bolker, B.; Walker, S. Fitting Linear Mixed-Effects Models Using lme4. J. Stat. Soft. 2015, 67, 1–48. [Google Scholar] [CrossRef]
  47. Calcagno, V. Glmulti: Model Selection and Multimodel Inference Made Easy. R Package Version 1.0.8. Available online: https://CRAN.R-project.org/package=glmulti/ (accessed on 7 April 2021).
  48. Oksanen, J.; Blanchet, F.G.; Friendly, M.; Kindt, R.; Legendre, P.; McGlinn, D.; Minchin, P.R.; O’Hara, R.B.; Simpson, G.L.; Solymos, P.; et al. Vegan: Community Ecology Package. R Package Version 2.5-7. Available online: https://CRAN.R-project.org/package=vegan (accessed on 8 November 2021).
  49. Baselga, A.; Orme, D.; Villeger, S.; De Bortoli, J.; Leprieur, F.; Logez, M. Betapart: Partitioning Beta Diversity into Turnover and Nestedness Components. R Package Version 1.5.4. Available online: https://CRAN.R-project.org/package=betapart (accessed on 8 November 2021).
  50. Gower, J.C. Some distance properties of latent root and vector methods used in multivariate analysis. Biometrika 1966, 53, 325–338. [Google Scholar] [CrossRef]
  51. Laliberté, E.; Legendre, P. A distance-based framework for measuring functional diversity from multiple traits. Ecology 2010, 91, 299–305. [Google Scholar] [CrossRef] [PubMed]
  52. Laliberté, E.; Legendre, P.; Shipley, B.; Laliberté, M.E. Package ‘FD’. Measuring Functional Diversity from Multiple Traits, and Other Tools for Functional Ecology. R Package Version 1.0. Available online: https://cran.r-project.org/web/packages/FD/FD.pdf (accessed on 20 December 2021).
  53. Lavorel, S.; Grigulis, K.; McIntyre, S.; Williams, N.S.G.; Garden, D.; Dorrough, J.; Berman, S.; Quétier, F.; Thébault, A.; Bonis, A. Assessing functional diversity in the field—Methodology matters! Funct. Ecol. 2008, 22, 134–147. [Google Scholar] [CrossRef]
  54. Mouillot, D.; Mason, W.H.N.; Dumay, O.; Wilson, J.B. Functional regularity: A neglected aspect of functional diversity. Oecologia 2005, 142, 353–359. [Google Scholar] [CrossRef] [PubMed]
  55. Villéger, S.; Mason, N.W.; Mouillot, D. New multidimensional functional diversity indices for a multifaceted framework in functional ecology. Ecology 2008, 89, 2290–2301. [Google Scholar] [CrossRef] [PubMed] [Green Version]
  56. Wickham, H. ggplot2: Elegant Graphics for Data Analysis; Springer: New York, NY, USA, 2016. [Google Scholar]
  57. R Core Team. R: A Language and Environment for Statistical Computing; R Foundation for Statistical Computing: Vienna, Austria, 2021. [Google Scholar]
  58. Nelson, S.B.; Coon, J.J.; Duchardt, C.J.; Fischer, J.D.; Halsey, S.J.; Kranz, A.J.; Parker, C.M.; Schneider, S.C.; Swartz, T.M.; Miller, J.M. Patterns and mechanisms of invasive plant impacts on North American birds: A systematic review. Biol. Invasions 2017, 19, 1547–1563. [Google Scholar] [CrossRef]
  59. Muñoz-Pedreros, A.; González-Urrutia, M.; Encina-Montoya, F.; Norambuena, H.V. Effects of vegetation strata and human disturbance on bird diversity in green areas in a city in southern Chile. Avian Res. 2018, 9, 38. [Google Scholar] [CrossRef] [Green Version]
  60. Lyashevska, O.; Farnsworth, K.D. How many dimensions of biodiversity do we need? Ecol. Indic. 2012, 18, 485–492. [Google Scholar] [CrossRef]
  61. Fusco, J.; Walker, E.; Papaïx, J.; Debolini, M.; Bondeau, A.; Barnagaud, J.-Y. Land Use Changes Threaten Bird Taxonomic and Functional Diversity Across the Mediterranean Basin: A Spatial Analysis to Prioritize Monitoring for Conservation. Front. Ecol. Evol. 2021, 9, 612356. [Google Scholar] [CrossRef]
  62. Dyderski, M.K.; Jagodziński, A.M. Impact of Invasive Tree Species on Natural Regeneration Species Composition, Diversity, and Density. Forests 2020, 11, 456. [Google Scholar] [CrossRef] [Green Version]
Figure 1. Map of the study sites in various regions (AD, for more details see Section 2.1. Study Sites) of south-eastern Poland with Caucasian hogweeds (N = 19, red circles) and control (N = 19, green circles). Free background source: geoportal.gov.pl (accessed on 2 March 2022).
Diversity 14 00229 g001
Figure 2. An example of forest with the former Sosnowsky’s hogweed crop in its glade photo (B), where the invading species spreads along roads (A,B,D), photo (A) is from early June, photos (BD) are from July (author of photographs: E. Grzędzicka).
Diversity 14 00229 g002
Figure 3. Examples of study sites with pre-flowering invading Sosnowsky’s hogweed in forested areas, photos (AD,F) are from mid-May, photo (E) is from early June (author of photographs: E. Grzędzicka).
Diversity 14 00229 g003aDiversity 14 00229 g003b
Figure 4. Column graphs showing differences in the bird abundance and number of species of all, forest and non-forest birds between Heracleum and control sites, where “site ID” and “year” were the random effects, while the group (0—control, 1—Heracleum) was a nominal factor, p values: *** less than 0.001, ** less than 0.01, * less than 0.05, n.s.—non-significant; error bars are standard deviations (number of observation sets during five surveys: N = 190, number of sites: N = 38).
Diversity 14 00229 g004
Figure 5. Graph showing the significant effects of forest area, Caucasian hogweed invasion area and anthropogenic area on the abundance of forest birds; habitat variables were measured in a radius of 100 m from the survey points (number of sites: N = 38).
Diversity 14 00229 g005
Figure 6. Boxplots showing differences in diversities between control and Heracleum sites (N = 38) in forest birds (left side) and non-forest birds (right side); FD—functional diversity.
Diversity 14 00229 g006
Figure 7. Results of Detrended Correspondence Analysis (DCA) based on non-forest bird community detected on N = 38 study sites (λ—eigenvalue). Species matrix was prepared using a natural logarithm; the groups of sites (control, Heracleum) were expressed by scaled polygons.
Diversity 14 00229 g007
Figure 8. Results of Detrended Correspondence Analysis (DCA) based on forest bird community detected on N = 38 study sites (λ—eigenvalue). Species matrix was prepared using a natural logarithm; the groups of sites (control, Heracleum) were expressed by scaled polygons.
Diversity 14 00229 g008
Table 1. Results of the LMM model with the forest bird abundance on each study site as a dependent variable, where “site ID” and “year” were the random effects, while areas of habitat variables on sites were the continuous predictors (number of observation sets across all surveys: N = 190, number of sites: N = 38).
Dependent Variable: Abundance of Forest Birds
Habitat VariablesEstimate ± SEtp
(Intercept)33.86 ± 3.469.78<0.001
Forest area4.44 ± 1.552.870.006
Anthropogenic area21.41 ± 6.703.190.003
Invasion area20.51 ± 7.662.680.010
Forest area × anthropogenic area−19.49 ± 6.12−3.190.003
Forest area × invasion area−15.79 ± 5.30−2.980.005
Anthropogenic area × invasion area−38.82 ± 14.52−2.670.010
Publisher’s Note: MDPI stays neutral with regard to jurisdictional claims in published maps and institutional affiliations.

