Abstract
Urban waters are often neglected in biodiversity research; nonetheless, the number of aquatic microhabitats present in a city and the surrounding urban area is impressive. Twenty-two waterbodies in the Belgrade functional urban area (FUA) were investigated for faunistic and diversity patterns and to assess the effects of environmental factors on the differentiation of Chironomidae assemblages. A total of 66 chironomid taxa within four subfamilies was identified. Water quality at the studied sites, expressed by the water pollution index (WPI), varied significantly. K-means clustering gave four homogenous groups of chironomid assemblages, which showed clear preferences to specific habitat conditions and tolerance to anthropogenic pressures. These groups had high values of alpha and beta diversity components. The main component of beta diversity was species turnover. Waterbody type, water temperature, pH, nutrients and overall pollution were the most important factors influencing the distribution and composition of chironomid assemblages, which revealed clear preferences of each assemblage type to the category of waterbody type and tolerances to environmental pressures.
1. Introduction
Chironomidae larvae (non-biting midges) are a species-diverse insect group abundant in many freshwater ecosystems, which represent the main food source for many predatory invertebrates, fish and birds [1,2,3]. This group displays a great capability of adapting to a wide range of environmental conditions, typically occurring at high densities with a key ecological function in lotic freshwater communities [4]. In lotic and lentic waterbodies of temperate regions, chironomids can be one of the most abundant and diverse taxonomic groups within benthos or epiphyton. This is especially true for very productive freshwater ecosystems, where they can represent more than 60% of the macroinvertebrate community [5,6]. The quantitative and qualitative composition of chironomid assemblages can be indicative of changes in water quality. Chironomidae play a crucial ecological role in the cycling of organic matter in rivers, in the export of energy to riparian habitats, and provide a valuable model system for understanding which environmental variables drive species richness [7]. The structure of chironomid assemblages reflect changes in aquatic ecosystems that are strongly correlated with changes in water quality and habitat degradation, clearly pointing to increased saprobity or hydromorphological degradation [8,9]. Chironomids are often used in water quality bioassessment with in situ monitoring programs [9,10] and in laboratory experiments that test their resilience and reactions to heavy metals, nano- and microplastics or organic pollutants [11,12]. Together with Oligochaeta, non-biting midges are usually dominant and sometimes the only present invertebrate taxa in heavily modified waterbodies regardless of whether they are of artificial or natural origin [13,14,15]. Urbanisation and landscape conversion in sub-urban areas are a threat and the main cause of aquatic system degradation [16,17]. Some of the known stressors influencing ecological traits and system functioning of urban waterbodies can be from an extrinsic (catchment) source or created within the flow, such as untreated stormwater runoff, various point sources of pollution, septic system leakage, dams or rip-raps [18,19].
In the Belgrade FUA, there are numerous heavily modified and artificial waterbodies (reservoirs, canals and rivers) exposed to different types and intensities of anthropogenic pressures. Having various uses and origins, they differ in hydromorphological characteristics and water quality because of their position and distance from the urban area. Belgrade, with its 1.7 million inhabitants, has no system for treating municipal wastewaters [20]. Some of the running waters flow through industrial zones, agricultural and urban areas and have a role in precipitation drainage, as well as wastewater removal from several rural areas, thus being subjected to combined pressures [21,22]. Reservoirs in the Belgrade sub-urban area are also under high anthropogenic influence, such as wastewater discharge from surrounding settlements, fishing and other recreational activities. Canals and reservoirs are additionally under continual pressure caused by flow regulation. Consequently, they lack a natural water regimen as water is actively drained and pumped. Further, dredging of bed material and removal of aquatic and riparian vegetation contributes to the effect of a complex multi-stressor environment. Many of these reservoirs and canals lie in sanitary protection zones of the water supply system of Belgrade.
Keeping in mind the importance of such aquatic systems, and assessing the intensity of anthropogenic influence and possible degradation, we surveyed modified waterbodies in the Belgrade FUA to investigate whether assemblages of Chironomidae larvae can provide clear signs of environmental changes. We aimed to detect and describe (i) the faunistic patterns of chironomid assemblages and (ii) the patterns of diversity components in analysed chironomid assemblages and to examine (iii) the effects of environmental factors on the differentiation of chironomid assemblages.
2. Materials and Methods
2.1. Study Area
Together with other benthic macroinvertebrates, Chironomidae larvae were collected in 2018 and 2019 during spring and autumn (high and low water level regime), in 22 waterbodies classified according to national legislation [23] to four waterbody types (WBT): (1) non-wadeable (large, non-crossable) rivers: the Danube, Sava and Kolubara rivers; (2) wadeable (small, crossable) rivers: the Peštan, Turija, Beljanica, Topčiderska reka, Barička reka, Barajevska reka, Ralja rivers; (3) canals: the Galovica, Kalovita, Sibnica, Vizelj, Agricultural Plant Belgrade (PKB), Progarska Jarčina, Karaš and Obrenovački kanal canals; (4) reservoirs: the Pariguz, Bela Reka, Duboki potok and Savsko jezero reservoirs (Figure 1) (for the characteristics of sampling sites see Tables S1 and S2).

Figure 1.
Sampling sites in the Belgrade functional urban area: 1. Savsko jezero, 2. Bela Reka, 3. Duboki potok, 4. Pariguz, 5. Galovica, 6. Kalovita, 7. Karaš, 8. Obrenovački kanal, 9. Agricultural Plant Belgrade (PKB), 10. Progarska Jarčina, 11. Vizelj, 12. Sibnica, 13. Danube, 14. Sava, 15. Kolubara, 16. Barajevska reka, 17. Barička reka, 18. Beljanica, 19. Peštan, 20. Ralja, 21. Topčiderska reka, 22. Turija.
2.2. Chironomidae
Samples were collected using a benthological hand net (500 µm mesh size, net frame 25 × 25 cm), following the multihabitat sampling procedure, 20 subsamples pooled into one container per site [24]. Material was collected from the littoral zone down to a depth of 1.5 m from all available microhabitats. The collected material was preserved in 70% ethanol. In the laboratory, Nikon SMZ8000N (magnification 10–120×) and Zeiss Stemi 2000-C (magnification 6.5–50×) stereomicroscopes were used for sorting and identification. Larvae of Chironomidae were identified to the lowest possible taxonomic level (genus, species or species groups and aggregates) using up to date identification keys [25,26,27,28,29,30,31,32,33].
2.3. Environmental Variables
Water temperature (T), pH, conductivity (µS/cm), dissolved oxygen (O2; mg/L O2), oxygen saturation (O2%), nitrite concentration (NO2; mg/L N; PRI P-V-32/A) and nitrate concentration (NO3; mg/L N; EPA 300.1) were measured using a Horiba W-23XD multiparametric probe (HORIBA Instruments Corporation, Irvine, CA, USA) in the field. The biochemical oxygen demand (BOD5; mg/L O2; SRPS ISO 5813: 1994, SRPS EN 1899–2: 2009), chemical oxygen demand (COD; mg/L O2; SRPS ISO 6060: 1990), concentrations of total organic carbon (TOC; mg/L C; SRPS ISO 8245:1994), total phosphates (mg/L P; EPA 207. Rev 5, SRPS ENISO 6878: 2008), residue obtained after drying at 105 °C (mg/L; SMEWW 19th method 2540 B), suspended particles (mg/L; SMEWW 19th method 2540 D), ammonium ions (NH4; mg/L N; PRI P-V-2A) and chlorides (Cl; mg/L Cl; SRPS ISO 9297: 1994) were measured in the laboratory of the Institute of Public Health, Belgrade, Serbia. Microbiological analyses (number of coliforms) were performed in the same laboratory following standard methods (APHA AWWA WEF 1995, SMEWW 2010, SRPS EN ISO 9308–1: 2010).
2.4. Data Analysis
The qualitative composition of chironomids was determined for each site, along with species occurrence frequencies (F = 0–1). The ASTERICS software package Version 3.1.1. [24] was used for the assessment of data and the calculation of metrics.
The modified water pollution index (WPI) [34] was used to estimate water quality classes (Table 1). The WPI is calculated as the sum of the ratio of the measured average value and the standard threshold values for each parameter, divided by the number of used parameters. The standard threshold values for all parameters were specific for each country, given as the national legislative [23], which should minimise bias caused by ecological and geographical differences. The ASTERICS software package, version 3.1.1 [24], was used for the calculation of metrics used for the assessment of the ecological potential for these artificial waterbodies. The ecological analysis of the macroinvertebrate community structure was conducted for each site to calculate WPI. The number of taxa, ASPT (average score per taxon), BMWP (biological monitoring working party score) [35], the Saprobic index (S) [36] using bioindicator valences of each taxon according to [37], α-diversity index (H’) [38] and the percentage of the subfamily Tubificinae (Oligochaeta) in macroinvertebrate communities were calculated and used in the WPI calculation.

Table 1.
Water quality classification based on the water pollution index (WPI).
To reveal the variability patterns of analysed chironomid assemblages, we used two powerful non-hierarchical classification methods: K-means clustering [39] and Bayesian classification [40]. Hill et al. [41] emphasised that the number of misclassifications is a key parameter in assessing the analytical power of clustering methods. Contrary to numerous agglomerative and divisive methods, K-means clustering and Bayesian classification enable the allocation of misclassified assemblages to their most similar cluster. Despite their ability to minimise the number of misclassifications, both K-means clustering and Bayesian classification have two serious drawbacks. Both methods allocate assemblages into a pre-specified number of clusters. The main drawback of these methods is subjectivity in the initial selection of the number of clusters. Marinković et al. [42] proposed a simple procedure to avoid this problem. The procedure selects the number of clusters by maximising the variance ratio:
where is the between-group variance (i.e., variance of the cluster centroids), and is the within-group variance (the sum of the variances within each k cluster). Maximising the variance ratio ensures that overlap of homogeneous clusters is minimised. Another drawback of both is that K-means clustering and Bayesian classification are associated with the local minima problem. Two closest points in a Euclidean space correspond to the local minimum in one-dimensional space (a linear local minimum). Three closest points in the space represent the local minimum in a two-dimensional space (a planar local minimum). Both planar and linear local minima can disintegrate compact global clusters and replace them with numerous small clusters. To avoid this undesirable effect, we specified a threshold of four points as the minimum size of initial clusters. Selection of initial clusters with at least four points specifies the spatial configuration of the clusters and eliminates the undesirable effects of linear and planar local minima.
MANOVA [43] was used to find a combination of species that maximally discriminates extracted clusters of chironomid assemblages.
Cluster analyses based on Ward’s method [44] was used for grouping Chironomidae assemblage types.
For each type of chironomid assemblage, we analysed the components of alpha diversity (species richness, Shannon index and Shannon equitability). The components of beta diversity were detected using the procedures described by Baselga [45] and Podani et al. [46].
The stepwise forward selection (FS) procedure [40] was used to detect environmental variables with statistically significant effects on the chironomid assemblages. At each step of the procedure, we expanded the multiple regression model by adding an environmental variable that explains most of the residual variance (i.e., the variance of faunistic data, not explained by previously selected environmental variables). The statistical significance of the hypothesis that species assemblages are independent of the selected environmental variable was assessed using the non-parametric Monte Carlo permutation test (3000 permutations, p < 0.05).
To reduce the weighting of dominant groups, species-abundance data were transformed using the formula:
where x is the number of recorded individuals. The effects of environmental variables on the faunistic differentiation of assemblages were assessed using canonical correspondence analysis (CCA) [47].
log(x + 1),
Pearson’s correlation test was used to determine the correlation between WBT and WPI and their correlation with measured environmental parameters. For testing data normality, we used the Kolmogorov–Smirnov test.
Statistical analyses were performed using FLORA software [48], updated version.
3. Results
In total, 66 chironomid taxa in four subfamilies (Prodiamesinae, Orthocladiinae, Tanypodinae and Chironominae) were found during the study period. The most diverse and abundant was the Chironominae subfamily (21 genera, 37 taxa). Polypedilum was the most diverse genus in the Chironominae subfamily with nine species. Cricotopus was the most diverse genus from the Orthocladiinae subfamily. The highest abundance of chironomid species was detected in wadeable rivers, while in reservoirs, canals and non-wadeable rivers, the abundance of chironomid species was comparable. Cricotopus gr. sylvestris and Cricotopus bicinctus (Meigen, 1818) were found in various waterbody types, but they were most abundant in wadeable rivers. In reservoirs, the most abundant was Ablabesmyia monilis agg., while in canals, the most numerous were C. gr. sylvestris and Parachironomus gracillior (Kieffer, 1918).
3.1. Chironomid Assemblage Classification
Classification of chironomid assemblages was performed based on the faunistic similarity of the analysed assemblages. The main drawback of hierarchical classification methods is the inability to correct misclassifications. However, non-hierarchical clustering methods allow for the allocation of misclassified species assemblages to their most similar cluster. We, therefore, performed classification of the analysed assemblages using K-means clustering and Bayesian classification. These methods are the most powerful variants of non-hierarchical clustering methods [40]. The calculated variance ratio indicated that K-means clustering produced more acceptable results than Bayesian classification. The main drawback of Bayesian classification is the rigid assumption that all variables must be normally distributed, as concluded in Sekulić et al. [49]. The results of K-means clustering and Bayesian classification are presented in Table 2. To eliminate the undesirable effects of local minima, we used four species assemblages as the minimum size of initial clusters. Since we investigated 22 chironomid assemblages, the greatest number of initial clusters with at least four assemblages was five. The greatest ratio of between-group variance to within-group variance was detected for four clusters. Therefore, we performed K-means clustering using four pre-defined clusters and named these clusters (types) with capital letters A, B, C and D.
Table 2.
Dependence of ordering results on the subjectively selected number of clusters. The greatest ratio of between-group variance (BGV) to within-group variance (WGV) σ2B/σ2W assures that the overlap of homogeneous clusters is minimised. In our dataset, the greatest variance ratio (bolded numbers) was obtained for four clusters.
MANOVA provided a combination of species that maximally discriminated between four clusters of assemblages (high variance ratio R2 0.452884).
Species from the Conchapelopia aggregate as well as Procladius species discriminated assemblage type A from other assemblage types. Type B stands out by the presence of Microchironomus tener (Kieffer, 1918). Polypedilum albicorne (Meigen, 1838) was the discriminating species for community type C, while Endochironomus albipennis (Meigen, 1830) and Monopelopia tenuicalcar (Kieffer, 1918) were a distinguishing feature of assemblage type D (Figure 2).
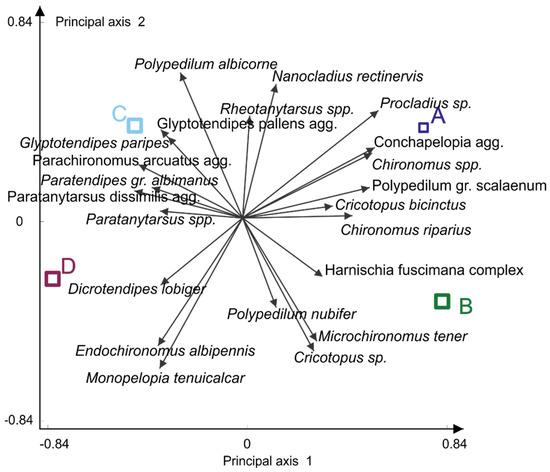
Figure 2.
Multivariate analyses of variance (MANOVA) of four Chironomidae assemblage clusters. Four assemblage types (obtained through K-means clustering) are in capital letters A, B, C, D coloured as indicated.
Cluster analyses using Ward’s method organised the assemblages into two larger groups based on the similarity of species composition, with each encompassing two assemblage types. The first group incorporates assemblage types A and B, and the second types C and D (Figure 3).
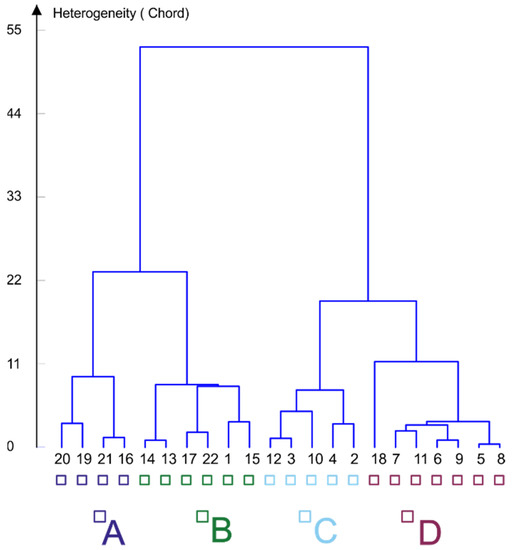
Figure 3.
Hierarchical cluster analyses (Ward’s method) of the Chironomidae assemblages. Four assemblage types (obtained through K-means clustering) are in capital letters A, B, C, D coloured as indicated. The numbers represent study sites codes (see Figure 1).
For each group of assemblages, a set of diagnostic species was established based on their frequency of occurrence (Table S3).
Rheocricotopus, Procladius, Conchapelopia and Thenemanniella dominated in type A assemblages and were often associated with Polypedium convictum (Walker, 1856), Nanocladius rectinervis (Kieffer, 1911), Microtendipes gr. pedellus, Chironomus riparius Meigen, 1804 and Eukiefferiella claripennis (Lundbeck, 1898). Microchironomus tener dominated in assemblage type B and was usually associated with Harnischia, Cryptotendipes, Rheotanytarsus and Cladotanytarsus species. In the type C assemblages, Glyptotendipes paripes (Edwards, 1929) was the diagnostic species associated with Polypedilum albicorne (Meigen, 1838), Parachironomus gracillior, Dicrotendipes pulsus (Walker, 1856) and Kiefferulus tendipediformis (Goetghebuer, 1921). Monopelopia tenuicalcar (Kieffer, 1918) was the diagnostic/main species for assemblage type D and was associated with Glyptotendipes pallens agg. and Xenopelopia species.
Correspondence between faunistic groups (X-axis) and waterbody types (colours) is presented in a histogram (Figure 4).
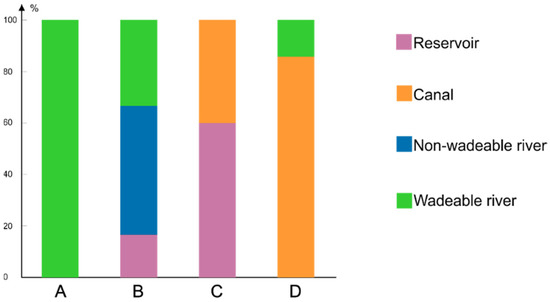
Figure 4.
Occurrence (in percentage) of different chironomid assemblage types in four types of waterbodies. Four assemblage types (obtained through K-means clustering) are in capital letters A, B, C, D coloured as indicated.
Assemblage type A inhabited only wadeable rivers. Assemblage type C occurred in slow-flowing waters such as reservoirs and canals, while assemblages of type D were found mainly in canals and in some wadeable rivers. Assemblage type B was the only type detected in non-wadeable rivers. This type was also found in wadeable rivers and only in one reservoir (Figure 4).
3.2. Diversity Components
The highest alpha diversity (expressed as Shannon index) was recorded in assemblage types A and B, while in C and D, the values of the Shannon index were lower. The same trend was observed for species richness, while the Shannon equitability index was almost identical in all assemblage types (Figure 5).
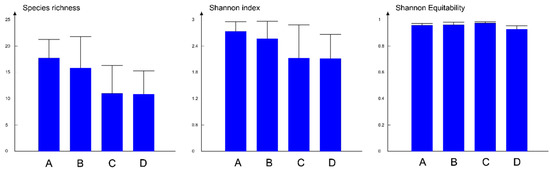
Figure 5.
Components of alpha diversity in four types of chironomid assemblages, bars represent average values while lines denote the variance in each group of assemblages. The four community types are in capital letters A, B, C, D coloured as indicated.
High, almost identical, beta diversity values were detected in all analysed types of assemblages using Baselga’s method (Figure 6). The dominant component of beta diversity was species turnover, which was high, while nestedness was low. Analyses of beta diversity using the Podani method gave different results between different types of assemblages (Figure 6). While overall beta diversity was similar, its components varied from type to type. Nestedness was lowest in type A and highest in type C, while in types B and D, it was similar. Species turnover was the same in types C and D, which was lower than in types A and B, with type A showing the highest value of this component of beta diversity.
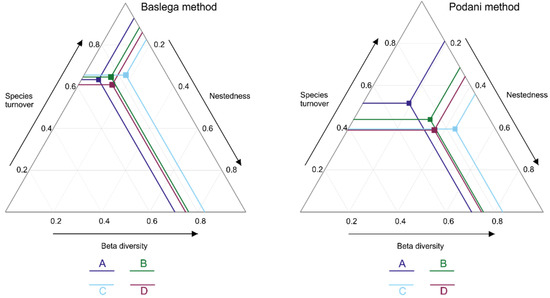
Figure 6.
Components of beta diversity in four types of chironomid assemblages (Baselga and Podani methods). Four assemblage types are in capital letters A, B, C, D and coloured as indicated.
3.3. Patterns in the Chironomidae-Environment Relationship
Partial forward selection analysis (Table 3) identified ten environmental variables as significant for faunistic differentiation of the analysed urban waterbodies.
Table 3.
Results of the forward selection analysis.
The first two CCA axes explained 34.4% of the variation of the fitted data obtained by multiple regressions. Environmental predictors explained a relatively high portion of the total variability of chironomid distributions (R2 = 0.585).
CCA showed that the Chironomidae assemblage types were clearly differentiated with respect to nutrients (nitrate, nitrite and ammonium concentration), water temperature, and pH gradients. The importance of other environmental variables was lower. CCA indicated that oxygen demand (chemical and biological oxygen demand) produced effects on faunistic differentiation of the analysed Chironomidae assemblages. WBT also played a role in assemblage differentiation (Figure 7).
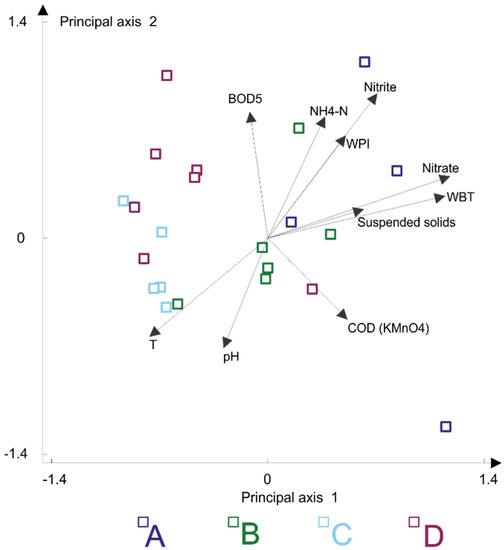
Figure 7.
Canonical correspondence analysis of investigated chironomid assemblages. Four assemblage types are in capital letters A, B, C, D coloured as indicated. Nitrate, NO3 concentration; Nitrite, NO2 concentration; NH4-N, ammonium concentration; COD, chemical oxygen demand; BOD5, biological oxygen demand; WBT, waterbody types; WPI, water pollution index; T, water temperature.
Based on the values of WPI and water quality, the four types of assemblages were different (Figure 8). Assemblage type A was present in sites with various water qualities. Most of these sites were characterised by higher values of WPI and deterioration of water quality (classes IV, V and VI) (Table S2). Assemblage type C was present in less polluted waters (classes II and III of water quality, with lowest WPI values). Assemblage types B and D mainly occurred on sites with pure or moderately polluted water. Extremely high values of WPI (heavily impure water) were recorded at some sites inhabited by assemblage type B (Figure 8).
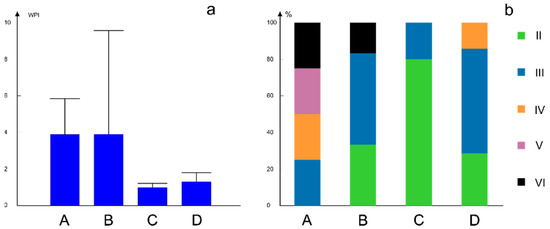
Figure 8.
(a) Variation of WPI values in four types of chironomid assemblages; bars represent average values while lines denote the variance of WPI values within each group of assemblages. (b) Distribution of four chironomid assemblage types in different classes of water quality calculated through WPI; water quality class based on WPI is in Roman numerals II–VI, from very pure to heavily impure (see Table 1); four assemblage types are in capital letters A, B, C, D coloured as indicated.
Since WBT and WPI are considered as derived variables, their correlations with environmental variables were analysed and are presented in Table 4. WPI and WBT were correlated. Nutrients (total phosphate, total nitrogen, nitrate, nitrite and ammonium concentrations) and water temperature showed significant correlation with these two derived variables.
Table 4.
Correlations between WBT and WPI with environmental variables.
4. Discussion
Chironomids, as one of the most diverse aquatic macroinvertebrate groups, have a wide spectrum of biological and ecological preferences [10]; nevertheless, studies of chironomid assemblages mainly focus on the presence/absence of species rather than the abundance and assemblage structure [50]. The diverse fauna of Chironomidae larvae detected during this study enabled us not only to assess biodiversity within them, but also to monitor negative anthropogenic influences and degradation of studied waterbodies. The distribution of the chironomids mainly followed the a priori classification given by the non-chironomid macroinvertebrates [51]. We tried to determine whether assemblages of Chironomidae larvae in urban waters can provide clear indications of environmental changes.
Leszczyńska et al. [50] state that the knowledge of assemblage composition is necessary to assess some diversity components and other (inter-)assemblage parameters, as well as to assess assemblage dependence on environmental factors. High diversity of species characterised all four assemblage types found in Belgrade FUA while exhibiting differences in diversity components. Assemblage types are distinguished by the influence of different components on overall beta diversity. The ratio of components of beta diversity in types A and B pointed to the availability of different microhabitats in each site. A greater availability of habitats and microhabitats, such as sediment composition and the presence of macrophytes and detritus—which provides food, shelter for burrowing, mining and protection from predators—are associated with habitat heterogeneity and can harness the high diversity of chironomids [52,53,54]. Nevertheless, a huge diversity of the habitats exposed to multi stressors leads to the unclear relationship between biotic and abiotic components [55]. In the other two types (C and D), the nestedness component was slightly higher, pointing to the presence of an ecological gradient decreasing the number of species from site to site and their composition. Aquatic insects display a decrease in alpha diversity as a response to the urbanisation process, where, in sites exposed to substantial influence, only highly tolerant species prevail [16]. However, Chironomidae assemblages in Belgrade urban waters showed relatively high alpha diversity, but components of beta diversity revealed the aftereffects of urbanisation and pollution, high nestedness in canals, reservoirs, and heavily polluted rivers (type C and D) indicated that only tolerable species remained under high anthropogenic pressure.
Assemblage types A and B were similar in species composition, also preferring similar habitats such as wadeable and non-wadeable rivers. Preference for slow and stagnant waters found in canals and reservoirs was exhibited by assemblage types C and D, which were also grouped together based on species composition by cluster analyses.
Diagnostic taxa of assemblage’s type A and B Rheocricotopus, Thenemanniella, Microchironomus tener and their associated species are known inhabitants of running waters and reservoirs [28,29,56], which are the types of ecosystems inhabited by the aforementioned assemblage.
Slow-flowing and stagnant waters with ample vegetation are preferred habitats of Glyptotendipes paripes, Monopelopia tenuicalcar, Parachironomus gracillior, Dicrotendipes pulsus, Kiefferulus tendipediformis, Glyptotendipes pallens agg. and Xenopelopia [29,32,33,56]. Ecological conditions in sites in which C and D assemblages types were detected corresponded with these ecological preferences. This is also in agreement with the classification of these sites as reservoirs or canals, with the addition of one wadeable river characterised by slow flow and large amounts of vegetation.
Although waterbody type is one of the most important factors determining the distribution of chironomids, the presence of pollution and other anthropogenic pressures (such as habitat degradation) can influence, to a great extent, the abundance and structure of chironomid assemblages [51]. Streams receiving waste effluents are characterised by lower chironomid species richness and the development of more dense populations of Chironomus riparius [57,58]. Leszczyńska et al. [50] found that C. riparius is the most abundant in low order streams, with low velocity and dense riparian vegetation, preferring stagnant water and soft sediments. It is also known that C. riparius may inhabit organically enriched and heavily polluted waterbodies, having efficient oxygen regulation [59]. The results presented herein show the same patterns, e.g., a high abundance of Chironomus species in heavily polluted rivers (the Topčiderska, Barička and Barajevska rivers). The Topčiderska river, which flows through the industrial zone and is the recipient of communal wastewaters, was the only site with Eukiefferiella claripennis, Parametriocnemus stylatus and Tvetenia clavescens, species found to be tolerant to habitat degradation [58,60]. Non-wadeable rivers were characterised by the dominance of the subfamily Chironominae (Dicrotendipes nervosus, Polypedilum nubeculosum and Chironomus species). Milošević et al. [9] reported a similar assemblage structure, namely one that was monotonous and driven by frequent and dominant taxa from the Chironominae subfamily, which were also reported in other studies as common dominant taxa in non-wadeable rivers [55,61].
Cricotopus bicinctus, which has already been documented as an indicator species for organic pollution [10], was abundant in wadeable rivers (the Topčiderska, Barajevska and Beljanica rivers) but also present in non-wadeable rivers.
The high values of diversity components observed in assemblage types A and B, despite the high pollution (expressed through WPI and nutrients), were likely supported by the availability of microhabitats and other favourable ecological conditions of the ecosystems they resided in (wadeable and non-wadeable rivers). Canals and reservoirs were inhabited by assemblages (C and D) that exhibited slightly lower alpha and beta diversity components. The limiting factors in these cases could be the uniformity of habitats and the limited availability of resources (food, shelter, substrate), but also the hydro-technical regime and maintenance work on these heavily modified and artificial waterbodies.
5. Conclusions
Urban waters in the Belgrade FUA harbour very diverse chironomid fauna. Based on their preferences for specific waterbody types and tolerance to environmental pressures, Chironomid assemblages can be grouped into several different types characterised by unique species composition.
Our study showed that chironomids could serve as useful indicators of anthropogenic pressures in various waterbody types due to the different sensitivities of the species towards the alteration of environmental conditions in their habitats.
Supplementary Materials
The following supporting information can be downloaded at: https://www.mdpi.com/article/10.3390/d14030187/s1, Table S1: Sampling sites and their characteristics; Table S2: Detected pressures at sampling sites and water quality classes according to the Water Pollution Index (WPI) value; Table S3: Taxa list and frequencies of species in four clusters of species assemblages.
Author Contributions
Conceptualisation, N.P., N.M., M.R. and M.P.; methodology, D.Č., N.P., M.R. and J.Đ.; validation, N.M., M.R. and M.P.; formal analysis, N.P., N.M. and D.Č.; investigation, N.P., N.M., J.Đ., M.R., D.Č. and M.P.; writing—original draft preparation, N.P., N.M., M.R. and D.Č.; writing—review and editing, N.P., N.M., M.R., J.Đ. and M.P.; visualisation, N.M. and N.P.; supervision, N.P. and M.P.; project administration, N.P.; funding acquisition, M.P. All authors have read and agreed to the published version of the manuscript.
Funding
This research was funded by the Ministry of Education, Science and Technological Development of the Republic of Serbia, Contract No. 451-03-9/2021-14/200007.
Institutional Review Board Statement
Not applicable.
Data Availability Statement
The data presented in this study are available on request from the corresponding author.
Acknowledgments
We would like to express our gratitude to the Public Health Institute of Belgrade for providing physical, chemical and microbiological data used in this paper. Special thanks to the Editor and reviewers for their comments and suggestions which greatly helped during shaping of this manuscript.
Conflicts of Interest
The authors declare no conflict of interest.
References
- Goyke, A.P.; Hershey, A.E. Effects of fish predation on larval chironomid (Diptera: Chironomidae) communities in an arctic ecosystem. Hydrobiologia 1992, 240, 203–211. [Google Scholar] [CrossRef]
- Armitage, P.D.; Cranston, P.S.; Pinder, L.C.V. The Chironomidae: Biology and Ecology of Non-Biting Midges; Chapman & Hall: London, UK, 1995; ISBN 10041245260X. [Google Scholar]
- Martínez-Sánchez, A.; Allende, A.; Bennett, R.N.; Ferreres, F.; Gil, M.I. Microbial, nutritional and sensory quality of rocket leaves as affected by different sanitizers. Postharvest Biol. Technol. 2006, 42, 86–97. [Google Scholar] [CrossRef]
- Benke, A.C. Production dynamics of riverine chironomids: Extremely high biomass turnover rates of primary consumers. Ecology 1998, 79, 899–910. [Google Scholar] [CrossRef]
- Bogut, I.; Čerba, D.; Vidaković, J.; Gvozdić, V. Interactions of weed-bed invertebrates and Ceratophyllum demersum stands in a floodplain lake. Biologia 2010, 65, 113–121. [Google Scholar] [CrossRef]
- Čerba, D.; Mihaljević, Z.; Vidaković, J. Colonisation of temporary macrophyte substratum by midges (Chironomidae: Diptera). Ann. Limnol. 2010, 46, 181–190. [Google Scholar] [CrossRef] [Green Version]
- Leszczyńska, J.; Grzybkowska, M.; Głowacki, Ł.; Dukowska, M. Environmental Variables Influencing Chironomid Assemblages (Diptera: Chironomidae) in Lowland Rivers of Central Poland. Environ. Entomol. 2019, 48, 988–997. [Google Scholar] [CrossRef]
- Milošević, D.; Čerba, D.; Szekeres, J.; Csányi, B.; Tubić, B.; Simić, V.; Paunović, M. Artificial neural networks as an indicator search engine: The visualization of natural and man-caused taxa variability. Ecol. Indic. 2016, 61, 777–789. [Google Scholar] [CrossRef]
- Milošević, D.; Mančev, D.; Čerba, D.; Piperac, M.S.; Popović, N.; Atanacković, A.; Đuknić, J.; Simić, V.; Paunović, M. The potential of chironomid larvae-based metrics in the bioassessment of non-wadeable rivers. Sci. Total Environ. 2018, 616, 472–479. [Google Scholar] [CrossRef]
- Milošević, D.; Simić, V.; Stojković, M.; Čerba, D.; Mančev, D.; Petrović, A.; Paunović, M. Spatio-temporal pattern of the Chironomidae community: Toward the use of non-biting midges in bioassessment programs. Aquat. Ecol. 2013, 47, 37–55. [Google Scholar] [CrossRef]
- Savić-Zdravković, D.; Jovanović, B.; Đurđević, A.; Stojković-Piperac, M.; Savić, A.; Vidmar, J.; Milošević, D. An environmentally relevant concentration of titanium dioxide (TiO2) nanoparticles induces morphological changes in the mouthparts of Chironomus tentans. Chemosphere 2018, 211, 489–499. [Google Scholar] [CrossRef]
- Stanković, J.; Milošević, D.; Savić-Zdraković, D.; Yalçın, G.; Yildiz, D.; Beklioğlu, M.; Jovanović, B. Exposure to a microplastic mixture is altering the life traits and is causing deformities in the non-biting midge Chironomus riparius Meigen (1804). Environ. Pollut. 2020, 262, 114248. [Google Scholar] [CrossRef] [PubMed]
- Fusari, L.M.; Fonseca-Gessner, A.A. Environmental assessment of two small reservoirs in southeastern Brazil, using macroinvertebrate community metrics. Acta Limnol. Bras. 2006, 18, 89–99. [Google Scholar]
- Martins, R.T.; Stephan, N.N.C.; Alves, R.G. Tubificidae (Annelida: Oligochaeta) as an indicator of water quality in an urban stream in southeast Brazil. Acta Limnol. Bras. 2008, 20, 221–226. [Google Scholar]
- Rosa, B.J.F.V.; Rodrigues, L.F.T.; de Oliveira, G.S.; da Gama Alves, R. Chironomidae and Oligochaeta for water quality evaluation in an urban river in southeastern Brazil. Environ. Monit. Assess. 2014, 186, 7771–7779. [Google Scholar] [CrossRef] [PubMed]
- Lundquist, M.J.; Zhu, W. Aquatic insect diversity in streams across a rural–urban land-use discontinuum. Hydrobiologia 2019, 837, 15–30. [Google Scholar] [CrossRef]
- Qiu, Z.; Kennen, J.G.; Giri, S.; Walter, T.; Kang, Y.; Zhang, Z. Reassessing the relationship between landscape alteration and aquatic ecosystem degradation from a hydrologically sensitive area perspective. Sci. Total Environ. 2019, 650, 2850–2862. [Google Scholar] [CrossRef]
- Wenger, S.J.; Roy, A.H.; Jackson, C.R.; Bernhardt, E.S.; Carter, T.L.; Filoso, S.; Gibson, C.A.; Hession, W.C.; Kaushal, S.S.; Martí, E. Twenty-six key research questions in urban stream ecology: An assessment of the state of the science. J. N. Am. Benthol. Soc. 2009, 28, 1080–1098. [Google Scholar] [CrossRef] [Green Version]
- Roy, A.H.; Rhea, L.K.; Mayer, A.L.; Shuster, W.D.; Beaulieu, J.J.; Hopton, M.E.; Morrison, M.A.; Amand, A.S. How much is enough? Minimal responses of water quality and stream biota to partial retrofit stormwater management in a suburban neighborhood. PLoS ONE 2014, 9, e85011. [Google Scholar] [CrossRef]
- Živadinović, I.; Ilijević, K.; Gržetić, I.; Popović, A. Long-term changes in the eco-chemical status of the Danube River in the region of Serbia. J. Serb. Chem. Soc. 2010, 75, 1125–1148. [Google Scholar] [CrossRef]
- Kolarević, S.; Knežević-Vukčević, J.; Paunović, M.; Tomović, J.; Gačić, Z.; Vuković-Gačić, B. The anthropogenic impact on water quality of the river Danube in Serbia: Microbiological analysis and genotoxicity monitoring. Arch. Biol. Sci. 2011, 63, 1209–1217. [Google Scholar] [CrossRef]
- Jovanović Marić, J.M.; Kračun-Kolarević, M.J.; Kolarević, S.M.; Đorđević, J.Z.; Paunović, M.M.; Kostić-Vuković, J.M.; Sunjog, K.Z.; Smiljanić, P.B.; Gačić, Z.M.; Vuković-Gačić, B.S. Sensitivity of Bleak (Alburnus alburnus) in Detection of the Wastewater Related Pressure in Large Lowland Rivers. Bull. Environ. Contam. Toxicol. 2020, 105, 224–229. [Google Scholar] [CrossRef] [PubMed]
- Official Gazette of the Republic of Serbia. The Parameters of Ecological and Chemical Status of Surface Waters and Parameters of the Chemical and Quantitative Status of Groundwater; Off. Gaz. RS No. 74/2011; Official Gazette of the Republic of Serbia: Belgrade, Serbia, 2011. [Google Scholar]
- AQEM Consortium. Manual for the Application of the AQEM System; Version 1.0; Contract No: EVK1-CT1999-00027; AQEM: Duisburg, Germany, 2002. [Google Scholar]
- Schmid, P.-E. A Comprehensive Method to Assess European Streams Using Benthic Macroinvertebrates, Developed for the Purpose of the Water Framework Directive. In A Key to the Larval Chironomidae and Their Instars from Austrian Danube Region Streams and Rivers with Particular Reference to a Numerical Taxonomic Approach; Federal Institute for Water Quality of the Ministry of Agriculture and Forestry: Vienna, Austria, 1993; ISBN 390067292X. [Google Scholar]
- Vallenduuk, H.J.; Moller Pillot, H.K.M. Chironomidae Larvae, Vol. 1: Tanypodinae: General Ecology and Tanypodinae; Brill: Leiden, The Netherlands, 2007; ISBN 9004278036. [Google Scholar]
- Maschwitz, D.E.; Cook, E.F. Revision of the Nearctic Species of the Genus Polypedilum Kieffer (Diptera: Chironomidae) in the Subgenera P. (Polypedilum) Kieffer and P. (Uresipedilum) Oyewo and Sæether; Ohio Biological Survey, College of Biological Sciences, The Ohio State: Columbus, OH, USA, 2000; ISBN 0867271302. [Google Scholar]
- Epler, J.H. Identification Guide to the Larvae of the Tribe Tanytarsini (Diptera: Chironomidae) in Florida; Florida Department of Environmental Protection: Tallahassee, FL, USA, 2014. [Google Scholar]
- Moller Pillot, H.K.M. Chironomidae Larvae, Vol. 2: Chironomini: Biology and Ecology of the Chironomini; Brill: Leiden, The Netherlands, 2009; ISBN 9004278044. [Google Scholar]
- Orendt, C.; Spies, M. Chironomini:(Diptera: Chironomodae: Chironominae); Keys to Central European Larvae Using Mainly Macroscopic Characters; Orendt Hydrobiologie: Leipzig, Germany, 2012; ISBN 3000388427. [Google Scholar]
- Andersen, T.; Sæther, O.A.; Cranston, P.S.; Epler, J.H. The larvae of Orthocladiinae (Diptera: Chironomidae) of the Holarctic region-Keys and diagnoses. Insect Syst. Evol. 2013, 66, 189–385. [Google Scholar]
- Bitušík, P.; Hamerlík, L. Príručka na Určovanie Lariev Pakomárov (Diptera: Chironomidae) Slovenska; Čast’2. Tanypodinae; Belianum Vydav. Univerzity Matej Bela v Banskej Bystrici: Banska Bystrica, Slovakia, 2014. [Google Scholar]
- Vallenduuk, H.J. Chironomini Larvae of Western European Lowlands (Diptera: Chironomidae): Keys with Notes to the Species: With a Redescription of Glyptotendipes (Caulochironomus) Nagorskayae and a First Description of Glyptotendipes (Caulochironomus) Kaluginae New Species; Erik Mauch: Dinkelscherben, Germany, 2017. [Google Scholar]
- Popovic, N.Z.; Duknic, J.A.; Atlagic, J.Z.; Rakovic, M.J.; Marinkovic, N.S.; Tubic, B.P.; Paunovic, M.M. Application of the water pollution index in the assessment of the ecological status of rivers: A case study of the Sava River, Serbia. Acta Zool. Bulg. 2016, 68, 97–102. [Google Scholar]
- Armitage, P.D.; Moss, D.; Wright, J.F.; Furse, M.T. The performance of a new biological water quality score system based on macroinvertebrates over a wide range of unpolluted running-water sites. Water Res. 1983, 17, 333–347. [Google Scholar] [CrossRef]
- Zelinka, M.; Marvan, P. Zur Prazisierung der biologischen Klassifikation des Reinheit fliessender Gewasser. Arch. Hydrobiol. 1961, 57, 389–407. [Google Scholar]
- Moog, O. Fauna Aquatica Austriaca Katalog zur autökologischen Einstufung aquatischer Organismen Österreichs; Bundesministerium für Nachhaltigkeit und Tourismus: Vienna, Austria, 2002; p. 670. [Google Scholar]
- Shannon, C.E.; Weaver, W. The Mathematical Theory of Communication; The University of Illinois Press: Champaign, IL, USA, 1949; pp. 1–117. [Google Scholar]
- MacQueen, J. Some methods for classification and analysis of multivariate observations. In Proceedings of the Fifth Berkeley Symposium on Mathematical Statistics and Probability; University of California Press: Oakland, CA, USA, 1967; Volume 1, pp. 281–297. [Google Scholar]
- James, G.; Witten, D.; Hastie, T.; Tibshirani, R. An Introduction to Statistical Learning; Springer: Berlin/Heidelberg, Germany, 2013; Volume 112. [Google Scholar]
- Hill, M.O.; Bunce, R.G.H.; Shaw, M.W. Indicator Species Analysis, A Divisive Polythetic Method of Classification, and its Application to a Survey of Native Pinewoods in Scotland. J. Ecol. 1975, 63, 597–613. [Google Scholar] [CrossRef]
- Marinković, N.; Karadžić, B.; Pešić, V.; Gligorović, B.; Grosser, C.; Paunović, M.; Nikolić, V.; Raković, M. Faunistic patterns and diversity components of leech assemblages in karst springs of Montenegro. Knowl. Manag. Aquat. Ecosyst. 2019, 420, 26. [Google Scholar] [CrossRef]
- Bray, J.H.; Maxwell, S.E.; Maxwell, S.E. Multivariate Analysis of Variance; SAGE: Thousand Oaks, CA, USA, 1985; ISBN 0803923104. [Google Scholar]
- Ward, J.H., Jr.; Hook, M.E. Application of an hierarchical grouping procedure to a problem of grouping profiles. Educ. Psychol. Meas. 1963, 23, 69–81. [Google Scholar] [CrossRef]
- Baselga, A. Partitioning the turnover and nestedness components of beta diversity. Glob. Ecol. Biogeogr. 2010, 19, 134–143. [Google Scholar] [CrossRef]
- Podani, J.; Ricotta, C.; Schmera, D. A general framework for analyzing beta diversity, nestedness and related community-level phenomena based on abundance data. Ecol. Complex. 2013, 15, 52–61. [Google Scholar] [CrossRef] [Green Version]
- ter Braak, C.J.F. Canonical Correspondence Analysis: A New Eigenvector Technique for Multivariate Direct Gradient Analysis. Ecology 1986, 67, 1167–1179. [Google Scholar] [CrossRef] [Green Version]
- Karadžić, B. FLORA: A software package for statistical analysis of ecological data. Water Res. Manag. 2013, 3, 45–54. [Google Scholar]
- Sekulić, D.; Karadžić, B.; Kuzmanović, N.; Jarić, S.; Mitrović, M.; Pavlović, P. Diversity of ostrya carpinifolia forests in ravine habitats of serbia (S-e Europe). Diversity 2021, 13, 59. [Google Scholar] [CrossRef]
- Leszczyńska, J.; Głowacki; Grzybkowska, M.; Przybylski, M. Chironomid riverine assemblages at the regional temperate scale–compositional distance and species diversity. Eur. Zool. J. 2021, 88, 731–748. [Google Scholar] [CrossRef]
- Orendt, C. Results of 10 years sampling of Chironomidae from German lowland running waters differing in degradation. J. Limnol. 2018, 77 (Suppl. S1), 169–176. [Google Scholar] [CrossRef] [Green Version]
- Zilli, F.L.; Montalto, L.; Marchese, M.R. Benthic invertebrate assemblages and functional feeding groups in the Paraná River floodplain (Argentina). Limnologica 2008, 38, 159–171. [Google Scholar] [CrossRef] [Green Version]
- de Carvalho, E.M.; Uieda, V.S.; da Motta, R.L. Colonization of rocky and leaf pack substrates by benthic macroinvertebrates in a stream in Southeast Brazil. Títulos Não-Correntes 2008, 22, 37–44. [Google Scholar]
- Vermonden, K.; Brodersen, K.P.; Jacobsen, D.; Van Kleef, H.; Van der Velde, G.; Leuven, R. The influence of environmental factors and dredging on chironomid larval diversity in urban drainage systems in polders strongly influenced by seepage from large rivers. J. N. Am. Benthol. Soc. 2011, 30, 1074–1092. [Google Scholar] [CrossRef]
- Jiang, X.; Xiong, J.; Xie, Z. Longitudinal and seasonal patterns of macroinvertebrate communities in a large undammed river system in Southwest China. Quat. Int. 2017, 440, 1–12. [Google Scholar] [CrossRef]
- Moller Pillot, H.K.M. 2 General Aspects of the Systematics, Biology and Ecology of the Aquatic Orthocladiinae. In Chironomidae Larvae, Vol. 3: Orthocladiinae; KNNV: Zeist, The Netherlands, 2013; pp. 7–21. ISBN 9004278052. [Google Scholar]
- Hynes, H.B.N. The Biology of Polluted Waters, 1st ed.; Liverpool University Press: Liverpool, UK, 1960. [Google Scholar]
- Calle-Martínez, D.; Casas, J.J. Chironomid species, stream classification, and water-quality assessment: The case of 2 Iberian Mediterranean mountain regions. J. N. Am. Benthol. Soc. 2006, 25, 465–476. [Google Scholar] [CrossRef]
- De Haas, E.M.; Paumen, M.L.; Koelmans, A.A.; Kraak, M.H.S. Combined effects of copper and food on the midge Chironomus riparius in whole-sediment bioassays. Environ. Pollut. 2004, 127, 99–107. [Google Scholar] [CrossRef]
- Raunio, J.; Paavola, R.; Muotka, T. Effects of emergence phenology, taxa tolerances and taxonomic resolution on the use of the Chironomid Pupal Exuvial Technique in river biomonitoring. Freshw. Biol. 2007, 52, 165–176. [Google Scholar] [CrossRef]
- McCord, S.B.; Kuhl, B.A. Macroinvertebrate community structure and its seasonal variation in the Upper Mississippi River, USA: A case study. J. Freshw. Ecol. 2013, 28, 63–78. [Google Scholar] [CrossRef] [Green Version]
Publisher’s Note: MDPI stays neutral with regard to jurisdictional claims in published maps and institutional affiliations. |
© 2022 by the authors. Licensee MDPI, Basel, Switzerland. This article is an open access article distributed under the terms and conditions of the Creative Commons Attribution (CC BY) license (https://creativecommons.org/licenses/by/4.0/).