Article

Relative Impact of Climate Change and Grazing on NDVI Changes in Grassland in the Mt. Qomolangma Nature Reserve and Adjacent Regions during 2000–2018

1
State Key Laboratory of Tibetan Plateau Earth System, Resources and Environment (TPESRE), Institute of Tibetan Plateau Research, Chinese Academy of Sciences, Beijing 100101, China
2
Motuo Observation and Research Center for Earth Landscape and Earth System, Chinese Academy of Sciences, Linzhi 860712, China
3
Tibet Autonomous Region Remote Sensing Monitoring Center for Ecological Environment, Lhasa 850000, China
4
University of Chinese Academy of Sciences, Beijing 100049, China
*
Author to whom correspondence should be addressed.
Diversity 2022, 14(3), 171; https://doi.org/10.3390/d14030171
Submission received: 13 February 2022 / Revised: 24 February 2022 / Accepted: 25 February 2022 / Published: 27 February 2022
(This article belongs to the Special Issue Mountain Biodiversity, Ecosystem Functioning and Services)

Abstract

:
As the roof of the world, the Mt. Qomolangma National Nature Reserve and adjacent regions have a fragile environment and are very sensitive to global climate change. Based on the MODIS and SPOT remote sensing data during 2000–2018, we aimed to explore the change trend and driving factors of grassland in this area under the dual influence of climate change and human activities. Here, temperature and precipitation data were enrolled as the main indicators of climate change, while the number of livestock at the end of the year was regarded as the key indicator of grazing. The results showed that: (1) during 2000–2018, the grassland NDVI reflected an overall increasing trend, and the impact of precipitation was more significant than those of temperature and grazing at both pixel and county levels; (2) probably due to the large population and high grazing intensity, the grassland NDVI in Tingri County was controlled by both precipitation and grazing. In general, precipitation exerts a greater impact on the NDVI changes since this region is characterized by arid and semiarid climates. In some areas, vegetation growth is simultaneously affected by both grazing and climate factors due to the relatively greater pressure of grazing. In the context of future warming, control of the number of tourists for Mt. Qomolangma, as well as that of livestock in Tingri County, will help improve sustainability development and to reduce the adverse effects of grassland degradation.

1. Introduction

The impact of climate change on terrestrial vegetation growth and its mechanism are important issues in the field of global change research. A large number of studies have proven that global climate change is an important driving factor for changes in terrestrial vegetation in recent decades [1,2,3]. For the Tibetan Plateau, it is generally believed that simultaneous increases in temperature and precipitation will be beneficial to alpine vegetation growth [4,5,6]. However, the sensitivity of vegetation productivity to temperature changes at the beginning of this century has declined, and climate warming during nongrowing seasons is considered as one of the main reasons [7]. Climate warming in the nongrowing seasons is not conducive to the preservation of snow in winter, and to a certain extent, it affects vegetation growth indirectly by affecting the water supply in the early growing season [8]. Another study found that temperature increases are likely to affect the plant growth of alpine grassland by changing the forms of precipitation at the beginning of the growing season [9]. In the context of climate change, compared with temperature, although the changes in precipitation are not necessarily the main limiting factor for the variations in the normalized difference vegetation index (NDVI) on the Tibetan Plateau [10], changes in moisture caused by temperature (such as increased evaporation) are likely to affect vegetation growth. In addition, the effects of temperature and precipitation on the NDVI of the Tibetan Plateau vary significantly depending on the seasons and regions [11,12]. Therefore, to explore the impact of climate change on alpine grasslands, we need to fully consider the temporal and spatial changes in temperature and precipitation.
The Tibetan Plateau is one of the main pastoral areas in China, and long-term grazing activities have a dual impact on the grassland of the plateau. On the one hand, grazing affects vegetation biomass and soil compactness through gnawing and trampling [13]. On the other hand, grazing may stimulate plant growth [14] and improve soil fertility through manure [15]. Therefore, it seems that the grazing intensity determines the effect on alpine grassland to a large extent, and the influence of grazing activities on the vegetation in pastoral areas may vary with the grazing density and the length of the grazing period. Exploring a reasonable grazing intensity is a key issue for vegetation protection and sustainable use of forage; however, the related research is still controversial. For example, Zhang et al. (2015) and Lehnert et al. (2016) pointed out that climate is the main controlling factor for changes in alpine grassland ecosystems on the Tibetan Plateau [16,17]. However, Pan et al. (2017) believed that the nonclimatic factors from 1982 to 2013 were responsible for the changes in the alpine grassland on the plateau [18].
As an important national barrier for ecological security and the Asia Tower [19], the Tibetan Plateau plays a unique role in protecting the ecological security of China and even Southeast Asia. However, under the background of global climate change and increasing human activities, the function of the national barrier for ecological security on the Tibetan Plateau is facing serious threats and challenges. The Mt. Qomolangma National Nature Reserve and the seven surrounding counties of Zhongba, Saga, Gyirong, Nyalam, Tingri, Dinggye, and Ngamring, belonging to the Tingri Ecological Observation Station of the Ecology and Environment Bureau in Tibet, are an important ecosystem type on the Tibetan Plateau. The protection of grassland resources is an important part of the construction of ecological security barrier in Tibet [20]. According to the 1:1,000,000 Vegetation Atlas of China [21], the forest, shrub, and grassland in the Mt. Qomolangma National Nature Reserve and adjacent regions accounted for 0.66%, 3.80%, and 68.15%, respectively. According to statistical data, the available grassland area in this region is approximately 82,800 km2, of which degraded grassland accounts for approximately 42% [22]. Additionally, grassland degradation poses important challenges to the protection and construction of regional ecological security barriers. In this study, based on MODIS (Moderate Resolution Imaging Spectroradiometer) and SPOT (Systeme Probatoire d’Observation de la Terre) remote sensing data, the temperature and precipitation data, and the data of the number of livestock during 2000–2018 in Mt. Qomolangma National Nature Reserve and adjacent regions, we aimed to (1) illustrate the temporal and spatial patterns of grassland NDVI and (2) disclose the relative effects of climate change and grazing on NDVI changes. Here, temperature and precipitation were regarded as the main indicators of climate change and the number of livestock at the end of the year as the key indicators of grazing.

2. Materials and Methods
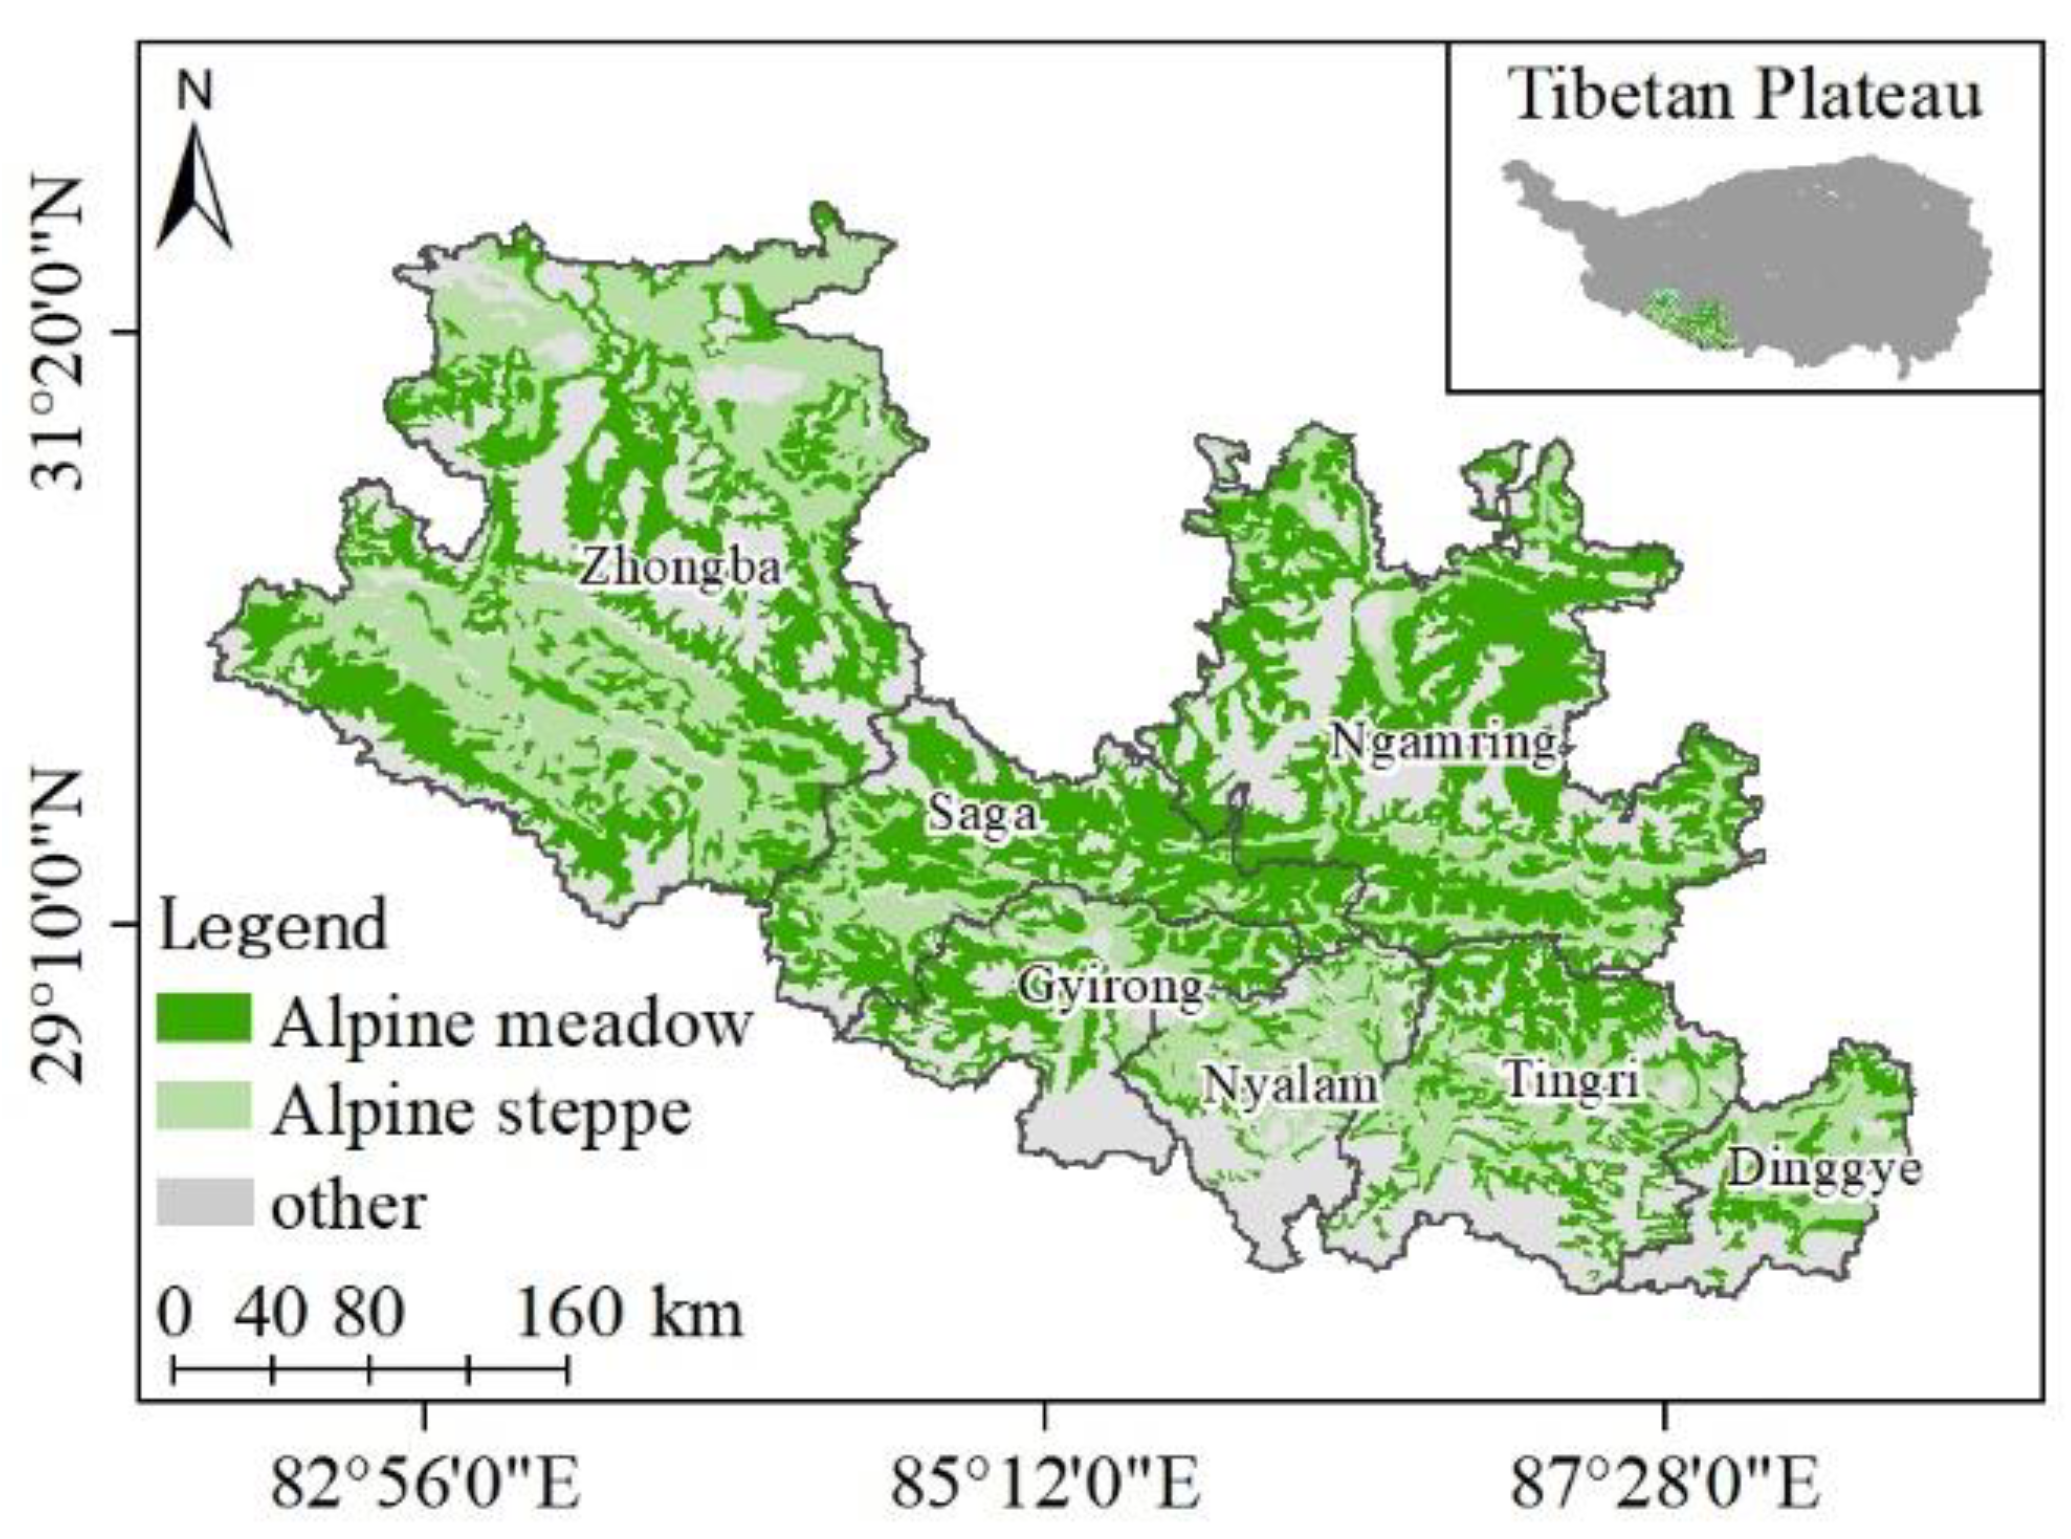
2.1. Study Area

The Mt. Qomolangma National Nature Reserve and adjacent regions (27.70° N–31.90° N; 82.10° E–88.40° E) are located in the south Tibetan Plateau, including the seven counties of Zhongba, Saga, Gyirong, Nyalam, Tingri, Dinggye, and Ngamring (Figure 1). This area is located between the middle section of the Himalayas and the Gangdise Mountains. The terrain is high in the north and south, with the Yarlung Zangbo River passing between. The middle part is, therefore, characterized by wide valleys and alluvial plains. The landform types are complex and diverse, and the climate exhibits cold and dry conditions. Based on the long-term meteorological observations (1967–2019) at Dingri station (a.s.l., 4300 m), the mean annual, January, and July air temperature and annual rainfall were 3.08, −5.84, 11.69 °C, and 286 mm, respectively [23]. Alpine grassland (mainly comprising alpine meadow and alpine steppe) is the main land-cover type (Figure 1). The common species in alpine steppe contain Stipa purpurea, Lasiocaryum densiflorum, Artemisia wellbyi, Incarvillea compacta, and Androsace tapete, while those in alpine meadow include Kobresia pygmaea, Potentilla bifurca, Lancea tibetica, Arenaria bryophylla, Leontopodium pusillum, and Gentian sp. The Mt. Qomolangma National Nature Reserve and adjacent regions have an area of approximately 87,600 km2, where usable grassland area covers 82,800 km2. The areas of lightly degraded, moderately degraded, and severely degraded grassland of the study area are 23,400; 10,400; and 33,300 km2, respectively, accounting for 26.71%, 11.93%, and 3.78% of the total grassland area, respectively [22].

2.2. Data Processing

In this study, alpine meadow and steppe in this region were selected as the research object by using the Vegetation Atlas of China (1:1,000,000). Two NDVI datasets were used, including SPOT NDVI from the Resources and Environment Science and Data Center of the Chinese Academy of Sciences, and MODIS NDVI from the NASA website (MOD13A3 datasets). The spatial resolution of the two types of NDVI is 1 km, with the same time interval of 2000–2018. The maximum NDVI during the growing season (May to September) was used in this study. Temperature and precipitation datasets during the early plant-growing season of 2000–2018 were downloaded from the National Tibetan Plateau Data Center (http://data.tpdc.ac.cn, accessed on 20 July 2019). Considering that the maximum NDVI generally occurs at the peak of the plant-growing season (early August), the climatic conditions in the early growing season (May to July) are critical for vegetation growth [24,25]. Therefore, the precipitation (GSP) and average temperature (GST) of the early growing season were selected, and the spatial resolution was 0.1° × 0.1°. The number of livestock (LN) during 2000–2018 in each county of the study area can be found in the National Tibetan Plateau Data Center and Tibet Statistical Yearbook (www.shujuku.org, accessed on 12 February 2020). The absolute numbers of different animals were converted to standard sheep units (SU) [26]. The vector data, such as administrative divisions used in this study, are from the National Catalog Service for Geographic Information. The population data of the study area were obtained from the National Tibetan Plateau Data Center.

2.3. Analysis of NDVI Interannual Change Trend

A linear regression method was used to detect the interannual changes in the vegetation index [27]. The least square method was used to calculate the regression coefficient, namely, the interannual variation trend of NDVI, as follows:
θ s l o p e =   n × i = 1   n i   ×   NDVI i     i = 1 n i i = 1 n NDVI i n   × i = 1 n i 2     ( i = 1 n i ) 2
where θslope refers to the interannual trend in NDVI, n is the number of years simulated, and NDVIi is the NDVI value of the ith year. We determined the significance of variation (significant change or no significant change) via T-tests to calculate confidence levels.

2.4. Correlation Analysis between NDVI and Main Influencing Factors

Correlation coefficient calculations and significance tests were used to detect the relationship between grassland growth change and climate change in the study area. The partial correlation method was further used to analyze the relative impact of grazing and climate change on NDVI changes. The mathematical expression of the Pearson correlation coefficient is:
R X   NDVI   =   n × i = 1 n X i ×   NDVI i     i = 1 n X   i × i = 1 n NDVI i n   × i = 1 n X i 2     ( i = 1 n X i ) 2 × n   × i = 1 n NDVI i   2   ( i = 1 n NDVI i ) 2
where R refers to the correlation coefficient, n is the number of years simulated, and X and NDVI are independent and dependent variables, respectively. Based on the NDVI during 2000–2018 and the corresponding temperature and precipitation, this study analyzed the correlation between NDVI and the main climatic factors in the study area, and conducted a significance test. When there are only three variables, a simple correlation coefficient can be used to indirectly calculate the partial correlation coefficient. Setting the three variables as LN, GST, and NDVI, and when LN remains constant, the partial correlation coefficients of GST and NDVI are:
R NDVI   GST = R NDVI   GST   R GST   LN ×   R NDVI   LN ( 1     R GST   LN 2 ) × ( 1 R NDVI   LN 2 )
where RNDVI GST refers to the partial correlation coefficient of NDVI and GST when LN is fixed, and where RNDVI SPEI, RNDVI LN, and RGST LN are the correlation coefficients of NDVI and GST, NDVI and LN, and GST and LN, respectively.

2.5. RESTREND Analysis

The residual trend (RESTREND) method is based on the hypothesis that vegetation growth is determined by climate change. After removing the climate influence, the human-induced vegetation change could thus be identified [28,29]. The trends in NDVI residuals (NDVIH = NDVIP − NDVIA) between the observed (NDVIA) and the predicted values (NDVIP) were calculated at a 0.1° × 0.1° pixel level. NDVIA is applied to regress against GST and GSP to generate a statistical model which is then used to compute NDVIP at each pixel [30,31,32]. More details can be found in Li et al. (2012) [30] and Cai et al. (2015) [32]. Table 1 shows the relative effects of climate change (SlopeNDVIP) and human activities (SlopeNDVIH) on grassland change (SlopeNDVIA) in six different scenarios [33]. For example, in the first scenario, an increasing trend in NDVIA and a declining trend in NDVIP result in a decreasing NDVIH, which means that human activity mainly determines the NDVIA increase.

2.6. Statistical Analysis

The annual variations of NDVI and corresponding climatic factors and the relationships between NDVI and climatic factors were fixed by simple linear correlations. Partial correlations between NDVI and climatic factors of GSP and GST were analyzed at a pixel scale. Since LN data were only available for each county, we applied partial correlation between NDVI and GSP, GST, and LN at a county scale. All statistical analyses were performed using SPSS 19.0 (SPSS Inc., Chicago, IL, USA), and spatial analysis was performed using ArcGIS 10.7 for Desktop. Further, the relative effects of climate change and human activities on NDVI changes were detected by the RESTREND method described above.

3. Results

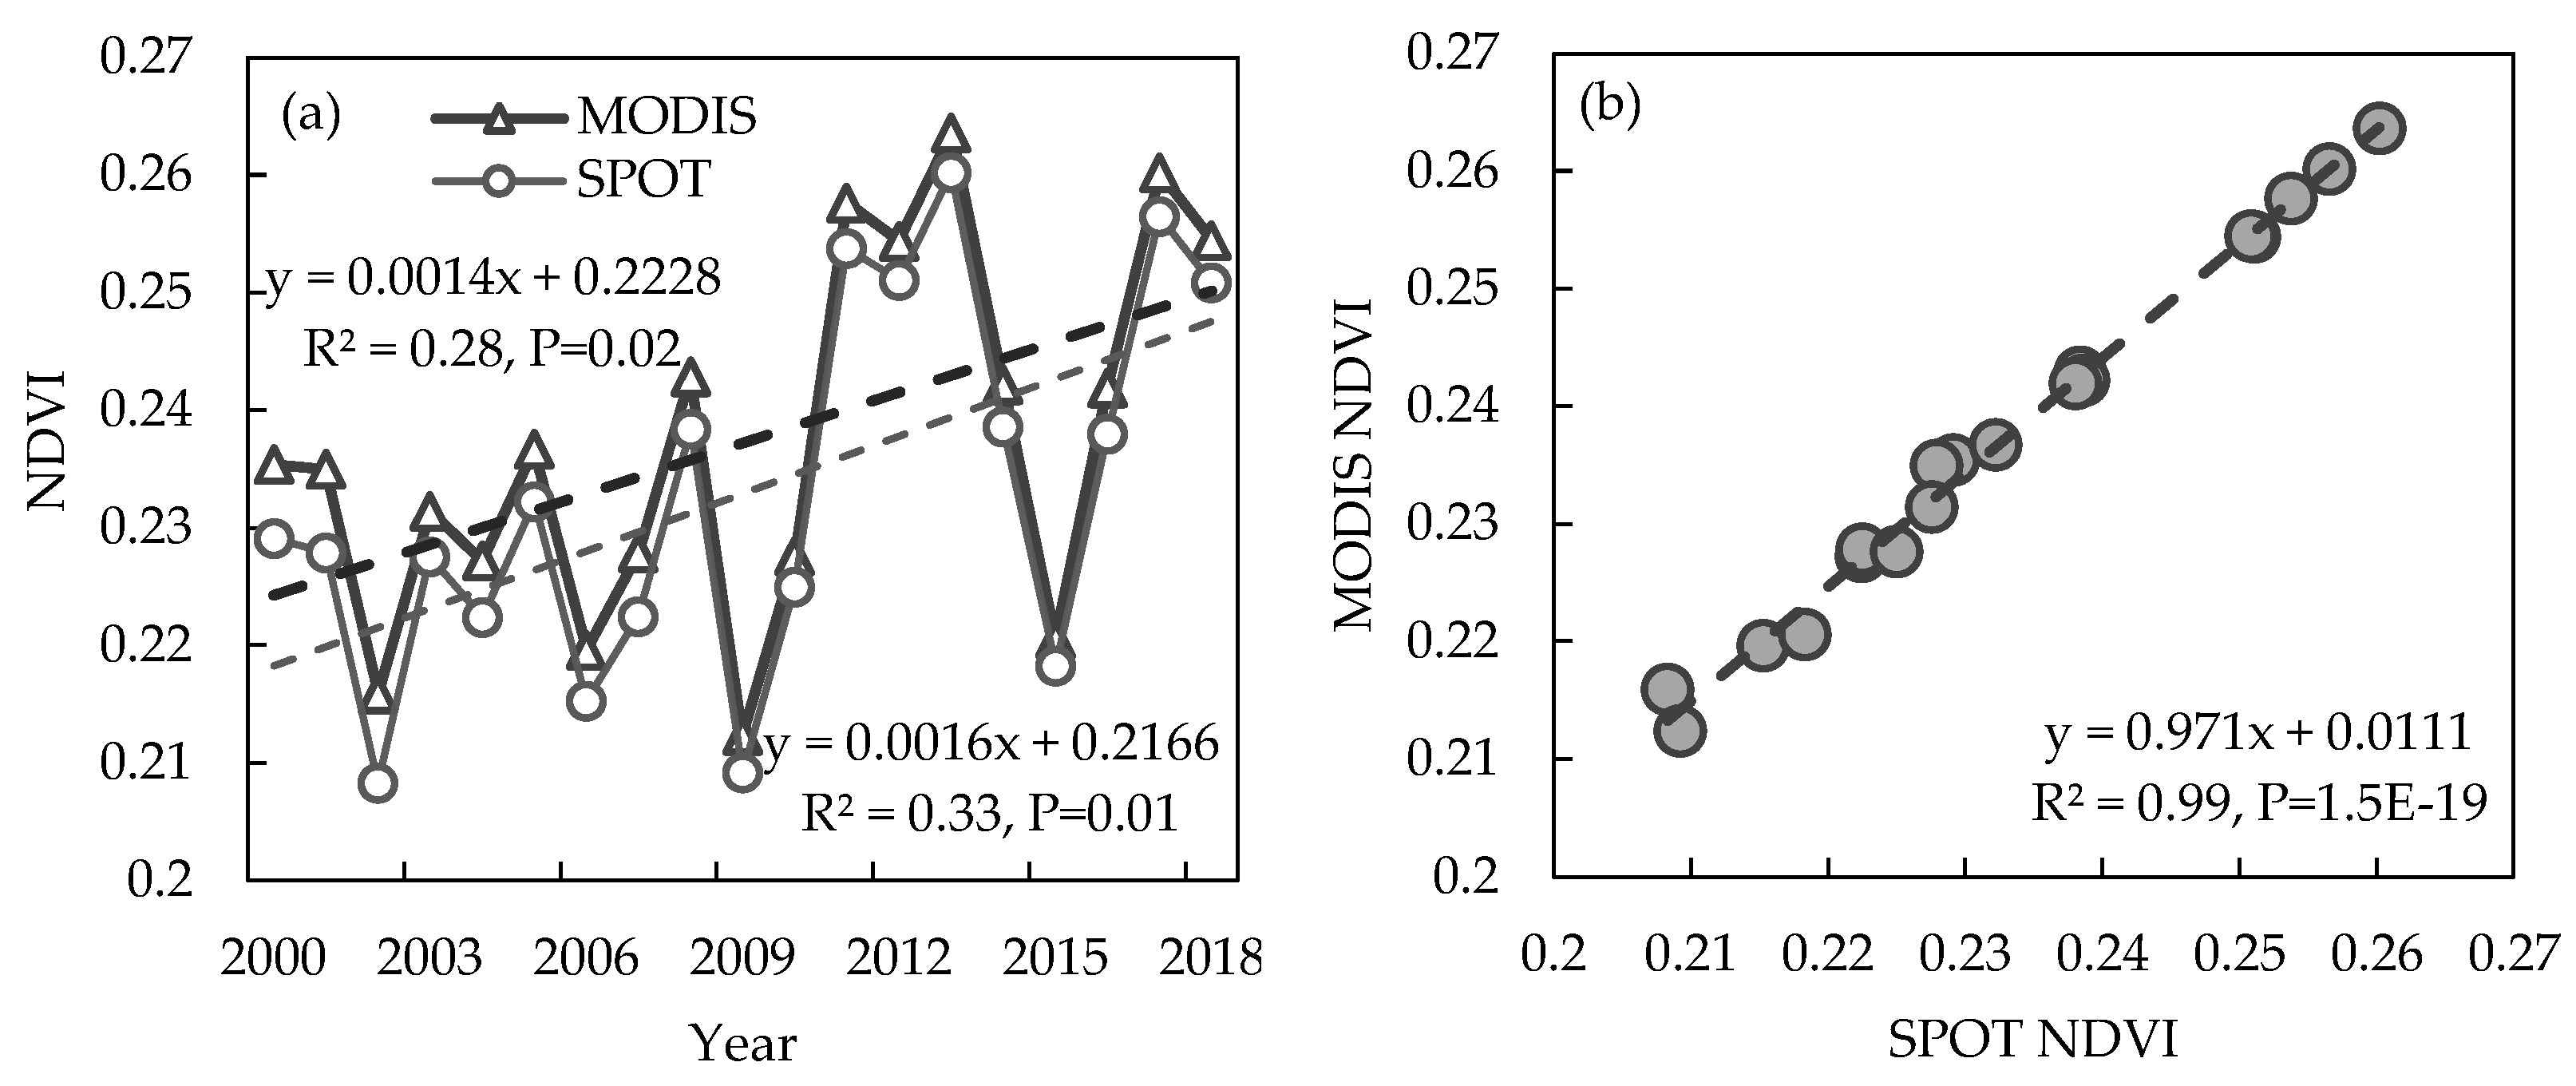
3.1. Interannual Variations in Grassland NDVI during 2000–2018

Both MODIS NDVI and SPOT NDVI data indicate that the grassland NDVI in the study area increased significantly during 2000–2018 (Figure 2a, MODIS, R2 = 0.28, p = 0.02; SPOT, R2 = 0.33, P = 0.01). The mean NDVI values were approximately 0.23 during the last 19 years, with their maximum in 2013 and minimum in 2002 or 2009. Figure 2b shows that the MODIS NDVI is highly correlated with the SPOT NDVI in the study area (R2 = 0.99, P = 0.00), indicating that the two datasets can be verified by each other. In view of their high correlation, we only present the results based on MODIS NDVI analysis in the following section.

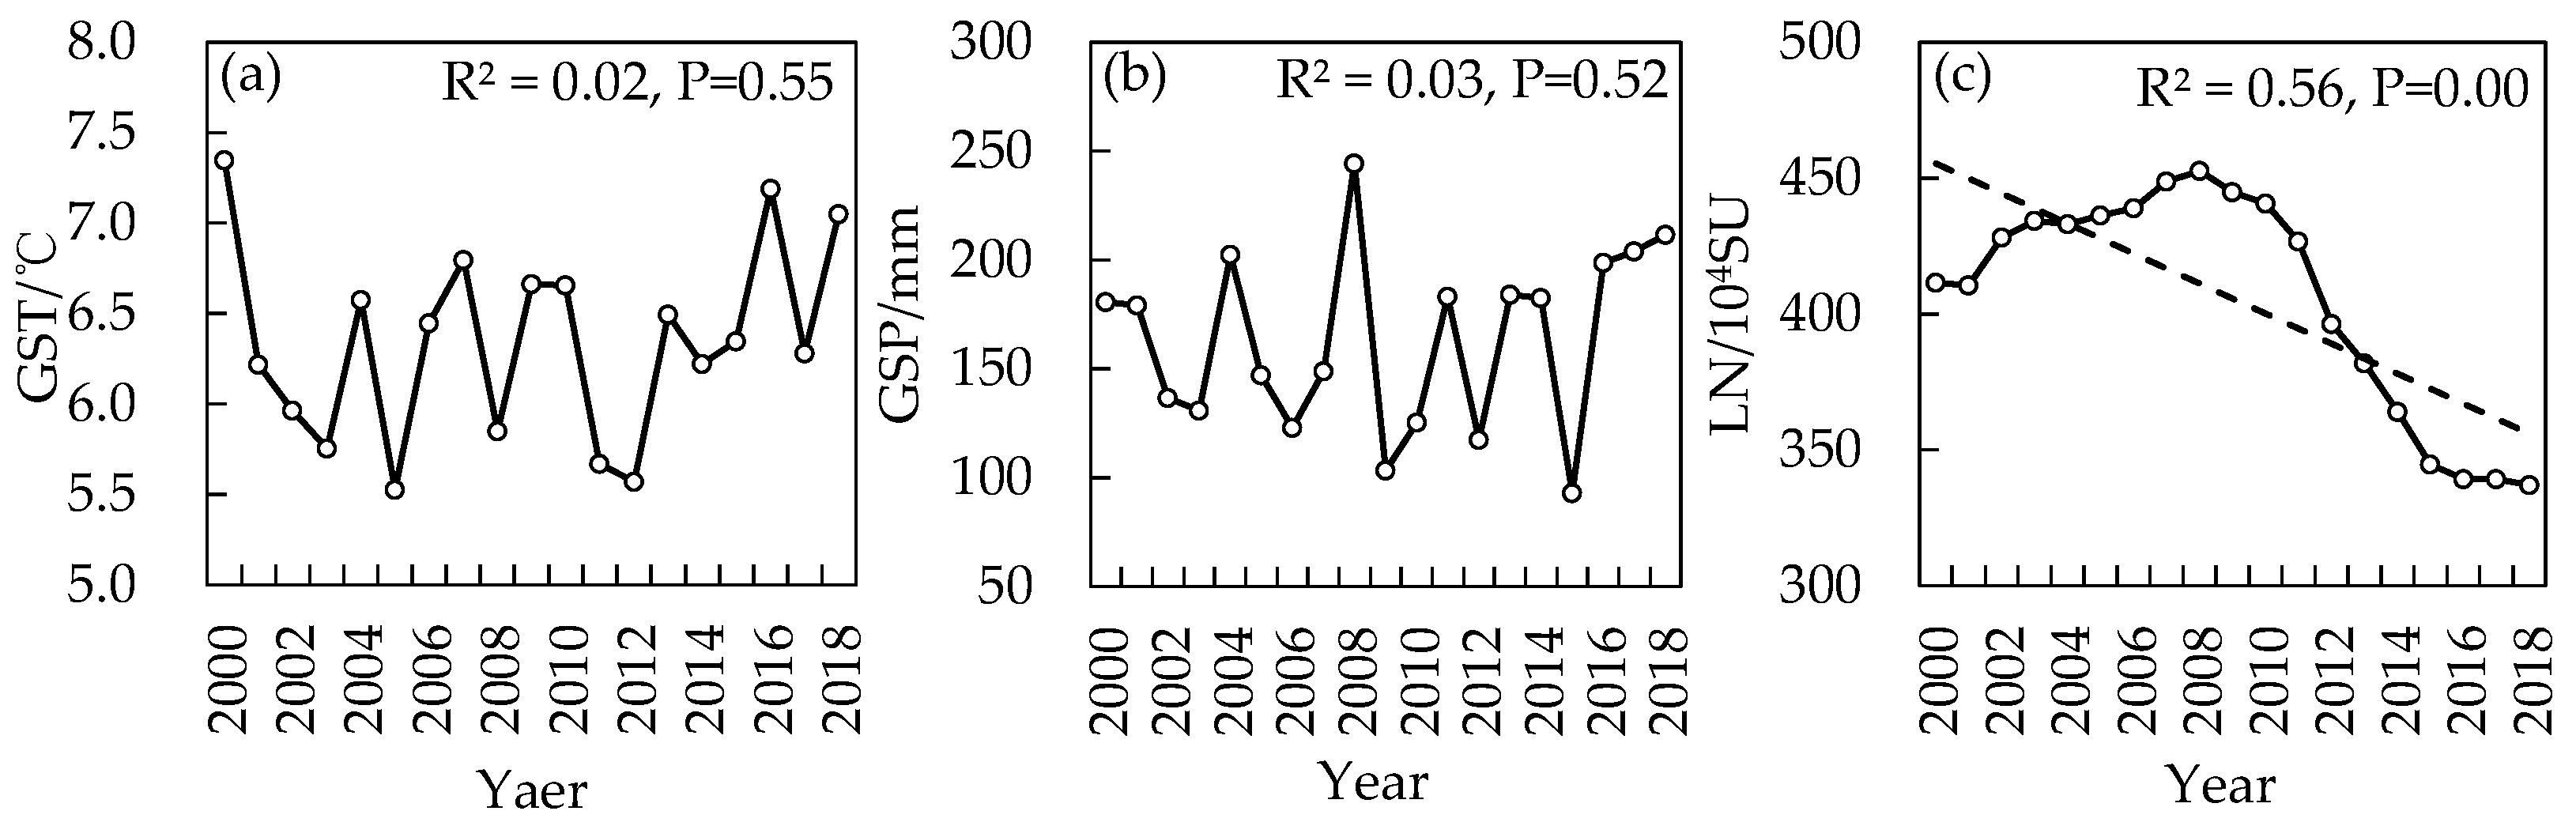
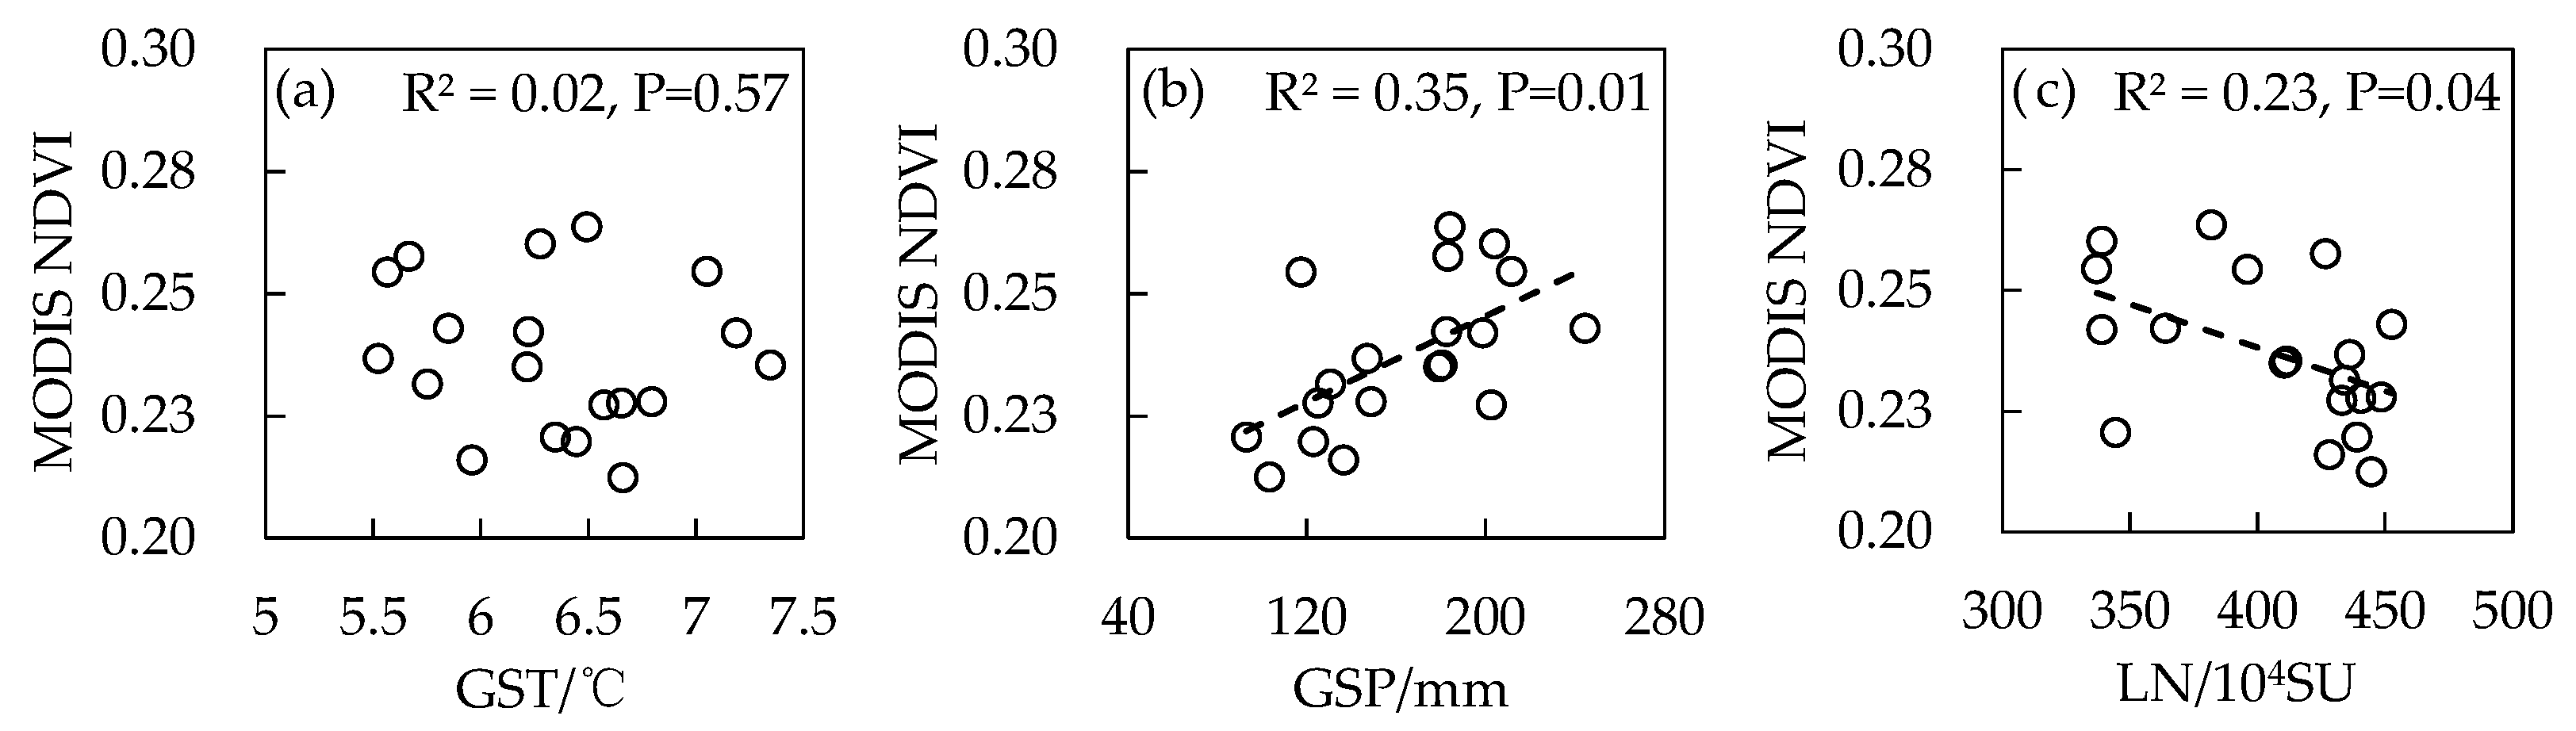
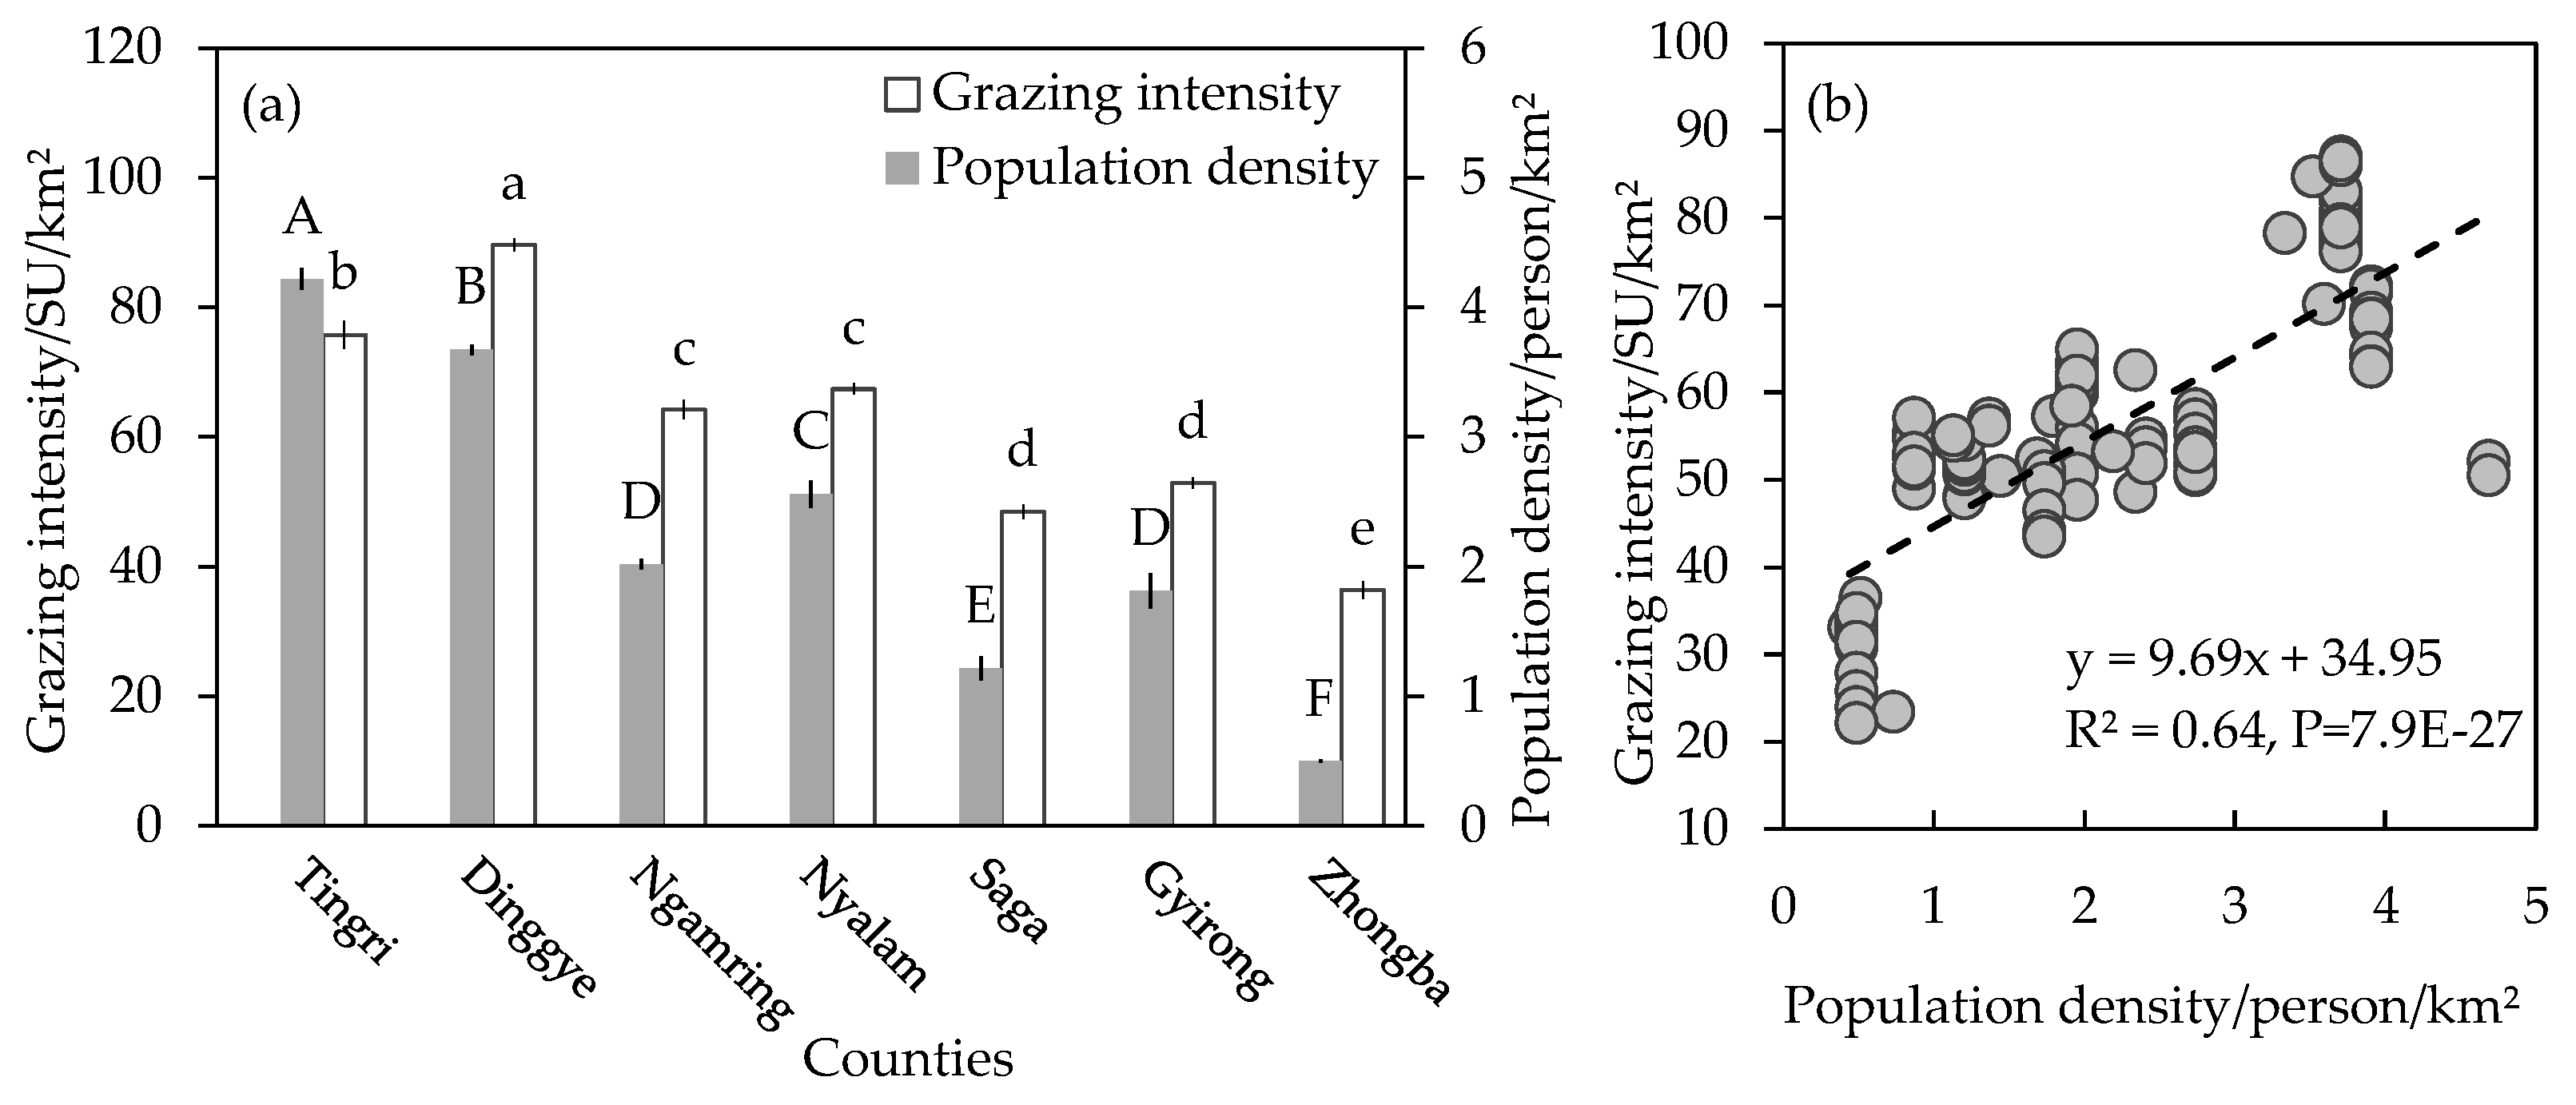
3.2. Variations in Climatic Factors and the Number of Livestock and Their Relationships with NDVI

In this area, GST (Figure 3a, R2 = 0.02, P = 0.55) and GSP (Figure 3b, R2 = 0.03, P = 0.52) did not vary during 2000–2018. However, LN reflected a significant decreasing trend (Figure 3c, R2 = 0.56, P = 0.00), especially after 2008.
Pearson correlation analysis showed that NDVI was not correlated with GST (Figure 4a, R2 = 0.02, P = 0.57) but was positively related to GSP (Figure 4b, R2 = 0.35, P = 0.01) and negatively correlated with LN (Figure 4c, R2 = 0.23, P = 0.04).

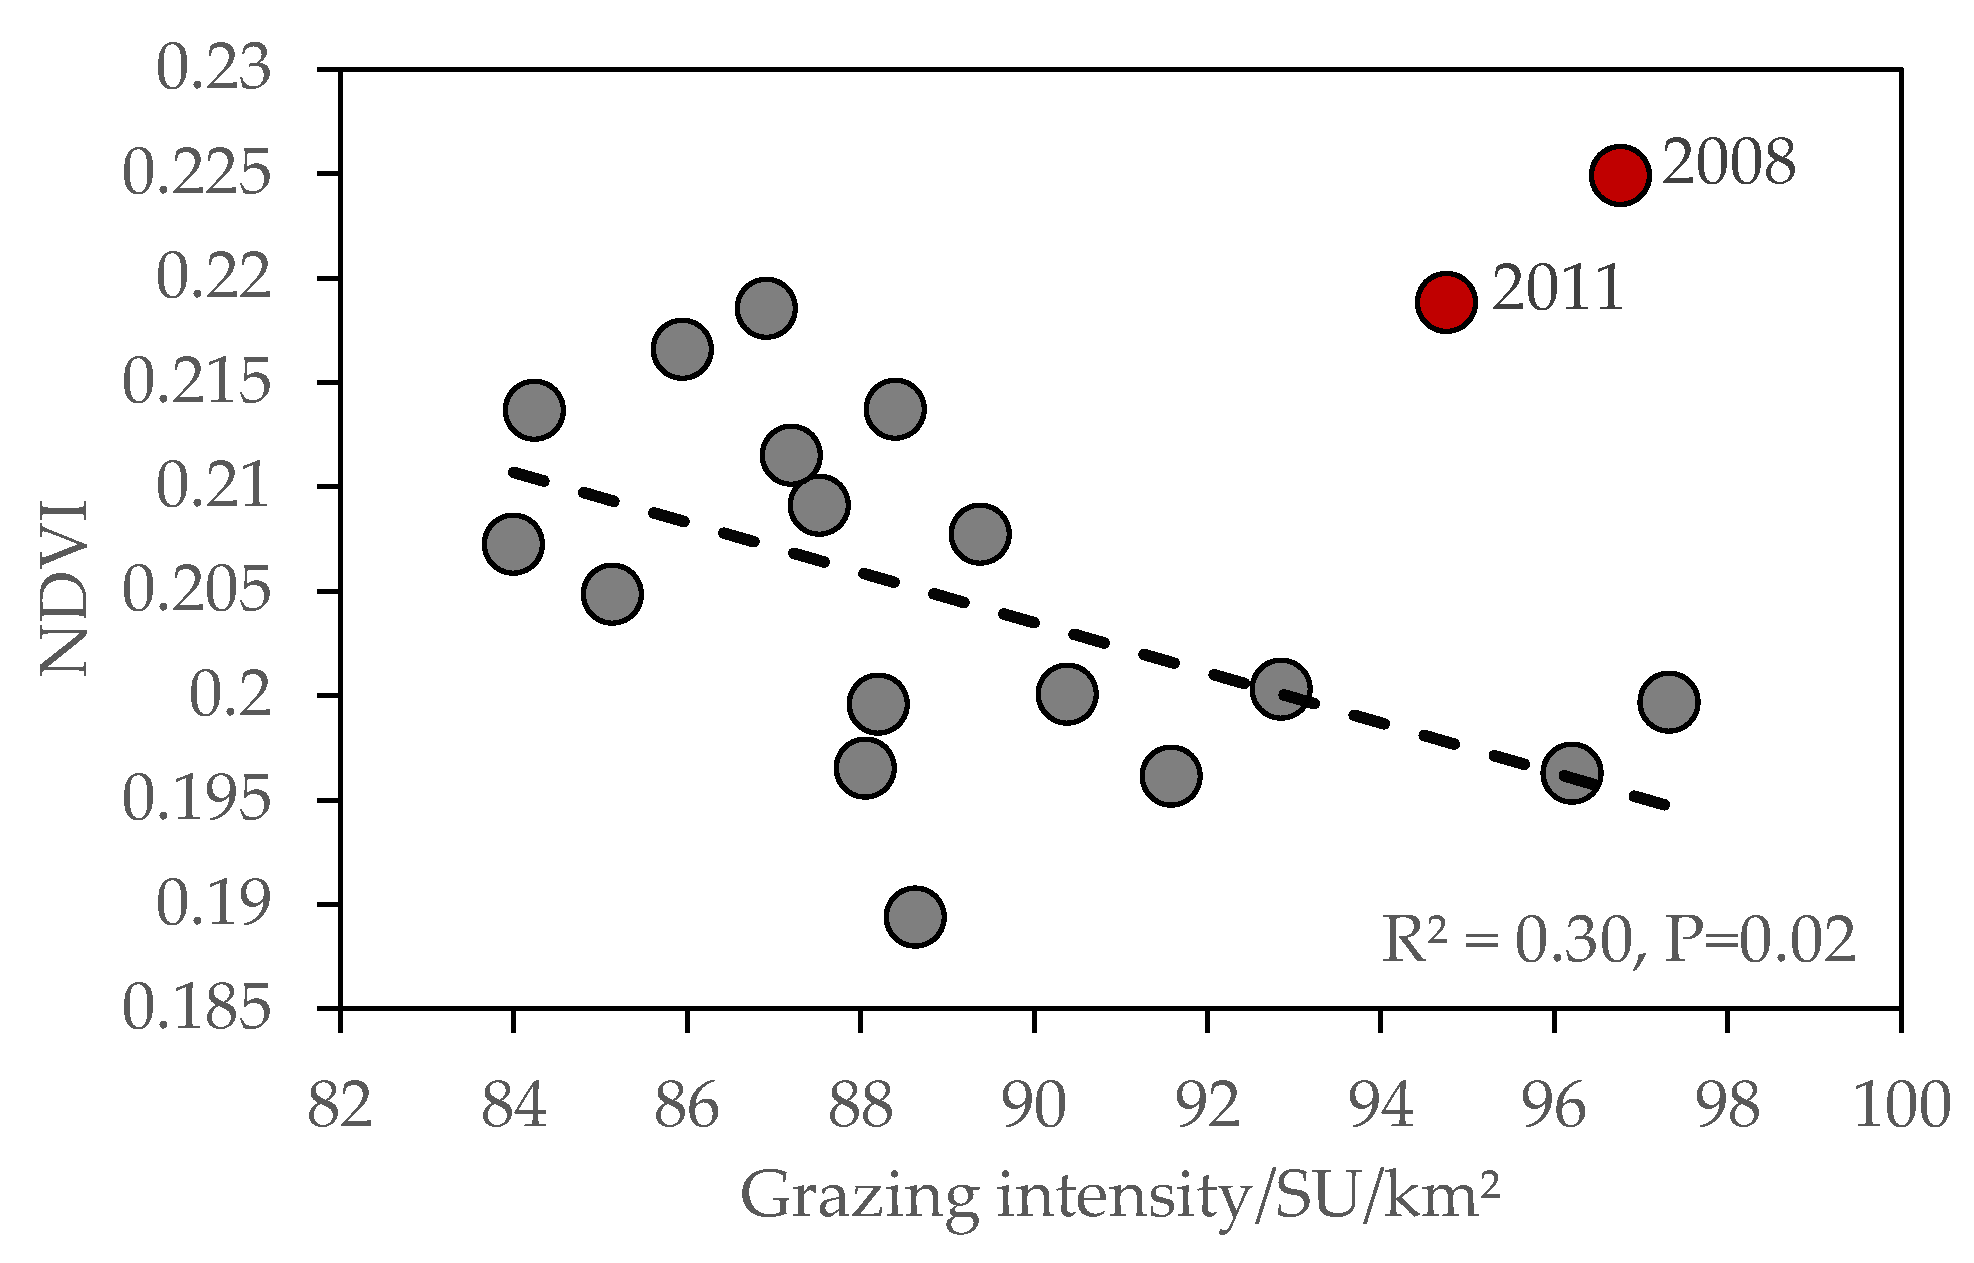
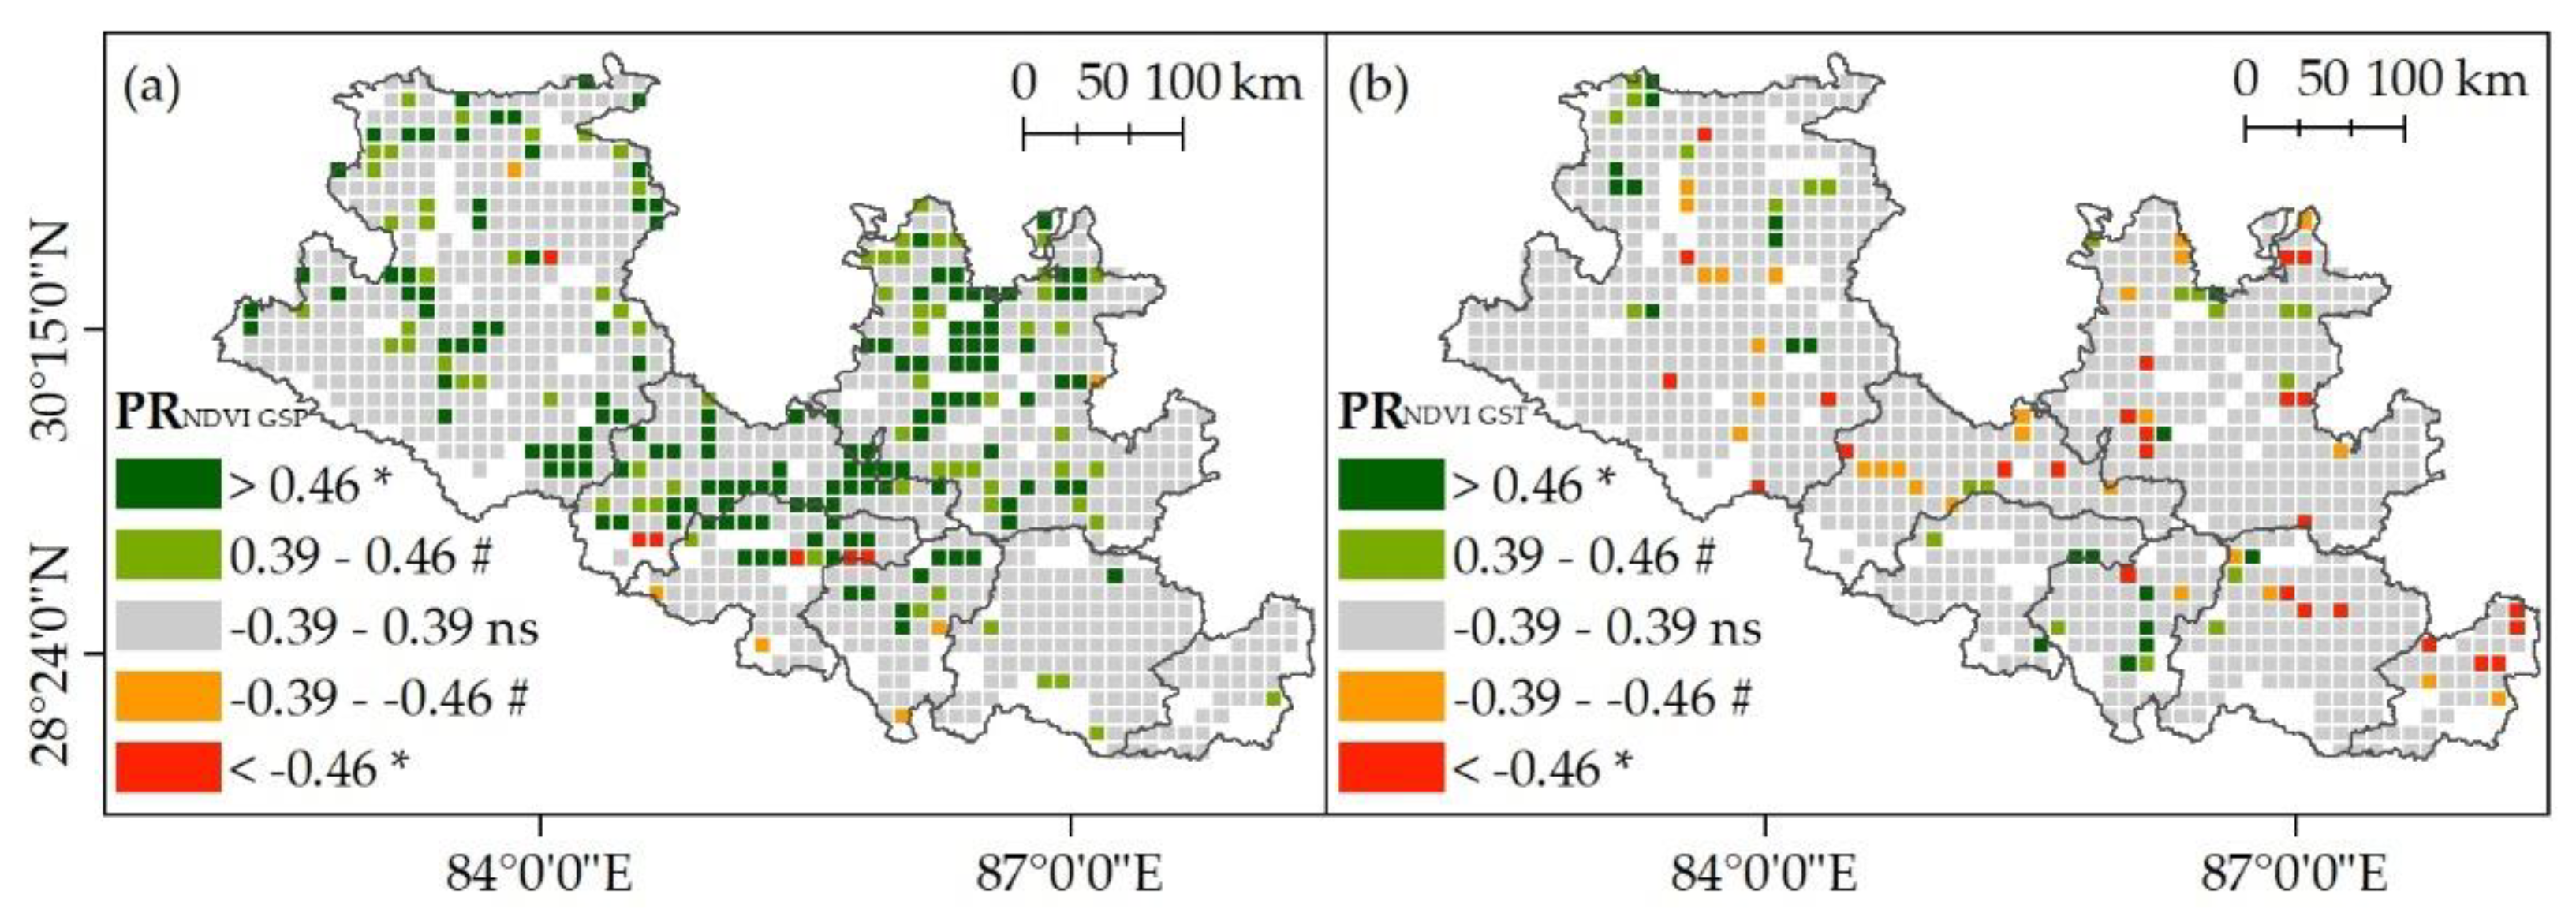
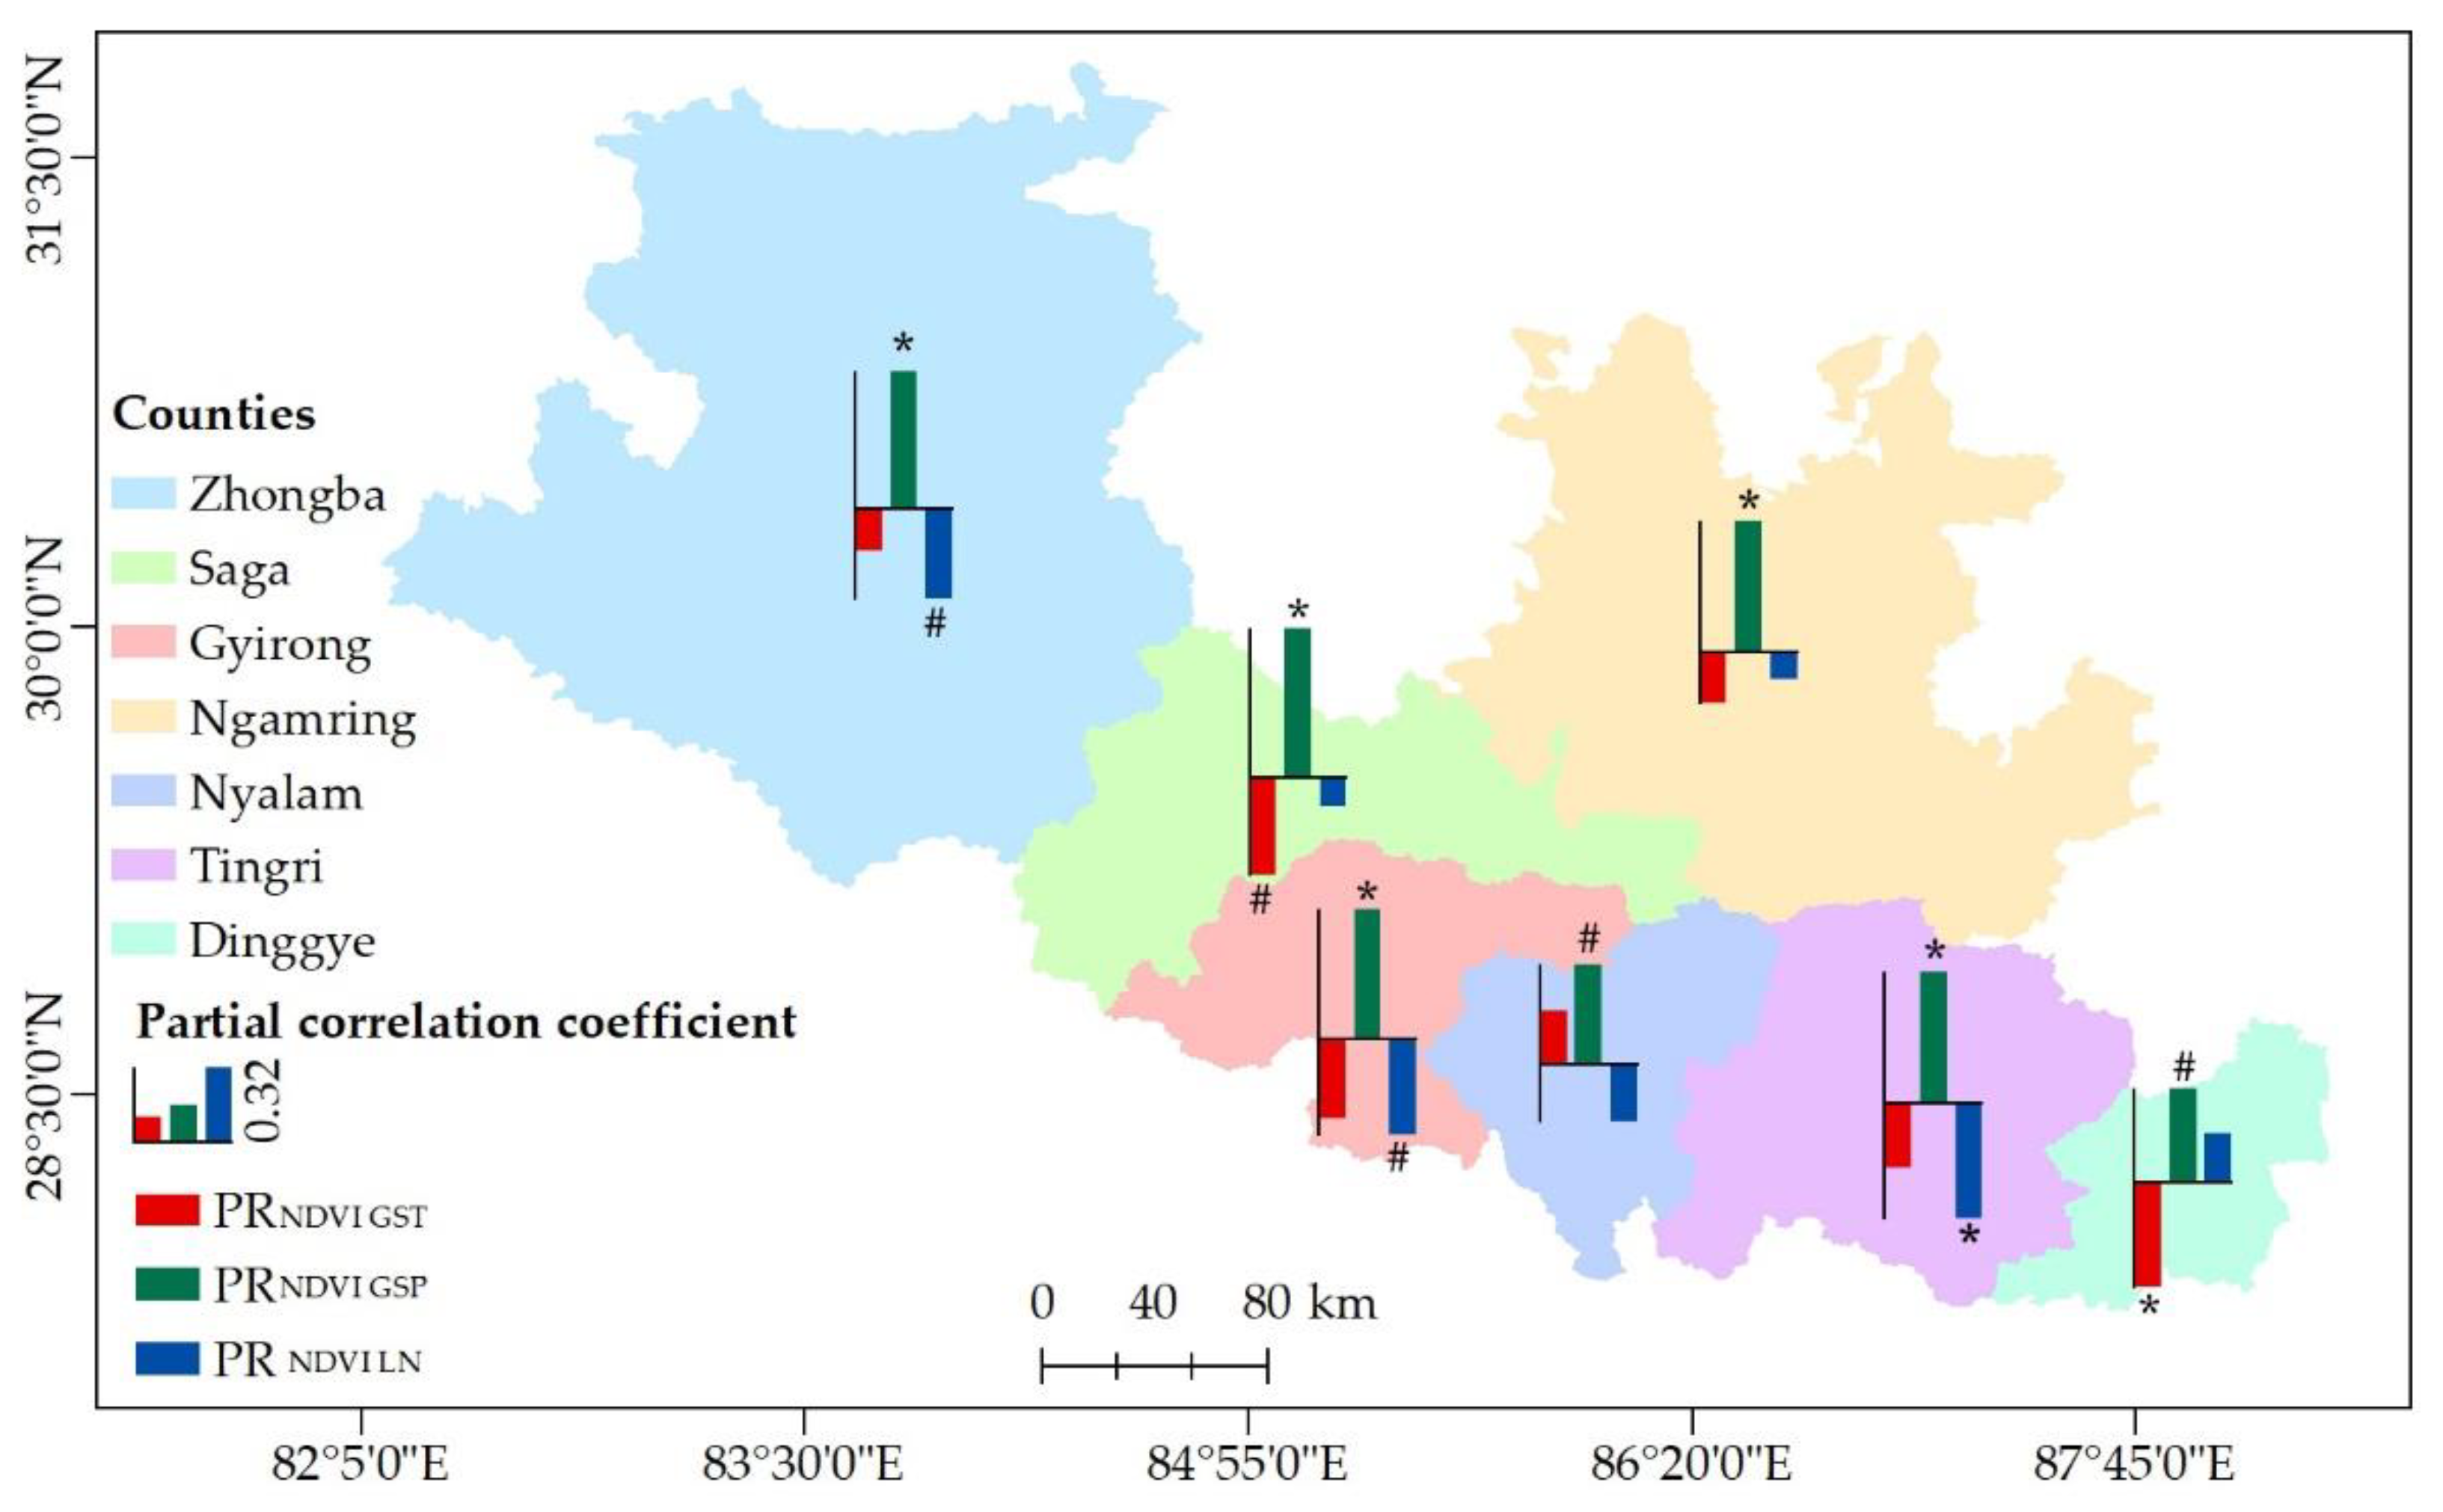
3.3. Relative Effects of Climate Factors and Grazing on Grassland NDVI

At the pixel level, NDVI was more closely related with GSP than with GST. There were 22.31% pixels showing significantly positive partial correlations between NDVI and GSP (Figure 5a), but only 5.42% reflecting significantly positive correlations between NDVI and GST (Figure 5b). Additionally, the partial correlation coefficients between NDVI and GSP showed substantial spatial variations, and those area affected by GSP were mainly distributed in the center part, i.e., Saga and Ngamring.
At the regional level, the partial correlation analysis showed that NDVI variations for most counties in this area were mainly affected by the climatic factor of precipitation, and only that in Tingri County were mediated by both climate and grazing (Figure 6). Among the six counties affected by climate factors, the NDVI for Dinggye County was mainly controlled by GST, while the other five were generally affected by GSP.
The RESTREND analysis, as shown by Figure 7, further indicated that the area showing increasing NDVI accounted for 63.22% of the study area, in which 32.17% was due to climate change, 24.80% was due to human activities, and 6.25% was due to both climate change and human activities. The reason for the NDVI increase by human activities might be mainly due to the implementation of an ecological restoration project (Grazing Withdrawal Program). For the area (36.78%) depicting decreasing NDVI, 21.62% was due to human activities, 12.30% due to climate change, and 2.87% due to both climate change and human activities. The reason for the NDVI decrease by human activities could be mainly due to overgrazing (e.g., Tingri County).

4. Discussion

The Tibetan Plateau has an average altitude of more than 4000 m and is characterized as a typical alpine ecosystem. Therefore, low temperature is generally considered to be a key factor restricting plant growth in this area [6,10]. However, in arid western Tibet, precipitation is considered to be a more important limiting factor than temperature [34]. Synthesizing the results of Pearson correlation and partial correlation analysis, we found that the variations in grassland NDVI in the Mt. Qomolangma National Nature Reserve and adjacent regions are mainly affected by climatic factors, especially precipitation. This is consistent with existing studies. For example, based on an analysis of the net primary productivity (NPP) of grassland vegetation on the Tibetan Plateau during 2000–2015, He et al. (2019) found that precipitation was the first limiting factor of NPP [35]. This is associated with the effects of rain shadows in the Himalayas. At the same time, the impact of climate change on grassland vegetation is largely related to grazing intensity. In areas with heavy grazing intensity (larger LN), grassland NDVI is more significantly affected by grazing, and when grazing intensity exceeds a certain threshold, the negative effect of grazing on grassland is likely to offset or even exceed the positive effect of climate change on the growth of alpine grassland [36]. In general, human activities have a relatively weak impact on the grassland ecosystems in the study area; therefore, the variation in NDVI is mainly controlled by climate.
However, unlike the other six counties, the variation in grassland NDVI in Tingri County was controlled by both climate (precipitation) and grazing, which indicated that the grazing pressure was heavy in Tingri County to some extent. Figure 8a further illustrated that the population density of Tingri County was the highest among the seven counties, and the grazing intensity was the second highest. Synthesizing the population and grazing intensity data of the seven counties in the study area during the past 20 years, we found that both data were significantly correlated with each other (Figure 8b), i.e., the variation in population density at the county level largely reflected that of the grazing intensity. In addition, the Mt. Qomolangma scenic spot is located in Tingri County. According to the data provided by the Mt. Qomolangma National Nature Reserve Administration, an average of 82,300 tourists was received each year during the past 10 years (2011–2019). This number increased to approximately 119,000 during the past 3 years (2017–2019), which is approximately twice the resident population of Tingri County. A large number of tourists would undoubtedly stimulate the demands for livestock products, which might indirectly cause an increase in grazing intensity and aggravate the negative impact on grassland.
It is worth noting that the grazing intensity of Dinggye County ranks first among the seven counties in the study area (Figure 8a). Theoretically, the grazing intensity should be closely related to the changes in NDVI, but partial correlation analysis showed that the grazing effect on the grassland NDVI of the county was not significant. This may be related to the vegetation degradation caused by overgrazing in the county; that is, under heavy grazing conditions, the relationship between NDVI and grazing intensity may be nonlinear [37,38]. In addition, it can be inferred from Figure 9 that NDVI showed a significant negative correlation with grazing intensity after excluding the data in 2008 and 2011, when the precipitation was abundant or the temperature was very low, indicating that the strong fluctuation of the hydrothermal combination factor in different years may play an important role in regulating the relationship between grazing intensity and NDVI. The significantly negative partial correlation between GST and NDVI in Dinggye County further indicates that the future warming climate will not be advantageous for plant growth, which is assumed to associate with increased evapotranspiration and droughts [39,40].
In this study, we found that the NDVI showed an overall increasing trend during 2000–2018, and GSP was the main limiting factor. However, the GSP did not show a significant increasing pattern in the past 19 years, indicating that its interannual fluctuations rather than the changing trend determined the correlation between NDVI and precipitation. This result is consistent with Zhang et al. (2013), who found that the decline in NDVI in the Kosi River Basin in the central Himalayas (involving Tingri, Dinggye, and Nyalam counties) during 1982–1994 and 1994–2000 was related to a sudden drop in precipitation [3]. Therefore, concerning the reasons for vegetation changes, we should pay more attention to the impact of extreme climate events such as extreme precipitation years [41,42].

5. Conclusions

The grassland NDVI in the Mt. Qomolangma National Nature Reserve and adjacent regions showed an overall increasing trend during 2000–2018. This increase is mainly attributed to precipitation rather than temperature or human activities (grazing). However, vegetation growth can also be simultaneously affected by grazing and/or temperature in some areas with relatively heavy grazing pressure, such as in Tingri and Dinggye counties. As a famous scenic spot in the world, the Mt. Qomolangma National Nature Reserve attracted a large number of tourists each year, which would stimulate the demands for livestock products, and cause an increase in grazing intensity and aggravate the negative impact on grassland ecosystems. Therefore, control of the number of tourists for Mt. Qomolangma, as well as that of livestock in Tingri County, will help improve sustainability development and reduce the adverse effects of grassland degradation caused by consistent warming.

Author Contributions

Conceptualization, L.Z., T.L. and W.Z.; methodology, W.Z.; software, W.Z.; validation, A. and H.W.; formal analysis, W.Z.; investigation, L.Z. and H.W.; resources, L.Z.; data curation, W.Z.; writing—original draft preparation, W.Z.; writing—review and editing, W.Z. and L.Z.; visualization, A.; supervision, L.Z.; project administration, L.Z.; funding acquisition, L.Z. and T.L. All authors have read and agreed to the published version of the manuscript.

Funding

The National Natural Science Foundation of China (41830649), the Key technology research and development projects in Xizang Autonomous Regions (XZ202101ZY0005G) and the Second Tibetan Plateau Scientific Expedition and Research (STEP) program (2019QZKK0301-1) provided financial support.

Institutional Review Board Statement

Not applicable.

Data Availability Statement

All data used in the manuscript are already publicly accessible, and we provided the download address in the manuscript.

Acknowledgments

We would like to thank the National Observation and Research Station for Qomolongma Special Atmospheric Processes and Environmental Changes, Tibet, China.

Conflicts of Interest

The authors declare no conflict of interest.

References

  1. Zhao, X.; Tan, K.; Zhao, S.Q.; Fang, J. Changing climate affects vegetation growth in the arid region of the Northwestern China. J. Arid Environ. 2011, 75, 946–952. [Google Scholar] [CrossRef]
  2. Kim, Y.; Kimball, J.S.; Zhang, K.; McDonald, K.C. Satellite detection of increasing northern hemisphere non-frozen seasons from 1979 to 2008: Implications for regional vegetation growth. Remote Sens. Environ. 2012, 121, 472–487. [Google Scholar] [CrossRef]
  3. Zhang, Y.L.; Gao, J.G.; Liu, L.S.; Wang, Z.F.; Ding, M.J.; Yang, X.C. NDVI-based vegetation changes and their responses to climate change from 1982 to 2011: A case study in the Koshi river basin in the middle Himalayas. Glob. Planet. Chang. 2013, 108, 139–148. [Google Scholar] [CrossRef]
  4. Wang, G.X.; Hu, H.C.; Wang, Y.B.; Chen, L. Response of alpine cold ecosystem biomass to climate changes in permafrost region of the Tibetan Plateau. J. Glaciol. Geocryol. 2007, 29, 671–679. (In Chinese) [Google Scholar]
  5. Hu, M.Q.; Mao, F.; Sun, H.; Hou, Y.Y. Study of normalized difference vegetation index variation and its correlation with climate factors in the three-river-source region. Int. J. Appl. Earth Obs. Geoinf. 2011, 13, 24–33. [Google Scholar] [CrossRef]
  6. Sun, J.; Cheng, G.W.; Li, W.P.; Sha, Y.K.; Yang, Y.C. On the variation of NDVI with the principal climatic elements in the Tibetan Plateau. Remote Sens. 2013, 5, 1894–1911. [Google Scholar] [CrossRef] [Green Version]
  7. Piao, S.L.; Liu, Z.; Wang, T.; Peng, S.S.; Ciais, P.; Huang, M.T.; Ahlstrom, A.; Burkhart, J.F.; Chevallier, F.; Janssens, I.A.; et al. Weakening temperature control on the interannual variations of spring carbon uptake across northern lands. Nat. Clim. Chang. 2017, 7, 359–363. [Google Scholar] [CrossRef]
  8. Wang, X.Y.; Wang, T.; Guo, H.; Liu, D.; Zhao, Y.T.; Zhang, T.T.; Liu, Q.; Piao, S.L. Disentangling the mechanisms behind winter snow impact on vegetation activity in northern ecosystems. Glob. Chang. Biol. 2018, 24, 1651–1662. [Google Scholar] [CrossRef]
  9. Li, R.C.; Luo, T.X.; Mölg, T.; Zhao, J.X.; Li, X.; Cui, X.Y.; Du, M.Y. Leaf unfolding of Tibetan alpine meadows captures the arrival of monsoon rainfall. Sci. Rep. 2016, 6, 20985. [Google Scholar] [CrossRef]
  10. Zhang, G.L.; Ouyang, H.; Zhang, X.Z.; Zhou, C.P.; Xu, X.L. Vegetation change and its responses to climatic variation based on eco-geographical region of Tibetan Plateau. Geogr. Res. 2010, 29, 2004–2016. (In Chinese) [Google Scholar]
  11. Sun, J.; Qin, X.J.; Yang, J. Precipitation and temperature regulate the seasonal changes of NDVI across the Tibetan Plateau. Environ. Earth Sci. 2016, 75, 291. [Google Scholar] [CrossRef]
  12. Zhang, L.; Guo, H.D.; Lei, J.; Lei, L.P.; Wang, C.Z.; Yan, D.M.; Li, B.; Li, J. Vegetation greenness trend (2000 to 2009) and the climate controls in the Qinghai-Tibetan Plateau. J. Appl. Remote Sens. 2013, 7, 073572. [Google Scholar] [CrossRef]
  13. Owensby, C.E.; Ham, J.M.; Auen, L.M. Fluxes of CO2 from grazed and ungrazed tallgrass prairie. Rangel. Ecol. Manag. 2006, 59, 111–127. [Google Scholar] [CrossRef]
  14. Liu, J.S.; Wang, L.; Wang, D.L.; Bonser, S.P.; Sun, F.; Zhou, Y.F.; Gao, Y.; Teng, X. Plants can benefit from herbivory: Stimulatory effects of sheep saliva on growth of Leymus chinensis. PLoS ONE 2012, 7, e29259. [Google Scholar] [CrossRef] [PubMed] [Green Version]
  15. Lin, Y.; Hong, M.; Han, G.D.; Zhao, M.L.; Bai, Y.F.; Chang, S. Grazing intensity affected spatial patterns of vegetation and soil fertility in a desert steppe. Agric. Ecosyst. Environ. 2010, 138, 282–292. [Google Scholar] [CrossRef]
  16. Zhang, X.Z.; Yang, Y.P.; Piao, S.L.; Bao, W.K.; Wang, S.P.; Sun, H.; Luo, T.X.; Zhang, Y.J.; Shi, P.L.; Liang, E.Y.; et al. Ecological change on the Tibetan Plateau. Chin. Sci. Bull. 2015, 60, 3048–3056. (In Chinese) [Google Scholar]
  17. Lehnert, L.W.; Wesche, K.; Trachte, K.; Reudenbach, C.; Bendix, J. Climate variability rather than overstocking causes recent large scale cover changes of Tibetan pastures. Sci. Rep. 2016, 6, 24367. [Google Scholar] [CrossRef] [Green Version]
  18. Pan, T.; Zou, X.T.; Liu, Y.J.; Wu, S.H.; He, G.M. Contributions of climatic and non-climatic drivers to grassland variations on the Tibetan Plateau. Ecol. Eng. 2017, 108, 307–317. [Google Scholar] [CrossRef]
  19. Zhong, H.X.; Liu, S.Z.; Wang, X.D.; Zhu, W.Z.; Li, X.M.; Yang, L. A Research on the protection and construction of the state ecological safe shelter zone on the Tibet Plateau. J. Mt. Sci. 2006, 24, 129–136. (In Chinese) [Google Scholar]
  20. Wang, X.D.; Cheng, G.W.; Zhao, T.; Zhang, X.Z.; Zhu, L.P.; Huang, L. Assessment on protection and construction of ecological safety shelter for Tibet. Bull. Chin. Acad. Sci. 2017, 32, 29–34. (In Chinese) [Google Scholar]
  21. Editorial Board of Vegetation Map of China, Chinese Academy of Sciences. Vegetation Atlas of China; Science Press: Beijing, China, 2001. (In Chinese) [Google Scholar]
  22. Tibet Department of Agriculture and Animal Husbandry. Grassland Resources and Ecological Statistics in Tibet Autonomous Region; China Agriculture Press: Beijing, China, 2017; pp. 183–200. (In Chinese) [Google Scholar]
  23. Wang, S.J.; Tang, X.Y.; Wang, G.; Li, Y.Q. Study on the climatic characteristics in the mount Qomolangma region during the last 53 Years. Plateau Mt. Meteorol. Res. 2021, 41, 2–6. (In Chinese) [Google Scholar]
  24. Zhao, W.L.; Luo, T.X.; Zhang, L. Relative impact of climate change and grazing on NDVI variations in typical alpine desert grasslands in Tibet. Acta Ecol. Sin. 2019, 39, 8494–8503. (In Chinese) [Google Scholar]
  25. Li, X.; Zhang, L.; Luo, T.X. Rainy season onset mainly drives the spatiotemporal variability of spring vegetation green-up across alpine dry ecosystems on the Tibetan Plateau. Sci. Rep. 2020, 10, 18797. [Google Scholar] [CrossRef] [PubMed]
  26. Yu, C.Q.; Zhang, Y.J.; Claus, H.; Zeng, R.; Zhang, X.Z.; Wang, J.S. Ecological and environmental issues faced by a developing Tibet. Environ. Sci. Technol. 2012, 46, 1979–1980. [Google Scholar] [CrossRef]
  27. Stow, D.; Daeschner, S.; Hope, A.; Douglas, D.; Petersen, A.; Myneni, R.; Zhou, L.; Oechel, W. Variability of the seasonally integrated normalized difference vegetation index across the north slope of Alaska in the 1990s. Int. J. Remote Sens. 2003, 24, 1111–1117. [Google Scholar] [CrossRef]
  28. Evans, J.; Geerken, R. Discrimination between climate and human-induced dryland degradation. J. Arid Environ. 2004, 57, 535–554. [Google Scholar] [CrossRef]
  29. Wessels, K.J.; Prince, S.D.; Malherbe, J.; Small, J.; Frost, P.E.; VanZyl, D. Can human-induced land degradation be distinguished from the effects of rainfall variability? A case study in South Africa. J. Arid Environ. 2007, 68, 271–297. [Google Scholar] [CrossRef]
  30. Li, A.; Wu, J.G.; Huang, J.H. Distinguishing between human-induced and climate-driven vegetation changes: A critical application of RESTREND in inner Mongolia. Landsc. Ecol. 2012, 27, 969–982. [Google Scholar] [CrossRef]
  31. Burrell, A.L.; Evans, J.P.; Liu, Y. The addition of temperature to the TSS-RESTREND methodology significantly improves the detection of dryland degradation. IEEE J. Sel. Top. Appl. Earth Obs. Remote Sens. 2019, 12, 2342–2348. [Google Scholar] [CrossRef]
  32. Cai, H.Y.; Yang, X.H.; Xu, X.L. Human-induced grassland degradation/restoration in the central Tibetan Plateau: The effects of ecological protection and restoration projects. Ecol. Eng. 2015, 83, 112–119. [Google Scholar] [CrossRef]
  33. Zhang, R.P.; Liang, T.G.; Guo, J.; Xie, H.J.; Feng, Q.S.; Aimaiti, Y. Grassland dynamics in response to climate change and human activities in Xinjiang from 2000 to 2014. Sci. Rep. 2018, 8, 2888. [Google Scholar] [CrossRef]
  34. Li, P.L.; Hu, Z.M.; Liu, Y.W. Shift in the trend of browning in Southwestern Tibetan Plateau in the past two decades. Agric. For. Meteorol. 2020, 287, 1–9. [Google Scholar] [CrossRef]
  35. He, K.D.; Sun, J.; Chen, Q.J. Response of climate and soil texture to net primary productivity and precipitation-use efficiency in the Tibetan Plateau. Pratacultural Sci. 2019, 36, 1053–1065. (In Chinese) [Google Scholar]
  36. Yan, L.; Zhou, G.S.; Zhang, F. Effects of different grazing intensities on grassland production in China: A meta-analysis. PLoS ONE 2013, 8, e81466. [Google Scholar] [CrossRef] [PubMed]
  37. Li, G.; Sun, W.L.; Zhang, H.; Gao, C.Y. Balance between actual number of livestock and livestock carrying capacity of grassland after added forage of straw based on remote sensing in Tibetan Plateau. Trans. Chin. Soc. Agric. Eng. 2014, 30, 200–211. (In Chinese) [Google Scholar]
  38. Zhao, J.G.; Liu, C.Q.; Li, H.B.; Luo, N.; Meng, S.J.; Zhang, Z.H.; Wang, J.H. Effects of main climatic factors on plant community characteristics of a meadow steppe under different grazing intensities. J. Landsc. Res. 2019, 11, 108–110. [Google Scholar]
  39. Wang, Y.J.; Fu, B.J.; Liu, Y.X.; Li, Y.; Feng, X.M.; Wang, S. Response of vegetation to drought in the Tibetan Plateau: Elevation differentiation and the dominant factors. Agricult. Forest Meteorol. 2021, 306, 108468. [Google Scholar] [CrossRef]
  40. Ding, J.Z.; Yang, T.; Zhao, Y.T.; Liu, D.; Wang, X.Y.; Yao, Y.T.; Peng, S.S.; Wang, T.; Piao, S.L. Increasingly important role of atmospheric aridity on Tibetan alpine grasslands. Geophys. Res. Lett. 2018, 45, 2852–2859. [Google Scholar] [CrossRef]
  41. Liu, R.; Li, Y.; Liu, Y. Responses of CO2 flux in a saline desert of Northwest China to two contrasting extreme precipitation years. Chin. J. Ecol. 2013, 32, 2545–2551. (In Chinese) [Google Scholar]
  42. Liu, D.; Wang, T.; Yang, T.; Yan, Z.J.; Liu, Y.W.; Zhao, Y.T.; Piao, S.L. Deciphering impacts of climate extremes on Tibetan grasslands in the last fifteen years. Sci. Bull. 2019, 64, 446–454. [Google Scholar] [CrossRef] [Green Version]
Figure 1. The location and vegetation types of the study area. The map was created using ESRI ArcMap 10.7 software; the topographic base of the map was created with National Catalogue Service For Geographic Information data (https://www.webmap.cn, figure number: GS(2016)2556); the vegetation map source from the CASEarth Data Sharing and Service Portal (http://data.casearth.cn, accessed on 19 December 2018).
Diversity 14 00171 g001
Figure 2. (a) Interannual variations in MODIS NDVI and SPOT NDVI and (b) their relationships.
Diversity 14 00171 g002
Figure 3. Interannual variations in (a) GST, (b) GSP, and (c) LN.
Diversity 14 00171 g003
Figure 4. The relationships between NDVI and (a) GST, (b) GSP, and (c) LN.
Diversity 14 00171 g004
Figure 5. Spatial distribution of the partial correlation coefficients between NDVI and (a) GSP, and (b) GST. Different colors indicate the classes of partial correlation coefficients. Different symbols denote significant levels: * p < 0.05; # 0.05 < p < 0.10; ns, not significant. The map was created using ESRI ArcMap 10.7 software; the topographic base of the map was created with National Catalogue Service For Geographic Information data (https://www.webmap.cn, figure number: GS(2016)2556).
Diversity 14 00171 g005
Figure 6. Main drivers of NDVI change in the seven counties of the study area. Different symbols indicate the different significant levels (* p < 0.05; # 0.05 < p < 0.10) according to the partial correlation coefficients. The map was created using ESRI ArcMap 10.7 software; the topographic base of the map was created with National Catalogue Service For Geographic Information data (https://www.webmap.cn, figure number: GS(2016)2556).
Diversity 14 00171 g006
Figure 7. Relative effects of climate change and human activities on NDVI changes in the Mt. Qomolangma Nature Reserve and adjacent regions during 2000–2018. HI denotes human-activity- induced NDVI increase; HPI denotes both climate-change and human-activity-induced NDVI increase; PI denotes climate-change-induced NDVI increase; HD denotes NDVI decrease induced by human activities; HPD denotes NDVI decrease induced by both climate change and human activities; and PD denotes NDVI decrease induced by climate change. The map was created using ESRI ArcMap 10.7 software; the topographic base of the map was created with National Catalogue Service For Geographic Information data (https://www.webmap.cn, figure number: GS(2016)2556).
Diversity 14 00171 g007
Figure 8. (a) Comparisons of the grazing intensity and population density between 7 counties and (b) their relationships during 2000–2018. Different lower-case and upper-case letters indicate significant differences in grazing intensity and population density between counties, respectively, by using the Tukey’s HSD tests at α = 0.05.
Diversity 14 00171 g008
Figure 9. Relationship between NDVI and grazing intensity in Dinggye County.
Diversity 14 00171 g009
Table 1. Evaluation methods of climate change and human activities on grassland dynamics under six possible scenarios.
ScenarioSlopeNDVIASlopeNDVIPSlopeNDVIHDescription
1+Human activity contributes to grassland NDVIA increase
2++Both climate change and human activity contribute to NDVIA increase
3+++Climate change contributes to grassland NDVIA increase
4++Human activity contributes to grassland NDVIA decrease
5+Both climate change and human activity contribute to NDVIA decrease
6Climate change contributes to grassland NDVIA decrease
Publisher’s Note: MDPI stays neutral with regard to jurisdictional claims in published maps and institutional affiliations.

