Article

Changes in the Abundance and Taxonomic Composition of Benthic Heterotrophic Protists from Atlantic Sublittoral to Deep-Sea Sediments

Biocenter, Institute of Zoology, Department of Biology, Faculty of Mathematics and Natural Sciences, University of Cologne, Zuelpicher Str. 47b, 50674 Cologne, Germany
*
Author to whom correspondence should be addressed.
Diversity 2022, 14(3), 164; https://doi.org/10.3390/d14030164
Submission received: 15 January 2022 / Revised: 22 February 2022 / Accepted: 23 February 2022 / Published: 25 February 2022
(This article belongs to the Special Issue Deep Atlantic Biodiversity)

Abstract

:
Protists are the most diverse eukaryotes on our planet and metabarcoding has revealed an enormous diversity even from deep-sea environments. A range of different species has also been isolated from the deep sea and some have proven able to survive and even grow under deep-sea conditions. However, little is known about how the community structure of benthic protists changes from sublittoral down to abyssal depths. This is especially important regarding island and seamount communities which are surrounded by deep-sea areas potentially isolating them. Using a combination of live-counting and cultivation techniques, we investigated the abundance and taxonomic composition of benthic protist communities in sediments from sublittoral to abyssal depths around three islands and two seamounts of the Azores’ archipelago in the North Atlantic. Protist abundance decreased significantly and community composition changed with increasing depth. While some species were found at all depths, others were only detected in sublittoral or lower bathyal depths, indicating that some benthic taxa are limited in their distribution to a certain depth, whereas others are also present at the deep-sea floor. The proportion of unidentified specimens increased with depths pointing towards a high number of so far undetected species in the deep-sea realm.

Graphical Abstract

1. Introduction

Protists are the most diverse and dominant eukaryotes on our planet [1,2,3]. Due to their broad functional diversity and their role as nutrient remineralizers, heterotrophic protists are known to represent a crucial component of the global carbon cycle and play an important role for ecosystem functioning [4,5]. As primary consumers of bacteria, heterotrophic protists remineralize carbon and form a link to higher trophic levels in marine ecosystems. While these processes are well studied for marine surface waters [6,7,8], they are neither well studied nor understood for the deep-sea floor [9].
The deep sea is a challenging environment for living. Organisms have to cope with high hydrostatic pressures and low temperatures. The absence of light inhibits photosynthesis, which leads to a major dependence on organic matter fluxes from surface waters. Nevertheless, it has been shown that protists are able to cope with these challenging conditions [9]. The barotolerant and barophilic behavior of heterotrophic nanoflagellates and ciliates was recorded, indicating their ability to survive deep-sea conditions and pointing to the possibility of a genetic adaptation of some species to high pressures [10,11,12]. The vast diversity of protistan genotypes at the deep-sea floor was revealed in more recent years by metabarcoding studies [13,14,15,16]. While these high-throughput-sequencing techniques can generate massive amounts of data and enable the investigation of the diversity and distribution of protists [17], they lack morphological data, as well as firm data on the abundance and biomass of organisms, which are necessary to understand the structure and functioning of microbial foodwebs and their trophodynamics. Live-counting techniques offer the opportunity to determine morphotype and size of organisms and to gain information on the behavior and quantitative estimates of taxa [18,19]. Besides, cultivation-based approaches allow for detailed investigations on the morphology, the autecology, and the phylogeny of single species and can be used to estimate the diversity and abundance of cultivable taxa [18,19].
Abundance estimations of heterotrophic flagellates in deep-sea sediments have revealed densities of 100 up to 105 cells cm−3 [20,21,22,23,24], but relatively little is known about the distribution of benthic protists in sediments from different depths. How the abundance and the community composition of nano- and microfauna changes with increasing depth is of special importance for investigating the influence of surrounding deep-sea areas on island or seamount populations. Are benthic protist communities “trapped” on shallow seamounts and island shelfs? Or can they be dispersed via the deep-sea floor to adjacent islands, seamounts, or continental shelfs? Islands and seamounts could also serve as so-called stepping stones/staging posts, enabling constant gene flow over large distances. One of the few studies on seamount protist communities studying the Great Meteor Seamount in the North Atlantic Ocean showed a distinct community of Kinetoplastea on the seamount compared to the surrounding deep-sea basins [25].
In this study, we investigated the composition and distribution of benthic nano- and microfauna communities in sediments of different depth around three islands and two seamounts of the Azores archipelago. Due to their location in the middle of the North Atlantic Ocean close to the Mid-Atlantic Ridge (MAR), far off from the mainland or other island groups, and their variable topography surrounding seafloor with shelf, slope, and deep-sea areas, the Azores islands are well suited to analyze the biogeographic distribution patterns of protists. Using a combination of live-counting and cultivation techniques, we investigated the abundance, biovolume, and taxonomic composition of the benthic protistan communities in depths from 50 down to 3000 m.

2. Materials and Methods

2.1. Study Area and Sampling

Samples were taken during cruise M150 with the R/V Meteor (27 August–3 October 2018, [26]) to the Azores archipelago. Sediment was sampled around three islands (Flores, Terceira, Santa Maria) and two seamounts (Princess Alice bank, Formigas Bank) along multiple depth transects per island/seamount from the sublittoral (50 m, 150 m), bathyal (300 m, 500 m, 1000 m, 2000 m), and abyssal depths (up to 3000 m, Figure 1, Table S1). Depending on the sampled depth, three different sampling gears were used. For sampling at the 50 m, 150 m and 300 m depths, the Shipek grab (two replicate samples at each station) was used, while samples from 500 m and 1000 m were taken with the Boxcorer (two replicates were sampled from distant locations within the Boxcorer), and those from the deepest stations with the Multicorer (replicates from two different cores; Figure 1B–D). Only samples with undisturbed sediment surfaces were used for the analyses. The uppermost centimeter of the sediment was sampled using a heat-sterilized sampling spoon and was used for live-counting and the cultivation approach.

2.2. Live-Counting

Sediment samples of two to three cubic centimeters were suspended in five to ten milliliters of autoclaved seawater at ambient temperatures and used for live observations immediately after sampling. Deep-sea samples from >1000 m depth were stored on ice until they were analyzed to minimize temperature changes. Subsamples of sediment suspensions (5–10 µL) were observed and morphotypes were identified and counted using light microscopy (Axioskop, 20×, 40×, 63× objective with phase contrast, ZEISS, Oberkochen, Germany). Taxonomic levels of groups were classified using the taxonomy of [1]. Afterwards, sediment suspensions were left to settle and volumes of sediment and water in each sample were measured. The percentages of sediment and water were determined to calculate the abundance of organisms per cm3 of sediment. Abundances of organisms per station were calculated using the mean of replicates (explained in 2.1.). Only living cells were counted, which were recognized by movement or in the case of rigid organisms (e.g., Foraminifera) by the movement of the cell plasma. Cell length, cell width, and cell height of all cells were measured during the observations. Biovolumes were calculated using the volume of an ellipsoid with the radii a, b, and c:
V = 4/3 ∗ π ∗ a ∗ b ∗ c

2.3. Cultivation Approach

As a complement to live-counting, the cultivation approach was intended to allow the observation and determination of protists at a much higher magnification, as well as to register protists which were present at low concentrations in live-counts or which were difficult to spot (e.g., amoebae). Subsamples of one cubic centimeter of the sediment (sampling described in 2.1.) were cultivated in 50 mL tissue-culture flasks (VWR, Erlangen, Germany) filled with ~30 mL of autoclaved seawater [18]. All cultures were supplied with a sterilized wheat grain as a carbon source for the autochthonous bacteria which served as a food source for protists. Cultures were stored at room temperature and were observed after 5–7 days on board under an inverted light microscope (Axiovert A.1 and Axiovert 25, 20× to 63× objective with phase contrast, ZEISS, Oberkochen, Germany) and an upright microscope (Axioskop, 40×, 63×, 100× objective with phase contrast and water immersion, ZEISS, Oberkochen, Germany) and the morphotypes of the living cells were determined. For analyses, we used the presence and absence of morphotypes in cultures from different sampled depths.

2.4. Statistical Data Analyses

Statistical analyses were carried out using the software R (v. 4.0.5; [28]). To test for significant differences between the abundances in sediments from different depths, a non-parametric Kruskal–Wallis test was used, as abundance data did not follow a normal distribution. A Dunn’s test of multiple comparisons was used as a post hoc procedure to test which specific means were significantly different. For comparisons of the diversity of the communities, the Bray–Curtis dissimilarity index was calculated using the R package Vegan [29]. The Bray–Curtis index was used for hierarchical cluster analysis (hclust command) using the unweighted pair group method with arithmetic mean (UPGMA). The stability of cluster analysis was evaluated using the pvclust command which calculates approximately unbiased (AU) p-values and bootstrap probability values (BP) [30] with 9999 resampling runs. Plots were created using the R package ggplot2 [31].

3. Results

3.1. Abundance and Biovolume of Nano-, Microfauna and Microphytobenthos

In total, 202 different taxa were identified during live-counting of sediment suspensions comprising nanofauna (2–20 µm cell length), microfauna (20–200 µm cell length), microphytobenthos (here, only pennate diatoms with cell lengths of 10–110 µm), and meiofauna (metazoans potentially retained on a sieve of 44 µm in mesh size; here, 80–350 µm body length). The abundance of nanofaunal organisms was highest in sediments from 50 m depth and decreased in general with increasing sediment depth (Table 1). The abundance of microfauna ranged from 126 cells cm−3 in sediments from 50 m depth to 23 cells cm−3 in 1000 m and could not be detected due to low abundances in depths over 1000 m. Living (moving) microphytobenthal organisms were found in sediments from 50 to 300 m depth with a mean abundance ranging from 915 to 15 cells cm−3, respectively (Table 1). As the sample volume used was not suitable for a representative analysis of the abundance of meiofaunal organisms, they were not included in further analyses, but more information on the benthic meiofauna analyzed during the cruise can be found in [26].
The microfauna had the highest biovolume at 50 m sediment depth, which decreased towards the deep sea. Nanofaunal organisms had the highest biovolume in sediments from 50 m depth and stayed relatively constant below 300 m depth. Live microphytobenthos (only pennate diatoms) were found down to 300 m depth, with much higher biovolumes at 50 m depth. Microphytobenthos abundances were detected for information on autochthonous production at different depths. As this study focuses on heterotrophic protists, it was not included in further analyses.

3.2. Total Abundance of Heterotrophic Protists

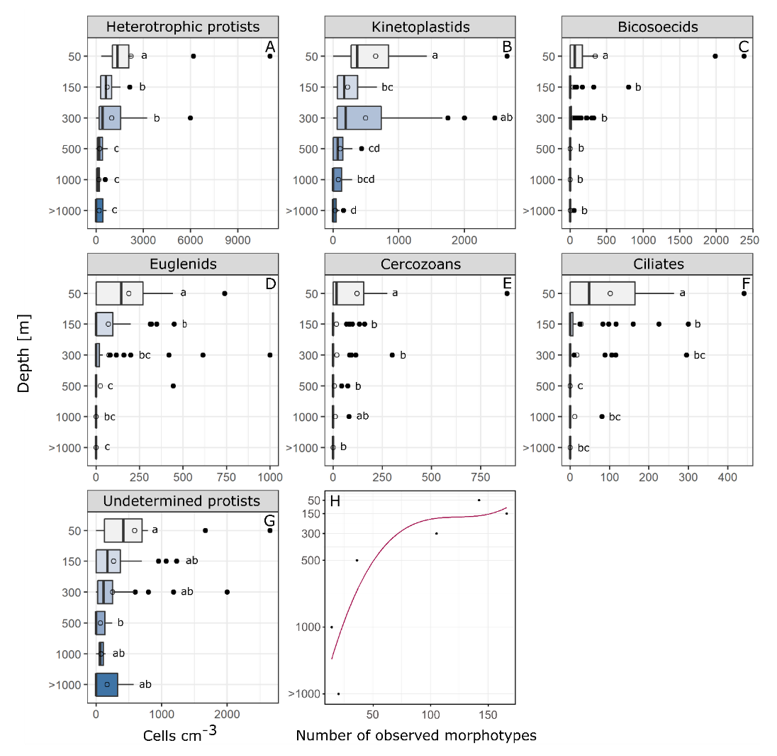
The abundance of heterotrophic protists was highest in samples from 50 m depth with a mean of 2217 cells cm−3, which was found to be significantly higher than the abundance in sediments from all other depths (Figure 2A). At 150 and 300 m depth, the abundance of heterotrophic protists decreased to about 703 and 998 cells cm−3, respectively. At 500 to 3000 m depth, the abundance was significantly lower than in sublittoral and lower bathyal sediments, with approximately 246 cells cm−3 in 500 m to 179 cells cm−3 in 1000 m (Figure 2A).
Free-living kinetoplastids were the taxonomic group with the highest total abundance, ranging from 647 cells cm−3 at 50 m to 32 cells cm−3 below 1000 m depth (Figure 2B). Bicosoecids were especially abundant in the sublittoral (50 m and 150 m) and shallow bathyal depths (300 m) with an average abundance between 341 and 45 cells cm−3 (Figure 2C). Below 1000 m, bicosoecids were found with a mean abundance of 5 cells cm−3, while they were not detected at the 500 and 1000 m depths during live-counting. Euglenids were found down to 500 m depth with mean abundances of 189 cells cm−3 at 50 m depth and 25 cells cm−3 at 500 m depth (Figure 2D). Cercozoans and ciliates were both detected at depths up to 1000 m. Cercozoans had an average abundance of 121 cells cm−3 at 50 m depth and 12 cells cm−3 at 1000 m depth (Figure 2E). Ciliates showed mean abundances of 102 cells cm−3 at 50 and 12 cells cm−3 at 1000 m depth, but could not be detected at 500 m depth (Figure 2F). Undetermined protists decreased from littoral sediments to the depth of 1000 m, but reached high abundances again below this depth (Figure 2G). The total number of observed morphotypes detected during live-counting significantly correlated with increasing depth (p < 0.05; Figure 2H).

3.3. Relative Contribution of Taxonomic Groups to Total Heterotrophic Protist Abundance and Biovolume

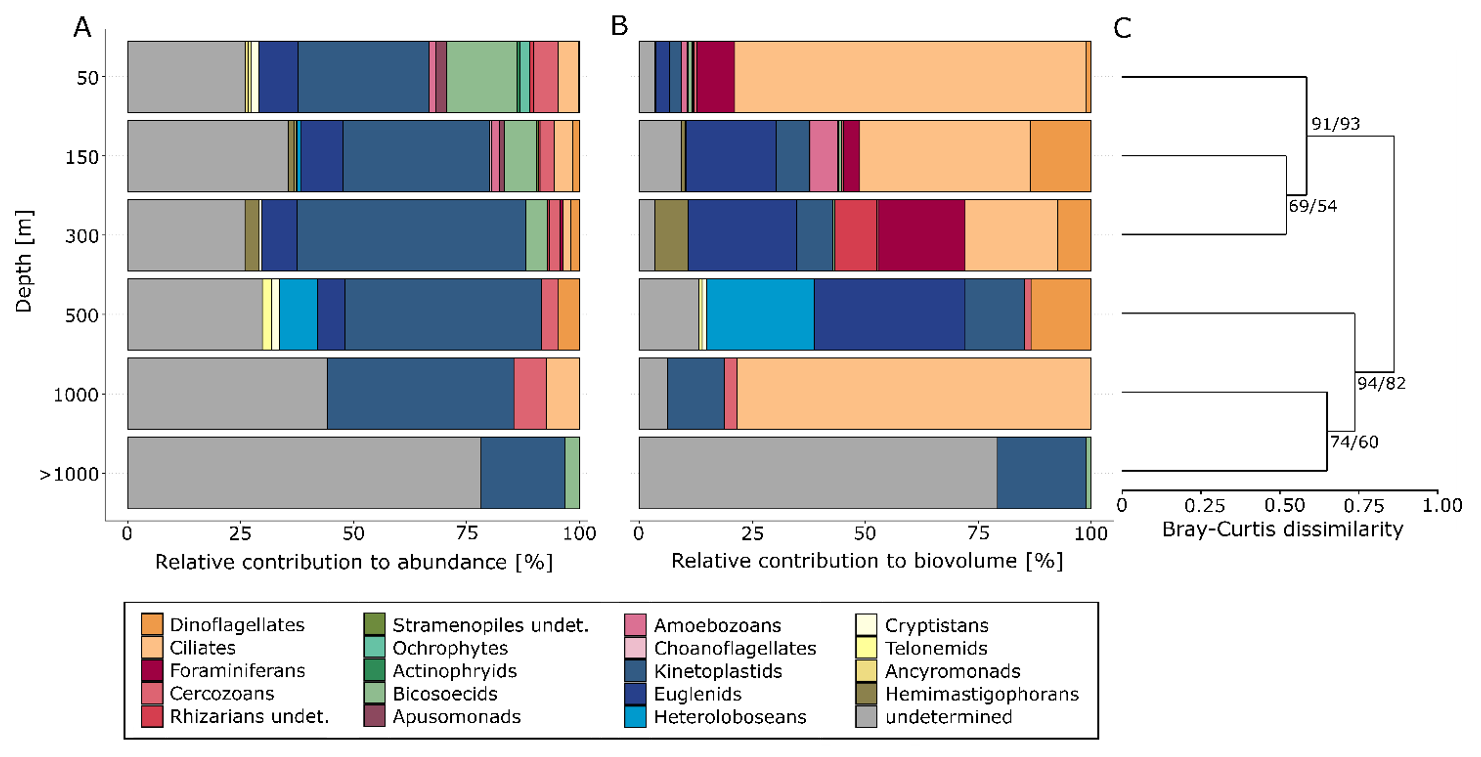
Concerning the relative contribution to total heterotrophic protist abundance, kinetoplastids were the taxonomic group with the largest proportion among heterotrophic protists at all depths with a range of 19 (>1000 m) to 51% (300 m) (Figure 3A). In the sublittoral and shallow bathyal (300 m) sediments, kinetoplastids were followed by bicosoecids and euglenids with relative proportions of up to 16 and 9% of the community, respectively. At 500 m depth, heteroloboseans contributed 9% to the abundance and euglenids with 6.5%. At 1000 m, cercozoans and ciliates had a relative contribution of 7% to the total protist abundance. Organisms which could not be identified during live-counting accounted for one quarter to one third of the relative abundance at depths between 50 and 1000 m. At a depth below 1000 m, those undetermined species made up 78%. Especially in sediments from 50 to 150 m depth, a high number of other groups were present such as dinoflagellates, foraminiferans, other undetermined rhizarians, undetermined stramenopiles, ochrophytes, actinophryids, apusomonadids, amoebozoans, choanoflagellates, cryptomonads, telonemids, ancyromonadids, hemimastigophorans, and groups of incertae sedis.
Concerning the biovolume of total heterotrophic protists at the depth of 50 m, ciliates contributed by far the most with 78%, followed by foraminiferans (8%), euglenids (3%), and kinetoplastids (2.5%, Figure 3B). At 150 to 500 m in depth, the contribution of euglenids to the biovolume increased up to 33%, while the proportion of ciliates decreased to 21% in 300 m. Dinoflagellates contributed 14% to the biovolume at 150 m in depth, followed by kinetoplastids and amoebozoans (7% and 6%, respectively). At 300 m depth, foraminiferans contributed 19% to the biovolume, followed by undetermined rhizarians (9%), kinetoplastids (8%), dinoflagellates (7%), and also hemimastigophorans (7%). At 500 m depth, heteroloboseans contributed 24% to the biovolume. At 500 m depths and below, the abundances were low and estimated biovolumes of the different taxa varied. While undetermined taxa made up only a small proportion (3–13%) of the biovolume in depths from 50 to 1000 m depth, they made up the largest proportion below 1000 m, with 79% of the biovolume.
Cluster analysis based on the Bray–Curtis dissimilarity of the heterotrophic protist communities (upper 1 cm-layer of sediment) revealed two large separated clusters with high bootstrap probability support (Figure 3C). Samples from the sublittoral and shallow bathyal depths (50 to 300 m) and those from deeper bathyal and abyssal depths (500 m and below) clustered together. Within the first cluster from shallower depths, the protist communities from 150 and 300 m formed a separate cluster with a Bray–Curtis dissimilarity of about 0.5, while protist communities from 50 m depths clustered separately, with Bray–Curtis distances of 0.54 and 0.63 to 150 and 300 m communities, respectively. In the cluster of higher depths, communities from 1000 m and below had a lower dissimilarity index (0.65) to each other than to the protist communities from 500 m in depth (0.74 and 0.73), which clustered separately.

3.4. Cultivable Protists

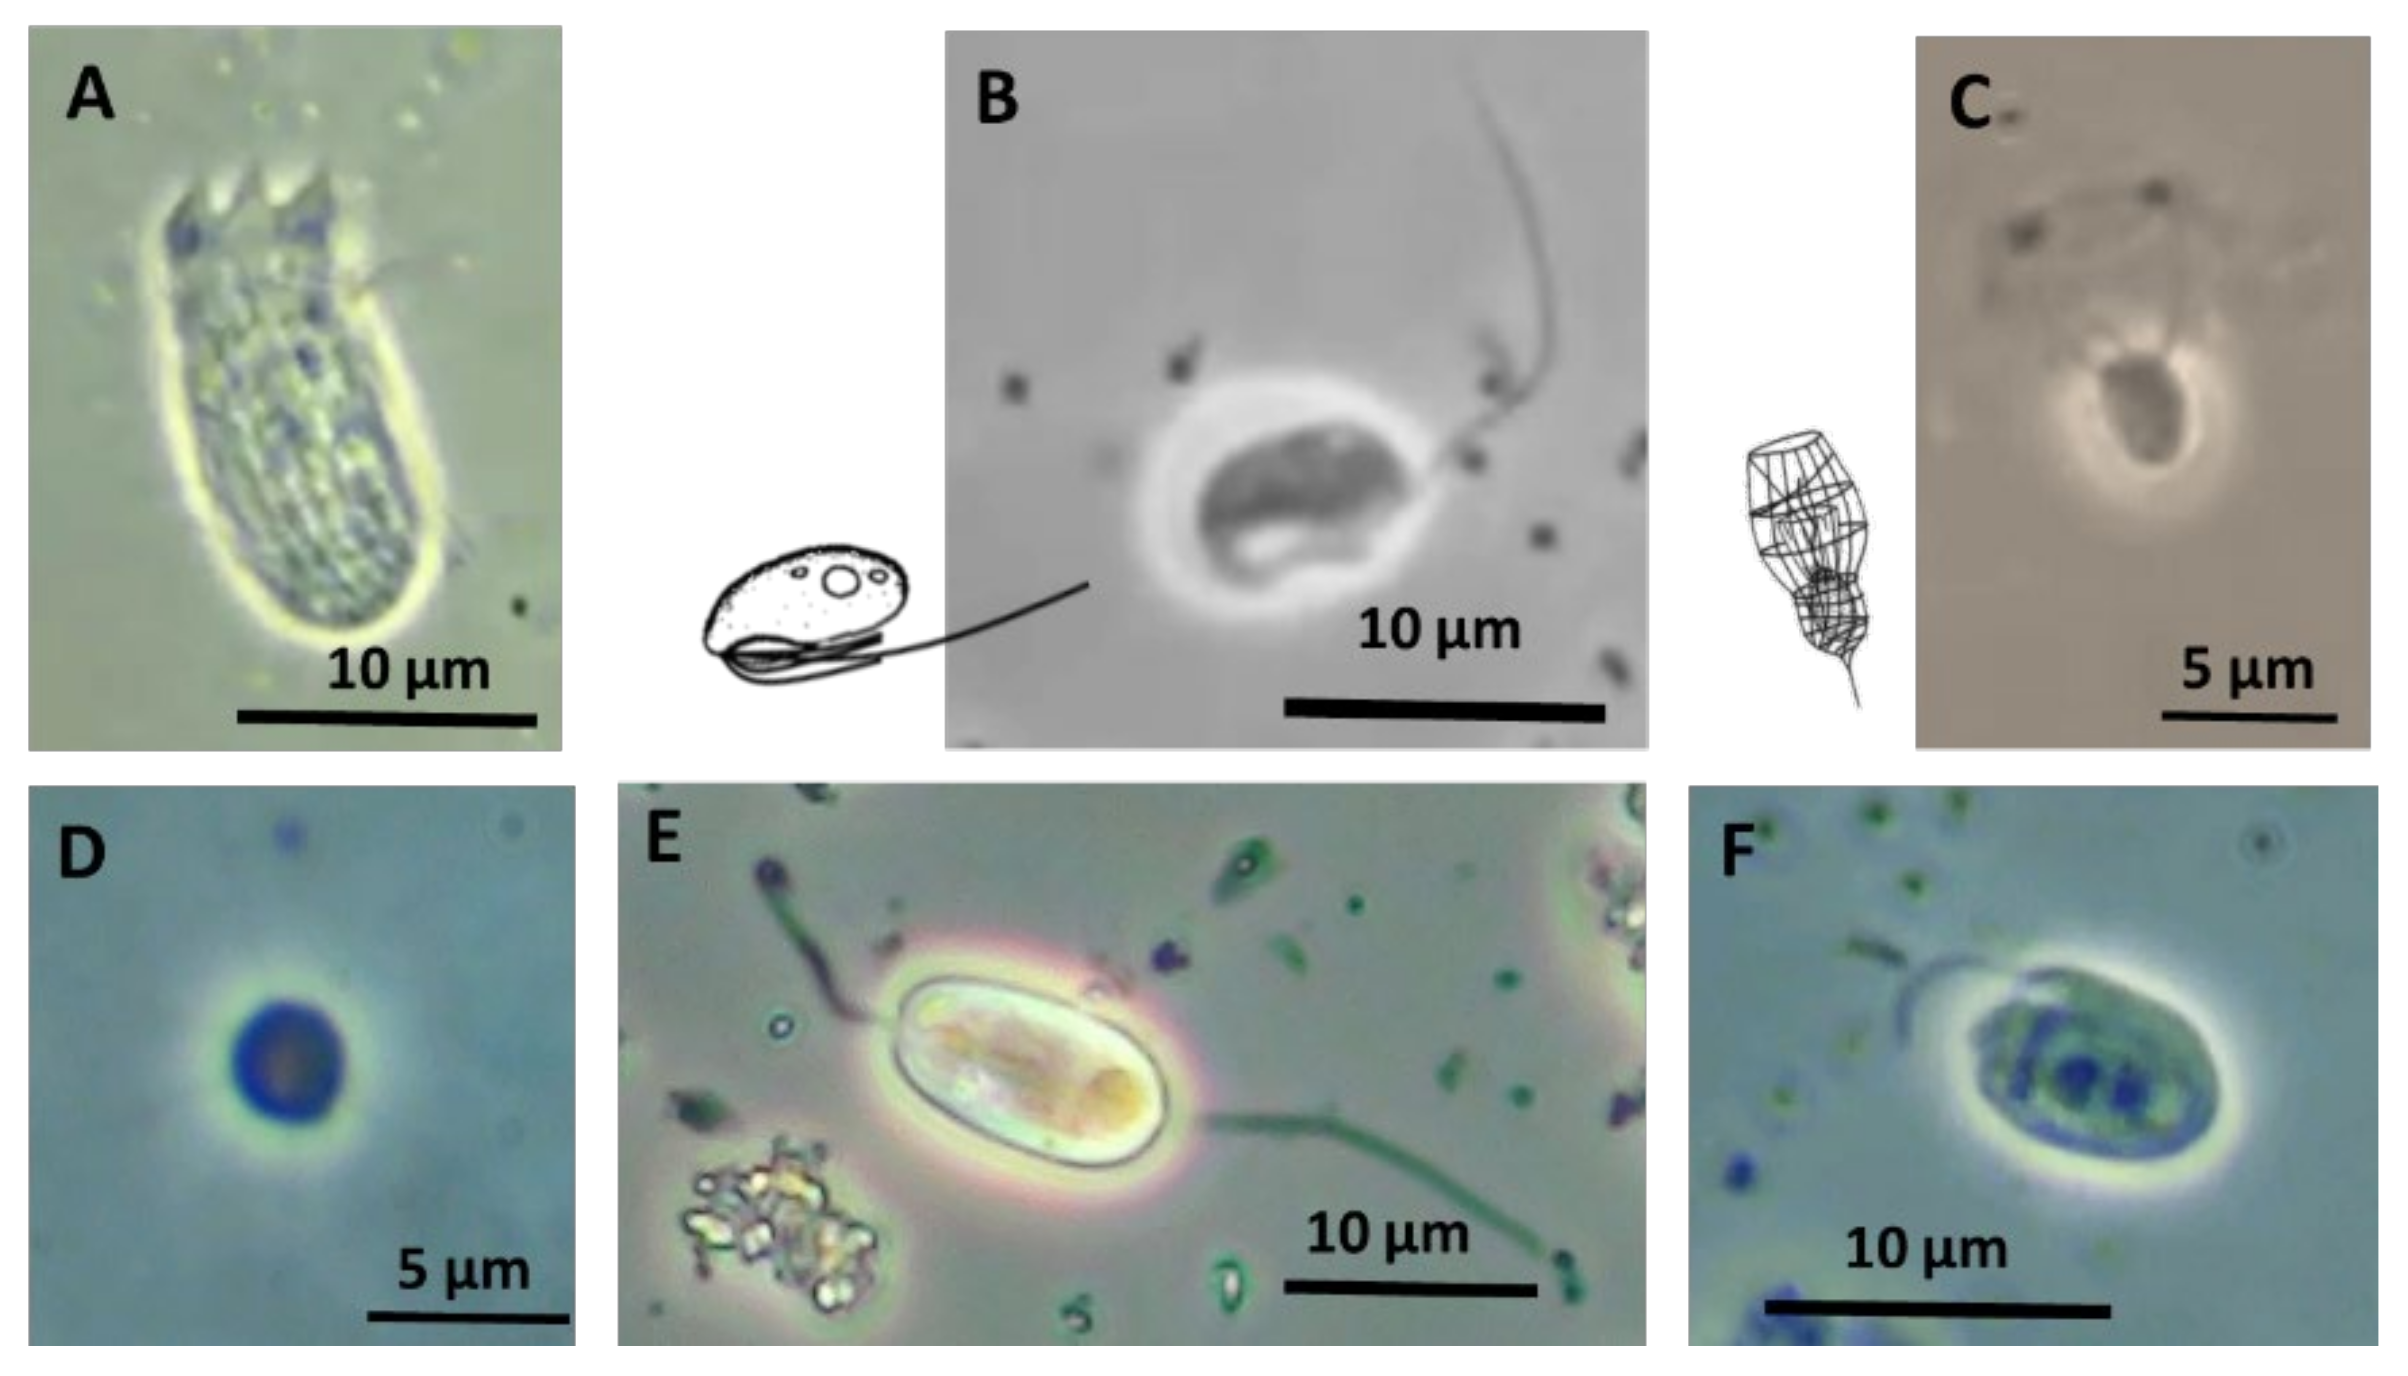
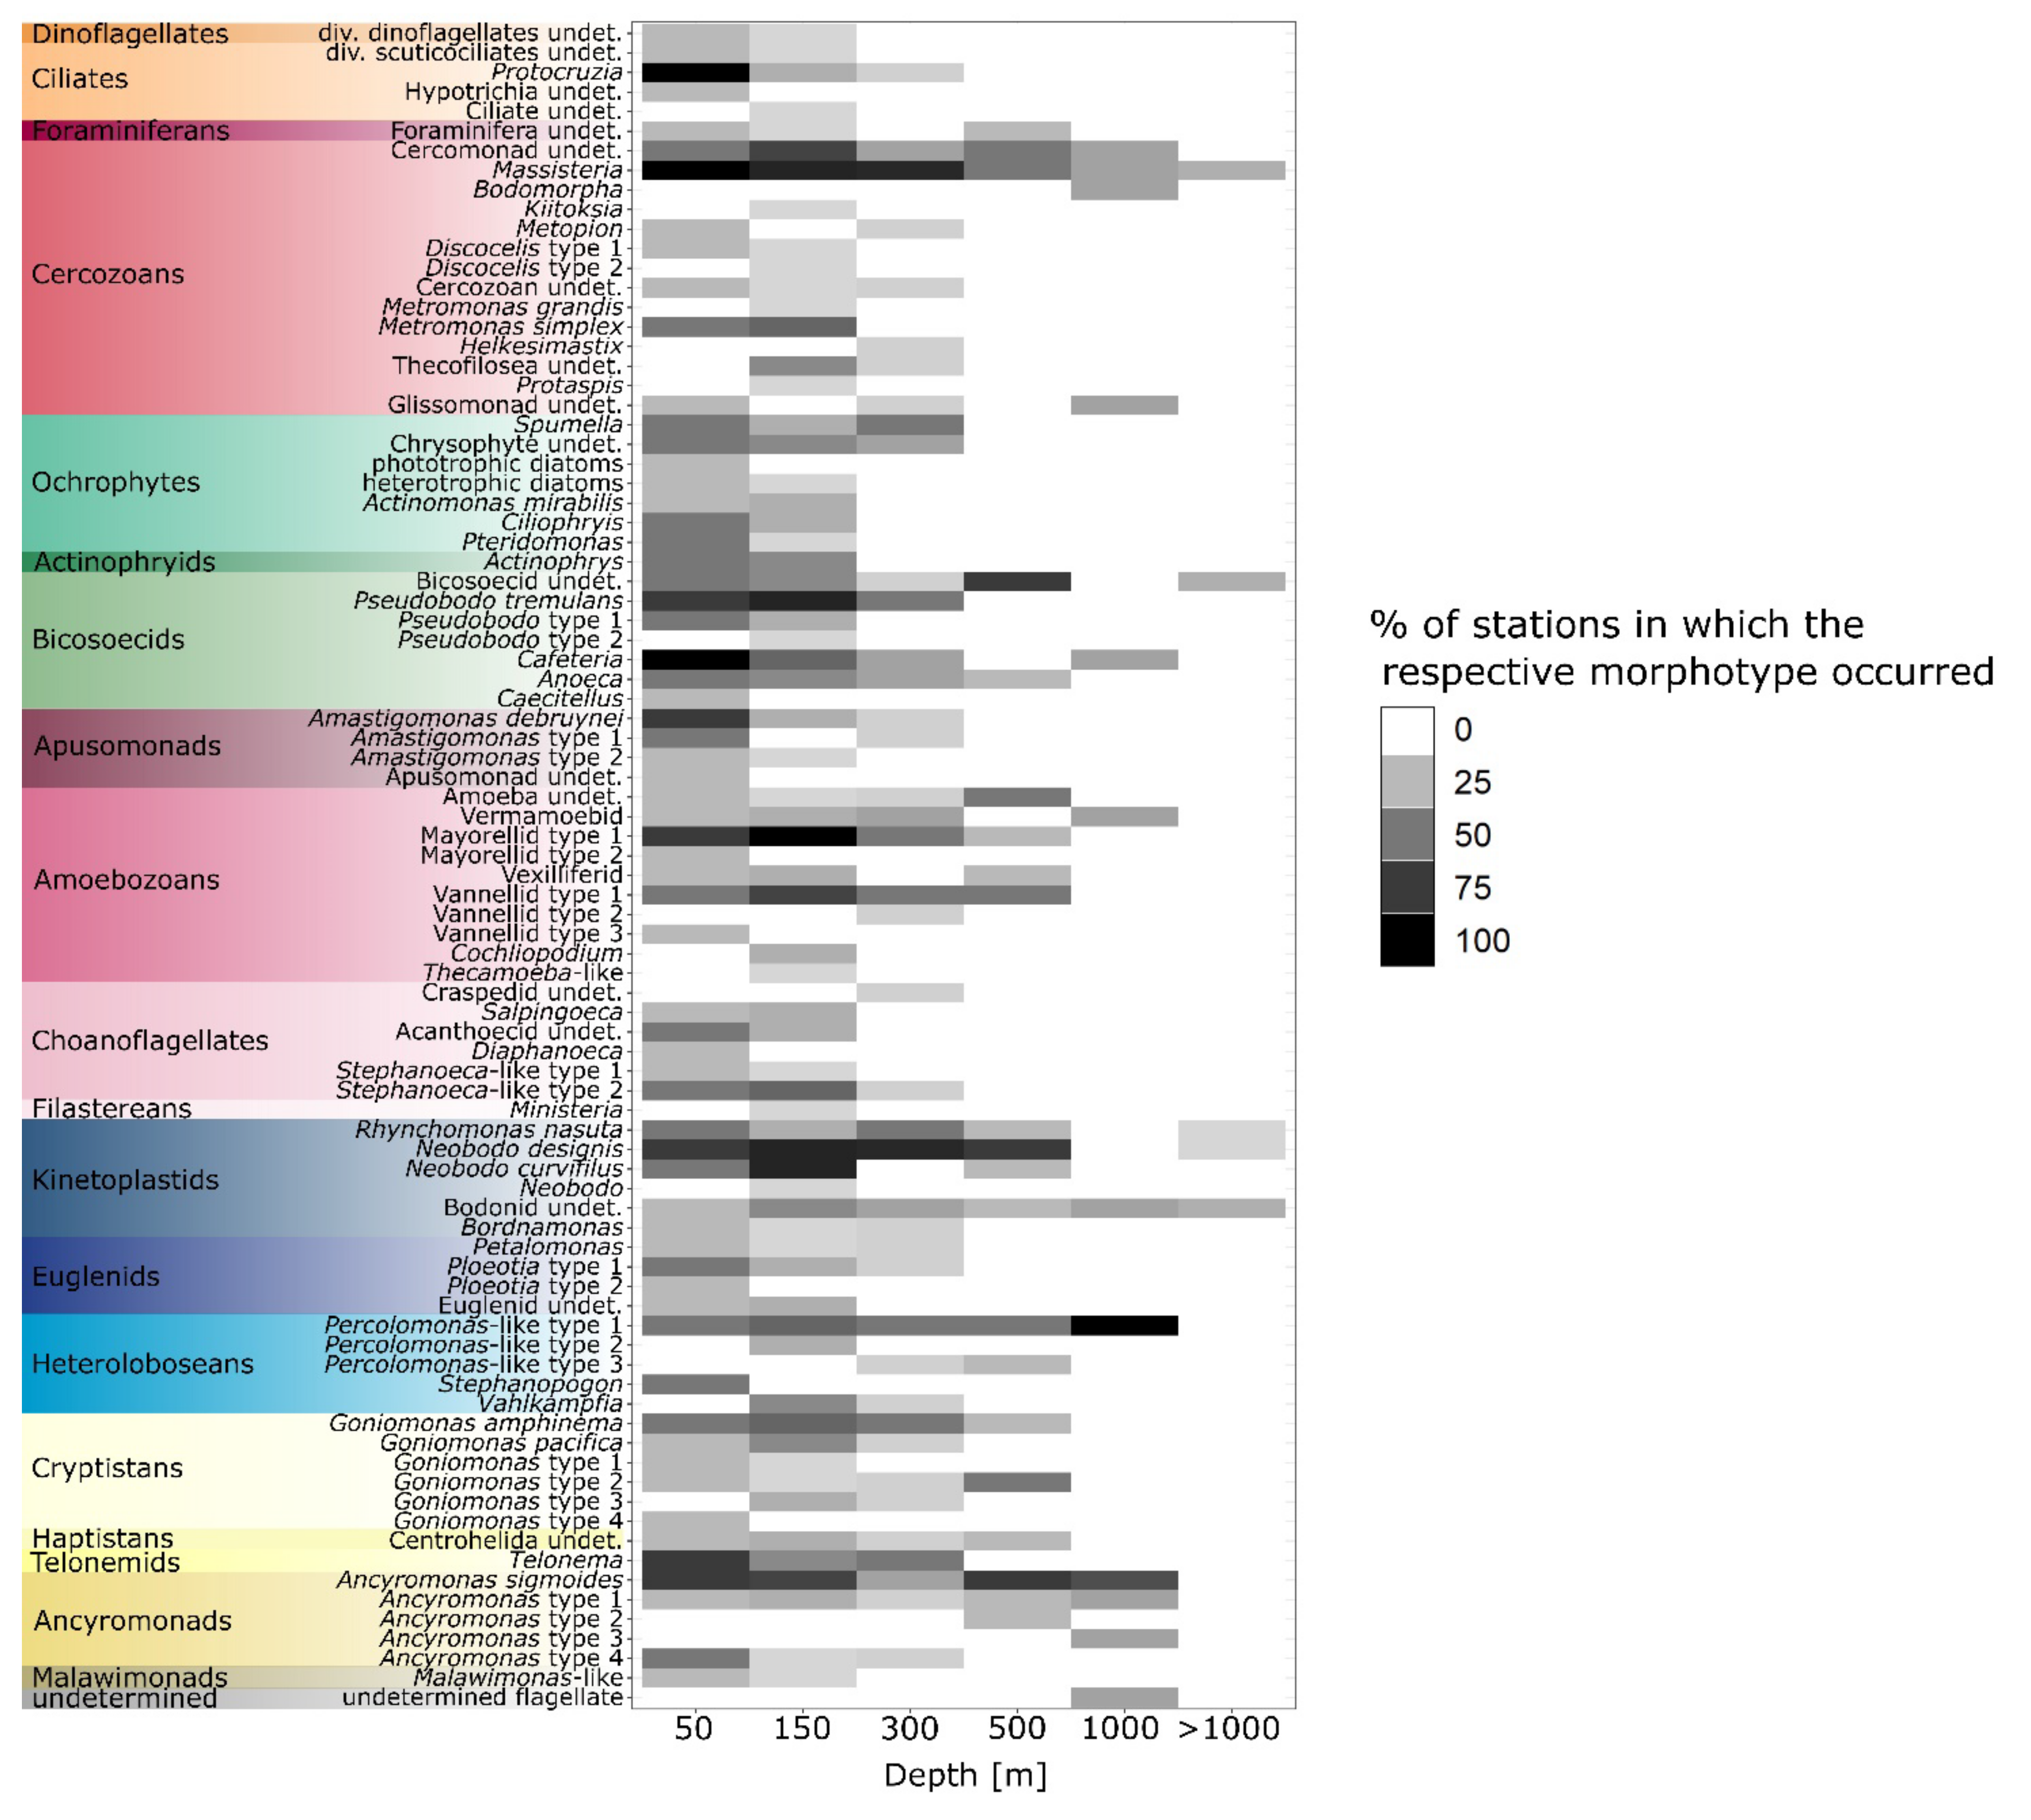
Heterotrophic protists were detected in cultures from all depths, at 50 down to 3000 m. The cultivation approach revealed cultivable protists from all major taxonomic groups (see Figure 4 for examples), which were also detected during live-counting. A high number of different morphotypes were found from cercozoans, amoebozoans, ochrophytes, cryptists, bicosoecids, and choanoflagellates (Figure 5).
The highest richness of morphotypes was found in cultures from 150 m in depth, with a high frequency of cercozoans (e.g., especially different Massisteria morphotypes), bicosoecids (mainly Pseudobodo and Cafeteria morphotypes), amoebozoans (especially mayorellid and vannellid morphotypes), choanoflagellates (Stephanoeca-like morphotypes), kinetoplastids (Neobodo morphotypes), and ancyromonads. At 500 m, the diversity of morphotypes appearing in cultures decreased, but there were still several representatives of many phylogenetic groups present: amoebozoans, kinetoplastids, cercozoans, bicosoecids, heteroloboseans, cryptists, and ancyromonads. In depths below 1000 m, only Massisteria-, Rhynchomonas-, and Neobodo-like morphotypes, and a bicosoecid could be detected.

4. Discussion

Our data on benthic protist communities from the North Atlantic Ocean around the Azores islands, obtained by direct microscopic observations during live-counting and using cultivation-based approaches, showed significant differences of benthic protist communities along vertical depth gradients from the littoral to abyssal depths. This is in accordance with the few other studies available on the diversity and distribution of benthic protist communities along vertical depth gradients in the Pacific Ocean [32], the Mediterranean Sea [20,23], and the Arabian Sea [21] which also reported a decreasing abundance of benthic protists with increasing depth. Though the different transects we investigated were fifty to several hundred kilometers apart from each other (Figure 1), we pooled samples from the same depth. However, future molecular analyses have yet to reveal whether there is a specific island biogeography, which cannot be derived from morphological studies of protists.
While it was previously shown that the abundance of large flagellates and amoeba did not change with water depth [32], our study indicated a decline of benthic protist abundances belonging to all size classes and all major taxonomic groups with increasing depth in the Azores archipelago. This indicates that a high number of species are potentially restricted to lower depths and might not be adapted to the conditions prevailing in the deep ocean. The presence of moving, pigmented microphytobenthal organisms to a depth of at least 150 m indicates that autochthonous production is present down to that depth, which might be a factor supporting directly or indirectly the growth of heterotrophic protists.
Cluster analysis revealed the formation of two main clusters separating samples from 50 to 300 m depth from samples taken at depths below, indicating significant differences between communities from sediments above and below 300 m in depth. A few representatives of the kinetoplastids, bicosoecids, cercozoans, and foraminiferans were present at all depths. While kinetoplastids are often overlooked in metabarcoding studies based on next-generation-sequencing due to primer issues [33], studies based on live observations [19,34] and recent molecular studies [13,25,35] revealed that they belong, together with Euglenida, to the most important bacterivorous groups in terms of abundance and biomass in marine sediments and dominate in benthic deep-sea communities. Representatives of the Neobodonida like Neobodo designis-like and Rhynchomonas nasuta-like flagellates were most often observed by both methods. A high proportion of individuals observed by live-counting in depths below 1000 m could not be assigned to any taxonomic group (Figure 2G, Figure 3B and Figure S2), indicating that a large number of thus far undiscovered species inhabit the deep-sea floor.
Cultivable protists belonging to all major taxonomic groups were detected in samples from all depths (Figure 5). However, some groups with low abundances revealed by our live-counting, dominated in the cultivation approach, like certain cercozoans and amoebozoans, indicating that these are rare taxa which were sampled in very low concentrations and therefore are only found using cultivation approaches. Amoebozoans are often overlooked in deep-sea studies [9], although lobose amoebae are frequently reported in depths below 1000 m and should be considered as typical components of deep-sea microbial communities [20]. Species belonging to the Vexilliferidae were also described from the deep sea [36] and were found in our study at depths down to 500 m. Our cultivation approach showed a clear decrease in diversity at depths below 300 m, with only a few morphotypes left at depths below 1000 m. This change in cultivable morphotypes points towards a shift in the community composition of protists with increasing depths which was also found in our live-counting. The discrepancy of protozoan records between the live-counting and the cultivation-based approaches could be explained by the properties of the different methods. While live-counting techniques offer the opportunity to determine morphotypes and estimate the abundance of protists, it is limited by the short available time frame directly after sampling [18]. Cultivation-based approaches are highly selective due to the cultivation conditions (temperature, hydrostatic pressure, potential food sources, etc.), but allow for a detailed morphological and molecular characterization of organisms and the detection of species only present in low numbers during sampling. On the other hand, the appearance of morphotypes in culture does not necessarily mean that these species are also active at the sampling site. They could also have hatched from cysts and could have benefitted from the conditions in culture. Thus, with cultivation techniques we obtain a potential number of morphotypes or taxa present in a sample, which we can compare to the number of morphotypes or taxa gained by live-counting. Both methods are not directly comparable, but can be used to complement each other. Thus, a combination of different methods is necessary to gain a detailed view of benthic protist communities [18].
The decline of benthic heterotrophic protists below 300 m depth seems not to be a result of increased hydrostatic pressure, which was found to become critical only at depths below 1000 m as was shown for bacteria [37], flagellated protists [10,38], and ciliates [39,40]. However, nutrient conditions severely deteriorate below 300 m in depth, as the presence of sedimented algae and benthic diatoms is significantly reduced at sublittoral sites as indicated by the absence of microphytobenthos below 300 m in depth (Table 1).
Some noteworthy findings of our live-countings relate to the records of several Stephanopogon-like heteroloboseans and representatives of hemimastigophorans from 150 to 300 m, and from 150 to 500 m in depth, respectively. Both groups have seldom been reported from marine field studies [19]. Another interesting observation was that some colorless pennate diatoms were found moving between sand grains in fresh samples from depths even down to 300 m in depth. This indicates their capacity for heterotrophic nutrition [41].
The sister clade to the Kinetoplastea are the Diplonemea, a group of heterotrophic protists, which are supposed to be key players in the ocean’s pelagial [42,43] and benthic deep-sea communities [13,14]. Nevertheless, we did not find any representatives of this group during live-counting or in the cultivation approach. This might support the idea that diplonemids are mainly parasites. On the other hand, there are only a few species of Diplonemea described yet [44], challenging the identification of this group by morphological investigations. Moreover, most of them are difficult to cultivate due to their potentially prevailing parasitic lifestyle [42,43,44], explaining why they did not appear in our cultivation approach.
In terms of biovolume, Ciliophora dominated the protist community in our study from 50 down to 1000 m (Figure 3B). In a previous study, ciliates were found to be enriched above seamounts [45], while in our study, their biovolume contribution was higher at islands than at the sampled seamounts (Figure S1 in Supplementary Materials). We did not find any ciliates in samples below 1000 m in depth, although molecular studies indicated the potential existence of a large variety of ciliates in the deep ocean, also at depths below 1000 m [11,39]. Still, there is only a small number of cultured ciliates from the deep sea as they appear prone to changing environmental conditions during sampling [39,40].
Dinoflagellates contributed a relatively high proportion to the protist biovolume at 150 to 500 m, with 7 to 14%, confirming previous studies which found that this group can account for up to 20% of the benthic biomass [19]. While apusomonads are known as typical components of benthic communities, which can also significantly contribute to the biomass [19], they were only found in low abundances in our study and were only detected at 50 m and 150 m depths. Similarly, other protists such as ancyromonads, amoebozoans, actinophryids, choanoflagellates, hemimastigophorans, heteroloboseans, and ochrophytes were only detected in samples from the sublittoral layer during live-counting, indicating their limited distribution in deep sediments.

5. Conclusions

Our results from live observations, abundance estimations, and the cultivation approach showed that the benthic protist community differed significantly along vertical depth gradients. The sublittoral (50 m), lower bathyal (150–300 m), and deeper layers (500–3000 m) were significantly different regarding the abundance of heterotrophic protists (Figure 2). Differences in the composition of communities at 50 to 300 m and at 500 to 3000 m in depth were revealed by cluster analysis, indicating differences between the communities in sediments of those depth layers. This change below 300 m in depth is further supported by the results of the cultivation approach, which showed that the number of different cultivable protists clearly decreased at depths below 300 m. While some taxonomic groups could be detected from all investigated depths (e.g., kinetoplastids), the other groups could only be cultivated from samples of the sublittoral zone, or only down to 1000 m in depth (e.g., Ciliophora and Cercozoa). Most species seem to be restricted in their distribution to the upper layers due to their inability to cope with the harsh conditions of the deep-sea biome. This indicates that only very few benthic species might be able to populate the deep-sea areas surrounding the islands/seamounts, which could enable them to disperse over large distances. On the other hand, some smaller species may populate marine snow particles and get dispersed via the pelagic realm. Therefore, it would be interesting to compare genotypes from several islands/seamounts to see whether the limited distribution of some groups is reflected in different genotypes occurring at different islands/seamounts. The community composition differed especially between sampling sites from shallower sediments and those from the deep sea, where large numbers of unidentified specimens occurred, showing the distinct characteristics of protist communities inhabiting the deep-sea floor, which remains to be further resolved in future studies.

Supplementary Materials

The following supporting information can be downloaded at: https://www.mdpi.com/article/10.3390/d14030164/s1, Figure S1: Relative contribution of taxonomic groups to the abundance and biovolume of protists on different islands/seamounts of the Azores; Figure S2: Relative contribution of taxonomic groups to the abundance of benthic protists detected during live-counting at each sampling station; Table S1: List of sampled stations.

Author Contributions

Conceptualization, M.H. and H.A.; methodology, M.H. and H.A.; software, M.H.; validation, M.H. and H.A.; formal analysis, M.H.; investigation, H.A. and M.H.; resources, H.A.; data curation, M.H.; writing—original draft preparation, M.H.; writing—review and editing, H.A.; visualization, M.H.; supervision, H.A.; project administration, H.A.; funding acquisition, H.A. All authors have read and agreed to the published version of the manuscript.

Funding

Funding for this research was awarded to H.A. by the German Research Foundation (DFG) (AR288/23, MerMet 17-11).

Data Availability Statement

The data is contained within the article and the Supplementary Materials.

Acknowledgments

We are very grateful to the technical crew of the R/V Meteor, especially to the captain of cruise M150, Detlef Korte. We would also like to thank the scientific crew of the cruise for their valuable help and support during the cruise, special thanks go to Kai George, who was chief scientist of cruise M150. We are very thankful to Achim Wehrmann for his advice and help with Shipek grab sampling. We are indebted to the engaged help in sampling and project realization of Karoline Hermanns and Claudia Meyer. We thank the German Research Foundation for funding this expedition.

Conflicts of Interest

The authors declare no conflict of interest. The funders had no role in the design of the study; in the collection, analyses, or interpretation of data; in the writing of the manuscript, or in the decision to publish the results.

References

  1. Adl, S.M.; Bass, D.; Lane, C.E.; Lukeš, J.; Schoch, C.L.; Smirnov, A.; Agatha, S.; Berney, C.; Brown, M.W.; Burki, F.; et al. Revisions to the Classification, Nomenclature, and Diversity of Eukaryotes. J. Eukaryot. Microbiol. 2019, 66, 4–119. [Google Scholar] [CrossRef] [PubMed] [Green Version]
  2. Burki, F.; Roger, A.J.; Brown, M.W.; Simpson, A.G.B. The New Tree of Eukaryotes. Trends Ecol. Evol. 2020, 35, 43–55. [Google Scholar] [CrossRef] [PubMed] [Green Version]
  3. De Vargas, C.; Audic, S.; Henry, N.; Decelle, J.; Mahé, F.; Logares, R.; Lara, E.; Berney, C.; Le Boscot, N.; Probert, I.; et al. Eukaryotic Plankton Diversity in the Sunlit Ocean. Science 2015, 348, 1261605. [Google Scholar] [CrossRef] [PubMed] [Green Version]
  4. Azam, F.; Fenchel, T.; Field, J.G.; Gray, J.S.; Meyer-Reil, L.A.; Thingstad, F. The Ecological Role of Water-Column Microbes in the Sea. Mar. Ecol. Prog. Ser. 1983, 10, 257–263. [Google Scholar] [CrossRef]
  5. Worden, A.Z.; Follows, M.J.; Giovannoni, S.J.; Wilken, S.; Zimmerman, A.E.; Keeling, P.J. Rethinking the Marine Carbon Cycle: Factoring in the Multifarious Lifestyles of Microbes. Science 2015, 347, 1257594. [Google Scholar] [CrossRef] [Green Version]
  6. Caron, D.A.; Peele, E.R.; Lim, E.L.; Dennett, M.R. Picoplankton and Nanoplankton and Their Trophic Coupling in Surface Waters of the Sargasso Sea South of Bermuda. Limnol. Oceanogr. 1999, 44, 259–272. [Google Scholar] [CrossRef] [Green Version]
  7. Sanders, R.W.; Berninger, U.-G.; Lim, E.L.; Kemp, P.F.; Caron, D.A. Heterotrophic and Mixotrophic Nanoplankton Predation on Picoplankton in the Sargasso Sea and on Georges Bank. Mar. Ecol. Prog. Ser. 2000, 192, 103–118. [Google Scholar] [CrossRef]
  8. Sherr, E.B.; Sherr, B.F. Bacterivory and Herbivory: Key Roles of Phagotrophic Protists in Pelagic Food Webs. Microb. Ecol. 1994, 28, 223–235. [Google Scholar] [CrossRef]
  9. Gooday, A.J.; Schoenle, A.; Dolan, J.R.; Arndt, H. Protist Diversity and Function in the Dark Ocean—Challenging the Paradigms of Deep-Sea Ecology with Special Emphasis on Foraminiferans and Naked Protists. Eur. J. Protistol. 2020, 75, 125721. [Google Scholar] [CrossRef]
  10. Živaljić, S.; Schoenle, A.; Nitsche, F.; Hohlfeld, M.; Piechocki, J.; Reif, F.; Shumo, M.; Weiss, A.; Werner, J.; Witt, M.; et al. Survival of Marine Heterotrophic Flagellates Isolated from the Surface and the Deep Sea at High Hydrostatic Pressure: Literature Review and Own Experiments. Deep. Sea Res. Part II Top. Stud. Oceanogr. 2018, 148, 251–259. [Google Scholar] [CrossRef]
  11. Živaljić, S.; Scherwass, A.; Schoenle, A.; Hohlfeld, M.; Quintela-Alonso, P.; Nitsche, F.; Arndt, H. A Barotolerant Ciliate Isolated from the Abyssal Deep Sea of the North Atlantic: Euplotes Dominicanus sp. n. (Ciliophora, Euplotia). Eur. J. Protistol. 2020, 73, 125664. [Google Scholar] [CrossRef] [PubMed]
  12. Morgan-Smith, D.; Garrison, C.E.; Bochdansky, A.B. Mortality and Survival of Cultured Surface-Ocean Flagellates under Simulated Deep-Sea Conditions. J. Exp. Mar. Biol. Ecol. 2013, 445, 13–20. [Google Scholar] [CrossRef]
  13. Schoenle, A.; Hohlfeld, M.; Hermanns, K.; Mahé, F.; De Vargas, C.; Nitsche, F.; Arndt, H. High and Specific Diversity of Protists in the Deep-Sea Basins Dominated by Diplonemids, Kinetoplastids, Ciliates and Foraminiferans. Commun. Biol. 2021, 4. [Google Scholar] [CrossRef] [PubMed]
  14. Hohlfeld, M.; Schoenle, A.; Arndt, H. Horizontal and Vertical Small-Scale Patterns of Protist Communities at the Atlantic Deep-Sea Floor. Deep. Sea Res. Part I Oceanogr. Res. Pap. 2021, 171, 103515. [Google Scholar] [CrossRef]
  15. Pawlowski, J.; Christen, R.; Lecroq, B.; Bachar, D.; Shahbazkia, H.R.; Amaral-Zettler, L.; Guillou, L. Eukaryotic Richness in the Abyss: Insights from Pyrotag Sequencing. PLoS ONE 2011, 6, e18169. [Google Scholar] [CrossRef] [PubMed]
  16. Scheckenbach, F.; Hausmann, K.; Wylezich, C.; Weitere, M.; Arndt, H. Large-Scale Patterns in Biodiversity of Microbial Eukaryotes from the Abyssal Sea Floor. Proc. Natl. Acad. Sci. USA 2010, 107, 115–120. [Google Scholar] [CrossRef] [PubMed] [Green Version]
  17. Burki, F.; Sandin, M.M.; Jamy, M. Diversity and Ecology of Protists Revealed by Metabarcoding. Curr. Biol. 2021, 31, R1267–R1280. [Google Scholar] [CrossRef] [PubMed]
  18. Schoenle, A.; Jeuck, A.; Nitsche, F.; Venter, P.; Prausse, D.; Arndt, H. Methodological Studies on Estimates of Abundance and Diversity of Heterotrophic Flagellates from the Deep-Sea Floor. J. Mar. Sci. Eng. 2016, 4, 22. [Google Scholar] [CrossRef] [Green Version]
  19. Arndt, H.; Dietrich, D.; Auer, B.; Cleven, E.-J.; Gräfenhan, T.; Weitere, M.; Mylnikov, A.P. Functional Diversity of Heterotrophic Flagellates in Aquatic Ecosystems. In The Flagellates; Leadbeater, B.S.C., Green, J.C., Eds.; Taylor & Francis Ltd.: London, UK, 2000; pp. 240–268. [Google Scholar]
  20. Arndt, H.; Hausmann, K.; Wolf, M. Deep-Sea Heterotrophic Nanoflagellates of the Eastern Mediterranean Sea: Qualitative and Quantitative Aspects of Their Pelagic and Benthic Occurrence. Mar. Ecol. Prog. Ser. 2003, 256, 45–56. [Google Scholar] [CrossRef]
  21. Bak, R.P.M.; Nieuwland, G. Seasonal Variation in Bacterial and Flagellate Communities of Deep-Sea Sediments in a Monsoonal Upwelling System. Deep. Sea Res. Part II 1997, 44, 1281–1292. [Google Scholar] [CrossRef]
  22. Burnett, B.R. Quantitative Sampling of Nanobiota (Microbiota) of the Deep-Sea Benthos—III. The Bathyal San Diego Trough. Deep. Sea Res. Part A Oceanogr. Res. Pap. 1981, 28, 649–663. [Google Scholar] [CrossRef]
  23. Danovaro, R.; Marrale, D.; Della Croce, N.; Dell’Anno, A.; Fabiano, M. Heterotrophic Nanoflagellates, Bacteria, and Labile Organic Compounds in Continental Shelf and Deep-Sea Sediments of the Eastern Mediterranean. Microb. Ecol. 1998, 35, 244–255. [Google Scholar] [CrossRef]
  24. Alongi, D.M. The Distribution and Composition of Deep-Sea Microbenthos in a Bathyal Region of the Western Coral Sea. Deep. Sea Res. Part A Oceanogr. Res. Pap. 1987, 34, 1245–1254. [Google Scholar] [CrossRef]
  25. Salani, F.S.; Arndt, H.; Hausmann, K.; Nitsche, F.; Scheckenbach, F. Analysis of the Community Structure of Abyssal Kinetoplastids Revealed Similar Communities at Larger Spatial Scales. ISME J. 2012, 6, 713–723. [Google Scholar] [CrossRef] [PubMed] [Green Version]
  26. George, K.; Arndt, H.; Wehrmann, A.; Baptista, L.; Berning, B.; Bruhn, M.; Carvalho, F.; Cordeiro, R.; Creemers, M.; Defise, A.; et al. Controls in Benthic and Pelagic Biodiversity of the Azores Biodiaz; METEOR-Berichte: Senckenberg am Meer, Germany, 2018. [Google Scholar]
  27. Schlitzer, R. Ocean Data View; Alfred Wegener Institute for Polar and Marine Research: Bremerhaven, Germany, 2015. [Google Scholar]
  28. R Core Team. R: A Language and Environment for Statistical Computing; R Foundation for Statistical Computing: Vienna, Austria, 2021. [Google Scholar]
  29. Orksanen, J.; Blanchet, F.G.; Friendly, M.; Kindt, R.; Legendre, P.; McGlinn, D.; Minchin, P.R.; O’Hara, R.B.; Simpson, G.L.; Solymos, P.; et al. Vegan: Community Ecology Package. R Package Version 2.5-2 2018. Available online: https://github.com/vegandevs/vegan (accessed on 1 February 2022).
  30. Suzuki, R.; Shimodaira, H. Pvclust: An R Package for Assessing the Uncertainty in Hierarchical Clustering. Bioinformatics 2006, 22, 1540–1542. [Google Scholar] [CrossRef]
  31. Wickham, H. Ggplot2: Elegant Graphics for Data Analysis; Springer: Houston, Texas, USA, 2009. [Google Scholar]
  32. Alongi, D.M. Bathymetric Patterns of Deep-Sea Benthic Communities from Bathyal to Abyssal Depths in the Western South Pacific (Solomon and Coral Seas). Deep. Sea Res. Part A Oceanogr. Res. Pap. 1992, 39, 549–565. [Google Scholar] [CrossRef]
  33. Mukherjee, I.; Hodoki, Y.; Nakano, S. Kinetoplastid Flagellates Overlooked by Universal Primers Dominate in the Oxygenated Hypolimnion of Lake Biwa, Japan. FEMS Microbiol. Ecol. 2015, 91, fiv083. [Google Scholar] [CrossRef] [PubMed]
  34. Dietrich, D.; Arndt, H. Biomass Partitioning of Benthic Microbes in a Baltic Inlet: Relationships between Bacteria, Algae, Heterotrophic Flagellates and Ciliates. Mar. Biol. 2000, 136, 309–322. [Google Scholar] [CrossRef]
  35. Flegontova, O.; Flegontov, P.; Londoño, P.A.C.; Walczowski, W.; Šantić, D.; Edgcomb, V.P.; Lukeš, J.; Horák, A. Environmental Determinants of the Distribution of Planktonic Diplonemids and Kinetoplastids in the Oceans. Environ. Microbiol. 2020, 22, 4014–4031. [Google Scholar] [CrossRef]
  36. Kudryavtsev, A.; Pawlowski, J.; Smirnov, A. More Amoebae from the Deep-Sea: Two New Marine Species of Vexillifera (Amoebozoa, Dactylopodida) with Notes on Taxonomy of the Genus. Eur. J. Protistol. 2018, 66, 9–25. [Google Scholar] [CrossRef]
  37. Grossart, H.; Gust, G. Hydrostatic Pressure Affects Physiology and Community Structure of Marine Bacteria during Settling to 4000 m: An Experimental Approach. Mar. Ecol. Prog. Ser. 2009, 390, 97–104. [Google Scholar] [CrossRef] [Green Version]
  38. Atkins, M.S.; Anderson, O.R.; Wirsen, C.O. Effect of Hydrostatic Pressure on the Growth Rates and Encystment of Flagellated Protozoa Isolated from a Deep-Sea Hydrothermal Vent and a Deep Shelf Region. Mar. Ecol. Prog. Ser. 1998, 171, 85–95. [Google Scholar] [CrossRef]
  39. Schoenle, A.; Nitsche, F.; Werner, J.; Arndt, H. Deep-Sea Ciliates: Recorded Diversity and Experimental Studies on Pressure Tolerance. Deep. Sea Res. Part I Oceanogr. Res. Pap. 2017, 128, 55–66. [Google Scholar] [CrossRef]
  40. Živaljić, S.; Schoenle, A.; Scherwass, A.; Hohlfeld, M.; Nitsche, F.; Arndt, H. Influence of Hydrostatic Pressure on the Behaviour of Three Ciliate Species Isolated from the Deep-Sea Floor. Mar. Biol. 2020, 167, 63. [Google Scholar] [CrossRef]
  41. Hellebust, J.A.; Lewin, J. Heterotrophic Nutrition. In The Biology of Diatoms; Werner, D., Ed.; University of California Press: Berkeley and Los Angeles, CA, USA, 1977; pp. 169–197. [Google Scholar]
  42. Flegontova, O.; Flegontov, P.; Malviya, S.; Audic, S.; Wincker, P.; de Vargas, C.; Bowler, C.; Lukeš, J.; Horák, A. Extreme Diversity of Diplonemid Eukaryotes in the Ocean. Curr. Biol. 2016, 26, 3060–3065. [Google Scholar] [CrossRef] [PubMed]
  43. Lara, E.; Moreira, D.; Vereshchaka, A.; López-García, P. Pan-Oceanic Distribution of New Highly Diverse Clades of Deep-Sea Diplonemids. Environ. Microbiol. 2009, 11, 47–55. [Google Scholar] [CrossRef] [Green Version]
  44. Lukeš, J.; Flegontova, O.; Horák, A. Diplonemids. Curr. Biol. 2015, 25, R702–R704. [Google Scholar] [CrossRef] [Green Version]
  45. Sime-Ngando, T.; Juniper, K.; Vézina, A. Ciliated Protozoan Communities over Cobb Seamount: Increase in Biomass and Spatial Patchiness. Mar. Ecol. Prog. Ser. 1992, 89, 37–51. [Google Scholar] [CrossRef]
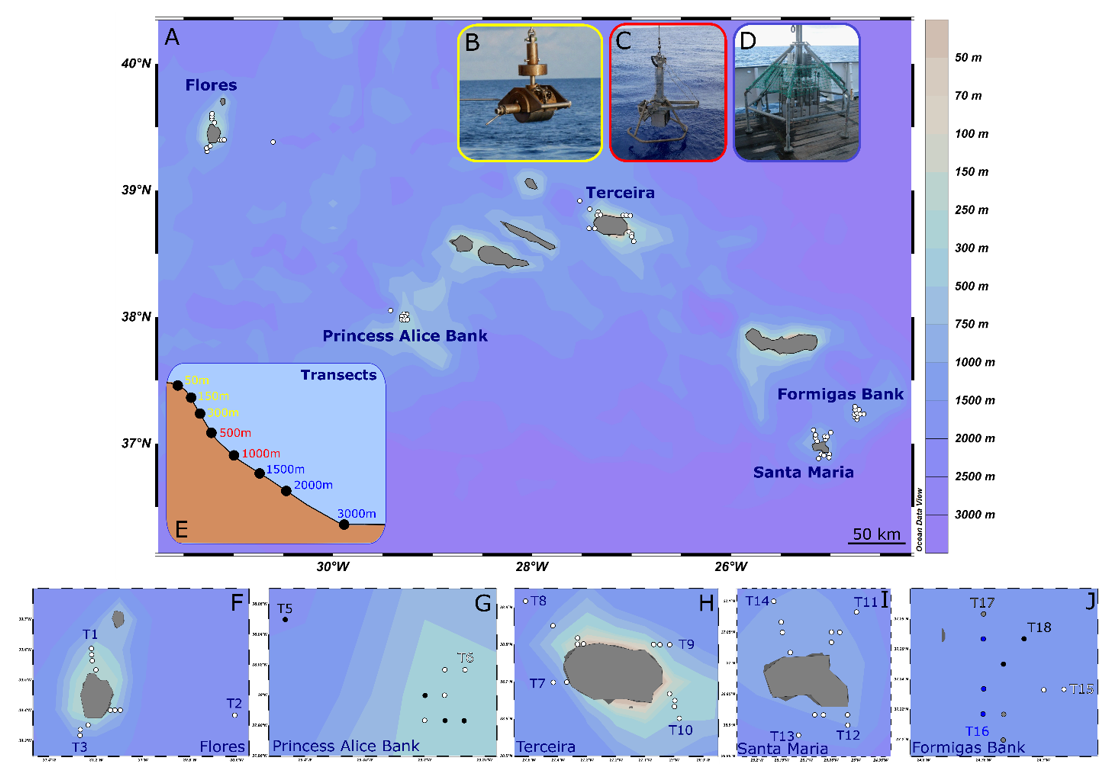
Figure 1. Sampling map showing (A) the sampled stations (indicated by white dots) around the Azores islands. Sediment was sampled using (B) a Shipek grab, (C) a Boxcorer, and (D) a Multicorer. Sampled depths are shown in (E). Colors indicate which sampling gear was used in each depth. Sampling sites of transect stations around (F) Flores, (G) Terceira, (H) Princess Alice Bank, (I) Santa Maria, and (J) Formigas Bank. Maps were created using Ocean Data View [27].
Diversity 14 00164 g001
Figure 2. Boxplots showing the abundance of (A) all heterotrophic protists, (B) kinetoplastids, (C) bicosoecids, (D) euglenids, (E) cercozoans, (F) ciliates, and (G) undetermined protists in the different depths sampled (samples from 1500 to 3000 m were pooled). Empty circles indicate mean abundances per depth, filled circles show outliers, bold lines indicate the median. Letters next to the boxes indicate the results of the Kruskal–Wallis test with Dunn’s test for multiple comparisons as the post-hoc test. Different letters indicate significant differences between abundances (p < 0.05). (H) Correlation between depth and the number of observed morphotypes (Spearman’s rank correlation coefficient rho = −0.89, p < 0.05).
Diversity 14 00164 g002
Figure 3. Relative contribution to (A) abundance and (B) biovolume of taxonomic groups detected by live-counting of samples from sublittoral to abyssal depths (different stations of the same depth were pooled, depths from 1500 to 3000 m were pooled and displayed as >1000 m). (C) Cluster dendrogram of all different depths based on the Bray–Curtis dissimilarity and the UPGMA clustering analysis with approximately unbiased (AU) p-values and bootstrap probability (BP) values given at the branching points of the clusters.
Diversity 14 00164 g003
Figure 4. Examples of morphotypes detected in culture. (A) Stephanopogon sp. (Heterolobosea), (B) Percolomonas-like flagellate (Heterolobosea) (C) Stephanoeca-like flagellate (Choanoflagellata) (D) Ministeria sp. (Filasterea), (E) Ploeotia sp. (Euglenida), (F) Goniomonas sp. (Cryptista).
Diversity 14 00164 g004
Figure 5. Heatmap indicating the percentage of samples for each depth in which the respective morphotypes appeared in cultures (depths from 1500 to 3000 m were pooled). The shade of grey indicates the percentage (see legend).
Diversity 14 00164 g005
Table 1. Average and range of abundances (cells cm–3) and biovolumes (µm3 cm–3) of benthic nanofauna (<20 µm), microfauna (20–200 µm), and microphytobenthos in different sediment depths. Regarding the biovolume of the microphytobenthos, only the vastly dominating pennate diatoms were considered.
50 m150 m300 m500 m1000 m1500–3000 m
Abundance [cells cm−3]
Nanofauna2088
(320–10,600)
637
(0–1840)
946
(0–6000)
215
(0–750)
201
(0–520)
207
(0–674)
Microfauna126
(0–442)
64
(0–307)
41
(0–420)
31
(0–444)
23
(0–161)
0
Microphytobenthos915
(0–8392)
43
(0–321)
15
(0–444)
000
Biovolume [µm3 cm−3]
Nanofauna159,200
(18,900–589,200)
43,210
(0–236,200)
72,800
(0–891,200)
16,910
(0–99,750)
6400
(0–30,800)
6900
(0–29,600)
Microfauna998,300
(0–7,749,000)
124,200
(0–706,900)
210,200
(0–2,304,000)
38,040
(0–465,400)
21,720
(0–152,000)
0
Microphytobenthos
(only pennate diatoms)
612,400
(0–3,254,000)
32,100
(0–558,200)
18,100
(0–580,900)
000
Publisher’s Note: MDPI stays neutral with regard to jurisdictional claims in published maps and institutional affiliations.