Article

Assessment of Grassland Ecosystem Service Value in Response to Climate Change in China

National Climate Center, China Meteorological Administration, Beijing 100081, China
*
Author to whom correspondence should be addressed.
Diversity 2022, 14(3), 160; https://doi.org/10.3390/d14030160
Submission received: 7 January 2022 / Revised: 18 February 2022 / Accepted: 21 February 2022 / Published: 24 February 2022
(This article belongs to the Special Issue Ecosystem Observation, Simulation and Assessment)

Abstract

:
The assessment of ecosystem services provides an intuitive source of information on the benefits humans derive from ecosystems. The equivalent factor method was applied to calculate the ecosystem service value (ESV) in combination with net primary productivity (NPP) calculated by the process-based Carnegie–Ames–Stanford approach (CASA) model. This study evaluated grassland ESV and its spatial evolution characteristics in China from 2001 to 2020 and revealed the impact of climate factors. For 2001–2020, the annual grassland ESV ranged from 1.17 × 10¹² to 1.51 × 10¹² yuan (renminbi, China yuan—the same below; $0.15 × 10¹²$0.20 × 10¹², US dollar), with an average of 1.37 × 10¹² yuan ($0.18 × 10¹²). The spatial pattern of ESV per unit area of grassland was notably characterized by an increase from northwest to southeast. However, the value of grassland ecosystem services was relatively large (exceeding 10 × 106 yuan; $1.30 × 10⁶) in northern and western provinces and was the lowest (less than 0.2 × 10⁶ yuan; $0.03 × 10⁶) in eastern and southern provinces. In the last 20 years, grassland ESV has increased in most areas of China and has decreased only in some western and northern areas. Compared with the first 10 years, the average ESV of grassland in most areas increased in the last 10 years, usually by less than 20%. However, it decreased in the western and northern parts of China, mainly concentrated in the alpine meadow and alpine grassland of the Qinghai–Tibet Plateau and the grassland around the Yili region of Xinjiang. Precipitation was the main regulating factor of grassland ESV and had a positive impact in 79% grassland areas, especially in northern China. Evapotranspiration and sunshine hours exhibited a marginal impact on ESV, but temperature and relative humidity had no significant effect. Overall, this study contributes to exploring the spatiotemporal patterns of grassland ecosystem service value and the impact of climate factors in China, thereby providing reliable guidance for grassland ecosystem management.

1. Introduction

Ecosystem services are the benefits human populations derive, directly or indirectly, from ecosystem functions [1], including provision, regulating, supporting, and cultural services [2], or supply, regulation and cultural services [3,4], or other categories from different classification systems. These services can support human survival and development and play an irreplaceable role in maintaining the dynamic balance of the earth’s life support system and environment. However, in recent decades, due to the influence of human activities and natural factors, nearly 60% of global ecosystem services have degraded to varying degrees [2,5,6,7,8], which seriously threatens human security and health and has become one of the main problems affecting human sustainable development.
As the world’s population increases, the demand for ecosystem supply services and other services is increasing [9]. At the same time, governments and managers always expect the maximization of ecosystem service value [10]. The ecological environment has deteriorated seriously. The interweaving of these factors means that the evaluation of ecosystem services ought to be paid increasing attention and become a research priority [11]. In particular, since the launch of the Millennium Ecosystem Assessment Project in 2001, many countries have assessed ecosystem services at various scales. At the end of the 20th century, some Chinese ecology and eco-economics scholars made a preliminary exploration on the theory, method, and practical application of ecosystem service evaluation. Especially since entering the 21st century, a large number of relative studies have emerged and some valuable research results have been obtained [12]. This has greatly promoted the correct understanding of ecological assets and the active implementation of ecological protection measures. However, these studies have many deficiencies. For example, although many studies focused on the effects of land use (e.g., Han et al., 2021 [13]) or the combined effects of land use and climate change on ecosystem services (e.g., Schirpke et al., 2017 [14]), few studies have addressed the specific effects of climate change or climate factors. In addition, almost all existing studies were based on separate years and rarely involved continuous time series.
Grassland is the production base of animal husbandry and the basis of herdsmen’s life and cultural inheritance. On the one hand, grasslands provide multiple ecological services, such as climate regulation, soil and water conservation, wind prevention and sand fixation, soil improvement, and biodiversity maintenance [1,15]. On the other hand, grasslands also have the ability to purify air, water, and soil pollutants through various physical, chemical, and biological processes, which is conducive to ecosystem quality and human health [16]. However, the long-term interference of human activities, coupled with the influence of natural factors, such as climate change, have resulted in a decline in the carrying capacity (e.g., the ability to support grazing) and the ability to resist natural risks (e.g., drought) [17] of grassland ecosystems. As reported, about 50% of global grasslands have been degraded [18,19,20,21], and temperate grasslands had lost more than 70% of their natural cover by 1950 [2]. About 22% of China’s grassland was degraded before 2000 [22], especially in the grassland of North China [23], while the degraded areas are still increasing year by year [24]. As a result, the sustainable development of regional ecology, economy, and society are directly affected. To some extent, this reflects the lack of understanding of grassland ecosystem service status and function and potential economic value. Under such a severe situation, it is of great practical significance to evaluate the economic value of grassland ecosystem services in China for protecting and restoring the effectiveness of grassland resources and making reasonable decisions for regional ecological protection and economic development.
Over the past century, the earth’s climate has undergone significant changes characterized by global warming, which has had a significant impact on global ecosystems and their important services [9]. Studies have shown that climate change has a negative impact on 59% of ecosystem services [25] and this impact is expected to increase rapidly around the world in the future [26,27,28,29]. Climate change may profoundly affect the behavior patterns and sensitivities of biotic/abiotic organisms, thereby promoting regulation, support, and cultural services [29] or modifying the relationships and benefits related to ecosystem services [30]. For grassland ecosystems, climate-induced changes had a significant impact on the regulation and cultural services of grasslands in the French Alps, which even exceeded the impact of grassland management decisions [31]. Drought and warming combined with overgrazing led to desertification in some grassland areas in China [32]. The projected future climate scenarios will also have a significant impact on grassland ecosystem services, such as carbon stocks, in northern China [33]. For forest and other ecosystems, climate change has also exhibited a profound impact on ecosystem services there (e.g., Gong et al., 2017; Cui et al., 2021 [34,35]). Although it is well known that climate change is an important cause of ecosystem service change [2,34,36], the exact influencing factors and driving effects remain largely unclear. Therefore, studying the relationship between ecosystem services and climate variation will help to better understand the driving mechanism of ecosystem services change and lay a foundation for adaptation to climate change.
In view of this, this study constructed the index system and method of ESV evaluation and comprehensively assessed the grassland ESV in China for 20 consecutive years. The main objectives of this research were to find out (1) how the value of grassland ecosystem services has evolved over time and space; (2) the long-term economic benefits and ecological conditions of grassland in China; and (3) whether the climatic variation is a potential regulator of ESV change and which variable is the dominant factor involved.

2. Materials and Methods

2.1. Study Area

China is located in the east of Eurasia and on the west coast of the Pacific Ocean. The latitude is 3°51′–53°33′ N, longitude is 73°33′–135°05′ E, and the elevation is −100–8000 m. It crosses five climatic and thermal zones of tropical, subtropical, warm temperate, middle temperate, and cold temperate zones. The annual precipitation ranges from 50–2000 m.
China’s grassland area is approximately 4 million km2, ranking second in the world, and accounting for more than 40% of the national territory [37]. Grassland in China is mainly distributed in the northeast, northwest, and the Qinghai–Tibet Plateau. The grassland is divided into high, medium, and low coverage grassland (Figure 1; [38]). High coverage grassland refers to natural grassland, improved grassland, and mowed grassland covering >50%. This kind of grassland generally has good water conditions and dense grass cover. Medium coverage grassland refers to natural grassland and improved grassland with coverage of 20–50%. Generally, this kind of grassland has insufficient water and sparse grass cover. Low coverage grassland refers to the natural grassland with coverage of 5–20%. This kind of grassland is characterized by a lack of water, sparse grass cover, and poor animal husbandry utilization conditions.

2.2. ESV Evaluation Method

Xie et al. (2008) [39] showed that, since ecosystem services give different subjective satisfaction to people in different social geographical environments, it will lead to different marginal utility unit values. Therefore, based on Costanza et al. (1997) [1], Xie et al. (2003, 2008) [39,40] modified the value of each type of ecosystem service by extracting the equivalent weight factors of ecosystem services in China according to a survey of 700 of Chinese ecological experts. Meanwhile, after comparing a large number of results, Xie et al. (2008) [39] confirmed that the unit prices of ecosystem services determined by him were close to those estimated based on material quality, and the two were well comparable. Subsequently, Xie’s method was widely used in China. Here, the equivalent factor method modified by Xie et al. (2003) [40] based on Costanza et al. (1997) [1] was applied to calculate the grassland ecosystem service value from 2001 to 2020 in China. The unit price of ecosystem services determined by Xie et al. (2003) [40] is shown in Table 1.

2.2.1. Model and Index System

The ESV evaluation equation [39,40], relevant indicators, and parameters are as follows:
ESV = ΣPi × A
ESV is the total value of grassland ecosystem services in China. Pi is the revised unit price of ecosystem services i of the grassland ecosystem. i = 1, 2, …, 9, respectively, representing nine ecosystem services: gas regulation, climate regulation, water conservation, soil formation and protection, waste treatment, biodiversity protection, food production, raw material production, recreation and culture; A is the area of grassland ecosystem in China.
The revised unit price of ecosystem services is adjusted by using biomass factors as follows:
Pi = (b/B)pi
where Pi is the revised unit price of ecosystem services i of the grassland ecosystem, the same as above; B is the biomass per unit area of grassland in China, B = 1322 × 85% kg/(hm2∙a); pi is the unit price of ecosystem service i under the national average state in Table 1 put forward by Xie et al. (2003) [40]; b is the biomass of the grassland ecosystem, b = NPP/(6 × 0.45).
The parameter setting and calculation process are as follows.
Biomass generally refers to the dry weight of all living biological organisms per unit area, which is the dry matter accumulated by net productivity. At present, there is no report on the relationship between grassland vegetation biomass and NPP at the national scale of long time series in China. Grassland NPP is actually the biomass of vegetation in a year. Therefore, the dry matter weight of grassland NPP was determined as the annual biomass. According to Fang et al. (2010) [41], the average total biomass of grassland in China was 479.56–773 g/m2. Piao et al. (2001) [42] obtained the average aboveground and underground biomass of 98.0 and 602.5 g/m2, respectively (underground/aboveground biomass was 6.14) using the model established by China Grassland Resources Data in the 1990s. Yang et al. (2010) [43] calculated that the average aboveground and underground biomass of grassland in China were 104.8 and 570.2 g/m2, respectively (underground/aboveground biomass was 5.44). By integrating all of these multiple research data, we calculated that the average aboveground and underground biomass were 127.9 and 639.3 g/m2 (underground/aboveground biomass was 5.00). Therefore, the ratio of underground/aboveground biomass is set as 5, that is, aboveground biomass accounts for 1/6 of the total biomass.
The aboveground biomass of grassland vegetation is equal to the grass yield (air-dried weight) minus the water content in air-dried grass. In this study, the moisture content of the air-dried grass is 15% [44]. The yield of air-dried grass per unit area of grassland in China is 1322 kg/(hm2∙a) [44].
In addition, when the plant biomass (dry matter weight, unit: g) is converted to carbon weight (unit: gC), the conversion coefficient is usually 0.45 [44]. The NPP unit in this study is gC/m2. Therefore, when NPP is converted to dry matter mass, 0.45 is taken as the conversion coefficient (divided by 0.45).

2.2.2. Assumptions

(1) Grassland area remained unchanged. Due to human disturbance and destruction, the area of major grassland pastoral areas has decreased by 0.4% in recent years in China [45]. Meanwhile, due to the implementation of a large-scale ecological restoration project—the Grain to Green Program (GTGP)—in the past 20 years, the area of artificial grassland in China has been increasing. However, all of these changes in grassland area caused by human activities constituted less than 1%. Therefore, in order to reveal the possible impact of climate change and eliminate the impact of land use type change induced by human activities as much as possible, this study assumed that grassland area did not change in different years, and therefore only 1-year land use type data were used.
(2) ESV based on biomass. Costanza et al. (1997) [1] showed that biomass not only reflects the raw material production capacity of an ecosystem but also has an important impact on other services of the ecosystem during the formation and accumulation of biomass. Xie et al. (2003, 2008, 2015) [39,40,46] assumed that biomass can largely reflect the differences in service capacity of different types of ecosystems. Therefore, it is assumed that the intensity of an ecosystem service is linearly correlated with biomass, that is, the greater the biomass, the stronger the ecosystem service capacity.

2.3. NPP Evaluation

The process-based Carnegie–Ames–Stanford approach (CASA) model, jointly developed by Stanford University, the Nature Conservation Society (TNC), and the World Wide Fund for nature (WWF), is used to calculate vegetation NPP over 2001–2020. Compared with the in situ NPP and MODIS-NPP, the performance of NPP according to the CASA model was verified to be reliable. The CASA model is a satellite-based light use efficiency model. The model expression and parameter setting were detailed in the work of Potter et al. (1993), Luo et al. (2020), and Zhang et al. (2021) [47,48,49]. In brief, absorbed photosynthetically active radiation (APAR) and actual light use efficiency (ε) are used to estimate NPP; the equation is as follows:
NPP(x, t) = APAR(x, t) × ε(x, t)
where NPP is the net primary productivity (gC/m2); APAR(x, t) represents the absorbed photosynthetically effective radiation (MJ/m) absorbed by pixel x in the month t, which is calculated from the normalized difference vegetation index (NDVI); and ε(x, t) represents the actual light use efficiency of pixel x in the month t (gC/MJ).
Estimation of APAR
The effective solar radiation absorbed by vegetation and the absorption ratio of the vegetation layer to the incident photosynthetically active radiation are used to estimate APAR, using the following relation:
APAR(x, t) = SOL(x, t) × FPAR(x, t) × 0.5
where SOL(x, t) represents the total solar radiation (Gc/m2∙month) at pixel x in month t and FPAR(x, t) represents the absorption ratio of the vegetation layer to the incident photosynthetic effective radiation. The constant 0.5 represents the effective solar radiation that the vegetation can use as a (wavelength is 0.4–0.7 μm) proportion of total solar radiation. FPAR is derived based on NDVI; the calculations for FPAR were detailed in the work of (Potter et al., 1993; Luo et al., 2020; Zhang et al., 2021) [47,48,49].
Estimation of light use efficiency
Light use efficiency refers to the ratio of the chemical potential of dry matter formed per unit area in a given time to the photosynthetic effective radiant energy projected onto the same area during the same period. Environmental factors affecting the photosynthetic capacity of plants, viz., air temperature, soil moisture status, and the difference in atmospheric water and vapor pressures, etc., can regulate the NPP of vegetation.
ε(x, t) × Tε1(x, t) × Tε2(x, t) × Wε(x, t) × εmax
where Tε1(x, t) and Tε2(x, t) indicate the stress effect of low temperatures and high temperatures on light use efficiency; Wε(x, t) is the influence coefficient of water stress, reflecting the influence of water conditions; and εmax is the maximum light use efficiency under ideal conditions.
Tε1(x, t) = 0.8 + 0.02 × Topt(x) − 0.0005 × [Topt(x)]2
where Topt(x) is the optimum temperature for plant growth, representing the average monthly temperature of a region measured in degrees Celsius when the NDVI values reach the maximum in a given year.
Tε2(x, t) = 1.184/{1 + exp[0.2 × (Topt(x) − 10 − T(x))]} × 1/{1 + exp[0.3 × (−Topt(x) − 10 + T(x))]}
When the average monthly temperature T(x, t) is 10 °C higher or 13 °C lower than the optimum temperature Topt(x), then the monthly average temperature T(x, t) is equal to 2(x, t) and the optimum temperature Topt(x) is equal to half of 2(x, t).
W(x, t) = 0.5 + 0.5 × EET(x, t)/EPT(x, t)
where EET is the actual regional evapotranspiration (mm) and EPT is the potential regional evapotranspiration (mm).

2.4. Data Sources and Processing

2.4.1. Used Data

The data used for the NPP estimation by the CASA model include vegetation index, land use/land cover, and climate (Table 2). Remote sensing data of mod17A3 annual NPP and the monthly mod13A2 normalized vegetation index (NDVI) of global land vegetation have been accessed for 20 years from 2001 to 2020 via the EOS/MODIS portal of NASA. The land use type data for 2015 that were used were from the Data Center for Resources and Environmental Sciences of the Chinese Academy of Sciences (RESDC) [38]. All the climate data were from the high-resolution meteorological dataset downloaded from the Chinese Meteorological Information Center (Table 2). GDP data came from the National Bureau of Statistics. The data used for ESV calculations are shown in Table 2.
At present, both RMB yuan and US dollars were used in the research; RMB yuan was usually used in domestic studies. In order to facilitate the comparison of domestic and international research results, both the units of RMB yuan and US dollars were used in this study. The 2007 benchmark price of 7.68 yuan/US $ was used according to Xie et al. (2008) [39].

2.4.2. Data Analysis

All these spatial data were interpolated or resampled to a 1 km × 1 km resolution using ArcGIS 10.0 (Esri, Redlands, CA, USA) before they were inputted into the models. The spatial resolution of NPP and ESV values output by the model was 1 km × 1 km. According to the test, the annual ESV and climate factor data conform to the normal distribution. Therefore, Pearson’s rank correlation analysis was conducted to explore the relationship between grassland ESV and climate factors across an annual range at the national scale. p < 0.05 (i.e., 95% confidence level) was defined as the statistical significance level. All statistical analyses were performed using the SPSS version 11.5 software package. All grid data analysis and processing were carried out by ArcGIS10.0.

3. Results

3.1. The Temporal Distribution of Grassland ESV

The annual grassland ecosystem service values (ESVs) for the national total ranged from 1.17 × 10¹² to 1.51 × 10¹² yuan ($0.15 × 10¹²$0.20 × 10¹²), with an average of 1.37 × 10¹² yuan ($0.18 × 10¹²) from 2001 to 2020 (Figure 2), accounting for 4.42% of GDP (48.7 × 10¹² yuan; $6.34 × 10¹²) (Figure 3). The grassland ESV has increased significantly (p < 0.001, R = 0.892) over the last 20 years at the rate of 122 × 108 yuan ($15.89 × 10⁸) per year, with a peak occurring in 2020. In general, the mean annual grassland ESV was substantially higher in the last 10 years (2011–2020, 1.44 × 10¹² yuan; $0.19 × 10¹²) than in the first 10 years (2001–2010, 1.30 × 10¹² yuan; $0.17 × 10¹²), indicating that the grassland ecological environment and service capacity have been generally improved over recent years.
In terms of the four major ecosystem services, regulating service accounted for the largest proportion of 52.6% (0.721 × 10¹² yuan; $938.80 × 10⁸), followed by supporting service (42%, 0.575 × 10¹² yuan; $748.70 × 10⁸), provision service (4.8%, 0.066 × 10¹² yuan; $85.94 × 10⁸), and cultural service (0.6%, 0.008 × 10¹² yuan; $10.42 × 10⁸) (Figure 4).

3.2. The Spatial Distribution of Grassland ESV

Spatially, the value of grassland ecosystem service per unit area in China increased from northwest to southeast. The lowest values were less than 0.6 × 10⁶ yuan ($7.81 × 10⁴) per square kilometer, mainly distributed in the desert steppe, alpine meadow, and alpine grassland of western and northern China. The relatively high values of more than 1.5 × 10⁶ yuan ($19.53 × 10⁴) per square kilometer were mostly observed in the savannas of southern China, mainly distributed in Yunnan, Guangxi, Guangdong, and Fujian provinces (Figure 5).
However, the value of grassland ecosystem services in the northern and western provinces of China was relatively greater. Inner Mongolia Province in North China, Qinghai Province in Northwest China, and Tibet and Sichuan provinces in Southwest China had the highest values of more than 10 × 106 yuan ($130 × 104). Eastern and southern provinces, such as Zhejiang, Jiangsu, and Hainan, had the lowest ecosystem service values of less than 0.2 × 10⁶ yuan ($2.60 × 10⁴) (Table 3).
Over the past 20 years, the service values of the majority of grassland ecosystems in China have shown an increasing trend (p < 0.05, or R > 0.445), especially in the warm shrub grass and alpine meadows to the south of Inner Mongolia. The values have decreased only in very few grassland areas, mainly in the alpine meadow and alpine grassland of Tibet Province and the alpine meadow and desert grassland around Ili in Xinjiang Province (Figure 6).
The mean annual grassland ESV was mostly higher in the last 10 years than in the first 10 years of the 21st century, and the growth rate was usually less than 20%. The growth rate of more than 80% was mainly distributed in such mountain areas as Kunlun Mountain, Qilian Mountain, and Tianshan Mountain. However, compared with the first 10 years of the 21st century, the mean annual grassland ESV in the last 10 years decreased in some western and northern areas, mainly in the alpine meadow and alpine grassland of the Tibetan Plateau and the surrounding grasslands of Ili areas in Xinjiang Province (Figure 7).

3.3. The Relationship of Ecosystem Service Value and Climatic Factors

As shown in Figure 8, over the past 20 years, precipitation (p = 0.030) and evapotranspiration (p = 0.004) in the grassland of China have shown significant increasing trends; the temperature has exhibited a marginal increase (p = 0.062), confirming the background of climate warming in recent decades; and the sunshine hours (p = 0.002) and relative humidity (p = 0.014) have shown a significant decreasing trend.
In order to examine whether the grassland ESV is related to climatic factors, we plotted variations in grassland ESV and temperature, precipitation, evapotranspiration, sunshine hours, and relative humidity over 20 years. The results showed that grassland ESV was significantly positively correlated with precipitation (p = 0.021), marginally positively correlated with evapotranspiration (p = 0.082), and marginally negatively correlated with sunshine hours (p = 0.091), but not significantly correlated with temperature (p = 0.189) and relative humidity (p = 0.166).
As shown in Figure 9, the area with a significant correlation between grassland ESV and precipitation (p < 0.05) was the largest (31%, 30% positive and 1% negative), followed by sunshine hours (17%, 7% positive and 10% negative), relative humidity (15%, 13% positive and 2% negative), evapotranspiration (12%, 5% positive and 7% negative), and temperature (10%, 7% positive and 3% negative). Precipitation exhibited a positive impact on ESV in 79% of the grassland areas, especially in the semi-arid grassland areas of central and eastern Inner Mongolia Province, central and northern Qinhai Province, southern Gansu Province, and western Xinjiang Province. Sunshine hours had a negative impact on ESV in 57% of the grassland areas, especially in the desert areas of the Qinghai–Tibet Plateau, the semi-arid area of Loess Plateau, and the mountainous grassland area of Xinjiang Province.

4. Discussion

4.1. Quantity and Evolution Characteristics of ESVs

Grassland ecosystems can provide abundant benefits for human beings. In our study, the mean annual grassland ESV of 1.37 × 10¹² yuan ($0.18 × 10¹²) accounted for 4.42% of GDP from 2001 to 2020, which is a huge contribution of spiritual and material wealth. This result is somewhat inconsistent with some previous findings (see Table 4). However, our result does fall within the surveyed and estimated range of 0.87 × 10¹²–7.5 × 10¹² yuan that is considered more reliable for accounting [50]. The difference in results is mainly attributed to the inconsistency of methods, the evaluation index system, and the research period [51]. Different evaluation objects may also be another reason for inconsistent results (see Table 4).
In our study, the linear regression coefficient R2 of the annual average ESV is about 0.8, indicating that the simulation results of the model are reliable, that is, the increasing trend of ESV in the last 20 years is credible. However, the grassland ESV significantly decreased in some areas. The decline may be directly related to the incomplete matching and uneven distribution of hydrothermal conditions in these areas. All these results indicate that the grassland ecological environment and its quality in China have generally been improved and stabilized in recent years, but the regional development is unbalanced. Grassland ecosystems have stronger potential restoration capacities than forests and other ecosystems, whereas it is difficult to recover if damaged to some extent [57]. Therefore, we should try our best to avoid the destruction of grassland and take measures of protection and reconstruction for some key areas where the value of ecosystem services has declined.

4.2. Key Climatic Controlling Factors

In our study, precipitation significantly affected ESV and exhibited a positive effect in 79% of grassland areas. Meanwhile, in 57% of grassland areas, the ESV was negatively correlated with sunshine hours, especially in desert, semi-arid, and mountain grasslands. These results indicate that precipitation is definitely the most important regulating and stress factor of grassland ecosystems in China. This is mainly due to the fact that about 78% of grassland in China is located in arid and semi-arid areas [58].
The temperature change in grasslands in China confirms that the climate has been warming in recent decades. With the background of climate warming, grassland ESV in China has been increasing significantly over the last 20 years. Even though the significant correlation between grassland ESV and temperature only existed in northwestern alpine grassland and southern tropical–subtropical grassland, and did not exist in some northern grassland, this does not mean that climate change has no effect on northern grassland ESVs. The northern grasslands are relatively drier and water is a more important limiting factor, which may override the influence of temperature, since the effects of temperature and water on vegetation growth in nature may be interactive or fluctuating [59]. Meanwhile, given that the data used were only 20 years old, climate change may influence grassland ESV in the future, as projected by some studies [12,26,27,28,29,33].

4.3. Limitations

Our study has some limitations in the quantification of ESV. In terms of the equivalence factor, on the one hand, it was mainly based on biomass [12,60,61,62,63], but biomass was not always positively correlated with ecosystem services [64]; on the other hand, it mainly depended on the cognitive level of ecological experts, without considering the spatial heterogeneity of ecosystem services; therefore, the equivalent factor method has certain subjective limitations. Moreover, the unit price of different types of ecosystem services was constant, which does not reflect real life. Furthermore, some anthropogenic activity factors affecting ESV other than climate factors were not considered, and the impact of extreme weather events has not yet been reflected separately in this study. These limitations have introduced greater or lesser amounts of uncertainty into the research results.
Land use change caused by human activities has a significant impact on ecosystem service value [65,66]. Not accounting for the influence of human factors is indeed a limitation of our study. However, changes in grassland area caused by human activities were usually less than 1% in the last 20 years [45], which will not compromise the accuracy of this study. At the same time, the reliability of NPP as determined by the CASA model and the price of ESV in our study were verified, which ensures the correctness of our results.
In addition, this study has some advantages in quantifying the impact of climate change and can achieve the purpose of determining the impact of key climate factors on ESV change. Furthermore, our study can quantitatively demonstrate the long-term evolutionary trends and regional differences in grassland ecosystem service value. These can provide a good decision-making basis for the sustainable utilization of grassland resources and climate change adaptation strategies.

5. Conclusions

(1)
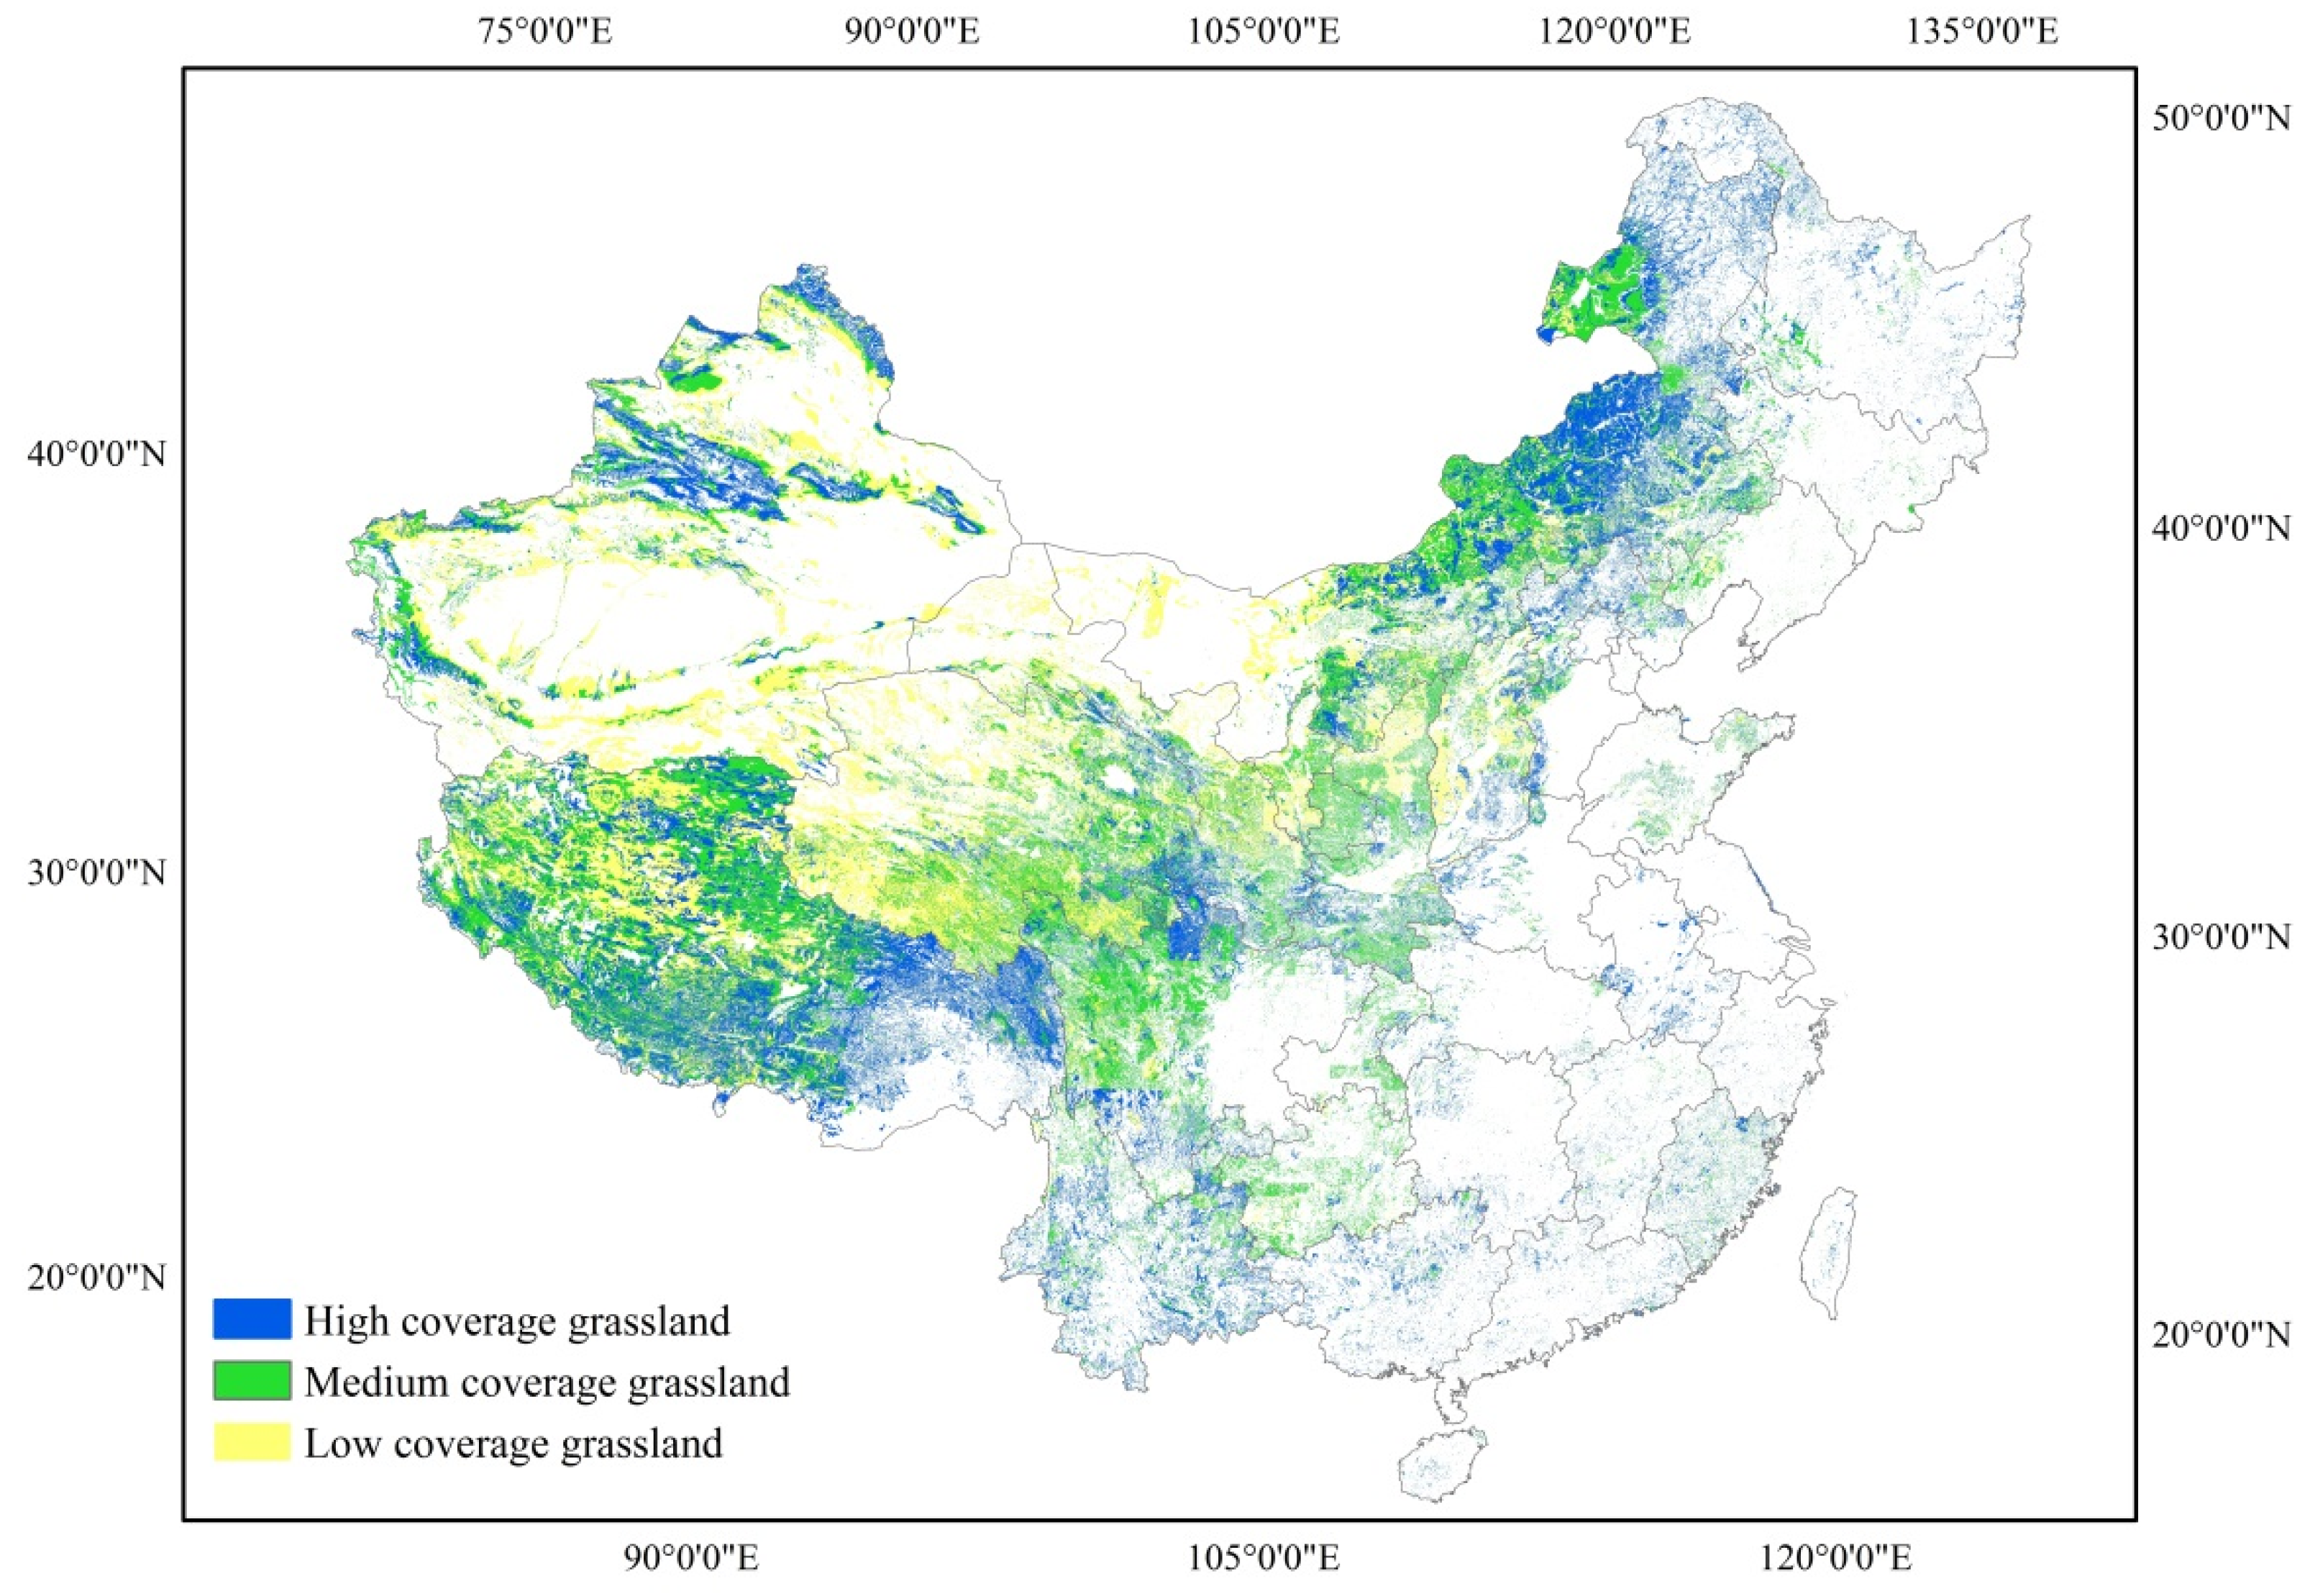
From 2001 to 2020, the average annual grassland ESV in China was 1.37 × 10¹² yuan ($0.18 × 10¹²). The ESV per unit area of grassland increased from northwest to southeast. However, the grassland ESV in northern and western provinces of China was relatively higher and the highest values were more than 10 × 106 yuan ($1.30 × 10⁶).
(2)
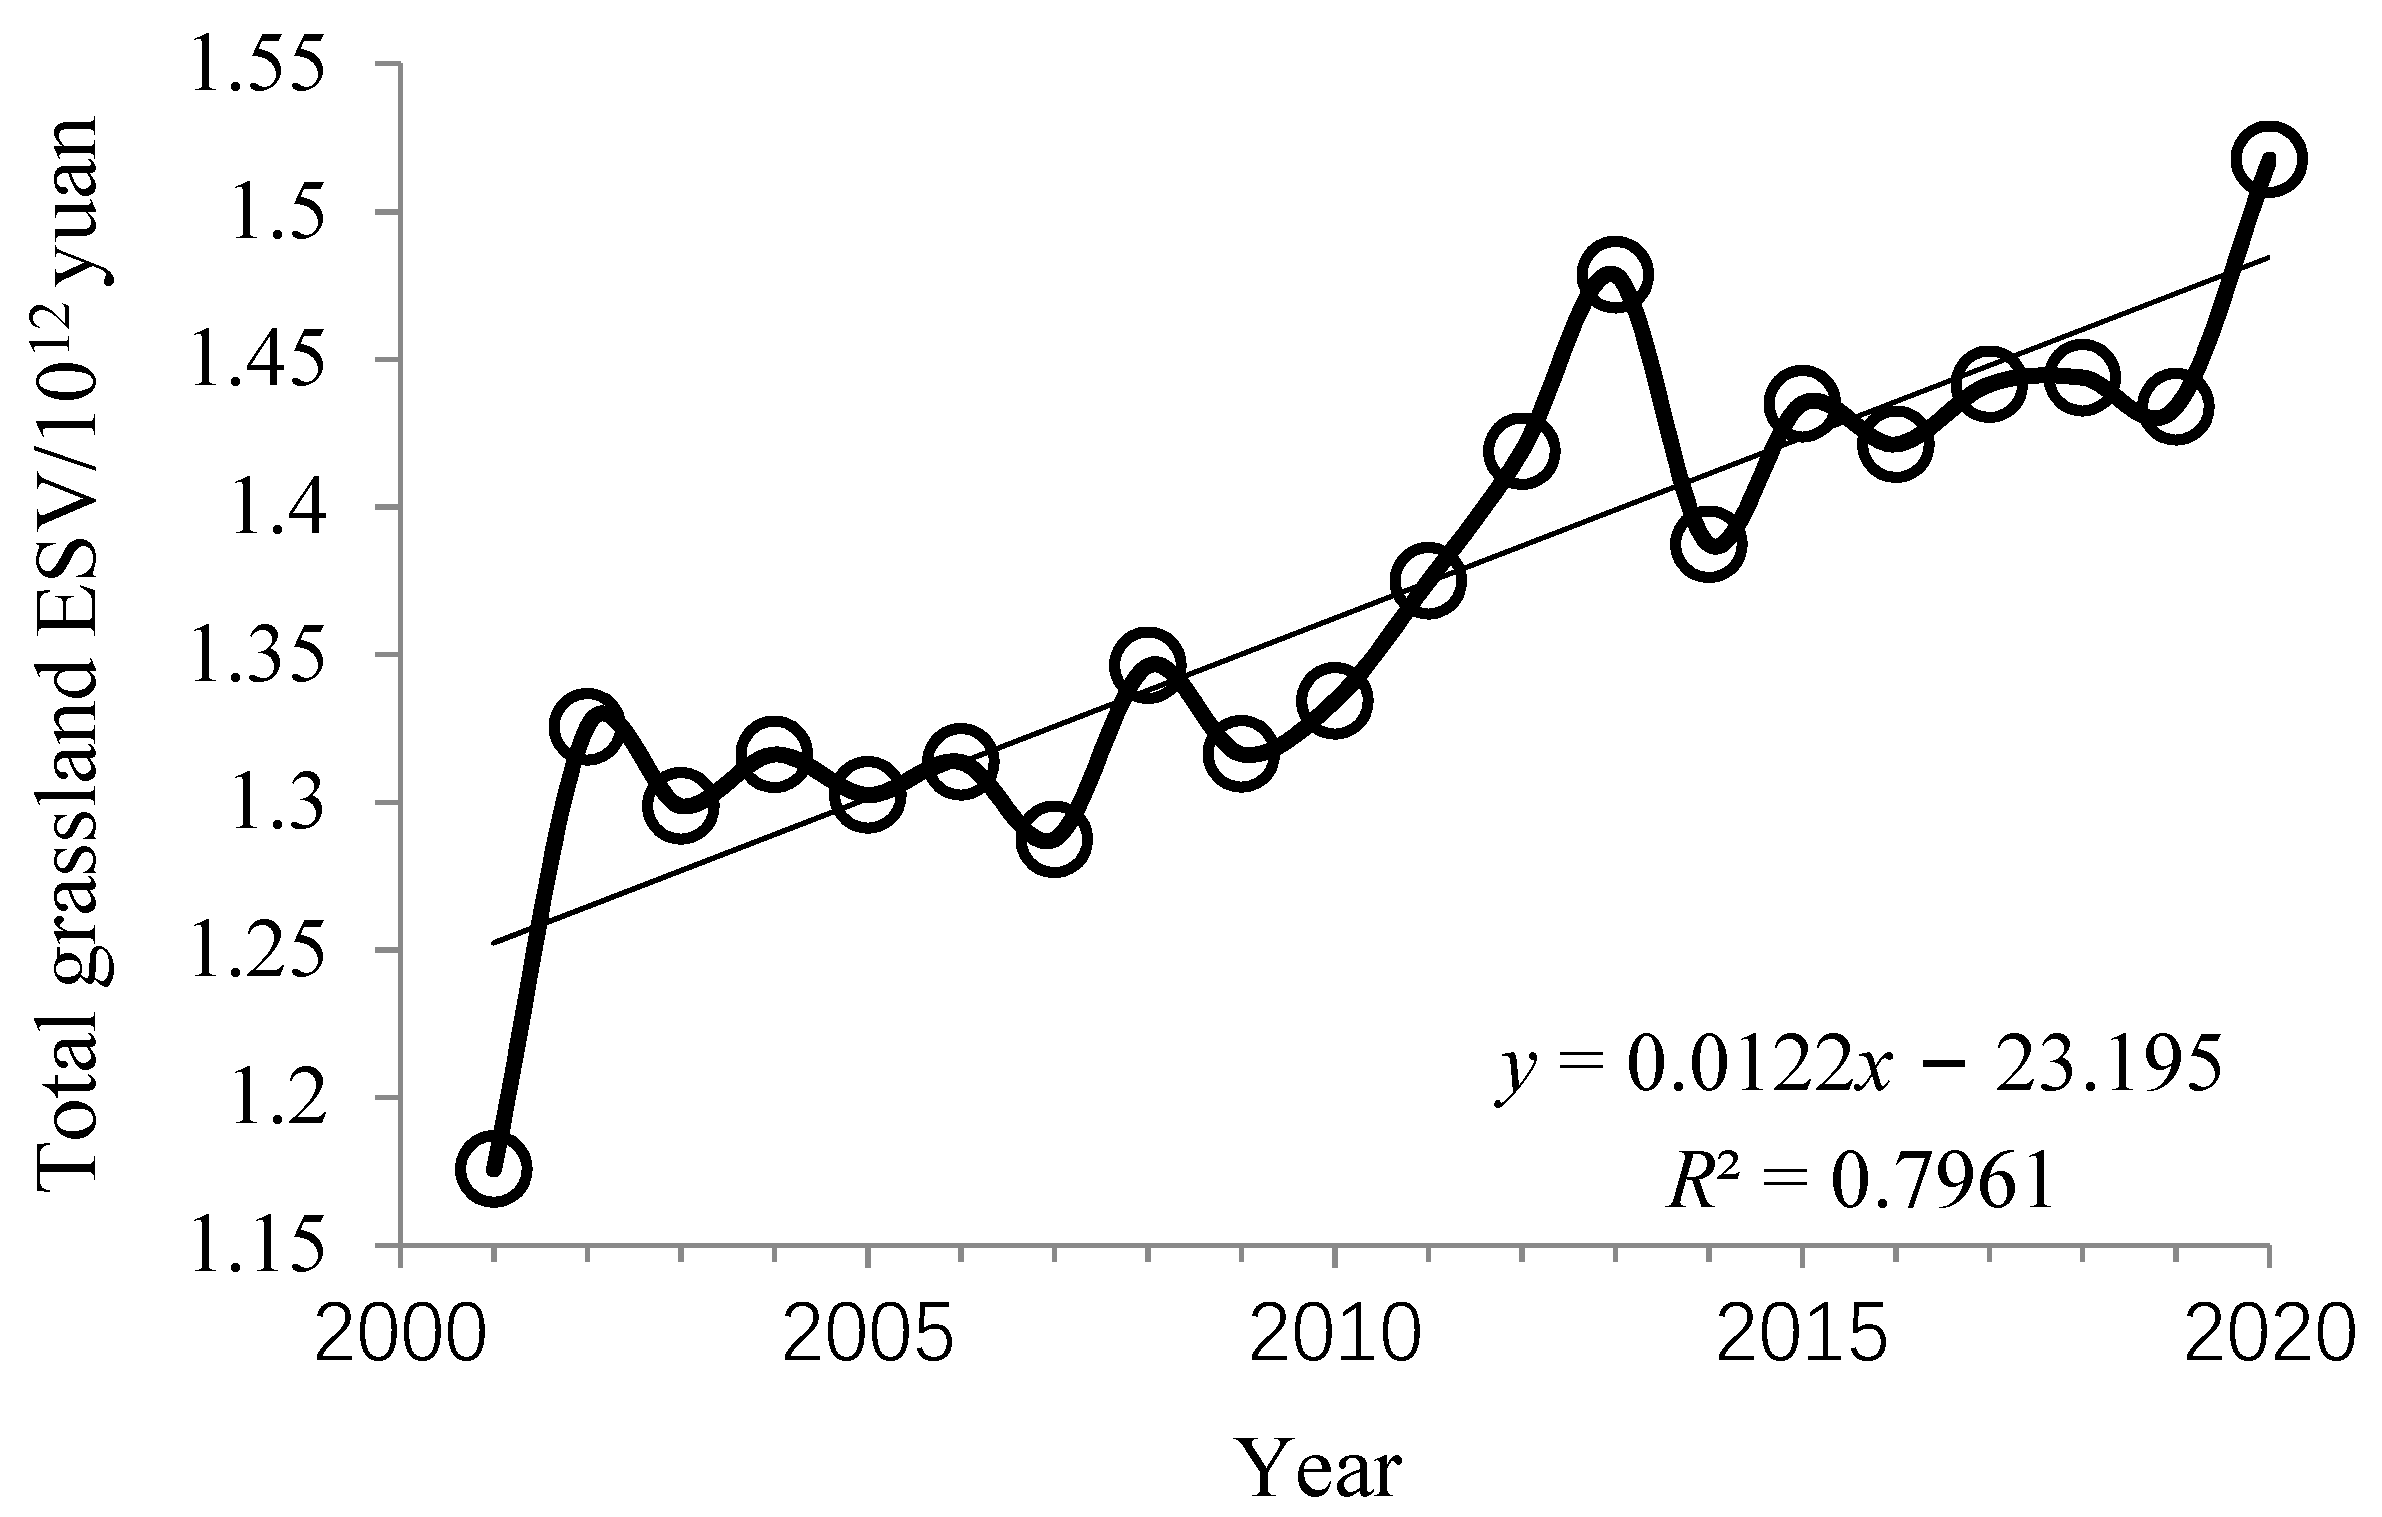
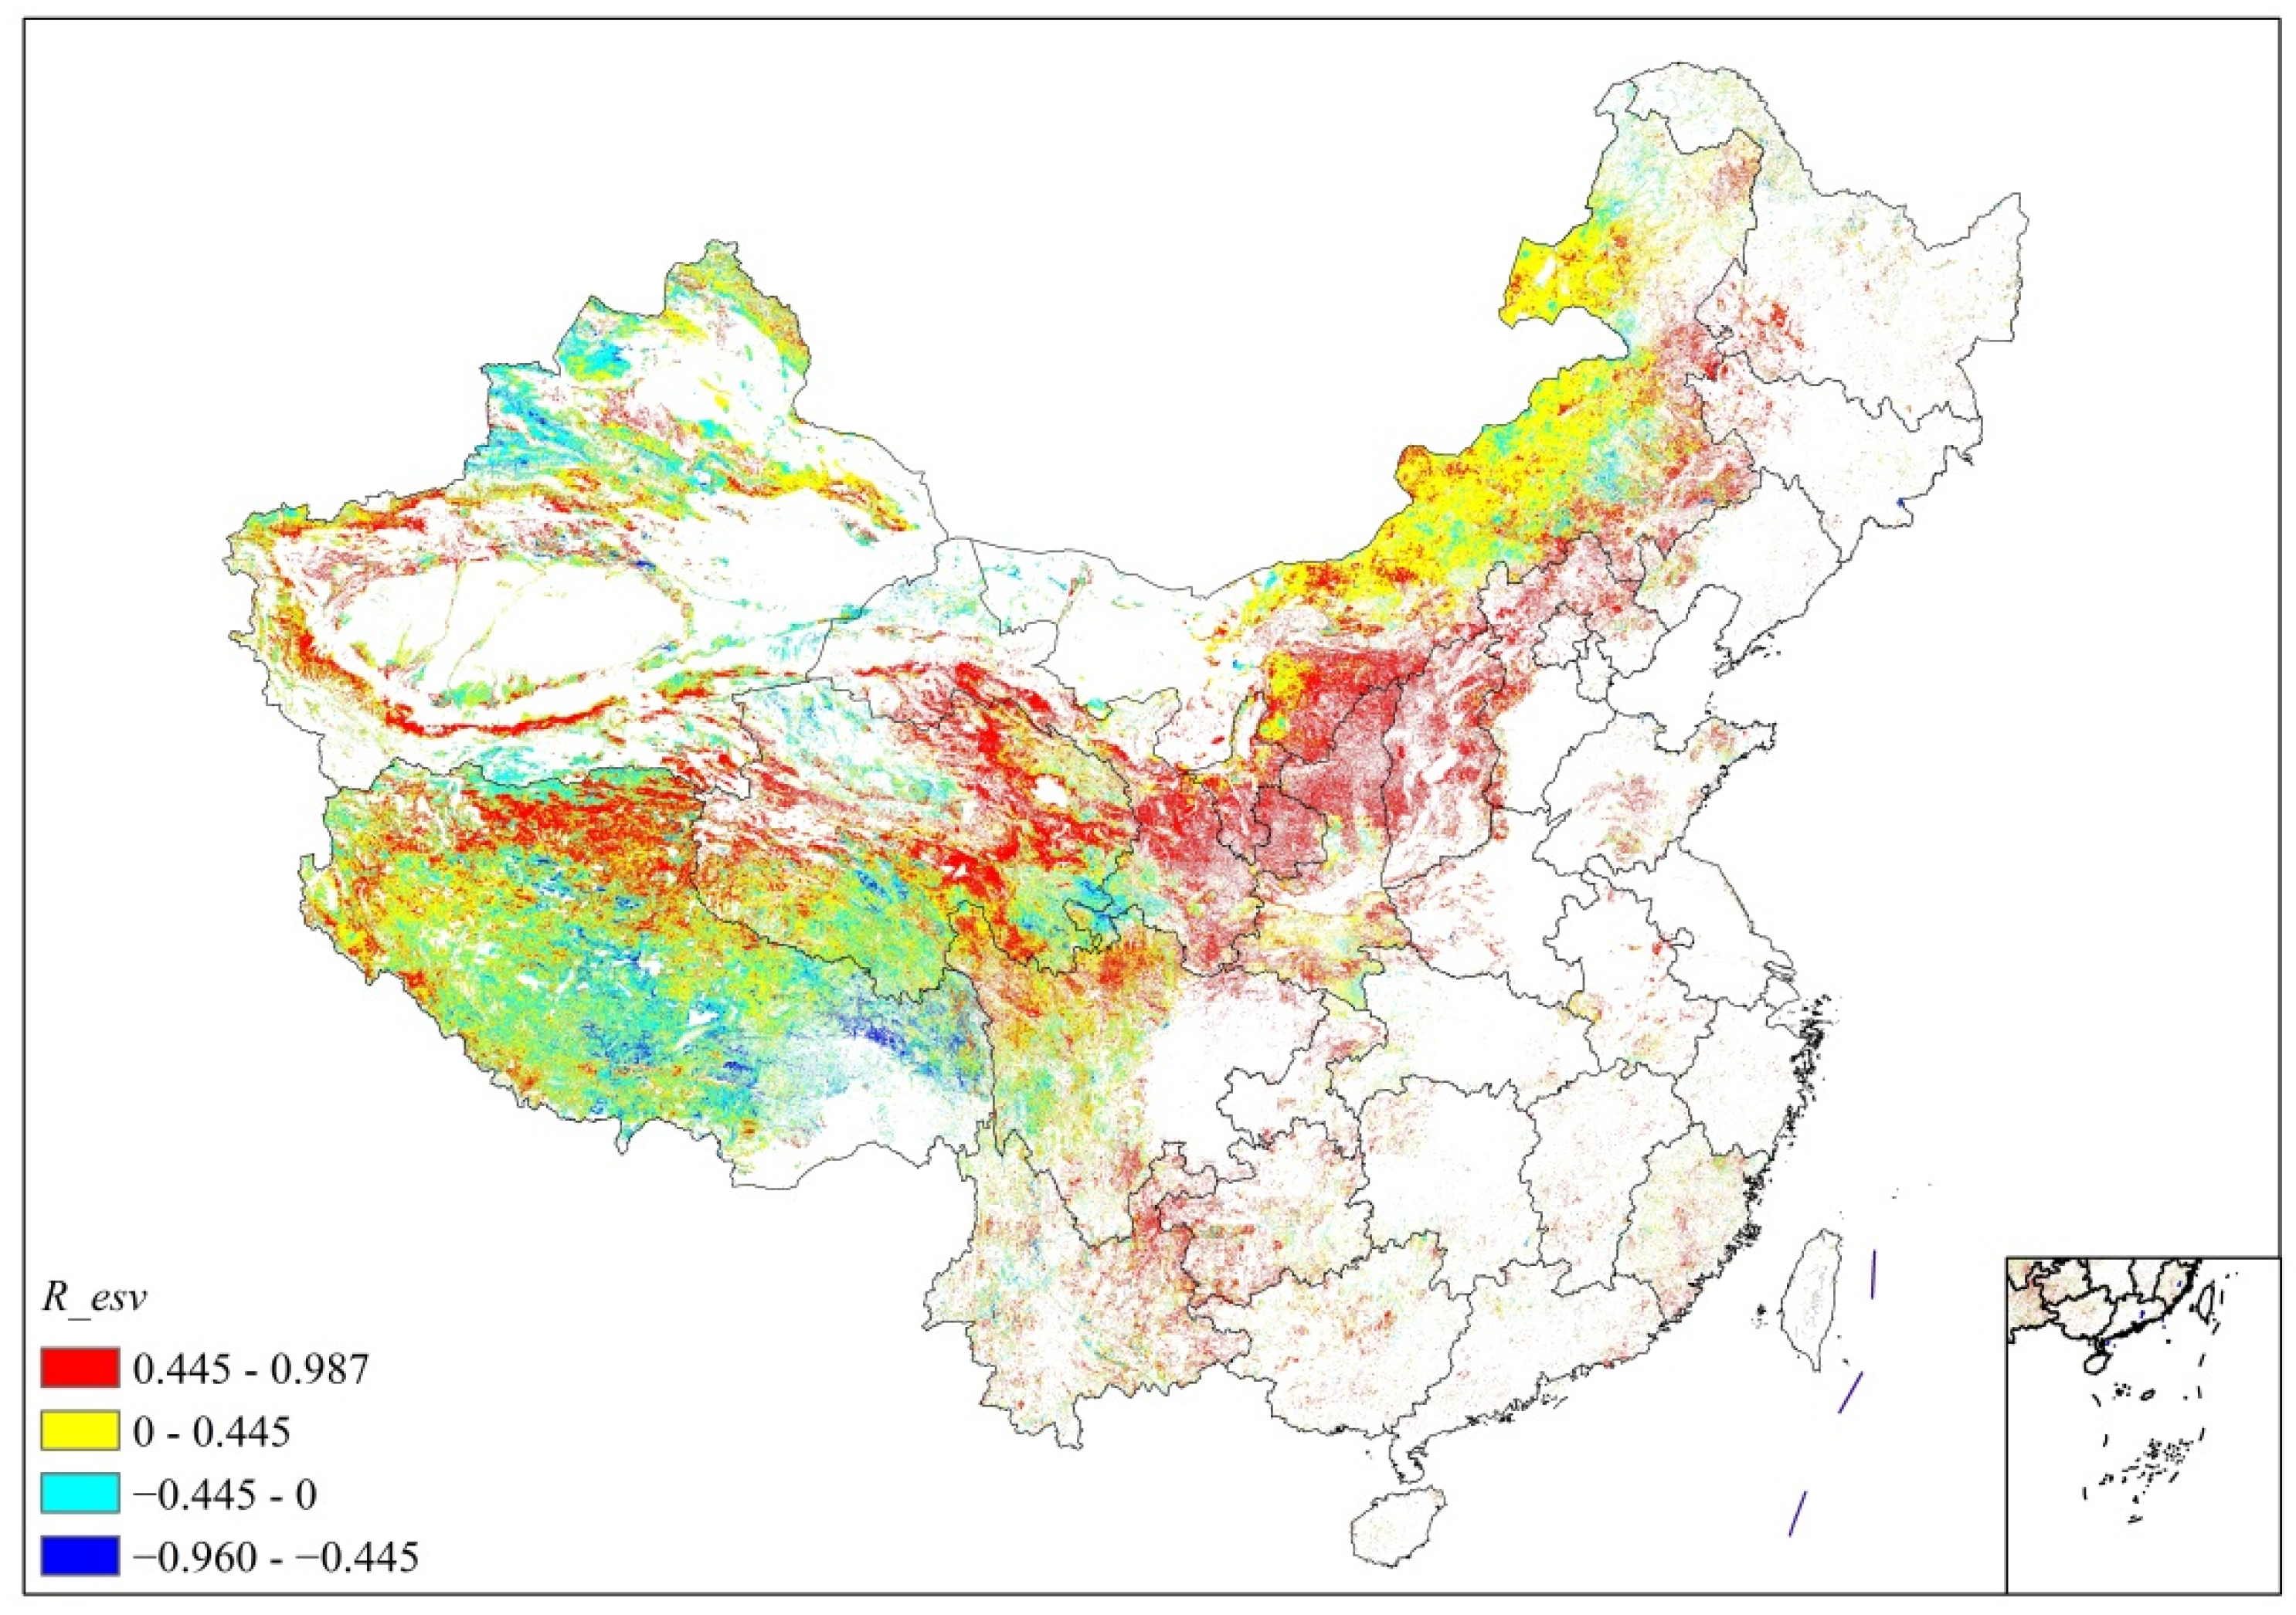
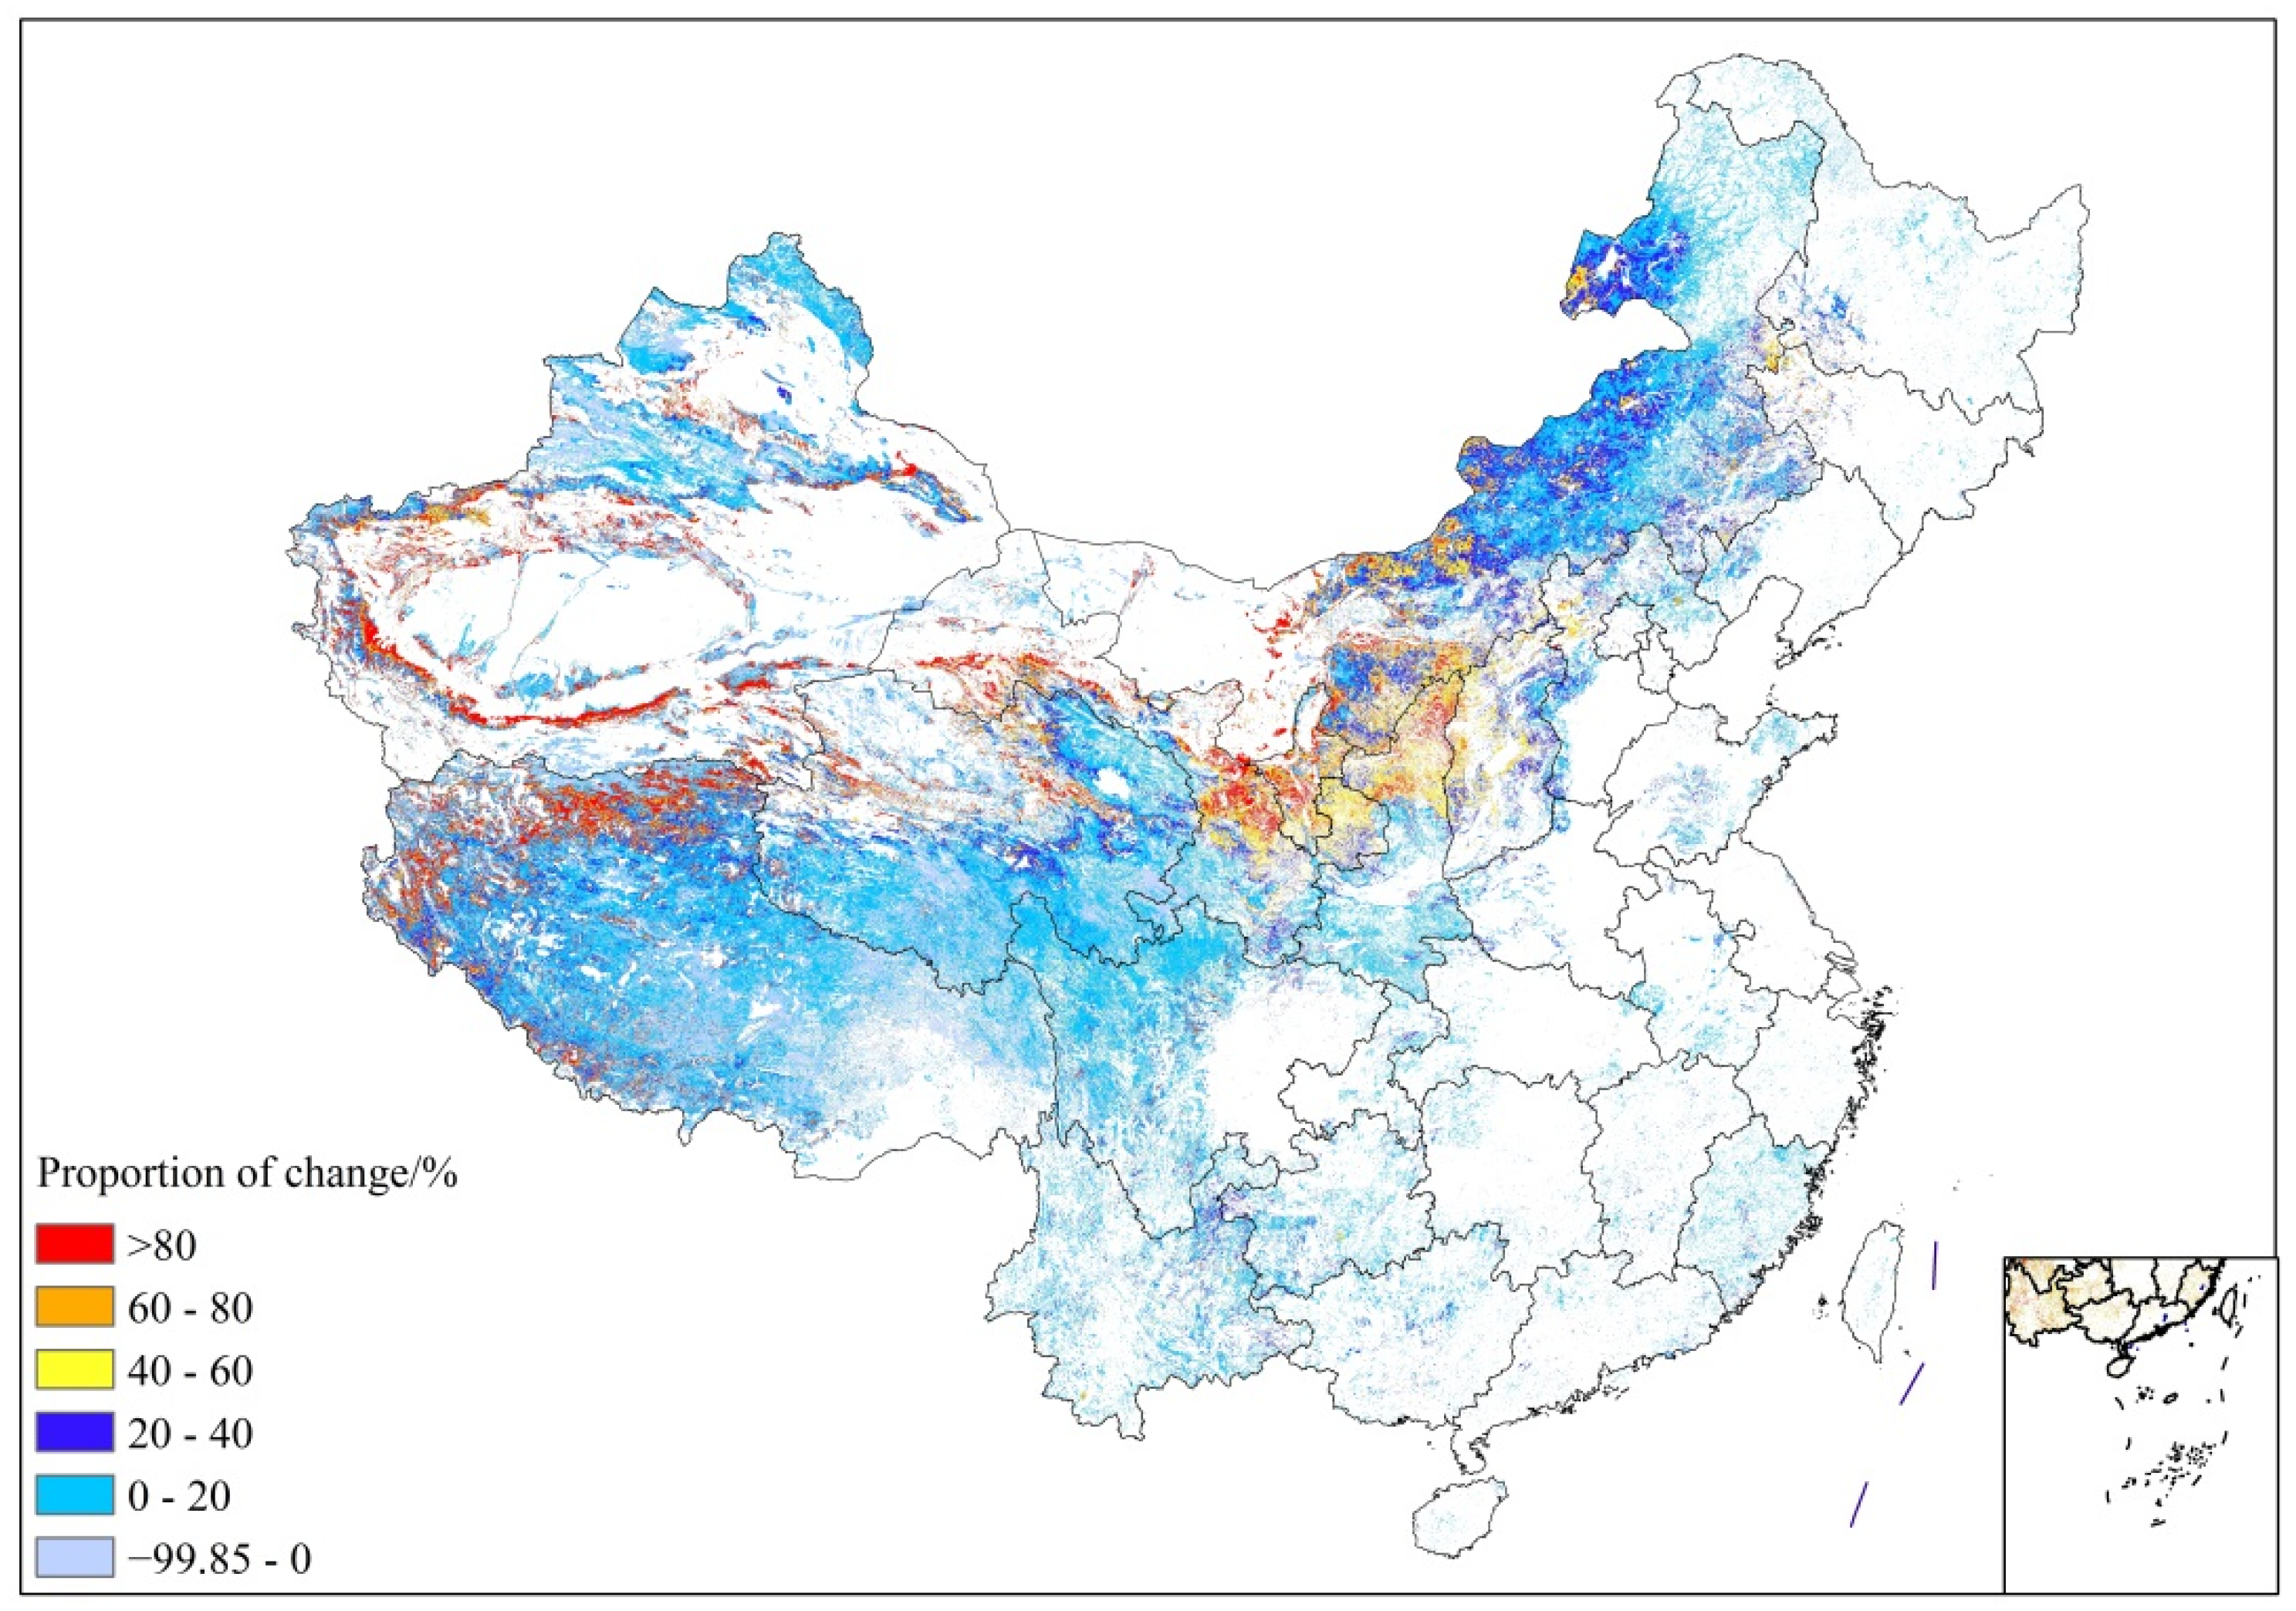
In most grassland areas, ESV has shown an increasing trend in the past 20 years. At the same time, the mean annual ESV was higher (usually less than 20%) in the last 10 years than in the first 10 years. By contrast, ESV has decreased in some grassland areas of Tibet Province and Xinjiang Province.
(3)
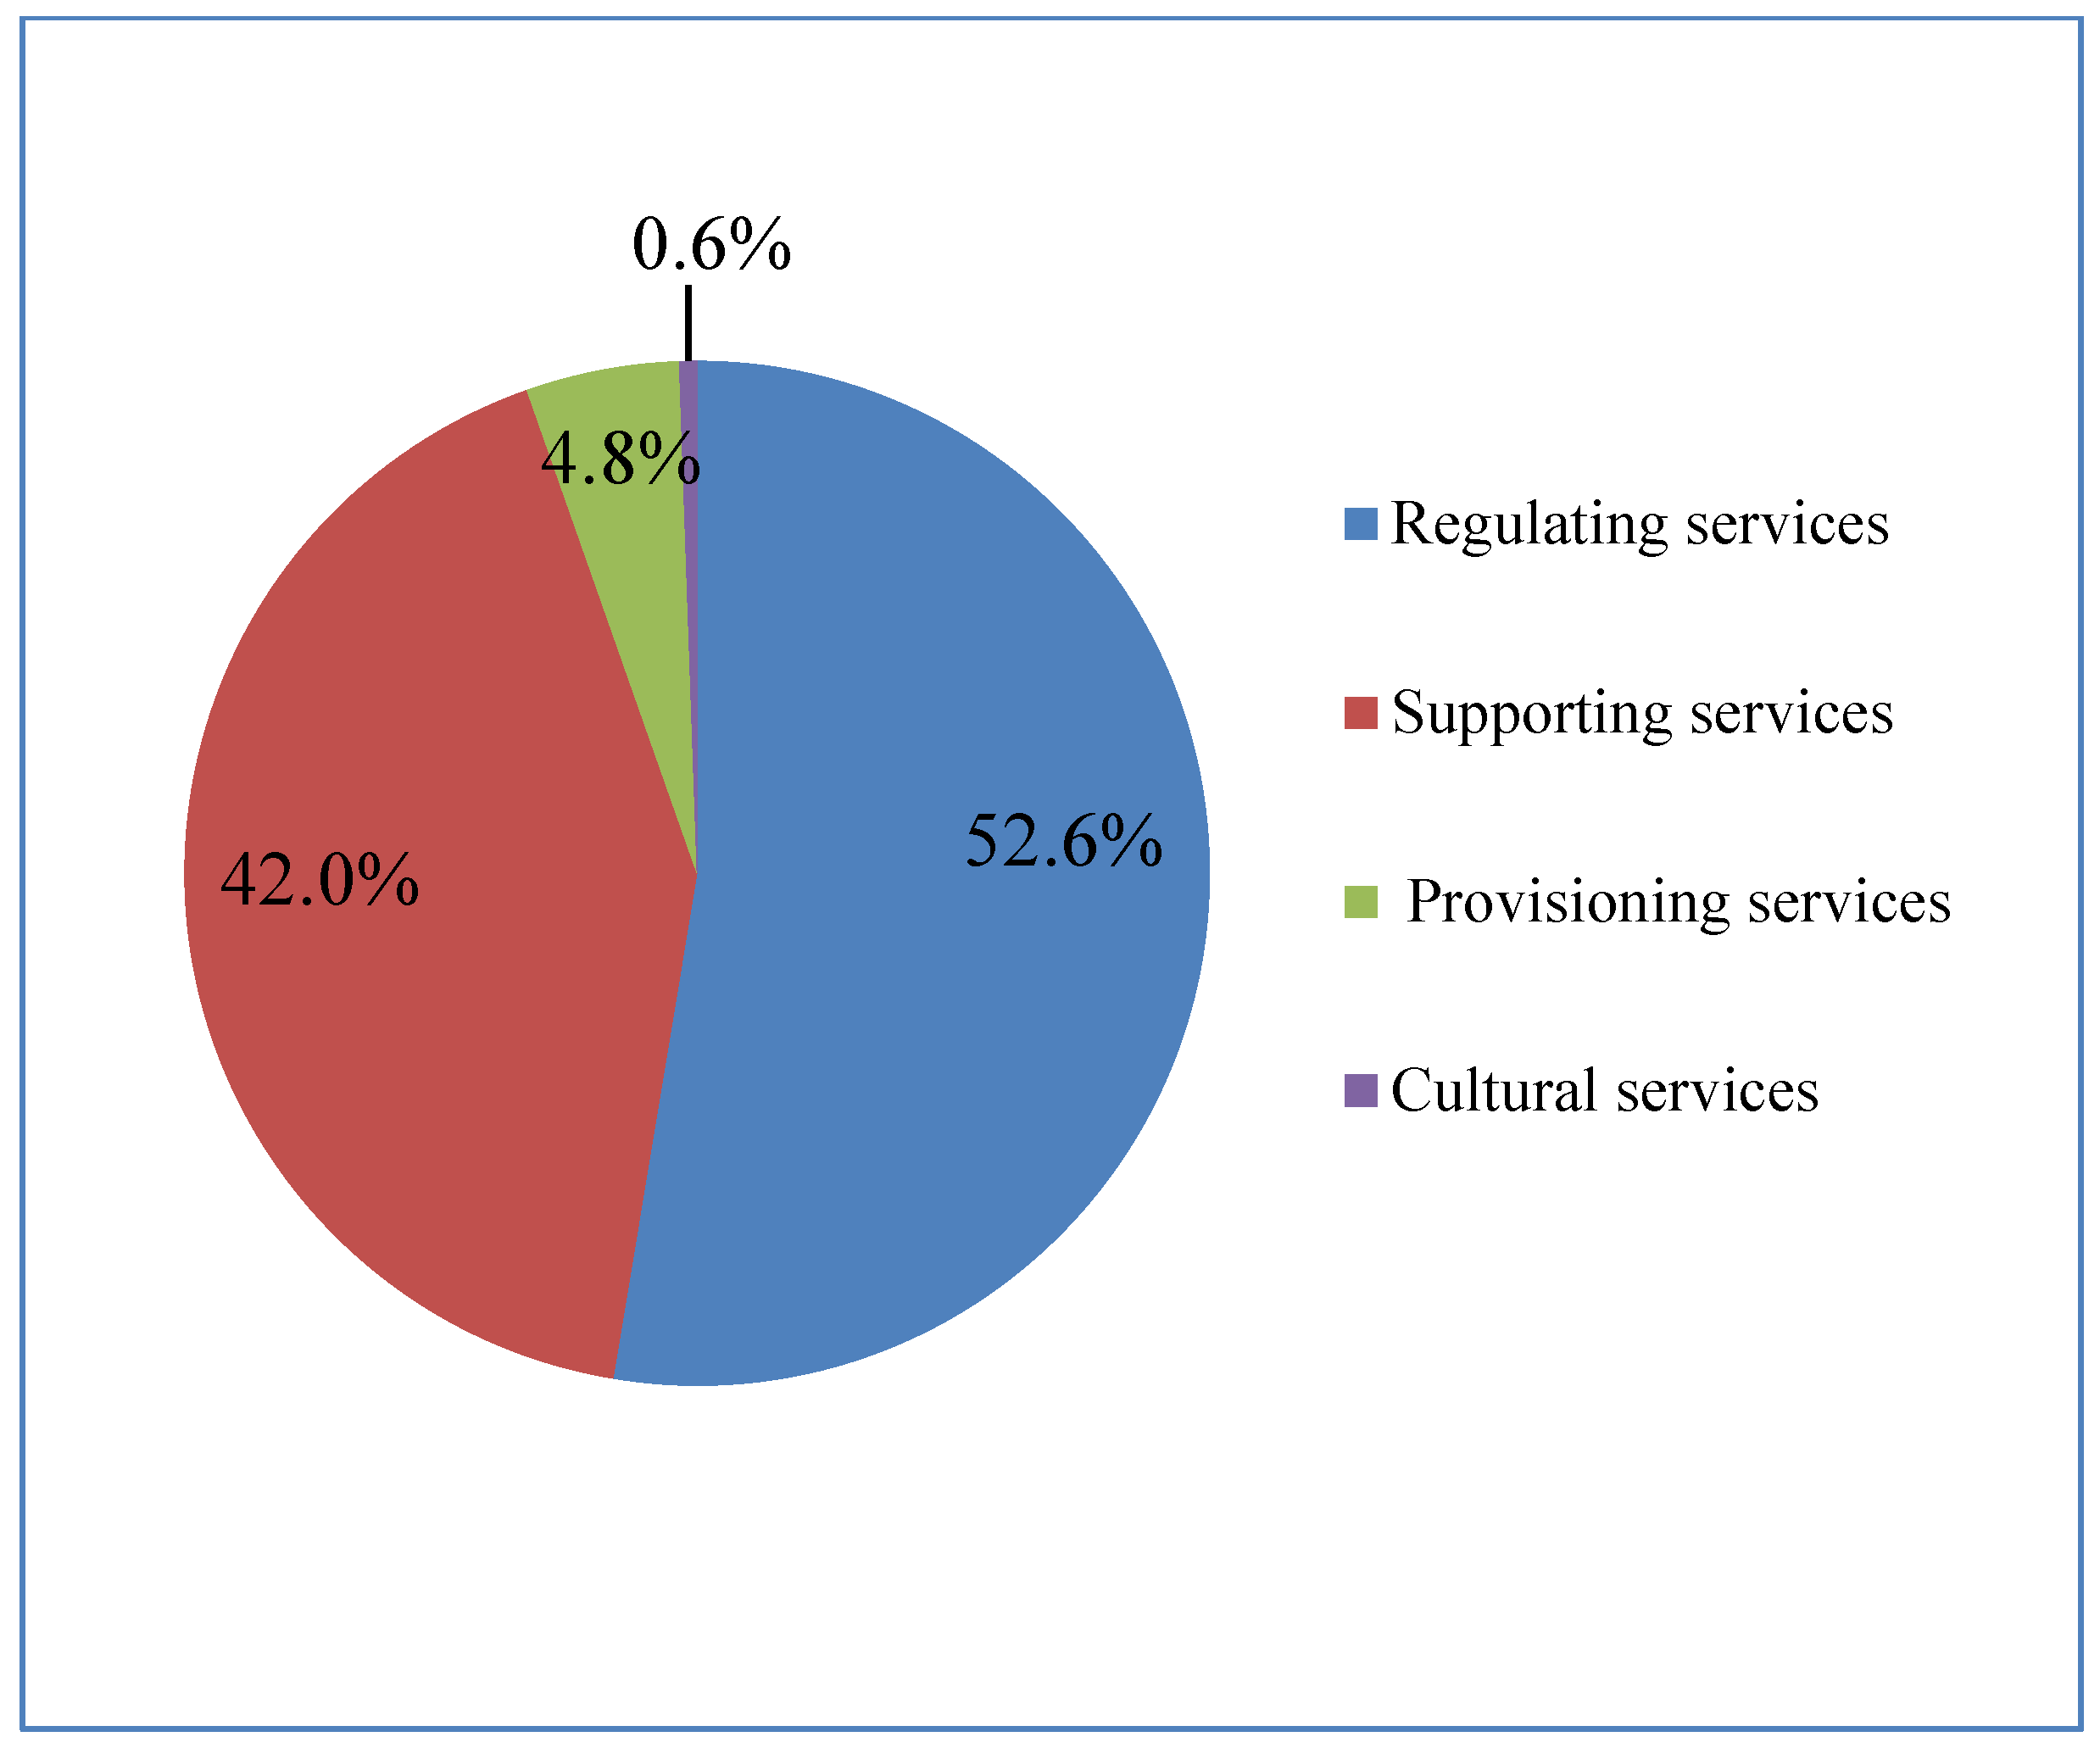
With regard to the four major ecosystem services, regulation service accounted for the largest proportion of 52.6% (0.721 × 10¹² yuan; $938.80 × 10⁸), followed by supporting (42%, 0.575 × 10¹² yuan; $748.70 × 10⁸), provision (4.8%, 0.066 × 10¹² yuan; $85.94 × 10⁸), and cultural (0.6%, 0.008 × 10¹² yuan; $10.42 × 10⁸) services.
(4)
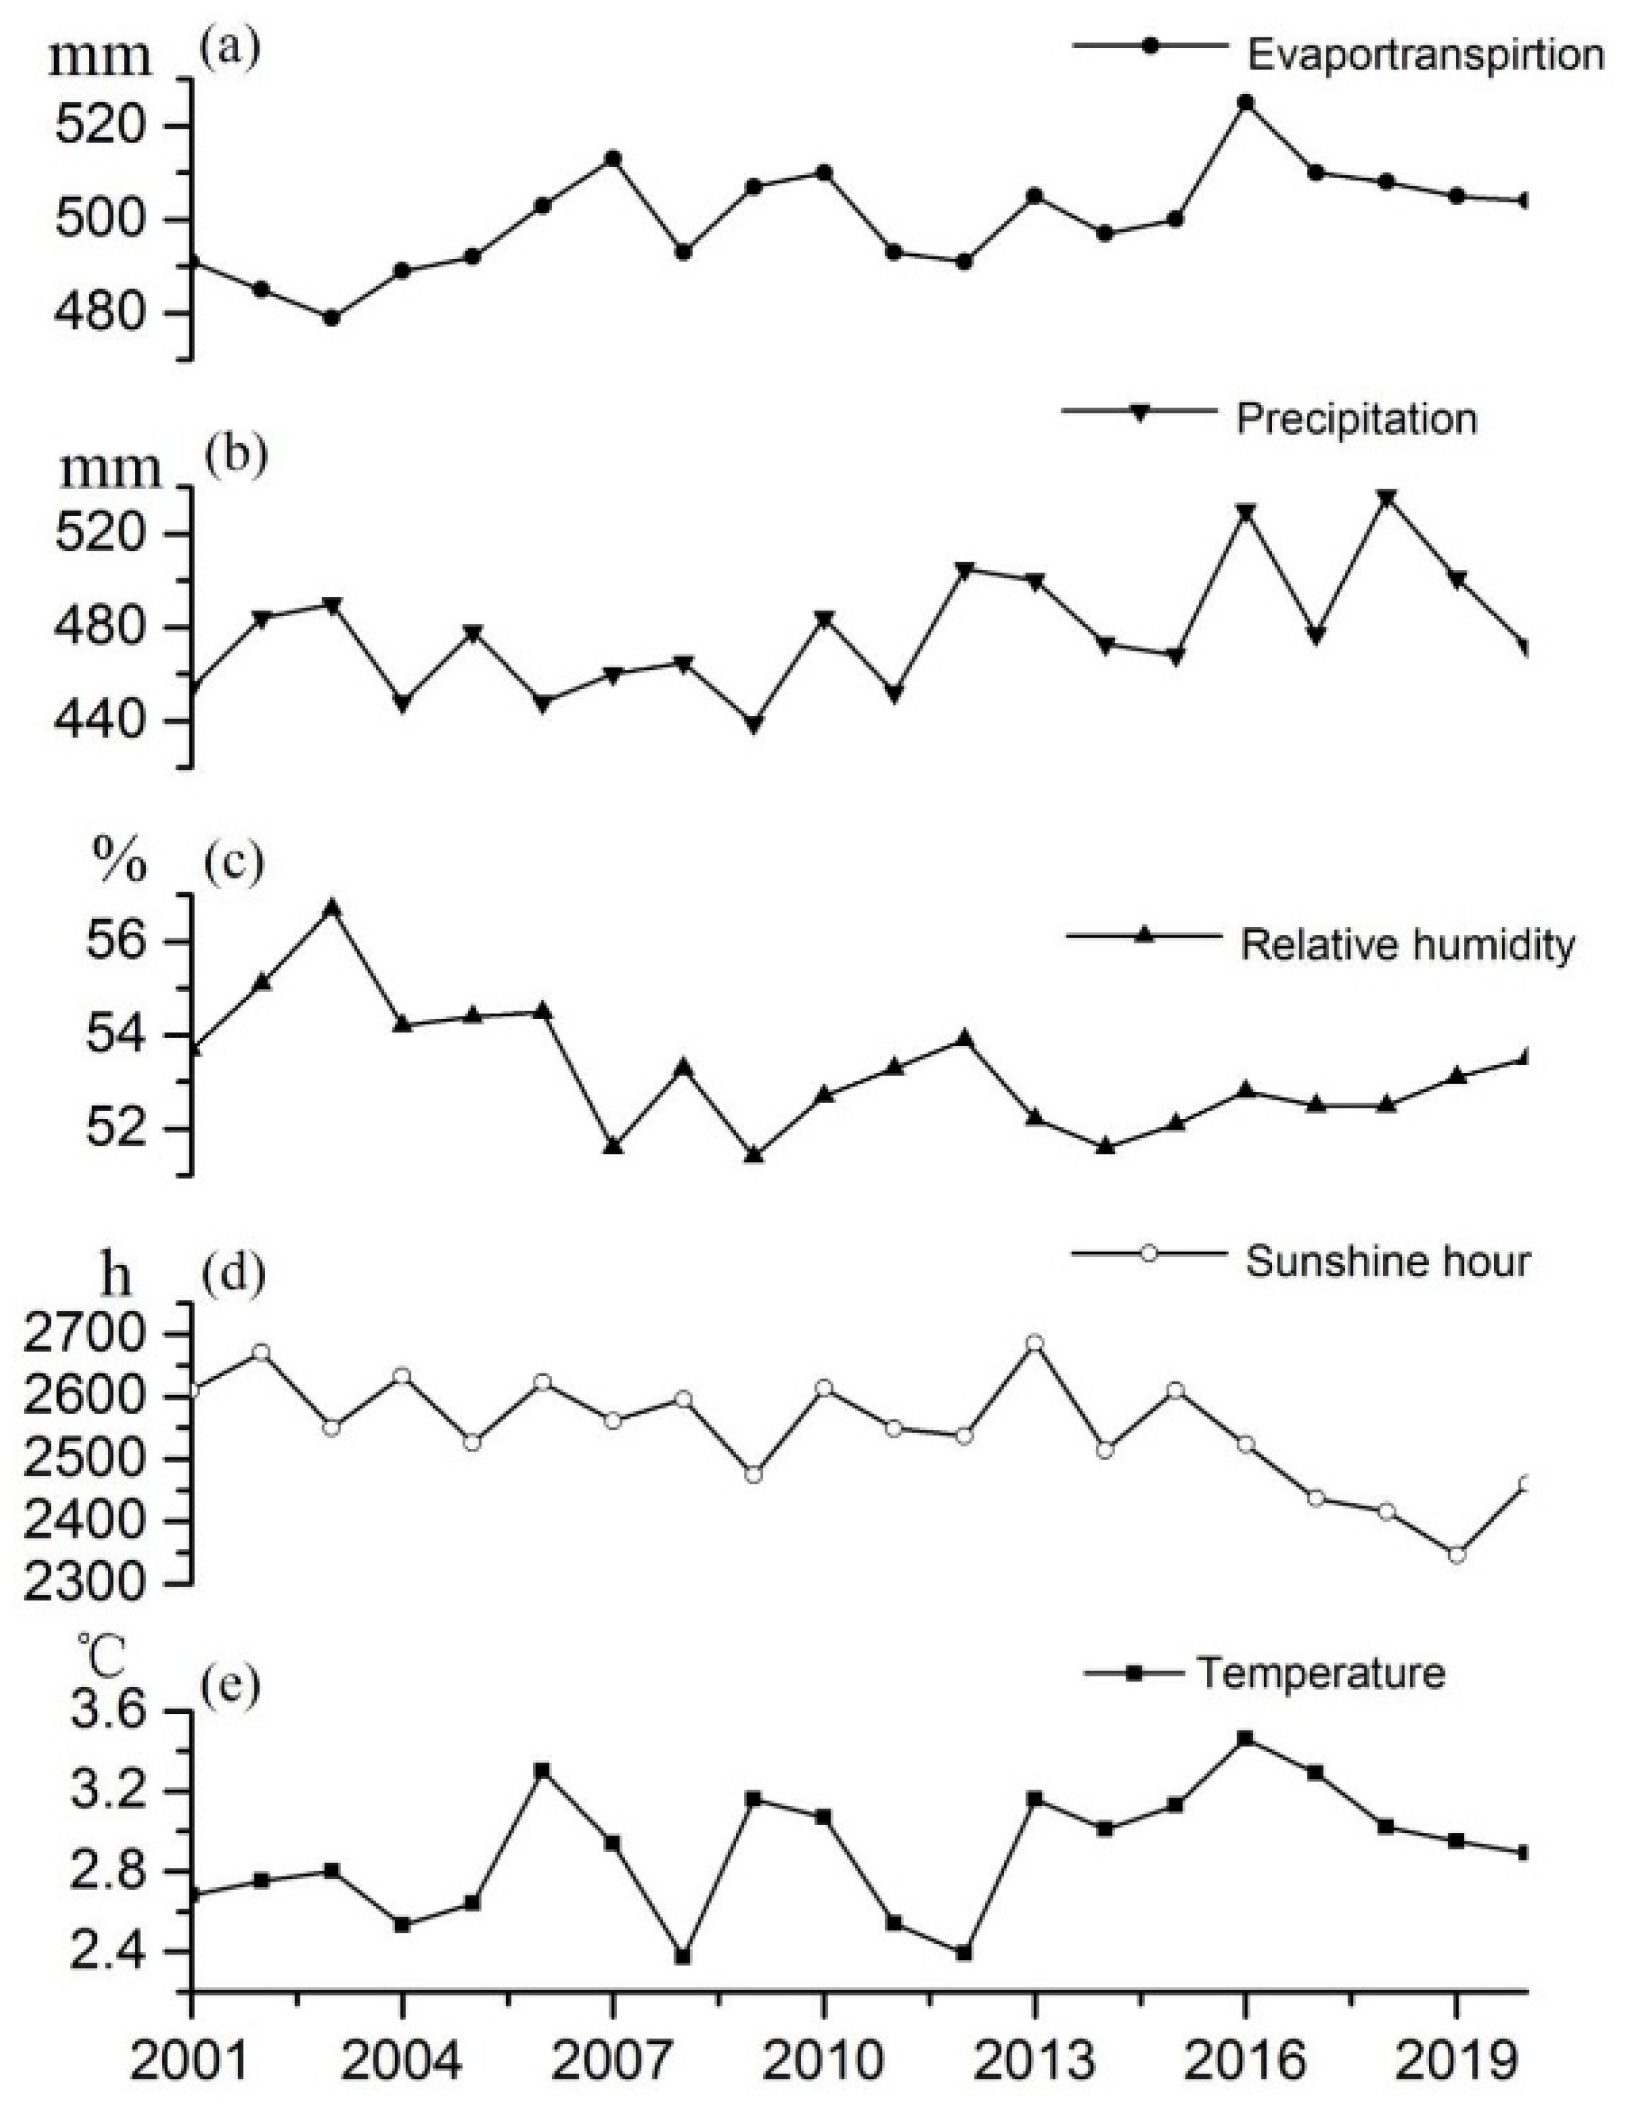
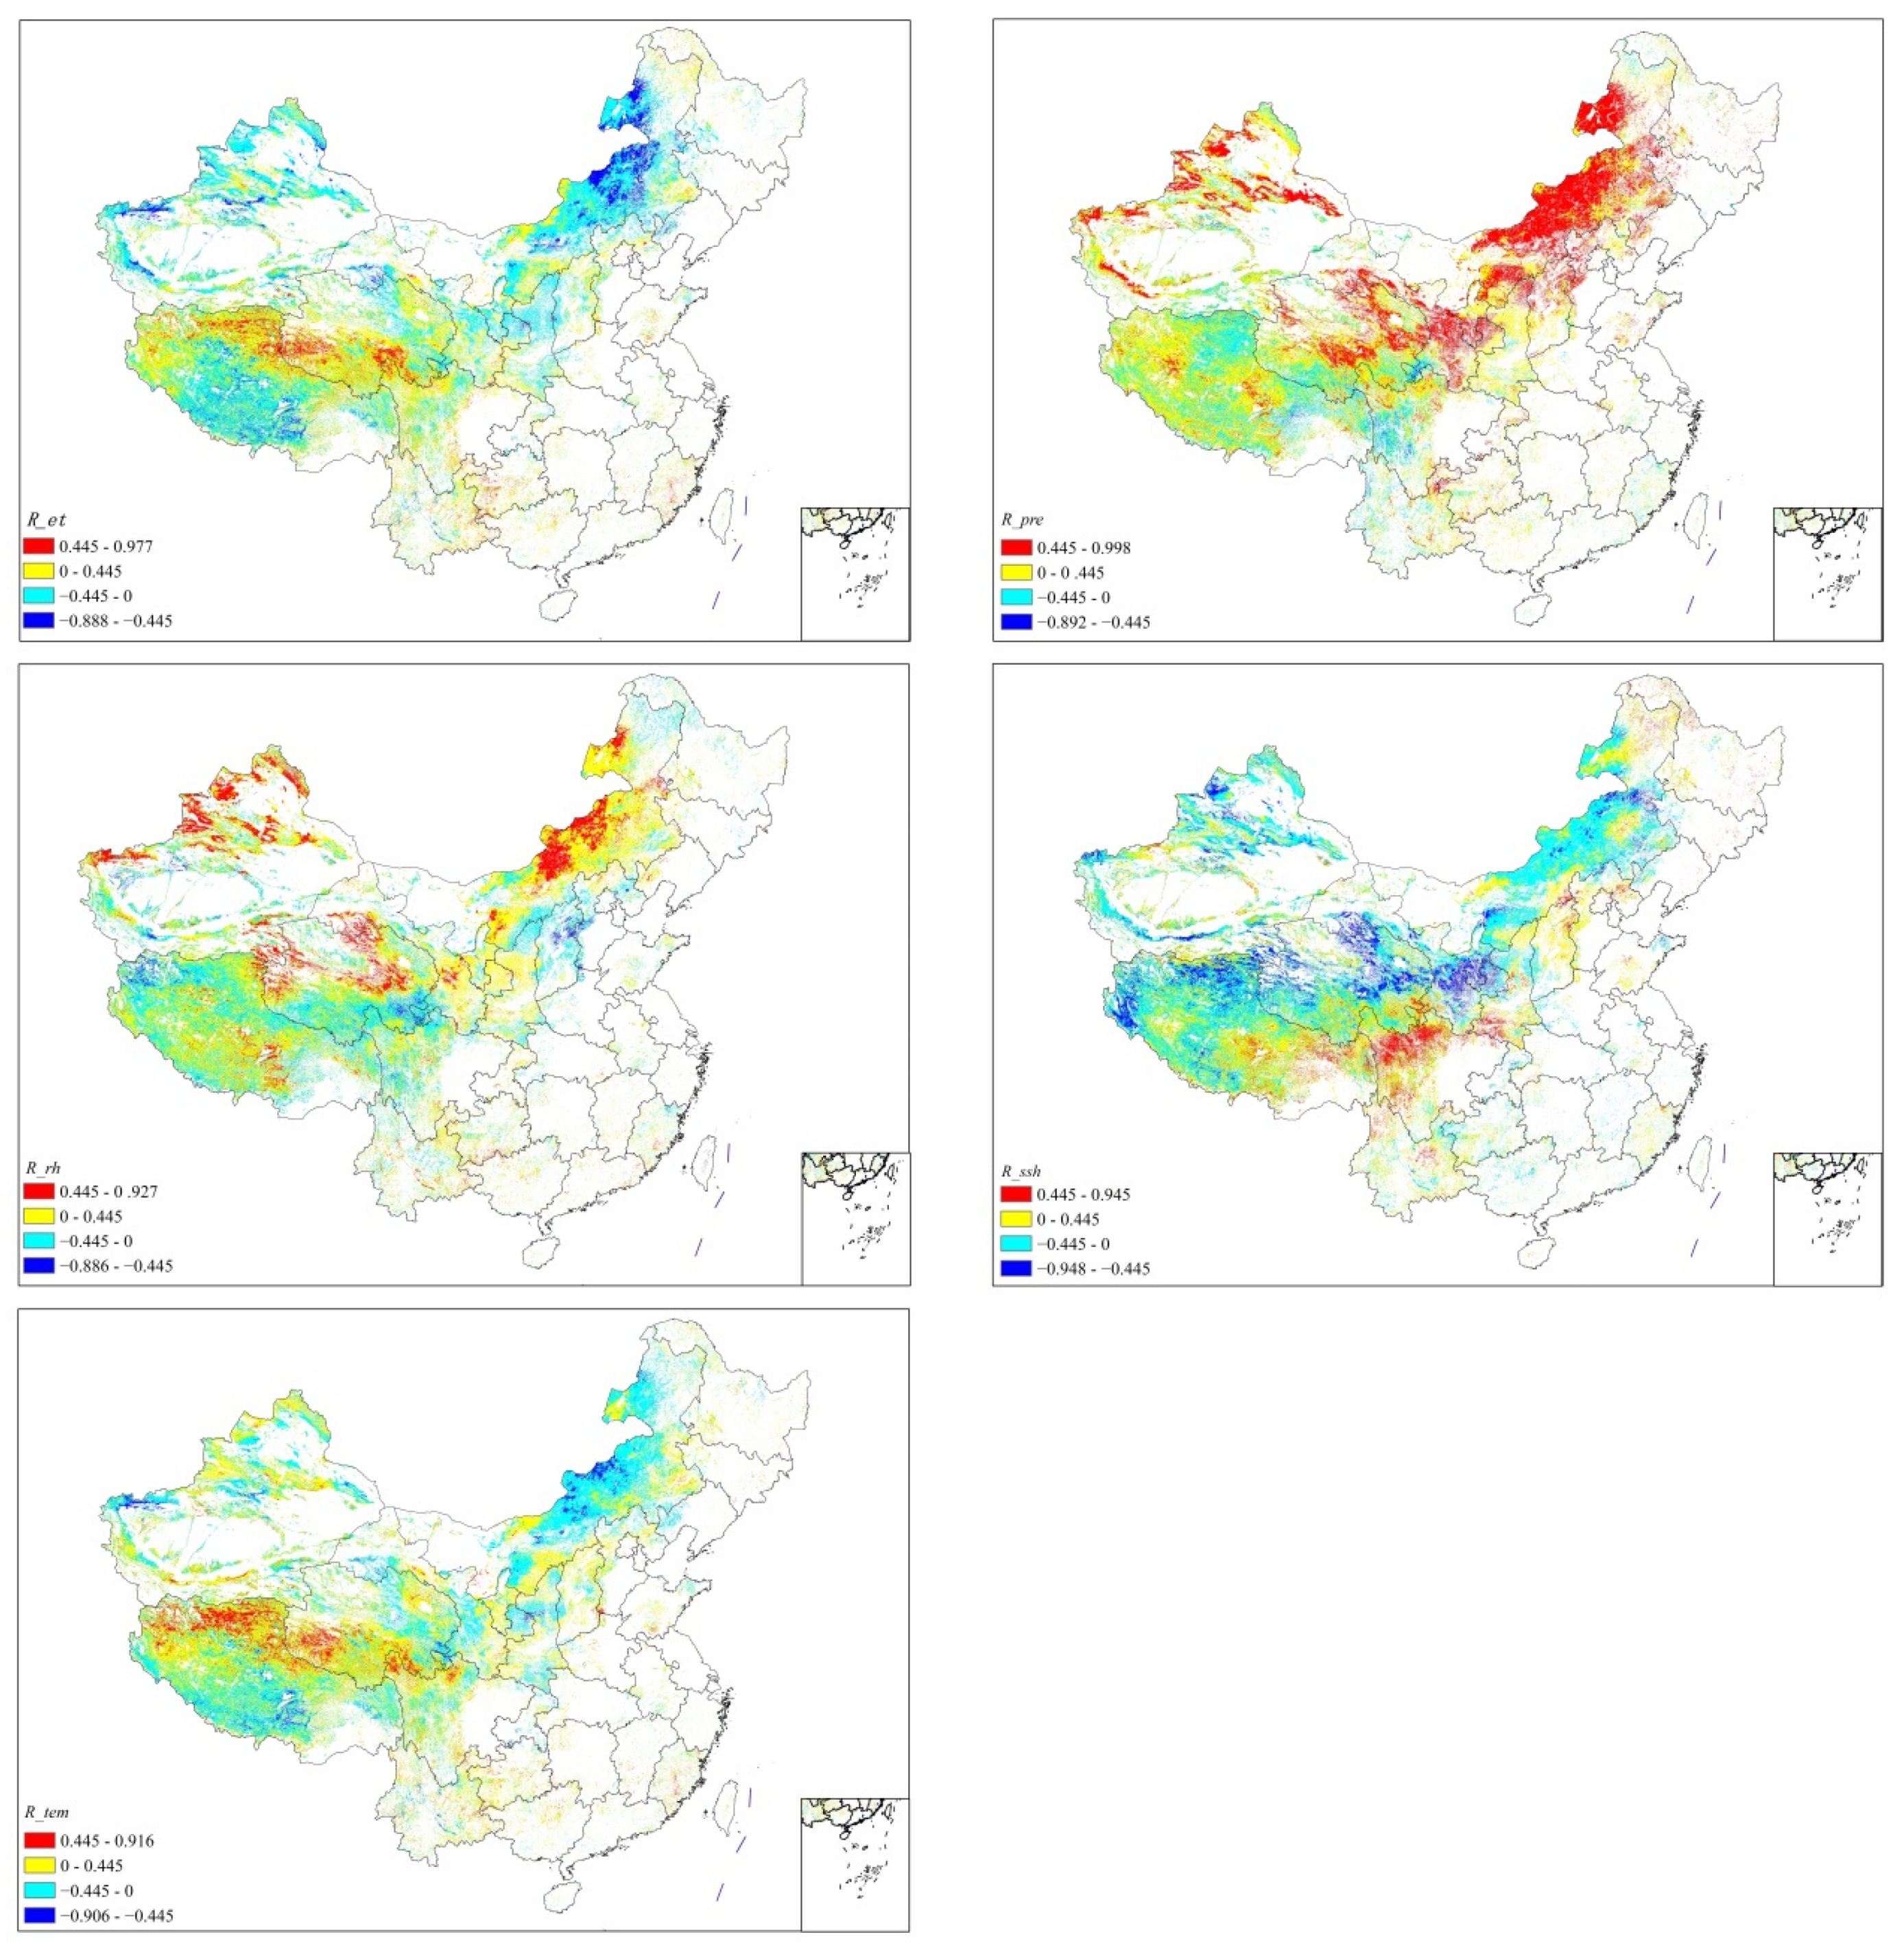
Precipitation was the main regulator of grassland ESV across the 20-year period. It had a positive effect on ESV in 79% of grassland areas. The ESV of grassland was affected by evapotranspiration and sunshine hours to a certain extent, but not by temperature and relative humidity.
All these results indicate that China’s grassland ecosystem service has provided a huge amount of spiritual and material wealth for human beings. In general, the grassland ecosystem has been improved on the whole and is in a stable state, while regional development is unbalanced. Particular attention should be given to the areas with declining ESVs. Climatic factors should be considered in the decisions about adaptation plans. These results can not only provide an important reference for eco-environmental protection and sustainable development policies, but also provide an inclusive and in-depth perspective on the complex socio-ecological relationship between ecosystem management decisions and human development.

Author Contributions

Conceptualization, Y.X.; methodology, Y.X.; formal analysis, Y.X., F.X., Y.L.; investigation, F.X., Y.X.; resources, Y.L., F.X.; data curation, F.X., Y.X.; writing—original draft preparation, Y.X.; writing—review and editing, Y.X.; visualization, Y.L.; supervision, Y.L.; project administration, Y.L.; funding acquisition, Y.L. All authors have read and agreed to the published version of the manuscript.

Funding

This research was funded by the National Key Research and Development Program of China (grant no. 2018YFA0606300).

Institutional Review Board Statement

Not applicable.

Informed Consent Statement

Not applicable.

Data Availability Statement

Data are available from the authors upon reasonable request as the data needs further use.

Acknowledgments

We would like to thank the staff of the National Climate Center of the China Meterological Administration (CMA) for providing some climate data and Liu Qiufeng for processing some data. We appreciate the critical and constructive comments from three anonymous reviewers.

Conflicts of Interest

The authors declare that they have no known competing financial interest or personal relationships that could have appeared to influence the work reported in this paper.

References

  1. Costanza, R.; d’Arge, R.; de Groot, R.; Farber, S.; Grasso, M.; Hannon, B.; Limburg, K.; Naeem, S.; O’Neill, R.V.; Paruelo, J.; et al. The value of the world’s ecosystem services and natural capital. World Environ. 1997, 387, 3–15. [Google Scholar] [CrossRef]
  2. Millennium Ecosystem Assessment. Ecosystems and Human Well-Being: Synthesis; Island Press: Washington, DC, USA, 2005; p. 137. [Google Scholar]
  3. Haines, Y.R.; Potschin, M. Common International Classification of Ecosystem Services (CICES): 2011 Update; University of Nottingham: Nottingham, UK, 2011; pp. 1–13. [Google Scholar]
  4. Haines, Y.R.; Potschin, M. Common International Classification of Ecosystem Services (CICES, Version 4.1); European Environment Agency: Copenhagen, Denmark, 2012; pp. 1–17.
  5. Costanza, R.; de Groot, R.; Sutton, P.; van der Ploeg, S.; Anderson, S.J.; Kubiszewski, I.; Farber, S.; Turner, R.K. Changes in the global value of ecosystem services. Glob. Environ. Chang. 2014, 26, 152–158. [Google Scholar] [CrossRef]
  6. Cowie, A.L.; Orr, B.J.; Sanchez, V.M.C.; Chasek, P.; Crossman, N.D.; Erlewein, A.; Louwagie, G.; Cumming, G.S.; Buerkert, A.; Hoffmann, E.M.; et al. Implications of agricultural transitions and urbanization for ecosystem services. Nature 2014, 515, 50–57. [Google Scholar] [CrossRef]
  7. Schaller, L.; Targetti, S.; Villanueva, A.J.; Zasada, I.; Viaggi, D. Agricultural landscapes, ecosystem services, and regional competitiveness-assessing drivers and mechanisms in nine European case study areas. Land Use Policy 2018, 76, 735–745. [Google Scholar] [CrossRef]
  8. Chen, J.; Jiang, B.; Bai, Y.; Xu, X.; Alatalo, J.M. Quantifying ecosystem services supply and demand shortfalls and mismatches for management optimisation. Sci. Total Environ. 2019, 650, 1426–1439. [Google Scholar] [CrossRef]
  9. IPCC. Climate Change 2014: Impacts, Adaptation, and Vulnerability. Part A: Global and Sectoral Aspects; Contribution of Working Group II to the Fifth Assessment Report of the Intergovernmental Panel on Climate Change; Field, C.B., Barros, V., Mastrandrea, M.D., Mach, K.J., Abdrabo, M., Adger, W.N., Anokhin, Y.A., Anisimov, O.A., Arent, D., Barnett, J., et al., Eds.; Cambridge University Press: Cambridge, UK, 2014; p. 1132.
  10. Lyu, R.; Clarke, K.C.; Zhang, J.; Feng, J.; Jia, X.; Li, J. Spatial correlations among ecosystem services and their socio-ecological driving factors: A case study in the city belt along the Yellow River in Ningxia, China. Appl. Geogr. 2019, 108, 64–73. [Google Scholar] [CrossRef] [Green Version]
  11. Li, G.; Ren, H. Biomass and net primary productivity of the forests in different climatic zones of china. Trop. Geogr. 2004, 24, 306–310. (In Chinese) [Google Scholar] [CrossRef] [Green Version]
  12. Xu, Y.; Yu, L.; Zhou, B.; Shi, Y.; Xu, Y. Temporal-spatial dynamic pattern of grassland ecosystem service value under the background of climate change in the future in China. Ecol. Environ. Sci. 2017, 26, 1649–1658. (In Chinese) [Google Scholar]
  13. Han, X.; Yu, J.; Shi, L.; Zhao, X.; Wang, J. Spatiotemporal evolution of ecosystem service values in an area dominated by vegetation restoration: Quantification and mechanisms. Ecol. Indic. 2021, 131, 108191. [Google Scholar] [CrossRef]
  14. Schirpke, U.; Kohler, M.; Leitinger, G.; Fontana, V.; Tasser, E.; Tappeiner, U. Future impacts of changing land-use and climate on ecosystem services of mountain grassland and their resilience. Ecosyst. Serv. 2017, 26, 79–94. [Google Scholar] [CrossRef]
  15. Zhou, H.; Zhao, X.; Tang, Y.; Gu, S.; Zhou, L. Alpine grassland degradation and its control in the source region of the Yangtze and Yellow Rivers, China. Grassl. Sci. 2005, 51, 191–203. [Google Scholar] [CrossRef]
  16. Yang, Q.; Liu, G.; Giannetti, B.G.; Agostinho, F.; Cecília, M.V.B.; Casazzad, M.C. Emergy-based ecosystem services valuation and classification management applied to China’s grasslands. Ecosyst. Serv. 2020, 42, 101073. [Google Scholar] [CrossRef]
  17. Zheng, X.; Zhang, J. Net value of grassland ecosystem services in mainland China. Land Use Policy 2018, 79, 94–101. [Google Scholar] [CrossRef]
  18. Harris, R.B. Rangeland degradation on the Qinghai-Tibetan plateau: A review of the evidence of its magnitude and causes. J. Arid Environ. 2010, 74, 1–12. [Google Scholar] [CrossRef]
  19. Seto, K.C.; Michail, F.; Burak, G.; Reilly, M.K. A meta-analysis of global urban land expansion. PLoS ONE 2011, 6, e23777. [Google Scholar] [CrossRef]
  20. Gang, C.; Zhou, W.; Chen, Y.; Wang, Z.; Sun, Z.; Li, J.; Qi, J.; Odeh, I. Quantitative assessment of the contribution of climate change and human activities on global grassland degradation. Environ. Earth Sci. 2014, 72, 4273–4282. [Google Scholar] [CrossRef]
  21. Wang, Z.; Deng, X.; Song, W.; Li, Z.; Chen, J. What is the main cause of grassland degradation? A case study of grassland ecosystem service in the middle-south Inner Mongolia. Catena 2017, 150, 100–107. [Google Scholar] [CrossRef]
  22. Bao, W.; Shan, W.; Yang, X.; Song, H.; Lan, Y. Ecological crises facing the grassland resources in northern China and their solutions. Grassl. China 1998, 20, 68–71. [Google Scholar]
  23. Nan, Z. The grassland farming system and sustainable agricultural development in China. Grassl. Sci. 2010, 51, 15–19. [Google Scholar] [CrossRef]
  24. Feng, C.; Ye, S.; Diao, Z.; Lü, S. Ecological pressures on grassland ecosystems and their conservation strategies in Northern China AU-Zheng, Zhirong. Chin. J. Popul. Resour. Environ. 2015, 13, 87–91. [Google Scholar]
  25. Runting, R.K.; Bryan, B.A.; Dee, L.E.; Maseyk, F.J.; Mandle, L.; Hamel, P.; Wilson, K.A.; Yetka, K.; Possingham, H.P.; Rhodes, J.R. Incorporating climate change into ecosystem service assessments and decisions: A review. Glob. Chang. Biol. 2017, 23, 28–41. [Google Scholar] [CrossRef] [Green Version]
  26. Staudinger, M.D.; Grimm, N.B.; Staudt, A.; Carter, S.L.; Chapin, F.S. Impacts of Climate Change on Biodiversity, Ecosystems, and EcoSystem Services; United States Global Change Research Progra: Washington, DC, USA, 2012; p. 296.
  27. Dow, K.; Berkhout, F.; Preston, B.L.; Klein, R.J.T.; Midgley, G.; Shaw, M.R. Limits to adaptation. Nat. Clim. Chang. 2013, 3, 305–307. [Google Scholar] [CrossRef]
  28. Nelson, E.J.; Kareiva, P.; Ruckelshaus, M.; Arkema, K.; Geller, G.; Girvetz, E.; Tallis, H. Climate change’s impact on key ecosystem services and the human well-being they support in the US. Front. Ecol. Environ. 2013, 11, 483–493. [Google Scholar] [CrossRef] [Green Version]
  29. Schäfer, L.; Warner, K.; Kreft, S. Exploring and Managing Adaptation Frontiers with Climate Risk Insurance; Mechler, R., Bouwer, L.M., Schinko, T., Surminski, S., Linnerooth-Bayer, J., Eds.; Springer Open: Berlin/Heidelberg, Germany, 2018; pp. 317–341. [Google Scholar] [CrossRef] [Green Version]
  30. Augustynczik, A.L.D.; Yousefpour, R. Assessing the synergistic value of ecosystem services in European beech forests. Ecosyst. Serv. 2021, 49, 101264. [Google Scholar] [CrossRef]
  31. Lamarque, P.; Lavorel, S.; Mouchet, M.; Quetier, F. Plant trait-based models identify direct and indirect effects of climate change on bundles of grassland ecosystem services. Proc. Natl. Acad. Sci. USA 2014, 111, 13751–13756. [Google Scholar] [CrossRef] [Green Version]
  32. Wang, T.; Wu, W.; Xue, X.; Sun, Q.; Chen, G. Study of spatial distribution of sandy desertification in North China in recent 10 years. Sci. China J. Earth Sci. 2004, 47, 78–88. [Google Scholar] [CrossRef]
  33. Qiu, L.; Hao, M.; Wu, Y. Potential impacts of climate change on carbon dynamics in a rain-fed agro-ecosystem on the Loess Plateau of China. Sci. Total Environ. 2016, 577, 267–278. [Google Scholar] [CrossRef]
  34. Gong, S.; Xiao, Y.; Xiao, Y.; Zhang, L.; Ouyang, Z. Driving forces and their effects on water conservation services in forest ecosystems in China. Chin. Geogr. Sci. 2017, 27, 216–228. [Google Scholar] [CrossRef] [Green Version]
  35. Cui, F.; Wang, B.; Zhang, Q.; Tang, H.; de Maeyer, P.; Hamdi, R.; Dai, L. Climate change versus land-use change—What affects the ecosystem services more in the forest-steppe ecotone? Sci. Total Environ. 2021, 759, 143525. [Google Scholar] [CrossRef]
  36. Schultner, J.; Dorresteijn, I.; Manlosa, A.O.; von Wehrden, H.; Hylander, K.; Senbeta, F.; Fischer, J. Ecosystem services from forest and farmland: Present and past access separates beneficiaries in rural Ethiopia. Ecosyst. Serv. 2021, 48, 101263. [Google Scholar] [CrossRef]
  37. National Animal Husbandry and Veterinary Station; Department of Veterinary Medicine; Ministry of Agriculture People’s Republic of China. Grassland Resources in China; Science and Technology of China Press: Beijing, China, 1996; p. 608. (In Chinese)
  38. Xu, X.; Liu, J.; Zhang, S.; Li, R.; Yan, C.; Wu, S. China Many Periods of Land Use Land Cover Remote Sensing Monitoring Data Set (CNLUCC), Chinese Academy of Sciences, Resources and Environment Science Data Center Data Registration and Publication System. 2018. (In Chinese). Available online: http://www.resdc.cn/DOI (accessed on 1 May 2021). [CrossRef]
  39. Xie, G.; Zhen, L.; Lu, C. Expert knowledge based valuation method of ecosystem services in China. J. Nat. Resour. 2008, 23, 911–919. (In Chinese) [Google Scholar]
  40. Xie, G.; Lu, C.; Zheng, D.; Li, S. Ecological assets valuation of the Tibetan Plateau. J. Nat. Resour. 2003, 18, 189–196. (In Chinese) [Google Scholar]
  41. Fang, J.; Yang, Y.; Ma, W.; Anivar, M.; Shen, H. Ecosystem carbon stocks and their changes in China’s grasslands. Sci. China Life Sci. 2010, 53, 757–765. [Google Scholar] [CrossRef]
  42. Piao, S.; Fang, J. Dynamic vegetation cover change over the last 18 years in China. Quat. Sci. 2001, 21, 94–302. (In Chinese) [Google Scholar]
  43. Yang, Y.; Fang, J.; Ma, W.H.; Guo, D.; Mohammat, A. Large-scale pattern of biomass partitioning across China’s grasslands. Glob. Ecol. Biogeogr. 2010, 19, 268–277. [Google Scholar] [CrossRef]
  44. Fang, J.Y.; Liu, G.H.; Xu, S.L. Carbon storage in terrestrial ecosystem of China. In The Measurement of Greenhouse Gas and Their Release and Related Processes; Wang, G.C., Wen, Y.P., Eds.; China Environmental Science Press: Beijing, China, 1996; pp. 391–397. (In Chinese) [Google Scholar]
  45. Huang, L.; Zhai, J.; Zhu, P.; Zheng, Y. Spatiotemporal evolution characteristics of livestock-carrying pressure in China and its implications for grassland ecosystem conservation pattern. Acta Geogr. Sin. 2020, 75, 2396–2407. [Google Scholar]
  46. Xie, G.; Zhang, C.; Zhen, L.; Chen, W.; Li, S.; Zhang, L. Improvement of the evaluation method for ecosystem service value based on per unit area. J. Nat. Resour. 2015, 30, 1243–1254. (In Chinese) [Google Scholar]
  47. Potter, C.S.; Randerson, J.T.; Field, C.B.; Matson, P.A.; Vitousek, P.M.; Mooney, H.A.; Klooster, S.A. Terrestrial ecosystem production: A process model based on global satellite and surface data. Glob. Biogeochem. Cycles 1993, 7, 811–841. [Google Scholar] [CrossRef]
  48. Luo, Q.; Zhou, J.; Li, Z.; Yu, B. Spatial differences of ecosystem services and their driving factors: A comparation analysis among three urban agglomerations in China’s Yangtze River Economic Belt. Sci. Total Environ. 2020, 725, 138452. [Google Scholar] [CrossRef]
  49. Zhang, Y.; Lu, X.; Liu, B.; Wue, D.; Fu, G.; Zhao, Y.; Sun, P. Spatial relationships between ecosystem services and socioecological drivers across a large-scale region: A case study in the Yellow River Basin. Sci. Total Environ. 2021, 766, 142480. [Google Scholar] [CrossRef]
  50. Xie, G.; Zhen, L.; Lu, C.; Xiao, Y.; Li, W. Applying value transfer method for eco-service valuation in China. J. Resour. Ecol. 2010, 1, 51–59. [Google Scholar]
  51. Liu, Y.; Ren, H.; Zhou, R.; Basang, C.; Zhang, W.; Zhang, Z.; Wen, Z. Estimation and dynamic analysis of the service value of grassland ecosystem in China. Acta Agrestia Sin. 2021, 29, 1522–1532. [Google Scholar]
  52. Zhao, T.; Ouyang, Z.; Jia, L. Ecosystem services and their valuation of China grassland. Acta Ecol. Sin. 2004, 24, 1101–1110. (In Chinese) [Google Scholar]
  53. Xie, G.; Zhang, Y.; Lu, C.; Zheng, D.; Cheng, S. Ecosystem service value of natural grassland in China. J. Nat. Resour. 2001, 16, 47–53. (In Chinese) [Google Scholar]
  54. Chen, Z.; Zhang, X. The value of ecosystem benefits in China. Chin. Sci. Bull. 2000, 45, 17–22. (In Chinese) [Google Scholar]
  55. Wang, R.; Qin, Z. Valuation of Chinese grassland ecosystem services using MODIS data. Chin. J. Grassl. 2007, 9, 50–53. (In Chinese) [Google Scholar]
  56. Jiang, L.; Qin, Z.; Xie, W. Estimation of Grassland ecosystem services value of china using remote sensing data. J. Nat. Resour. 2007, 22, 161–169. (In Chinese) [Google Scholar]
  57. Roch, L.; Jaeger, J.A.G. Monitoring an ecosystem at risk: What is the degree of grassland fragmentation in the Canadian Prairies? Environ. Monit. Assess. 2014, 186, 2505–2534. [Google Scholar] [CrossRef]
  58. Kang, L.; Han, X.G.; Zhang, Z.B.; Sun, O.J. Grassland ecosystems in China: Review of current knowledge and research advancement. Philos. Trans. R. Soc. B Biol. Sci. 2007, 362, 997–1008. [Google Scholar] [CrossRef]
  59. Xu, Y.; Xiao, F.; Yu, L. Review of spatio—Temporal distribution of net primary productity in forest ecosystem and its responses to climate change in China. Acta Ecol. Sin. 2020, 40, 4710–4723. (In Chinese) [Google Scholar]
  60. Xie, G.; Zhang, C.; Zhen, L.; Zhang, L. Dynamic changes in the value of China’s ecosystem services. Ecosyst. Serv. 2017, 26, 146–154. [Google Scholar] [CrossRef]
  61. Wang, Y.; Dai, E.; Yin, L.; Ma, L. Land use/land cover change and the effects on ecosystem services in the Hengduan Mountain region China. Ecosyst. Serv. 2018, 34, 55–67. [Google Scholar] [CrossRef]
  62. Xu, D.; Ding, X. Assessing the impact of desertification dynamics on regional ecosystem service value in North China from 1981 to 2010. Ecosyst. Serv. 2018, 30, 172–180. [Google Scholar] [CrossRef]
  63. Li, S.; Bing, Z.; Jin, G. Spatially explicit mapping of soil conservation service in monetary units due to land use/cover change for the Three Gorges Reservoir Area, China. Remote Sens. 2019, 11, 468. [Google Scholar] [CrossRef] [Green Version]
  64. Chen, T.; Feng, Z.; Zhao, H.; Wu, K. Identification of ecosystem service bundles and driving factors in Beijing and its surrounding areas. Sci. Total Environ. 2020, 711, 134687. [Google Scholar] [CrossRef]
  65. Kim, J.H.; Jobbagy, E.G.; Jackson, R.B. Trade-offs in water and carbon ecosystem services with land-use changes in grasslands. Ecol. Appl. 2016, 26, 2767. [Google Scholar] [CrossRef] [Green Version]
  66. Liu, J.; Zhang, Z.; Xu, X.; Kuang, W.; Zhou, W.; Zhang, S.; Li, R.; Yan, C.; Yu, D.; Wu, S. Spatial patterns and driving forces of land use change in China in the early 21st century. Acta Geograph. Sin. 2009, 64, 1411–1420. [Google Scholar] [CrossRef]
Figure 1. The distribution of the study area.
Diversity 14 00160 g001
Figure 2. Interannual variation of the grassland ecosystem service value (ESV) for the national total from 2001 to 2020.
Diversity 14 00160 g002
Figure 3. Ratio of grassland ecosystem service value to GDP in China from 2001 to 2020.
Diversity 14 00160 g003
Figure 4. Contribution rate of the four grassland ecosystem services in China.
Diversity 14 00160 g004
Figure 5. Spatial distribution of mean annual grassland ecosystem service value (ESV) from 2001 to 2020 in China.
Diversity 14 00160 g005
Figure 6. Significance test of regression coefficient of annual grassland ecosystem service value during 2001–2020 in China (R = ±0.445 represents the significance level p = 0.05).
Diversity 14 00160 g006
Figure 7. Percentage change of mean annual grassland ecosystem service value (ESV) over 2011–2020 relative to 2001–2011 in China.
Diversity 14 00160 g007
Figure 8. The change trends of evapotranspiration (a), precipitation (b), relative humidity (c), sunshine hours (d), and temperature (e) in the grassland of China from 2001 to 2020.
Diversity 14 00160 g008
Figure 9. Correlation between grassland ecosystem service value and five climate factors from 2001 to 2020 in China (R = ±0.445 represents the significance level p = 0.05).
Diversity 14 00160 g009
Table 1. Ecosystem service value per unit area of grassland ecosystem type in China (yuan/hm2).
CategoriesServices Item (Sub-Categories)Unit Price/yuan (pi)
Regulating serviceGas regulation707.9
Climate regulation796.4
Supporting serviceWater conservation707.9
Soil formation and protection1725.5
Waste treatment1159.2
Biodiversity protection964.5
Provision serviceFood production265.5
Raw material production44.3
Cultural serviceRecreation and culture35.4
Table 2. Input and output data of the model and data source.
Model/OutputInput DataData Source
ESVUnit priceXie et al. (2003, 2008) [39,40]
AreaRESDC (Xu et al., 2018) [39]
bFang et al. (1996) [44]
BFang et al. (1996) [44]
NPPCASA (as follows)
CASA/NPPNDVIThe EOS/MODIS portal of NASA
(https://ladsweb.modaps.eosdis.nasa.gov, accessed on 1 May 2021)
Climate dataChinese Meteorological Information Center
(http://cdc.cma.gov.cn, accessed on 1 July 2021)
Land use typeRESDC (Xu et al., 2018) [38]
Table 3. The mean annual grassland ecosystem service value (ESV) during 2001–2020 in provinces and cities of China.
Province/CityESV/104 yuanProvince/CityESV/104 yuan
Hong Kong1Ningxia44
Shanghai0Qinghai1369
Hainan12Shaanxi561
Guangxi203Henan60
Guangdong74Shandong77
Yunnan824Gansu555
Guizhou259Shanxi247
Fujian194Beijing10
Hunan68Tianjin1
Jiangxi63Hebei231
Zhejiang19Liaoning62
Chongqing65Jilin48
Sichuan1284Inner Mongolia1847
Hubei68Heilongjiang271
Anhui81Xinjiang857
Jiangsu6Taiwan13
Tibet1303
Table 4. Comparison of grassland ecosystem service value in different studies (i = 1, 2, …, n, respectively, representing n ecosystem services).
StudiesCurrency Used for ESVEvaluation ObjectCalculation Method/Cited
yuan/1012US $/1012Value Grassland
Our study1.370.18TotalTotalΣ(ESVi per area × area)/Xie et al., 2008 [39]
Zhao et al., 2004 [52]0.88 IndirectTotalΣ(ESi × pricei)/a method cited for Each ES
Xie et al., 2001 [53] 0.15TotalNaturalΣ(ESVi per area × area)/Xie et al., 2001 [53]
Chen et al., 2000 [54]0.87 TotalTotalΣ(ESVi per area × area)/Costanza et al., 1997 [1]
Wang et al., 2007 [55] 0.03TotalTotalΣ(ESVi per area × area)/Revised from Xie et al., 2001 [53]
Jiang et al., 2007 [56]1.7 TotalTotalΣ(ESi × pricei)/a method cited for Each ES
Xie et al., 2010 [50](0.87–7.5) TotalTotalSurvey and estimation
Liu et al., 2021 [51]1.38 TotalTotalΣ(ESi × pricei)/a method cited for Each ES
Publisher’s Note: MDPI stays neutral with regard to jurisdictional claims in published maps and institutional affiliations.

