Review

Farming Intensity Affects Soil Seedbank Composition and Spontaneous Vegetation of Arable Weeds

by
Philipp Köllmann
* and
Rainer Waldhardt
Division of Landscape Ecology and Landscape Planning, Department of Landscape Ecology and Resources Management, Justus-Liebig-University Giessen, Heinrich-Buff-Ring 26-32, 35392 Giessen, Germany
*
Author to whom correspondence should be addressed.
Diversity 2022, 14(2), 111; https://doi.org/10.3390/d14020111
Submission received: 21 September 2021 / Revised: 26 January 2022 / Accepted: 28 January 2022 / Published: 4 February 2022
(This article belongs to the Special Issue Weed Ecology and Diversity)

Abstract

:
Former studies carried out in the 2000s in the Lahn-Dill region located in the middle-east of the German state Hesse stated a depletion of arable weeds on the field scale and more diverse weed flora on the landscape scale. Current study, having started in 2018, aims to contribute to a better understanding of the interactions between arable weed species diversity, farming intensity, grown crops and landscape area. Moreover, the potential of organic farming methods for conservation and promotion the arable weed diversity is aimed to be assessed with the study. In total, 42 fields in two landscape regions were sampled—six seedbank samples were collected from each field; additionally, data on spontaneous arable weed flora were recorded each spring from 2019 to 2021; emerged aboveground weeds were identified in the fields and their coverage was documented. Four factors were considered in the field trial: Farming practice, landscape area, soil depth and the current crop. Effects of these factors on arable weed species diversity were calculated with a Generalized Linear Model (GLM), resulting in significant effects of the management system, the area and the current crop. Among the four organic farming systems that were sampled, the time period of organic growing had a significant effect on weed seed numbers in the soil with an increase in seed numbers. Average seedbank species numbers were around twice as high in organic farming systems (18 species) compared to conventional managed fields (nine species). Evidence of an ongoing species decline in the region on the landscape scale could be detected by comparison with a former study. Especially rare and endangered weed species are a concern due to seedbank and current vegetation depletion tendencies.

1. Introduction

Due to the intensification in agricultural systems, there is a loss of biodiversity in the agricultural landscape on a global scale [1]. Segetal species found in the agro-ecosystems are strongly affected by this process, resulting in reductions in total species and individual numbers per species as well [2,3,4]. Arable weeds are strongly endangered in middle Europe [5]. In general, there is a depletion of arable plant species richness in farming systems with a high intensity level, thus conventional cropping systems are concerned by this tendency primarily [6]. Studies Albrecht [7] could state the positive effects of organic farming methods on arable weed diversity and its potential to preserve arable weed richness by the maintenance and promotion of a stable weed seedbank. Several studies have well documented the effect of the management system in agriculture on segetal species abundance [8,9]. Mostly, increasing land-use intensity of conventional farming practices resulted in a loss of arable plant species diversity [10,11,12].
Besides the decrease in high proportion of arable weeds, there are some species that have already adapted to more intensive farming conditions, and especially to herbicide inputs, in the case of Alopecurus myosuroides and some Lolium species [13,14,15]. As Storkey & Neve [16] stated there is an advantage of a diverse arable weed flora for economic and ecological reasons. They found a negative linear relationship between yield loss and the number of arable species. Yield losses were much lower in fields with higher species diversity (30% yield loss) compared to fields with a low species number (60% yield loss).
A diverse and species-rich cropping system offers several ecological benefits that are well documented [17,18,19]. Supply of food, shelter and habitat plays a key role of arable plant species for a diverse fauna [20,21].
Higher diversity values of organic managed land has been stated by several studies; Kolářová et al. [22] reported up to 4.5 times higher abundance of these species in organic farming compared to the conventional variants.
However, studies usually focus on the aboveground coverage of weeds. Way fewer research has been done on the soil seedbank of weeds. Studies by Rotchés-Ribalta et al. [23] stated an effect of the intensity level of the farming system on the seed abundance of the soil seed bank with higher seed abundances in organic and lower abundances in conventional farming systems. In studies of Hawes et al. [9], current arable weeds were stronger and more directly affected by the farming practice than the soil seed bank was. Studies that were conducted at the beginning of the 2000s in the region of the current project (Lahn-Dill-Bergland) on arable weed diversity found a significant depletion of arable weed richness on a small scale (field) but stated still moderate high species richness on a larger scale (landscape) [24]. Current study purposes to detect changes of the situation of arable weeds in the region between former studies and the current one. Besides that, relationships between management regime, region and the arable weed flora shall be clarified in this study. The research questions include: Which factors have the strongest impact on species distribution patterns and diversity indices? What changes compared to former studies can be detected referring to the arable weed flora? Information on that can contribute to developing strategies for recovery and conservation of arable weed diversity in the region and in regions with similar site conditions.

2. Materials and Methods

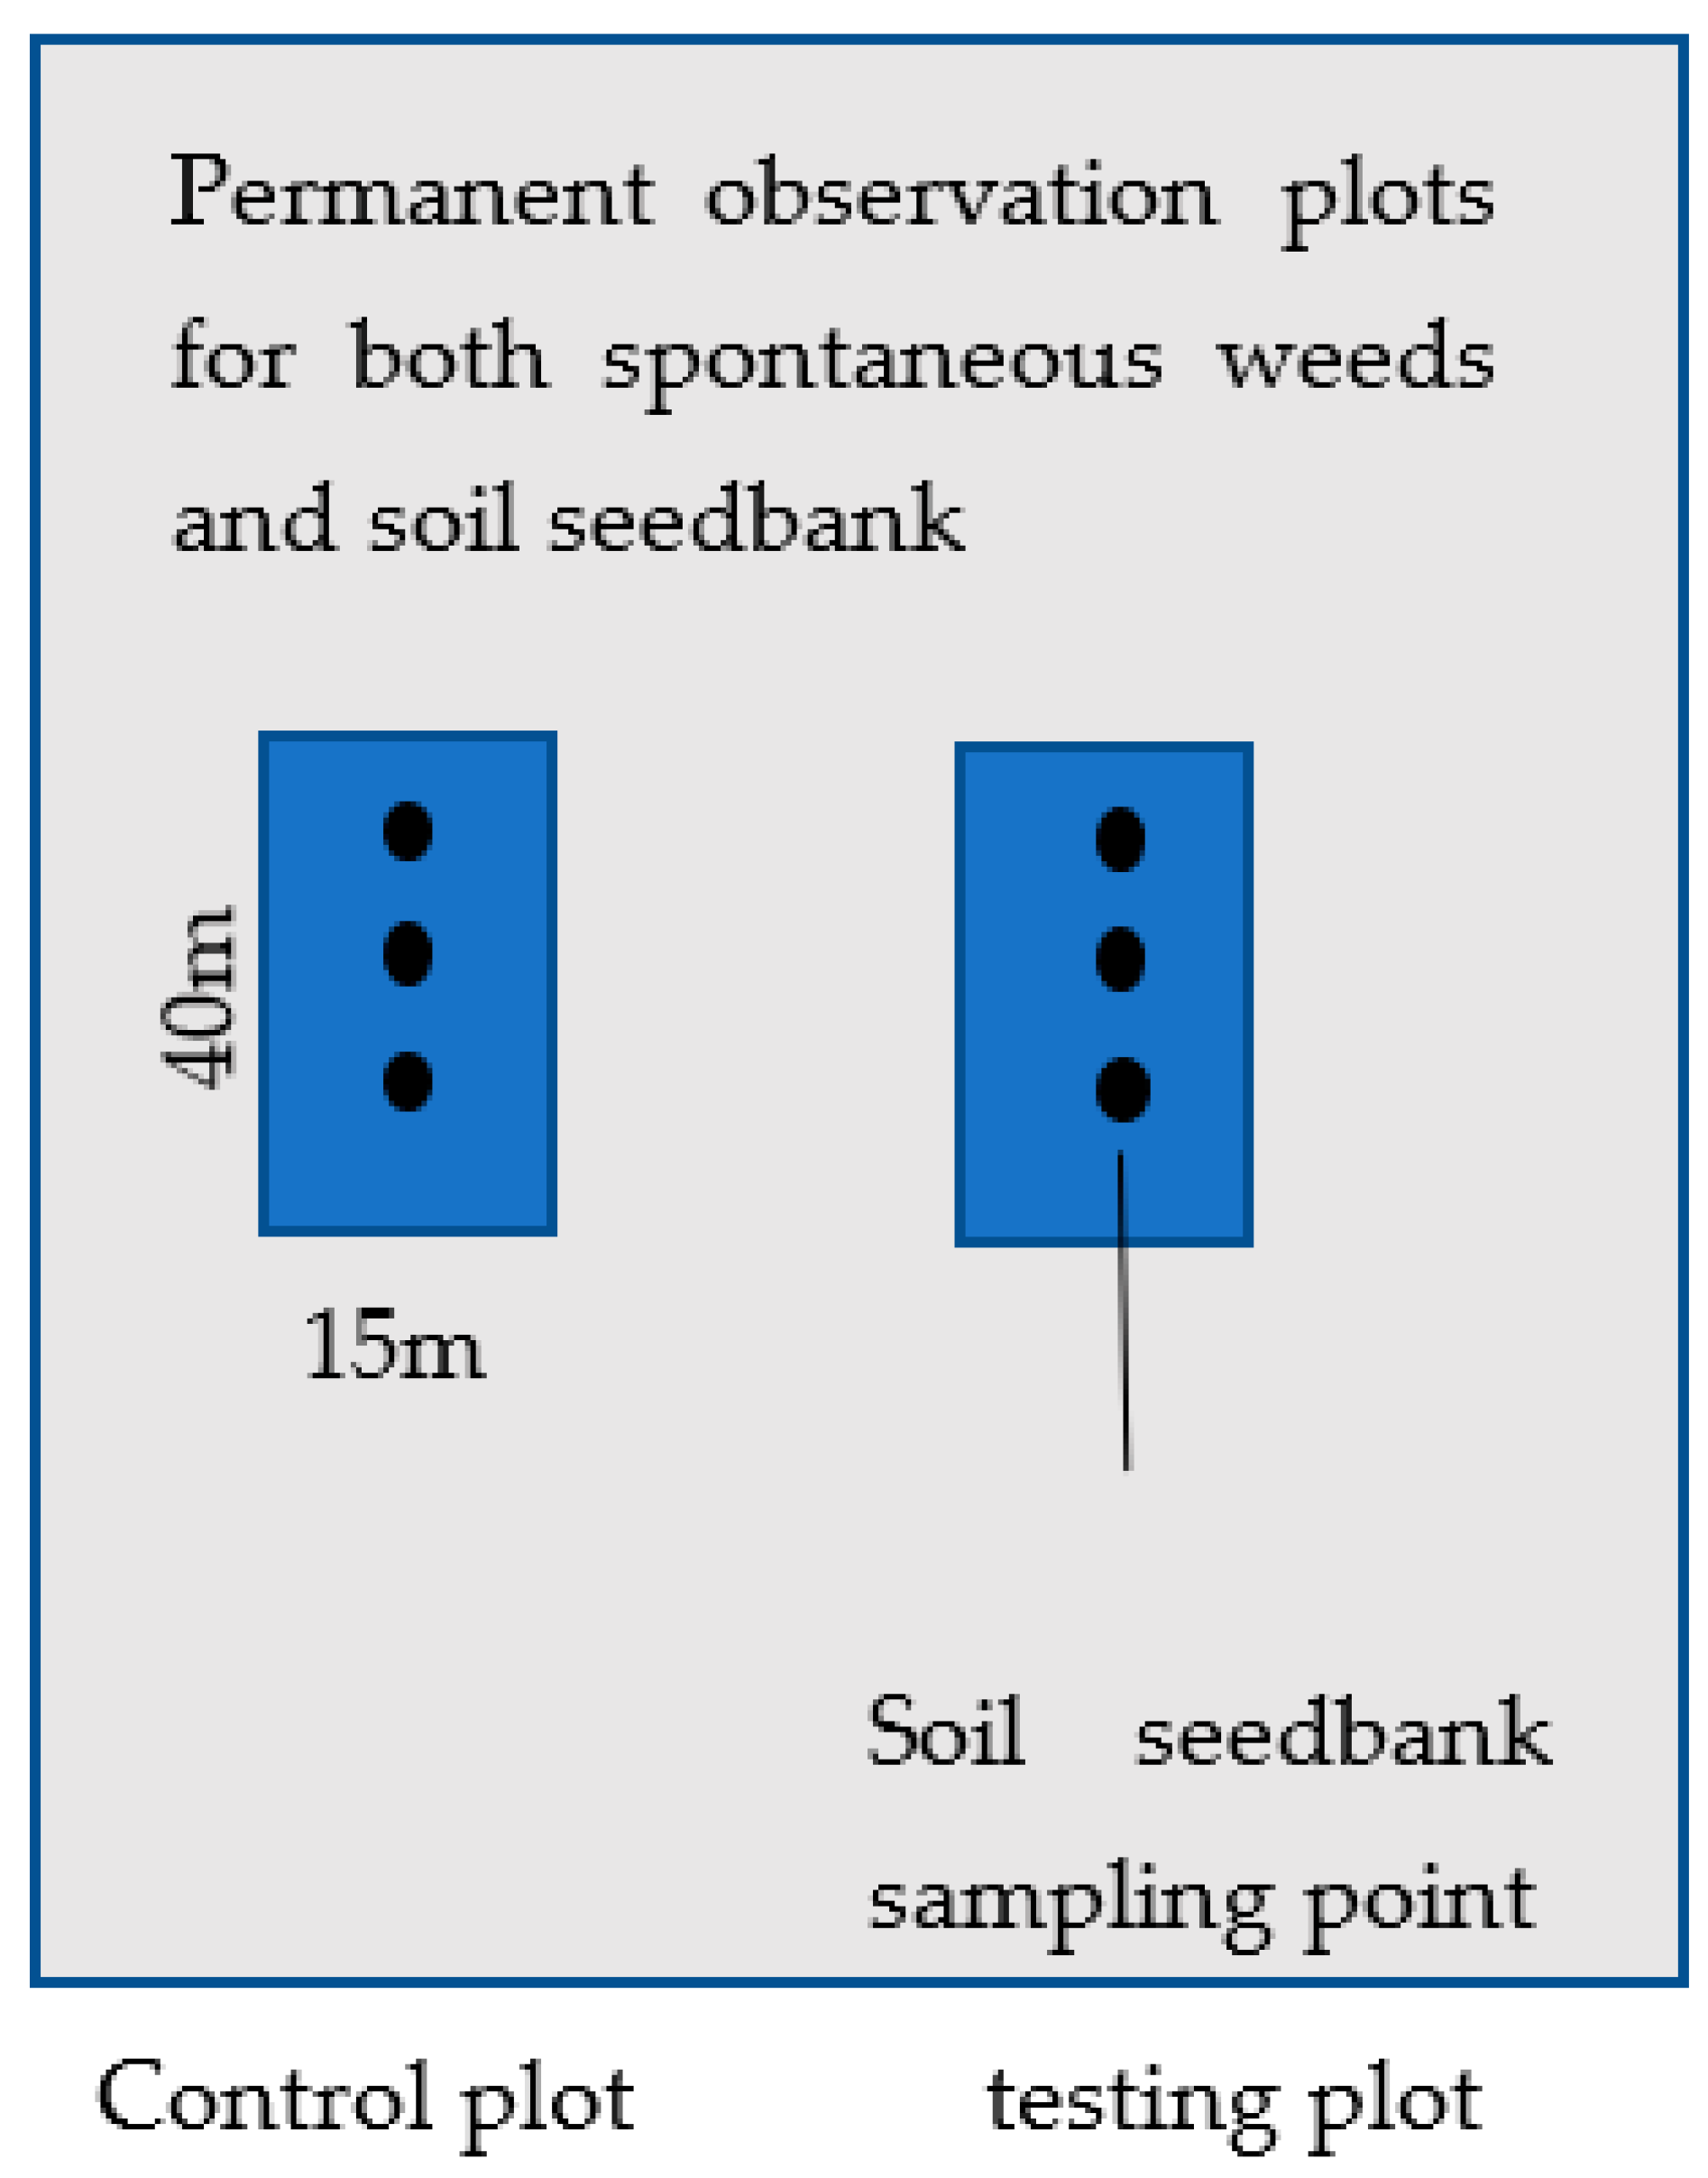
2.1. Study Sites and Experimental Setup

The study is based on a sampling of vegetation ecological data of 42 arable fields in two landscape areas in the region between Marburg and Giessen in Hessen, Germany. The region “Lahntal” is an area of the valley of the river Lahn which is characterized by fertile loamy soils and mainly alluvium materials like silt and clay. Site conditions allow intensive arable farming with a high proportion of cereals in the crop rotation. Winter wheat and winter barley are commonly grown there. Twenty-two sites were samples in this region. Average altitude of the region “Lahntal” is 175 m above sea level, with an annual average temperature of 10 °C and average annual precipitation of 750 mm. Coordinates of the center of these study sites are 50°43′1.20″ N and 8°42′21.69″ E. Study sites are located on a north-south line that stretches about 3.5 km north and 3.5 km south of the given coordinates.
The second region “Gladenbacher Bergland” is located about 10 km east of the region “Lahntal” and here, 20 fields were sampled. Center coordinates of the sites are 50°43′18.14″ N and 8°37′33.46″ E. Study sites are spread in an area of about 8 km in the east-west direction and 3 km in the north-south direction from the given center coordinates. Commonly grown crops in this region are clover, winter and spring barley and spelt. Bedrock material of soils in this region is mostly slate rock, resulting in flat soils. Due to these site conditions farming methods are less intensive than in the region of river Lahn. Ground level elevation is between 180 and 300 m above sea level. Annual average temperature is 9 °C. With an average annual precipitation of 900 mm, rainwater supply is a little higher than in the neighboring region.
In the winter of 2018/2019, six soil samples were taken from each of the 42 fields to obtain qualitative and quantitative data on the arable weed flora in the region. Figure 1 gives an overview of the sampling design of the study. Soil samples were taken with a metal sampling cylinder of 20 cm length and a diameter of 5 cm. For each field, six soil samples were taken in two different soil depths, to obtain quantitative and qualitative information on the arable weed flora in the region. Sampled soil depths were as follows:
(a) 0–5 cm below soil surface and (b) 5–20 cm below soil surface. In total, there are 504 samples as data basis for seedbank analysis resulting from 42 fields multiplied with 3 repetitions per soil depth level and two soil depth levels: 42 × 6 × 2 = 504.
Following the principles of the commonly used ‘seedling emergence method’ [25,26,27] a given soil volume (500 mL) was transferred into trays. During a period of four weeks identification was conducted; the first one was done between 23 April and 20 May, followed by a second period from 21 May until 24 June. In October 2019 there was a third identification of species. The trays were placed in the greenhouse before and during the period of identification in April 2019 to accelerate germination process by higher temperatures. From April onwards trays were placed outside the greenhouse, covered with a thin textile sheet to prevent inputs from foreign diaspore sources. After all seedlings had been identified in October, empty trays were left outside during winter months to overcome dormancy of remaining seeds that had not germinated until then. The last period of identification was then finished by the end of April 2020. Up to three weeks after seedlings’ emergence, seedlings were identified and also individual numbers per species have been recorded. Samples were irrigated once a week before seedlings emergence and each day after germination to ensure rapid and even plant development.
Besides seedbank data, information on the spontaneous arable weed flora in the fields was collected during the spring of 2019, 2020 and 2021. Botanical surveys included a 3-week-period from the beginning of April. Spontaneous weed species were identified and also their coverage on the field was recorded on the scale of Braun–Blanquet which is commonly used for botanical surveys [28]. In the center of each field, two frames were placed with the size of 10 × 5 m each to identify weed species and their current coverage. Thus, in total, an area of 100 m2 was tested for the botanical survey.

2.2. Statistical Analysis

Analyses on the data were conducted with the free software R studio, which provides several packages for analyzing vegetation ecological data; a commonly used package for data analyses on vegetation data is the package “vegan” that has been used frequently also in this study. In this package, functions for estimating ecological diversity are included such as several diversity indices (e.g., Shannon Diversity) [28]. For the assessment of the floristic diversity of the arable fields in the region, Shannon Diversity Index (H) was used which is calculated by
H = ∑ [(pi) × ln(pi)]
where pi = proportion of total sample individual number represented by species i. Evenness E was calculated by E = H/Hmax, with Hmax as the maximum diversity possible. Since the response variables ‘species number’ and ‘individual number’ of the project fields were not normally distributed, a Generalized Linear Model (GLM) was used for calculating the effects of the factors on the species and individual numbers as dependent variables. All factors were considered as fixed effects.
The full model including all factors and all factor X factor interaction effects is given in Formula (2)
Y = m + a + sd + m × a + m × sd + a × sd
where the response variable Y = number of species, and the four factors with two factor levels each: m = management (organic, conventional), a = area (Lahntal and Gladenbacher Bergland), sd = soil depth (two factor levels 0–5; 5–20 cm). Starting from a zero model without factors, a forward selection was conducted to find the model with the best predictive power, considering the AIC values.
Studies by Hyvönen et al. [29] showed that even short periods of organic growing supports the development of a diverse arable weed flora and changes show up especially in spontaneous weed flora; in contrast, a more substantial transformation of the weed flora composition can be potentially achieved by longer periods of organic cropping. As the factor time has obviously been found to be an important factor explaining arable weed flora diversity the current study aims to assess this factor under the given site conditions. For that reason, a second Generalized Linear Model has been introduced which is targeting the factor “period of organic cropping” in case of the organic growers; for this model, only organic managed fields were included in the dataset; the samples for conventional fields were excluded though, since there has been no change of farming methods in the history of conventional farmers. The four organic farmers involved in the project started organic growing in the years 1980, 1991, 2000 and 2004; thus, organic fields have been for roughly 38, 27, 18 and 13 years in organic management at the first botanical survey in February 2019. Model Equation (1) was extended by the term t, which represents the factor ‘time of organic growing’:
Y = m + a + sd + t + m × a
To indicate distribution patterns of arable weeds among the considered factors, a Nonmetric Multi-Dimensional Scaling (NMDS) was used as ordination method due to its robustness towards input data and types of distribution of the response variable, which follows a Poisson-distribution. NMDS was conducted with two different data sets. For the NMDS ordination of the relevé data two datasets (summer and spring period) were pooled into one dataset to conduct the analyses. The analysis of the soil seedbank is based on one dataset. Similarities between sites concerning occurring weed species was calculated with the Sorensen Similarity Index [30].
As an assessment for the floristic characteristics of the sites in two different landscape regions and in two different farming systems an indicator species analysis was conducted with the R-package “indicspecies” and its function indpower that performs a correlation between target and indicator species. Indicator species analysis was conducted for the landscape level; thus, classification refers to the landscape regions or groups of landscape regions. Besides that, the farming system was included as an information for the species affinity towards the nutrient supply and their tolerance concerning farming intensity.

3. Results

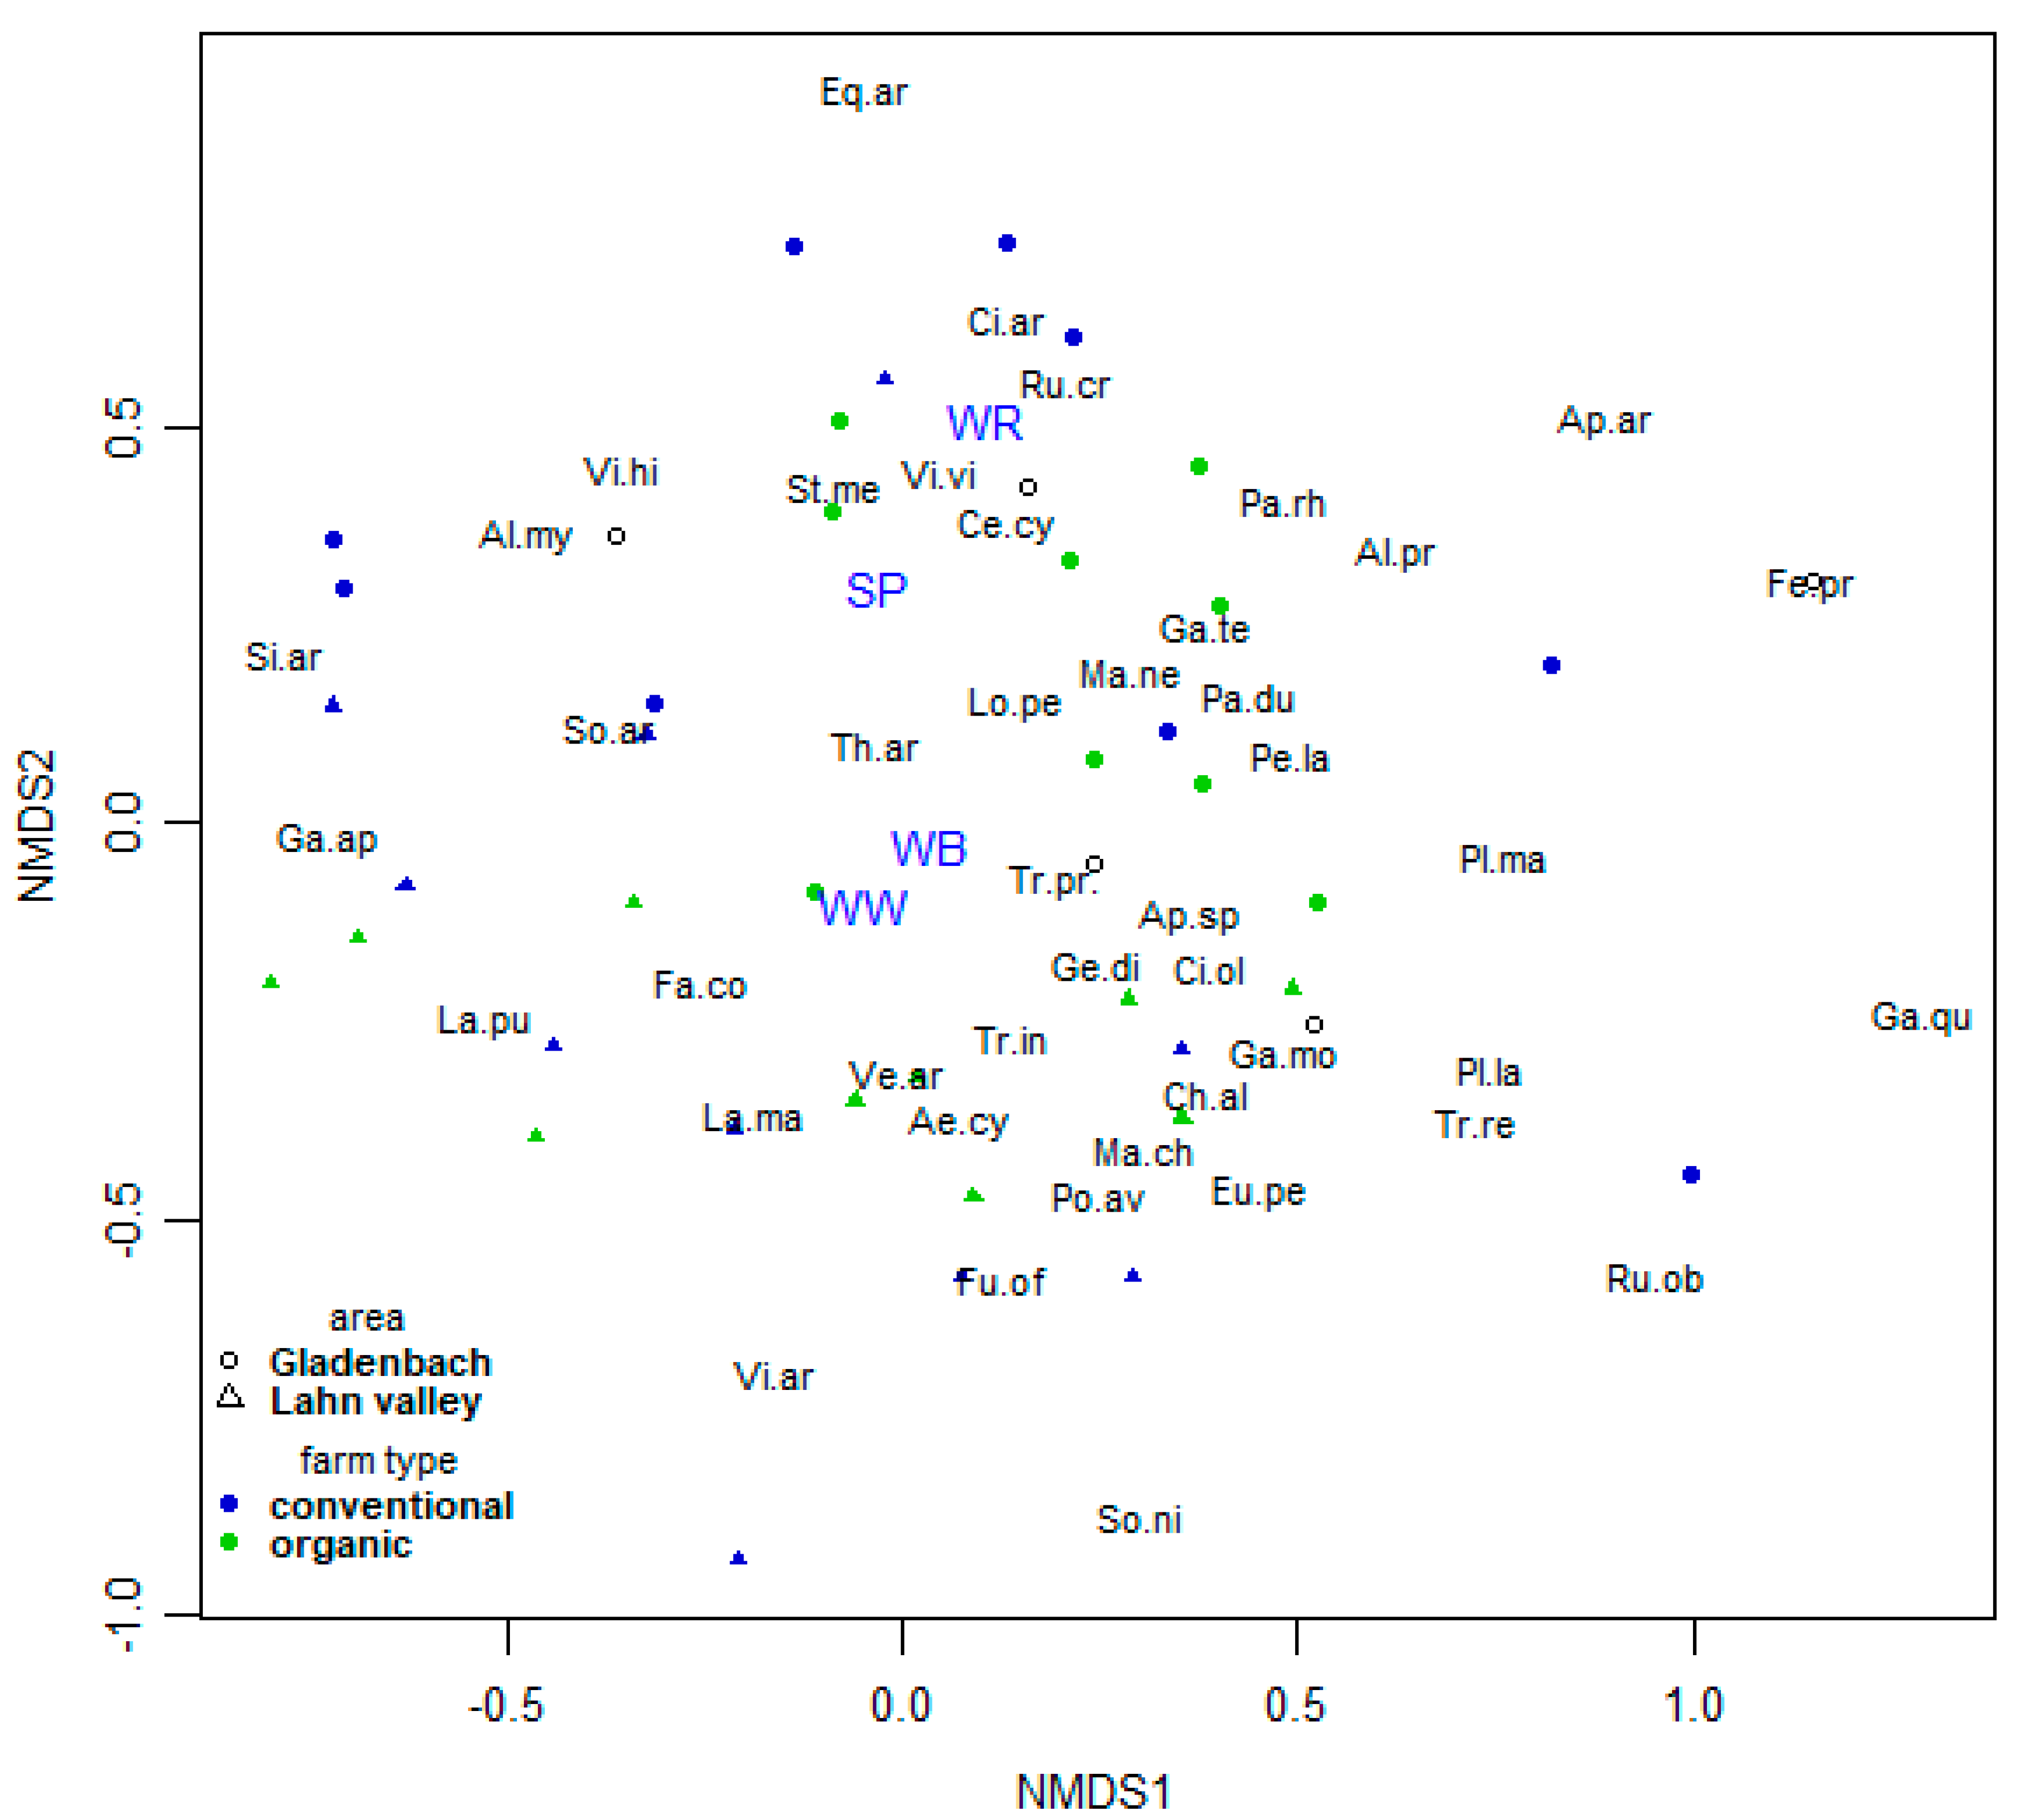
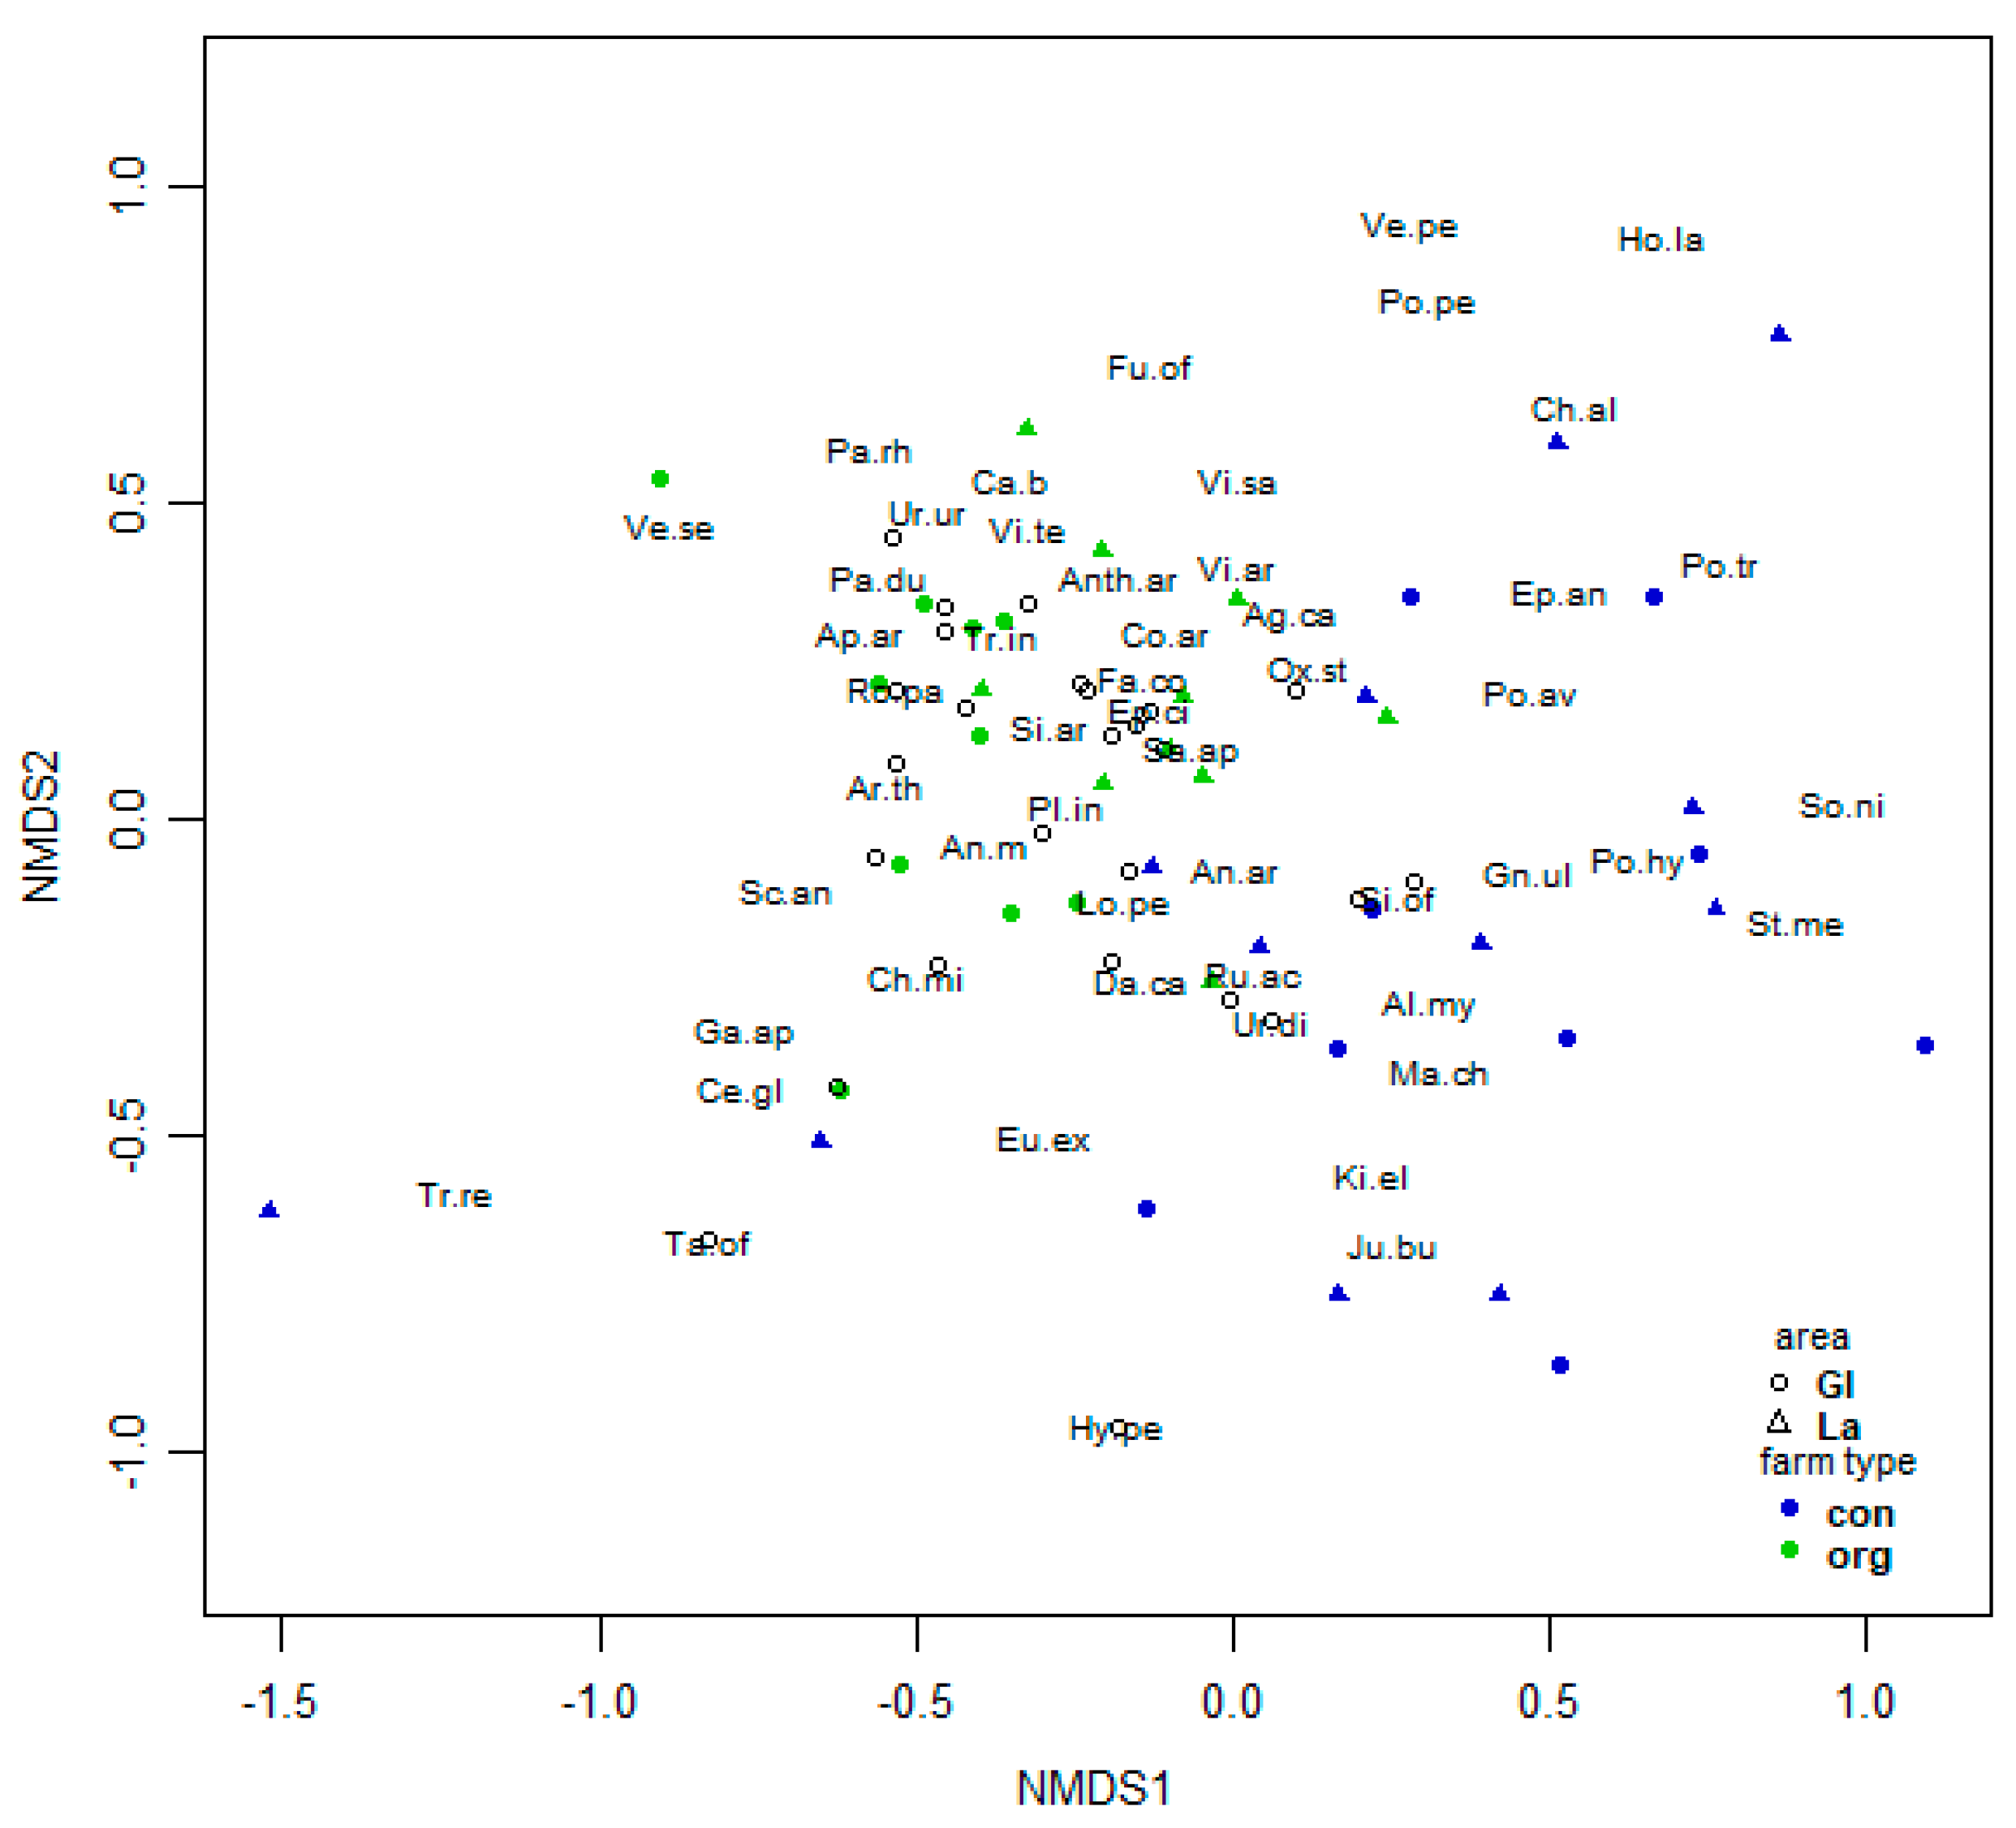
3.1. Spontaneous Arable Weed Flora

Farming practice has been identified as the main factor explaining arable plant species diversity and abundance as several studies have stated [22,31,32]. As an important factor for explaining segetal species richness, the management system was accessed concerning its impact on species diversity and species abundances. The management system is an indicator of the intensity of land use. Conventional farming represents a highly intensive farming system. Organic farms decrease inputs or do not use external inputs like fertilizers and can be considered as moderate to low intensive farming systems. The factors area, management and the interaction of area x management were analyzed concerning their impact on species numbers and diversity indices in current plant coverage. It was found that management was the only factor showing a significant impact on the species numbers in the dataset of the relevés.
Current vegetation data were analyzed concerning the impact of different factors on species numbers and on Shannon Diversity Index. Following Table 1, the factors management and crop have a significant impact on species numbers with alpha = 0.001. However, the area was not found to be a significant explaining factor for species number variance. In general, species number and Shannon Diversity Index show similar patterns across the four different field trial variants (Gl-org, La-org, Gl-con, La-con). The factor crop is slightly less significant when testing its impact on Shannon Diversity Index (α = 0.05) compared to its impact on species richness (α = 0.01). Interaction effects were not significant in both species richness and Shannon diversity measurements indicating an independent experimental setup. Studies by Chamorro et al. [4] have shown the potential for a conversion from conventional to organic farming practices affecting the recovery of a diverse arable plant community. Species abundance could be increased from 61 to 122 within a period of five years after the transition from conventional to organic farming system Chamorro et al. [33].
The GLM found significant effects of all factors and all interaction effects. Species numbers in the region “Lahntal” are reduced compared to those of the other project region “Gladenbacher Bergland”.
All factors except the factor area La have positive effects on the species numbers per square meter in the fields. Concerning the variance of the data, area and management are the two factors explaining the main proportion of the variance of the data. For the spontaneous weed flora, average species numbers and Shannon Diversity Indices varied significantly among the four considered variants Gl.con, Gl.org, La.con and La.org as depicted in Figure 2.
The organic variants Gl.org and La.org show significantly higher species numbers than the conventional variants. The number of species in the soil seed bank identified with the seedling-emergence method is higher than the number of species in current vegetation in three out of four variants. A reason for lower species numbers with the in-field identification might be the effect of competition between weeds and crops.
With the method of soil seed bank germinating, there is no crop, which will compete with the weeds for natural resources. This explains the higher number of wild herb species with the germinating method. In all cases of the seed bank method, the number of individuals is higher for the organic farming systems than in the conventional farming systems. The management system has a significant effect on species richness in the fields. In the investigation area of Gladenbacher Bergland there is a difference of 10 species in average between conventional and organic farming systems. The average species number in the conventional variant is eight whereas the average in the organic farming system is 18. In the other area (Marburg-Giessener Lahntal) the mean species number is lower (five species) and in the organic farming system the species number is 19. In both sites, organic farming systems show higher species richness and diversity in wild herbs. Conventional farming systems have selected a few species that do not react as sensitively as other species concerning the input of herbicides and fertilizers.
For all four groups except the conventional one in Gladenbacher Bergland, there are significant differences between the determination methods in species numbers. A reason for lower species numbers with the in-field identification could be the effect of competition between weeds and crops. With the method of soil seed bank germinating there is no crop, which will compete with the weeds for natural resources. This explains the higher number of wild herb species with the germinating method. In all cases of the seed bank method the number of individuals is higher for the organic farming systems than in the conventional farming systems.
The management system has a significant effect on species richness in the fields. In the investigation area of Gladenbacher Bergland there is a difference of 10 species in average between conventional and organic farming systems. The average species number in the conventional variant is 8 whereas the average in the organic farming system is 18. In the other area (Marburg-Giessener Lahntal) the mean species number is lower (5 species) and in the organic farming system, the species number is 19. In both sites, organic farming systems show higher species richness and diversity in wild herbs.
At the significance level of alpha = 0.05 only the factor crop was found to be a significant explanatory variable for differences in the individual and species numbers. However, area and management were not significant in the setting of the trial. For the relevé data, the effect of the factor year, area and management system were checked with a Generalized Linear Model, since the data have a Poisson distribution.
For the relevé dataset, the organic managed fields showed significantly higher average weed coverage as shown in Figure 3.
The coverage numbers refer to the standardized relevé plot with the size of 100 m2. The effect of the year on the average weed cover was significant, too. For the organic managed fields, variance of the data was much wider than those for the weed coverage of the conventional fields. Results of a Generalized Linear Model on the coverage of spontaneous weeds are compiled in Table 2.
Nonmetric multidimensional scaling was used to analyze current vegetation data and to identify patterns in species distribution. NMDS was conducted in R package “vegan” and resulted in Figure 4.
The best solution for the NMDS model concerning the increase in goodness of fit and the decrease in stress was found with a number of three dimensions. In this case, the correlation between the distance values and the observed dissimilarity expressed as R2 equals 0.97 and stress is reduced to a value of 0.178. The four crops winter rye (WR), winter barley (WB), winter wheat (WW) and spelt (SP) were identified as significant factors.
Most of the arable weed species were found in both areas, in the hill-sites around Gladenbach and the valley of river Lahn and in both of the management systems.
Some species show tendencies of a more specific occurrence concerning the factors area and management—here, Papaver dubium, Galeopsis tetrahit and Galium mollugo were some of the species showing higher abundance patterns in organic than in conventional farming systems.
In an experiment of Hyvönen & Huusela-Veistola [1] some species with a high steadiness could be identified. Galium aparine was detected on 41% of the fields followed by Chenopodium album (68%), Stellaria media (76%) and Viola arvensis (84%) as the most frequent species in cereal cropping. This study could also identify some of these species as frequent species in cereal cropping. Rumex crispus, Galium aparine and Alopecurus myosuroides were more frequently found in conventionally managed fields. Moreover, Vicia hirsuta and Equisetum arvensis and Cirsium arvense and Stellaria media showed higher abundance patterns in more intensive cereal cropped fields.
The weed species Cirsium arvense, Centaurea cyanus, Vicia villosa and Rumex crispus were frequently associated with winter rye. In the crops winter wheat and winter barley, the weeds Trifolium pretense, Geranium dissectum, Tripleurospermum inodorum and Thlaspi arvense were frequently represented.

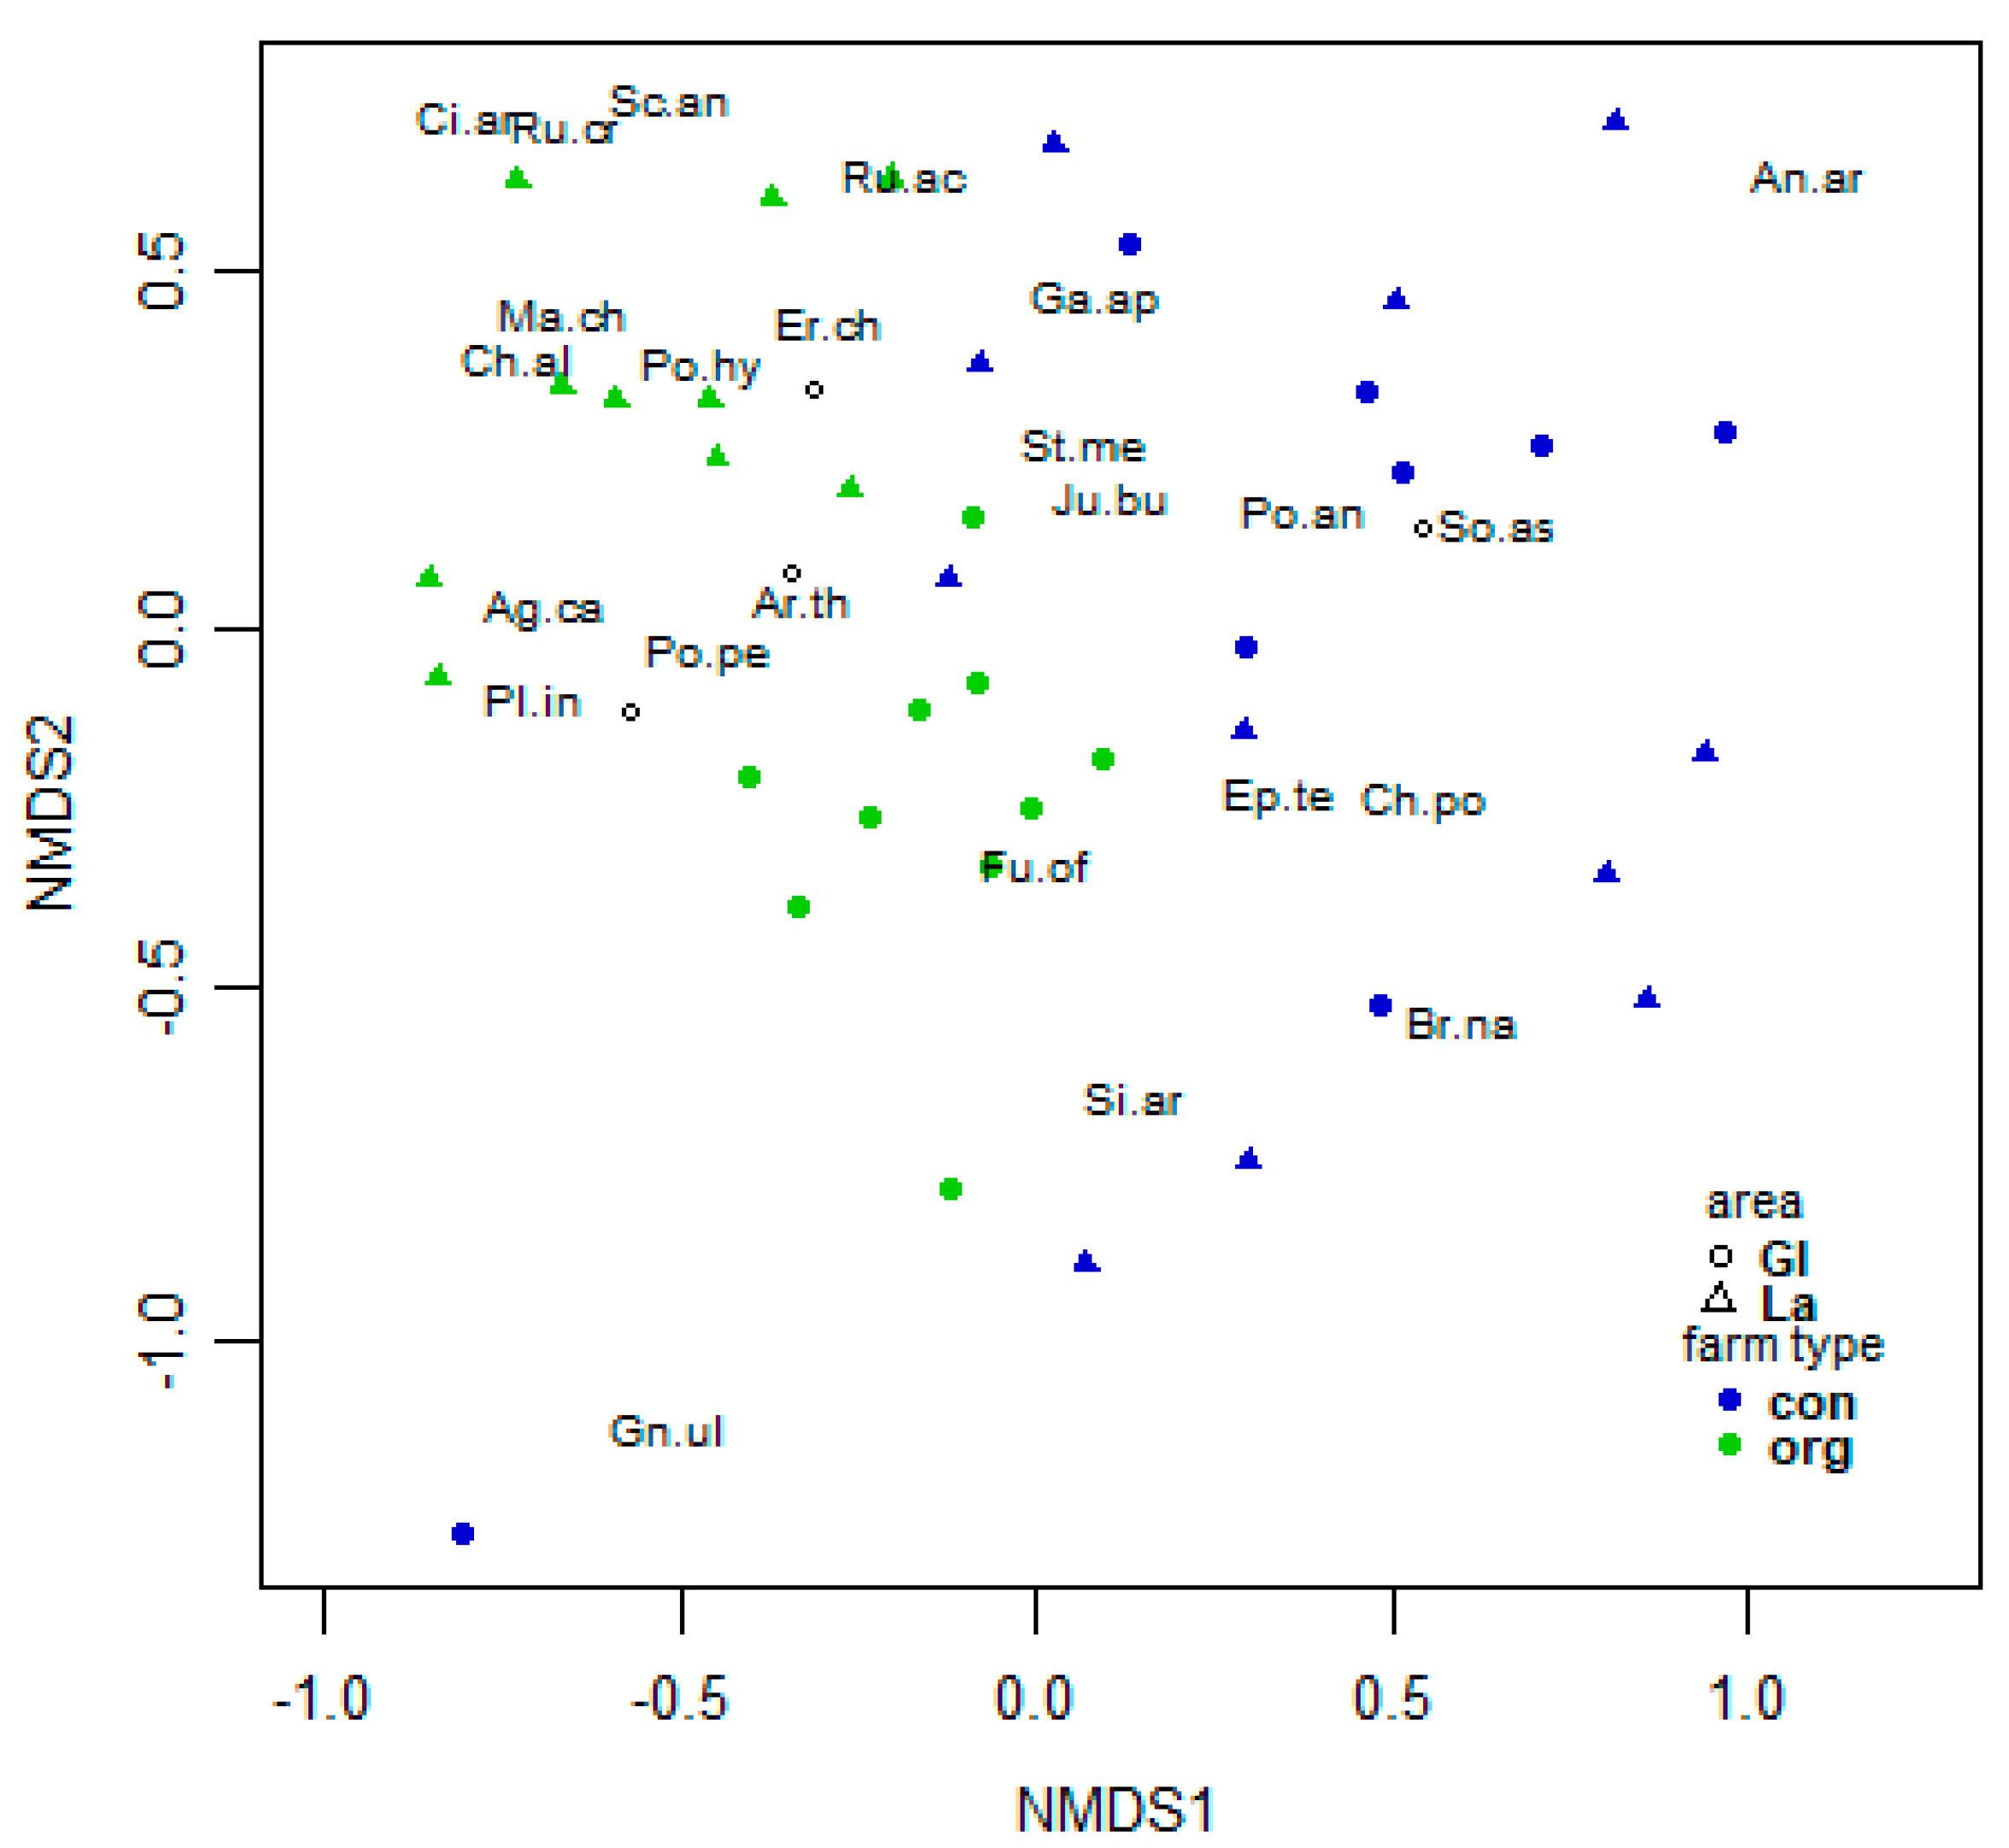
3.2. Soil Seedbank of the Arable Weeds

The reservoir of seeds of mostly annual arable plant species in the soil is an important parameter for analyzing the emerged arable weed flora of the past. Moreover, the soil seedbank allows forecasts regarding to the composition of futures’ arable plant communities and it provides information for conservation and regulation strategies for arable plant species [34,35].
The response variable in the soil seedbank dataset (individual numbers) is not normally distributed and follows a Poisson-distribution. For that reason, a Generalized Linear Model was chosen to conduct the analyses. A model with three fixed factors and two interaction terms was found to be the model with the best performance and predictive power. The results of the model are given in Table 3.
Soil seedbank data was tested with a GLM concerning the impact of the factors area, management, soil depth and two two-way interaction effects between those mentioned factors. The Dredge-Function of the R-package “MuMIn” was used to find the model with the best performance and predictive power. Using the AIC and the AIC delta as a criterion for model selection, the model including all factors and two out three interaction effects was found to be the best one for modelling the individual numbers per square meter. For this model, AIC was 6149.2 and AIC delta was 0.17.
For the soil seed bank species numbers differed significantly from each other between the different farming methods (conventional and organic). Belowground species numbers were twice as high (18 species) as those in the conventional alternative (nine species) as depicted in the left part of Figure 5.
A Kruskal–Wallis test was conducted with the software “R studio” to assess if organic farming period has a significant effect on the seed numbers of the soil seedbank. Testing results were significant, indicating significant differences in the data. Pairwise Wilcoxon test was followed up indicating significantly higher seed numbers of 18 and 27 years of organic growing, compared to 14 years of organic growing. Other groups did not differ significantly from each other. In the study, a maximum seed density is reached between 18 and 27 years of organic farming. After this period, the tendency of a decrease in species numbers per square meter can be observed.
As shown in Figure 6, the number of weed seeds per square meter differs from organic management systems as affected by different time periods of organic growing. A Kruskal-Wallis Test was conducted to detect significant differences in the data. Results of this test are given in Table 4, indicating significant higher seed numbers after 27 years of organic growing compared to 14 years, and also, the number of weed seeds in the soil per square meter is significantly higher in systems of 18 years organic farming, compared to those of 14 years. Evidence of an increase of the soils’ seed potential with an increasing time period of organic growing could be stated. This observation is applicable for the organic growing period until 27 years. Thereafter, however, the increase of seed numbers stagnates or fluctuates.

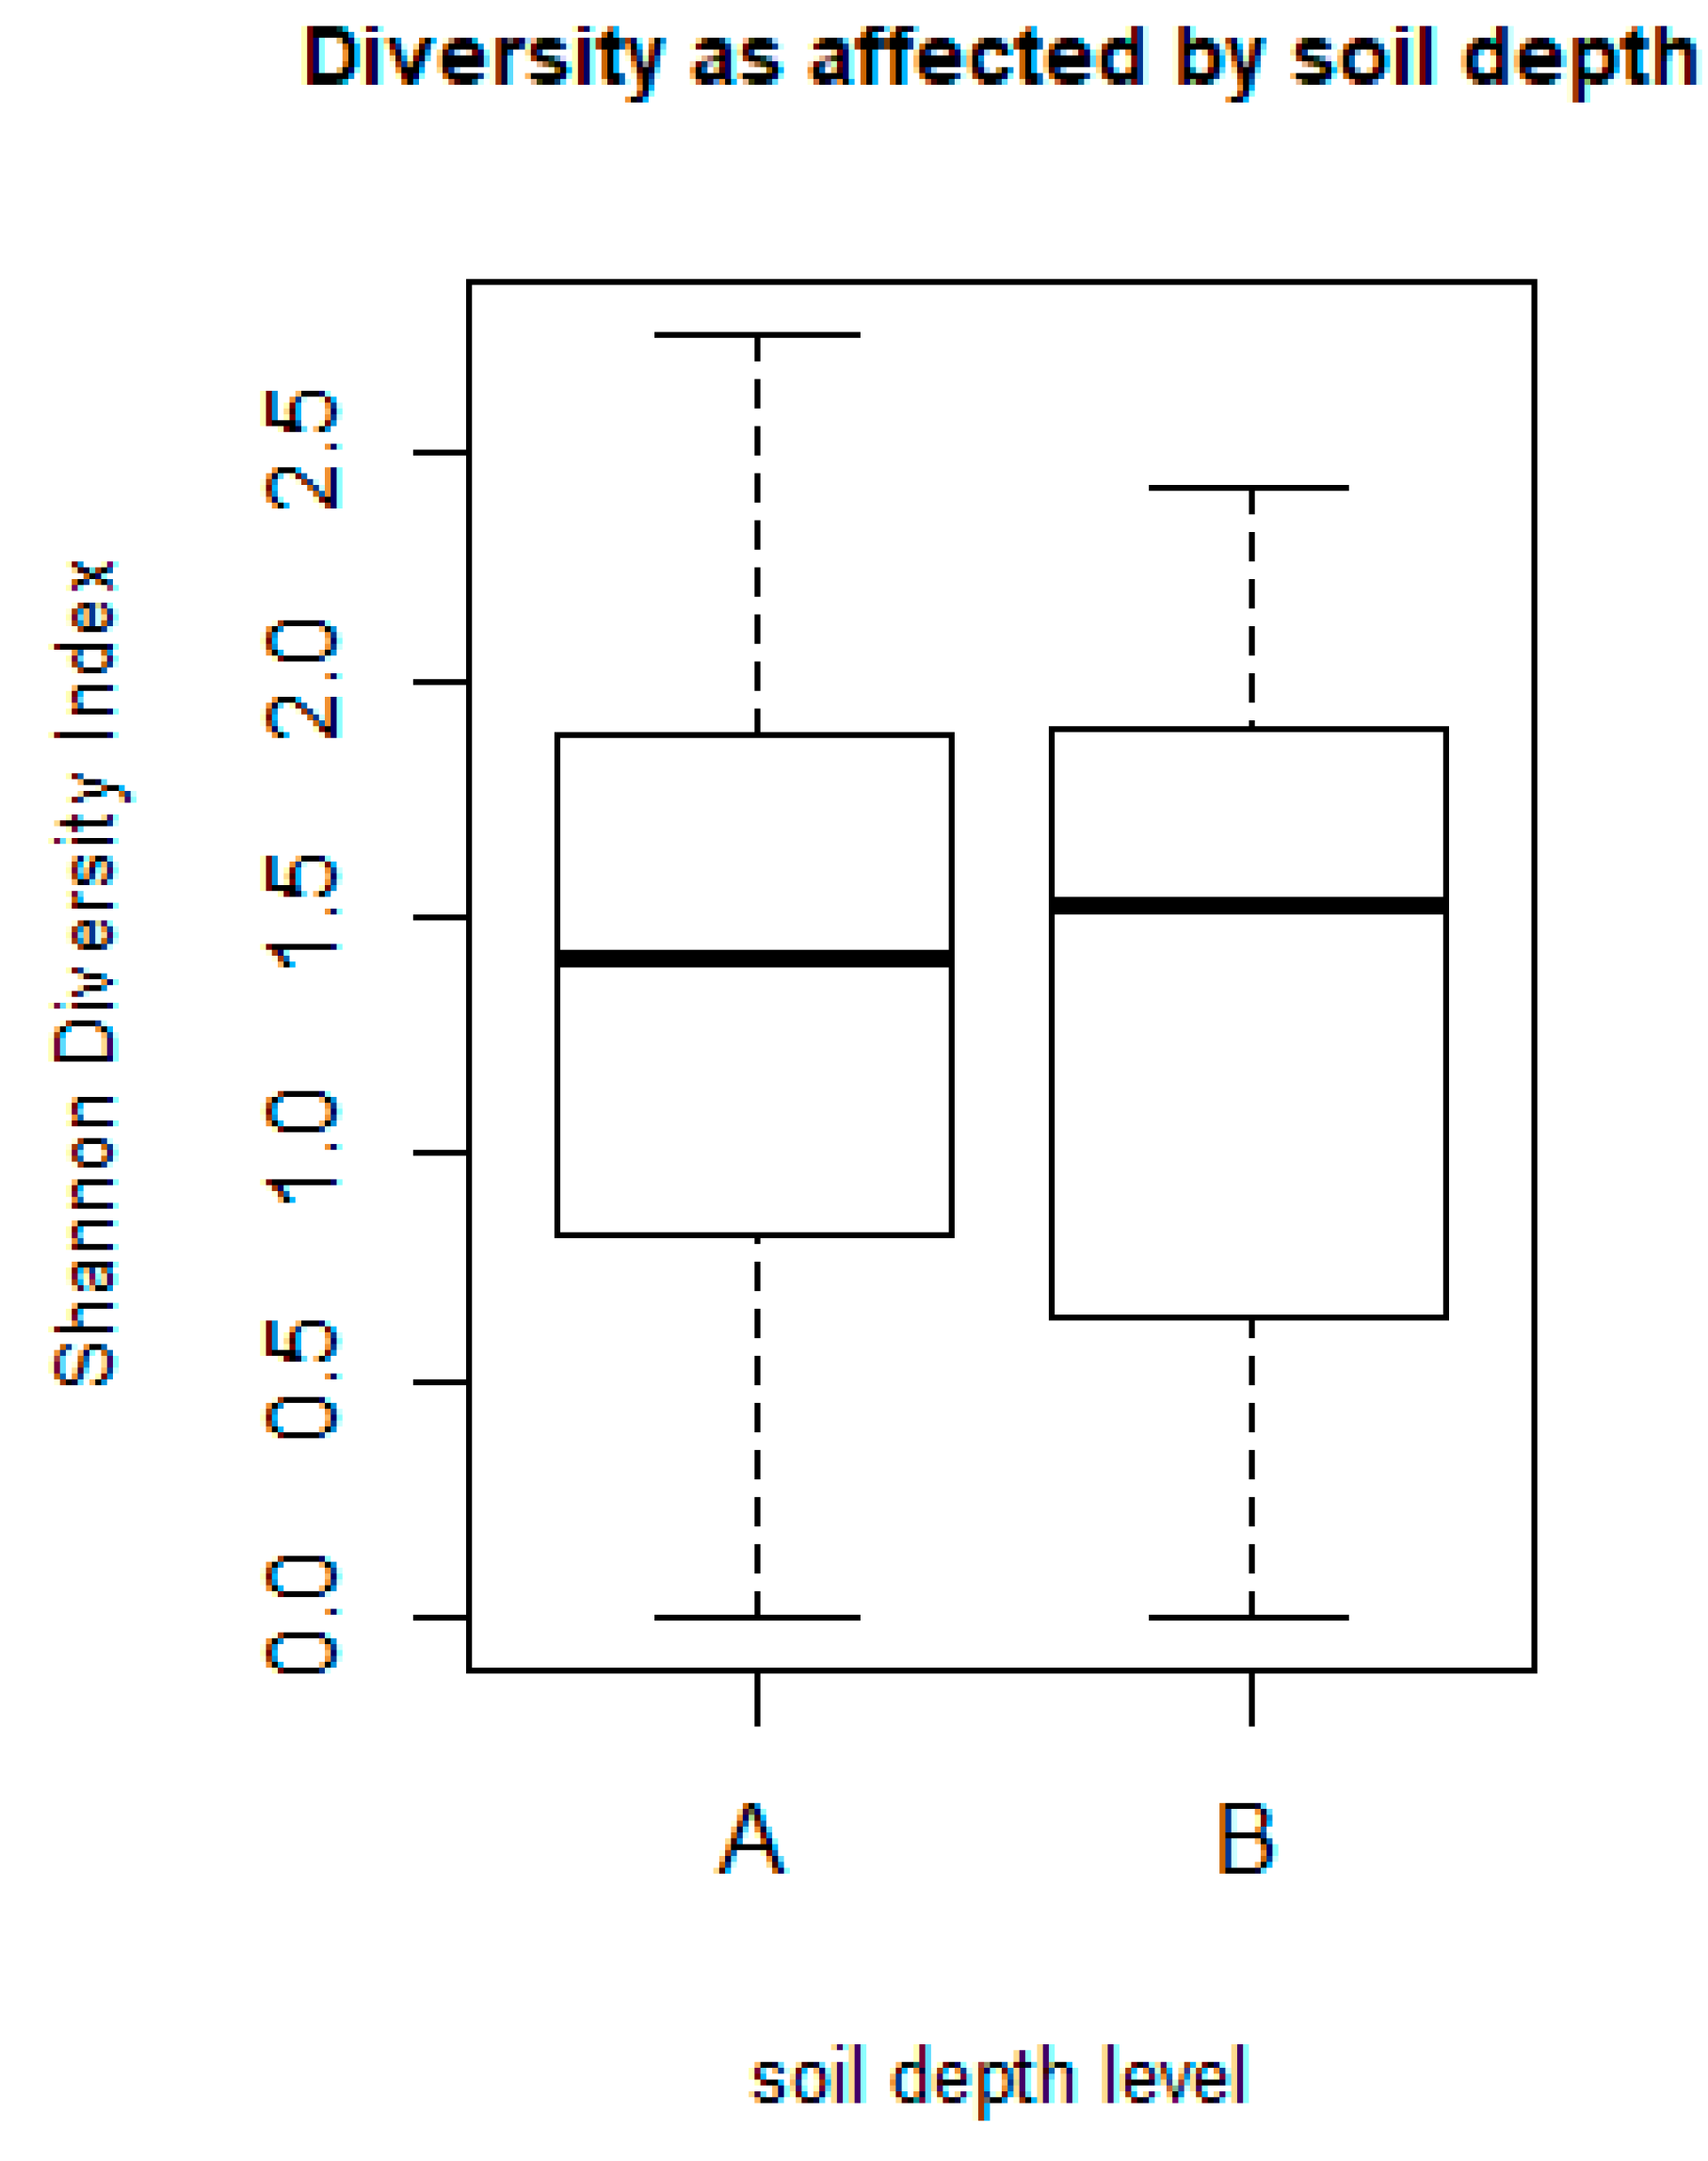
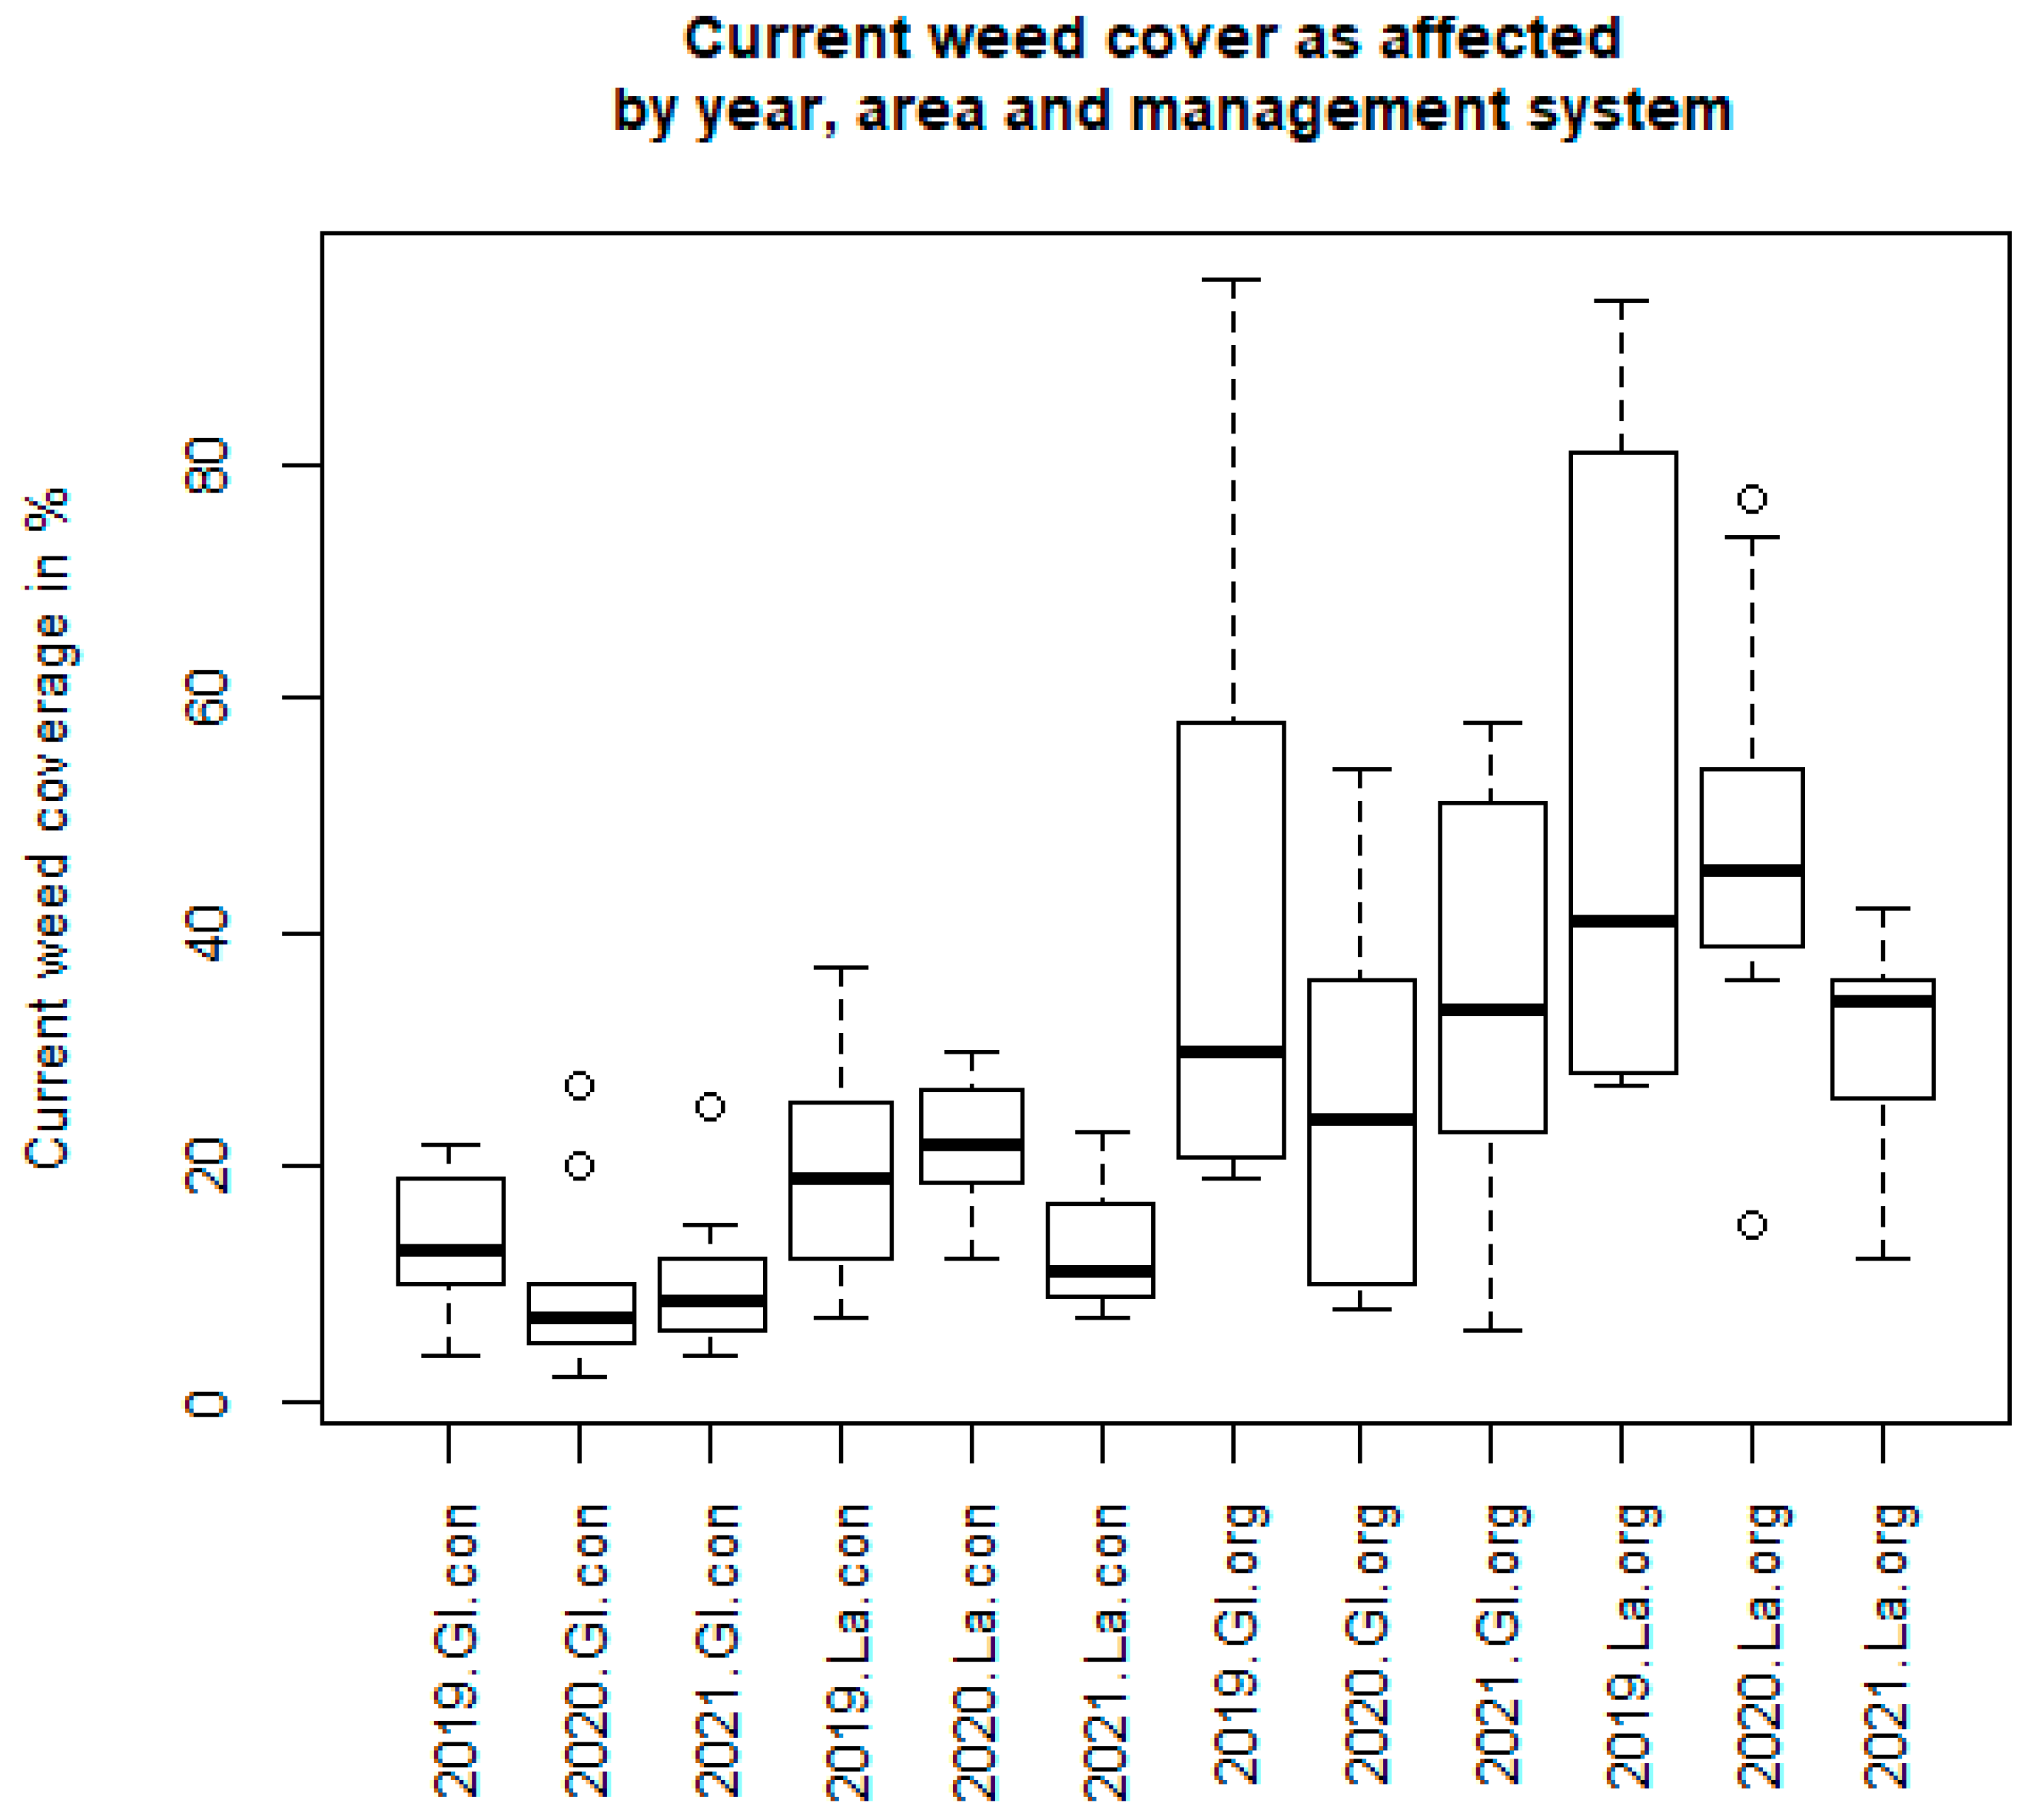
3.2.1. Analysis of Spring Vegetation

The seedbank data set was divided into three subgroups to access the effect of seasonal changes in the plant species communities. The first group includes species of the seedbank that germinated during a four-week period of April 2019, the second one contains those seedlings from June 2019 and the third one contains all additional seedlings from October 2019. Main germination of seeds was in June 2019. Way fewer seedlings emerged in autumn and spring. As shown in the graphical result of an NMDS in Figure 7, Organic farming systems provide the highest species richness and species abundance. Species showing higher occurrences in conventional farming during spring are Chenopodium polyspermum, Galium aparine and Juncus bufonius.
In organic farming systems, Chenopodium album, Plantago intermediae and Rumex acetosella and Cirsium arvense showed higher abundances than in conventional farming systems.
Arable weeds of the soil seed bank samples were analyzed with a Nonmetric Multidimensional Scaling ordination (NMDS) as shown in Figure 8. Resulting from this analysis, the management system has the main effect on explaining the variance in species abundance of the soil seedbank.
So, the impact of the farming practice could be stated in both, current vegetation and seedbank. There is a clear grouping of species concerning their occurrence pattern. Organic farming includes the highest proportion of total species numbers. There are a few species found more frequently in conventional farming systems. Tendencies found in current vegetation data are partially reflected by the soil seedbank.
Following seedbank data, the weed species Polygonum aviculare, Poa trivialis, Solanum nigrum, Stellaria media and Juncus bufonius appear as tolerant towards intensive farming methods, whereas the highest proportion of the total species number is only found in organic farming conditions at a higher abundance level. In current vegetation on arable fields, 49 segetal species were identified, which is a share of 60%. In total, 82 species that were identified in the soil seedbank over all fields were included in the experiment. Centaurea cyanus and Papaver rhoeas were mostly found under organic farming conditions which is reflected by both seedbank data and current vegetation. However, the impact of farming practice is considerably higher in the seedbank.
The current vegetation is more directly affected by environmental conditions like climate (rainfall) which results in a higher fluctuation. In contrast, the soil seedbank is reacting way slower and delayed to a change in environmental conditions. The seedbank represents the intensity level in farming over the last couple of years. The management system is the major factor whereas the area shows a lower significance for explaining the variance.
Figure 8 shows higher species numbers in organic cropping systems, indicated by the clustering of species along the factor organic management.
Species tend to have a lower distribution and spread along the factor of environment. Some species show tendencies to occur either in more extensive or more intensive farming. Species that are more likely found in intensive farming are Solanum nigrum, Matricharia chamomilla and Stellaria media. Under less intensive conditions, Fumaria officinalis, Centaurea cyanus and Holcus lanatus can be found more likely.

3.2.2. Indicator Species Analysis

Therefore, a grouping vector of sites was built on the basis of the four field trial variants consisting of two landscape areas (Lahn valley = La, Hillsites = Gl) and two management systems (organic = org, conventional = con). The assumption was met that both management system and landscape area could have an impact on the constellation of segetal species in arable fields.
For the area of Gladenbach and Lahntal under organic farming, the indicator species Tripleuspermum inodorum and Myosotis arvensis, Alopecurus myosuroides were the most significant indicators. Following the methodology from De Cáceres (2020) an indicator species analysis was conducted using the R package “indicspecies”. After running the analysis, 16 of 82 species in total were identified as indicator species. K-means algorithm was used to assign the species to four different groups. Following this procedure, four site group combinations were calculated as shown in Table 5. Most of the indicator species are found in organic farming systems (group-nr. 1), way fewer under conventional farming conditions (groups 2 + 3 +4). A principal component analysis was conducted which resulted in an optimal number of four species groups. Within the four groups the proportion of explained variance in the data is around 76.7%. An indicator species analysis was conducted with the results shown in the table below. In organic farming, there are many species that can be used as indicators for organic managed sites; in contrast there are only two species as indicators for intensive farming methods of conventional agriculture, which are in this case Daucus carota and Anthemis arvensis. In this study, Vicia hirsuta, Cirsium arvenese and Rumex crispus were detected as indicator species for organic management systems. Intensive farming methods can be indicated by the species Daucus carota and Anthemis arvensis.

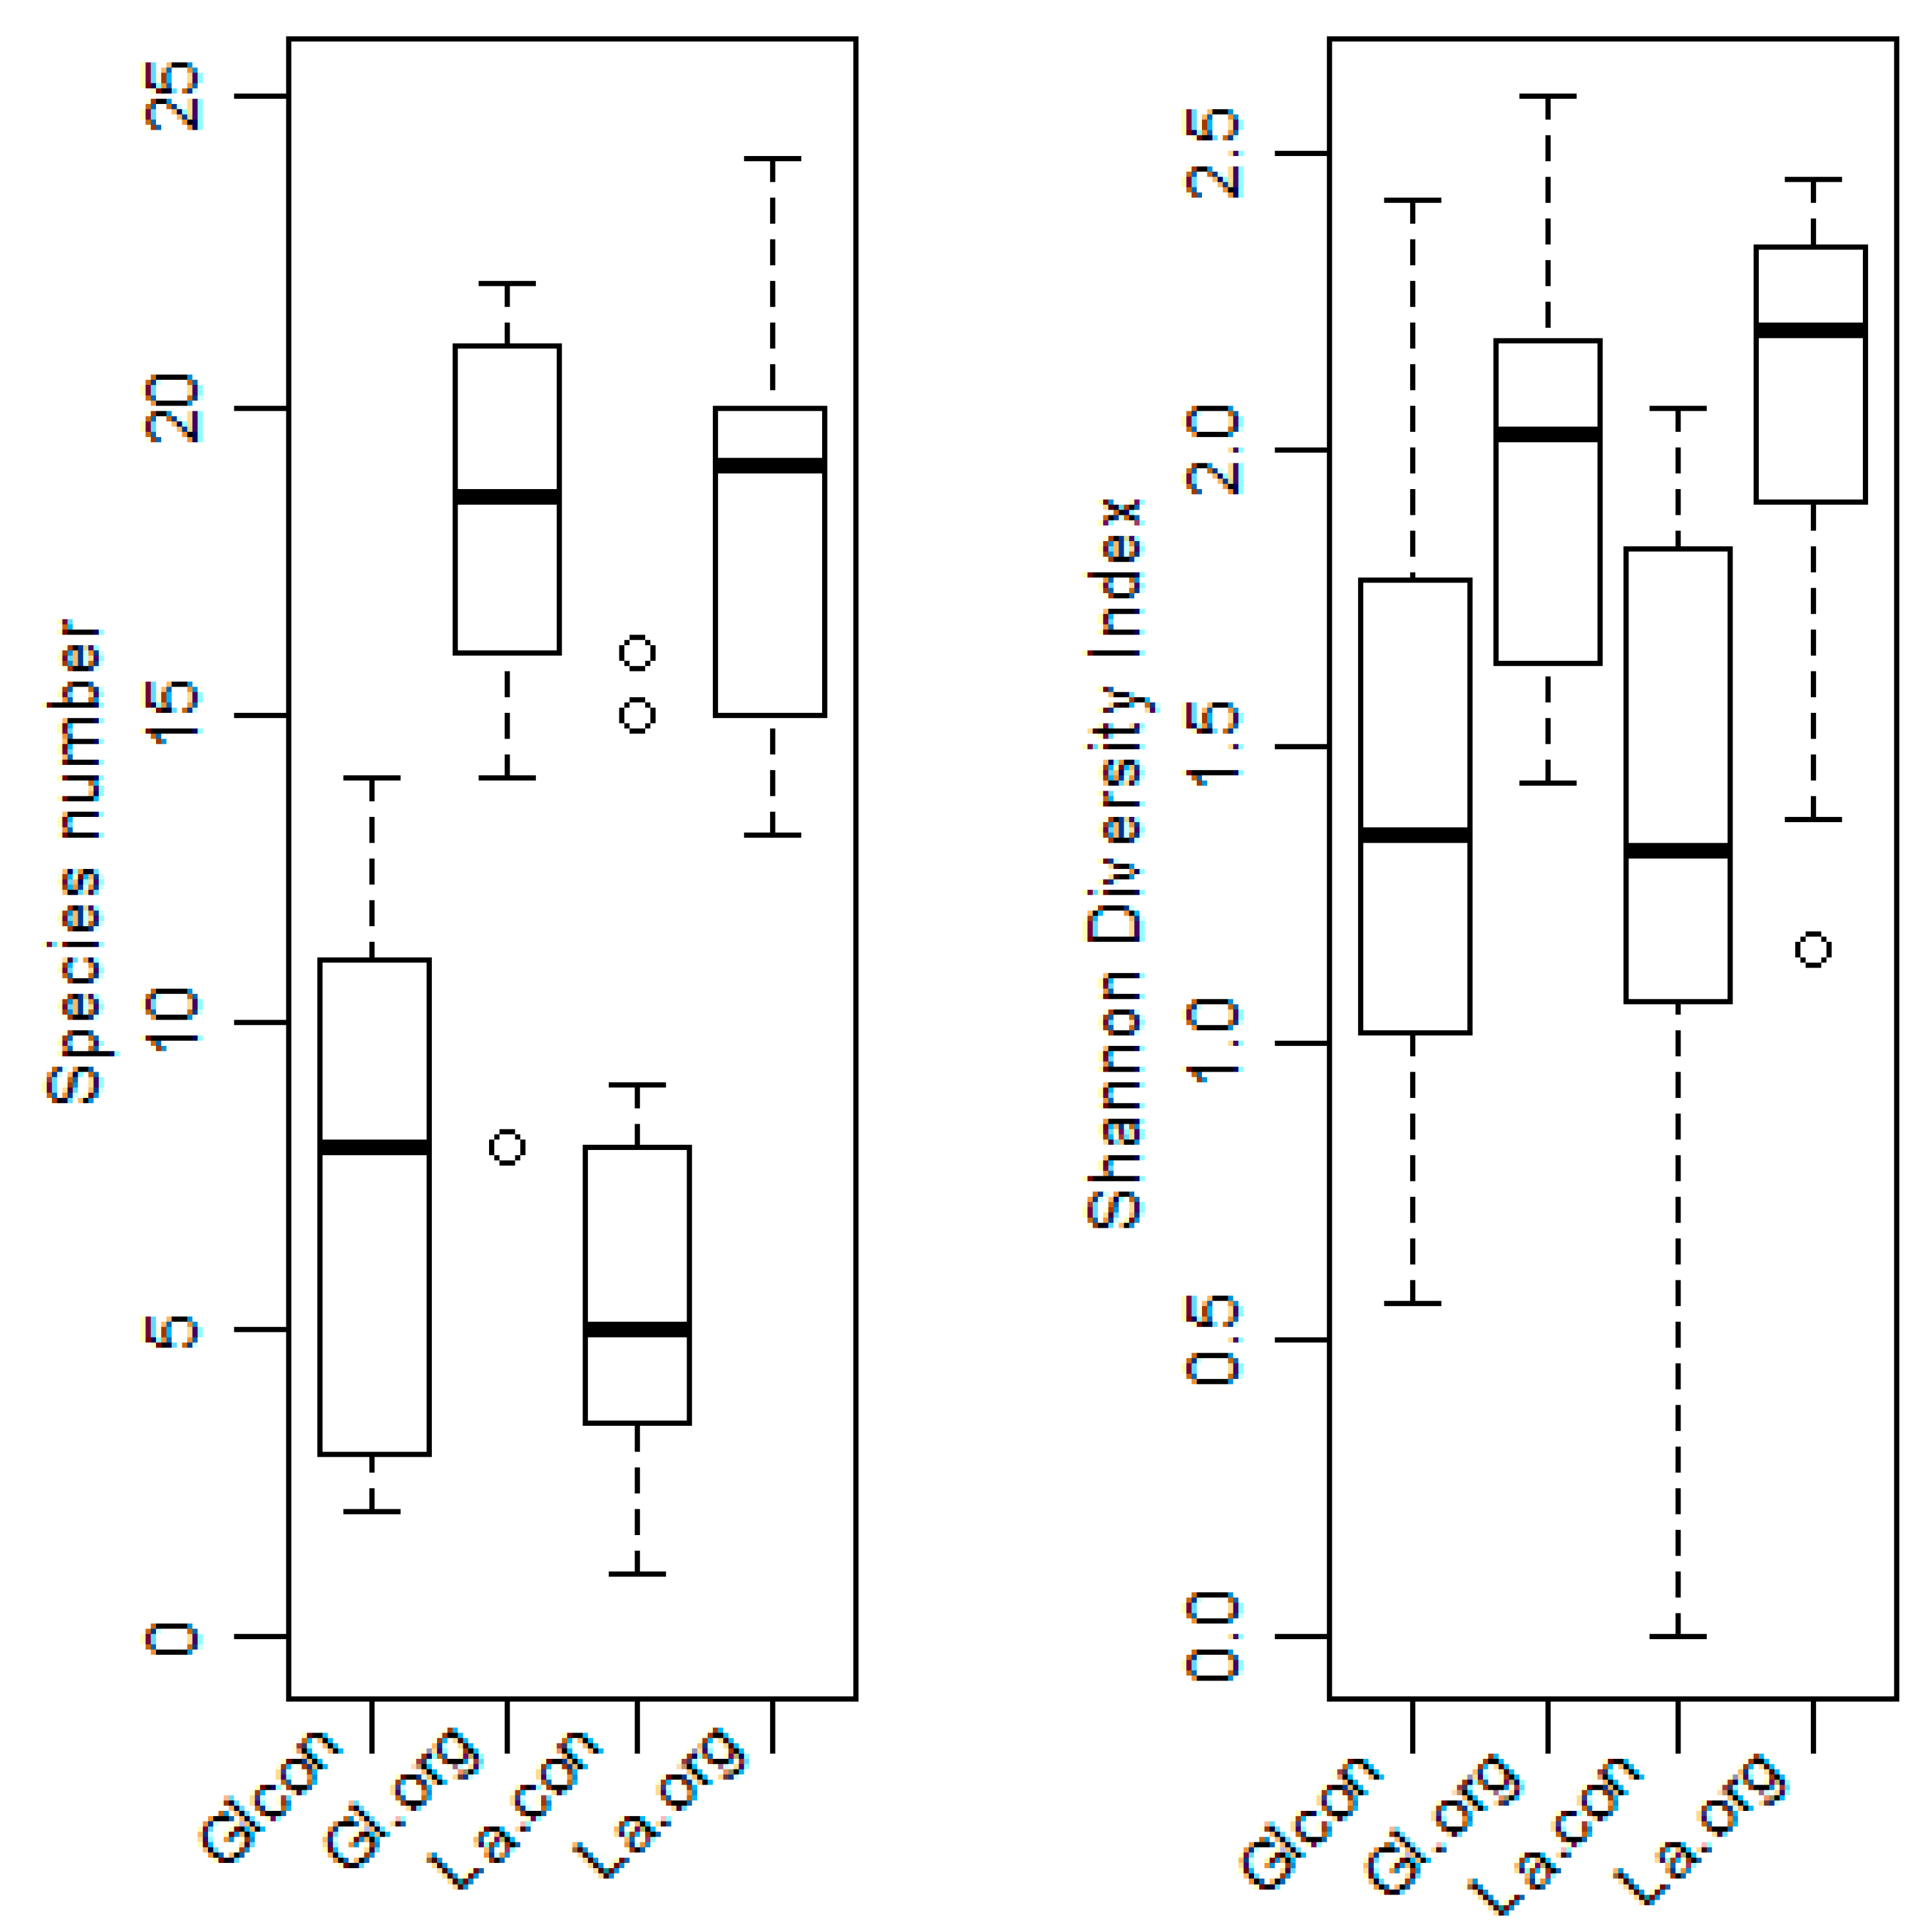
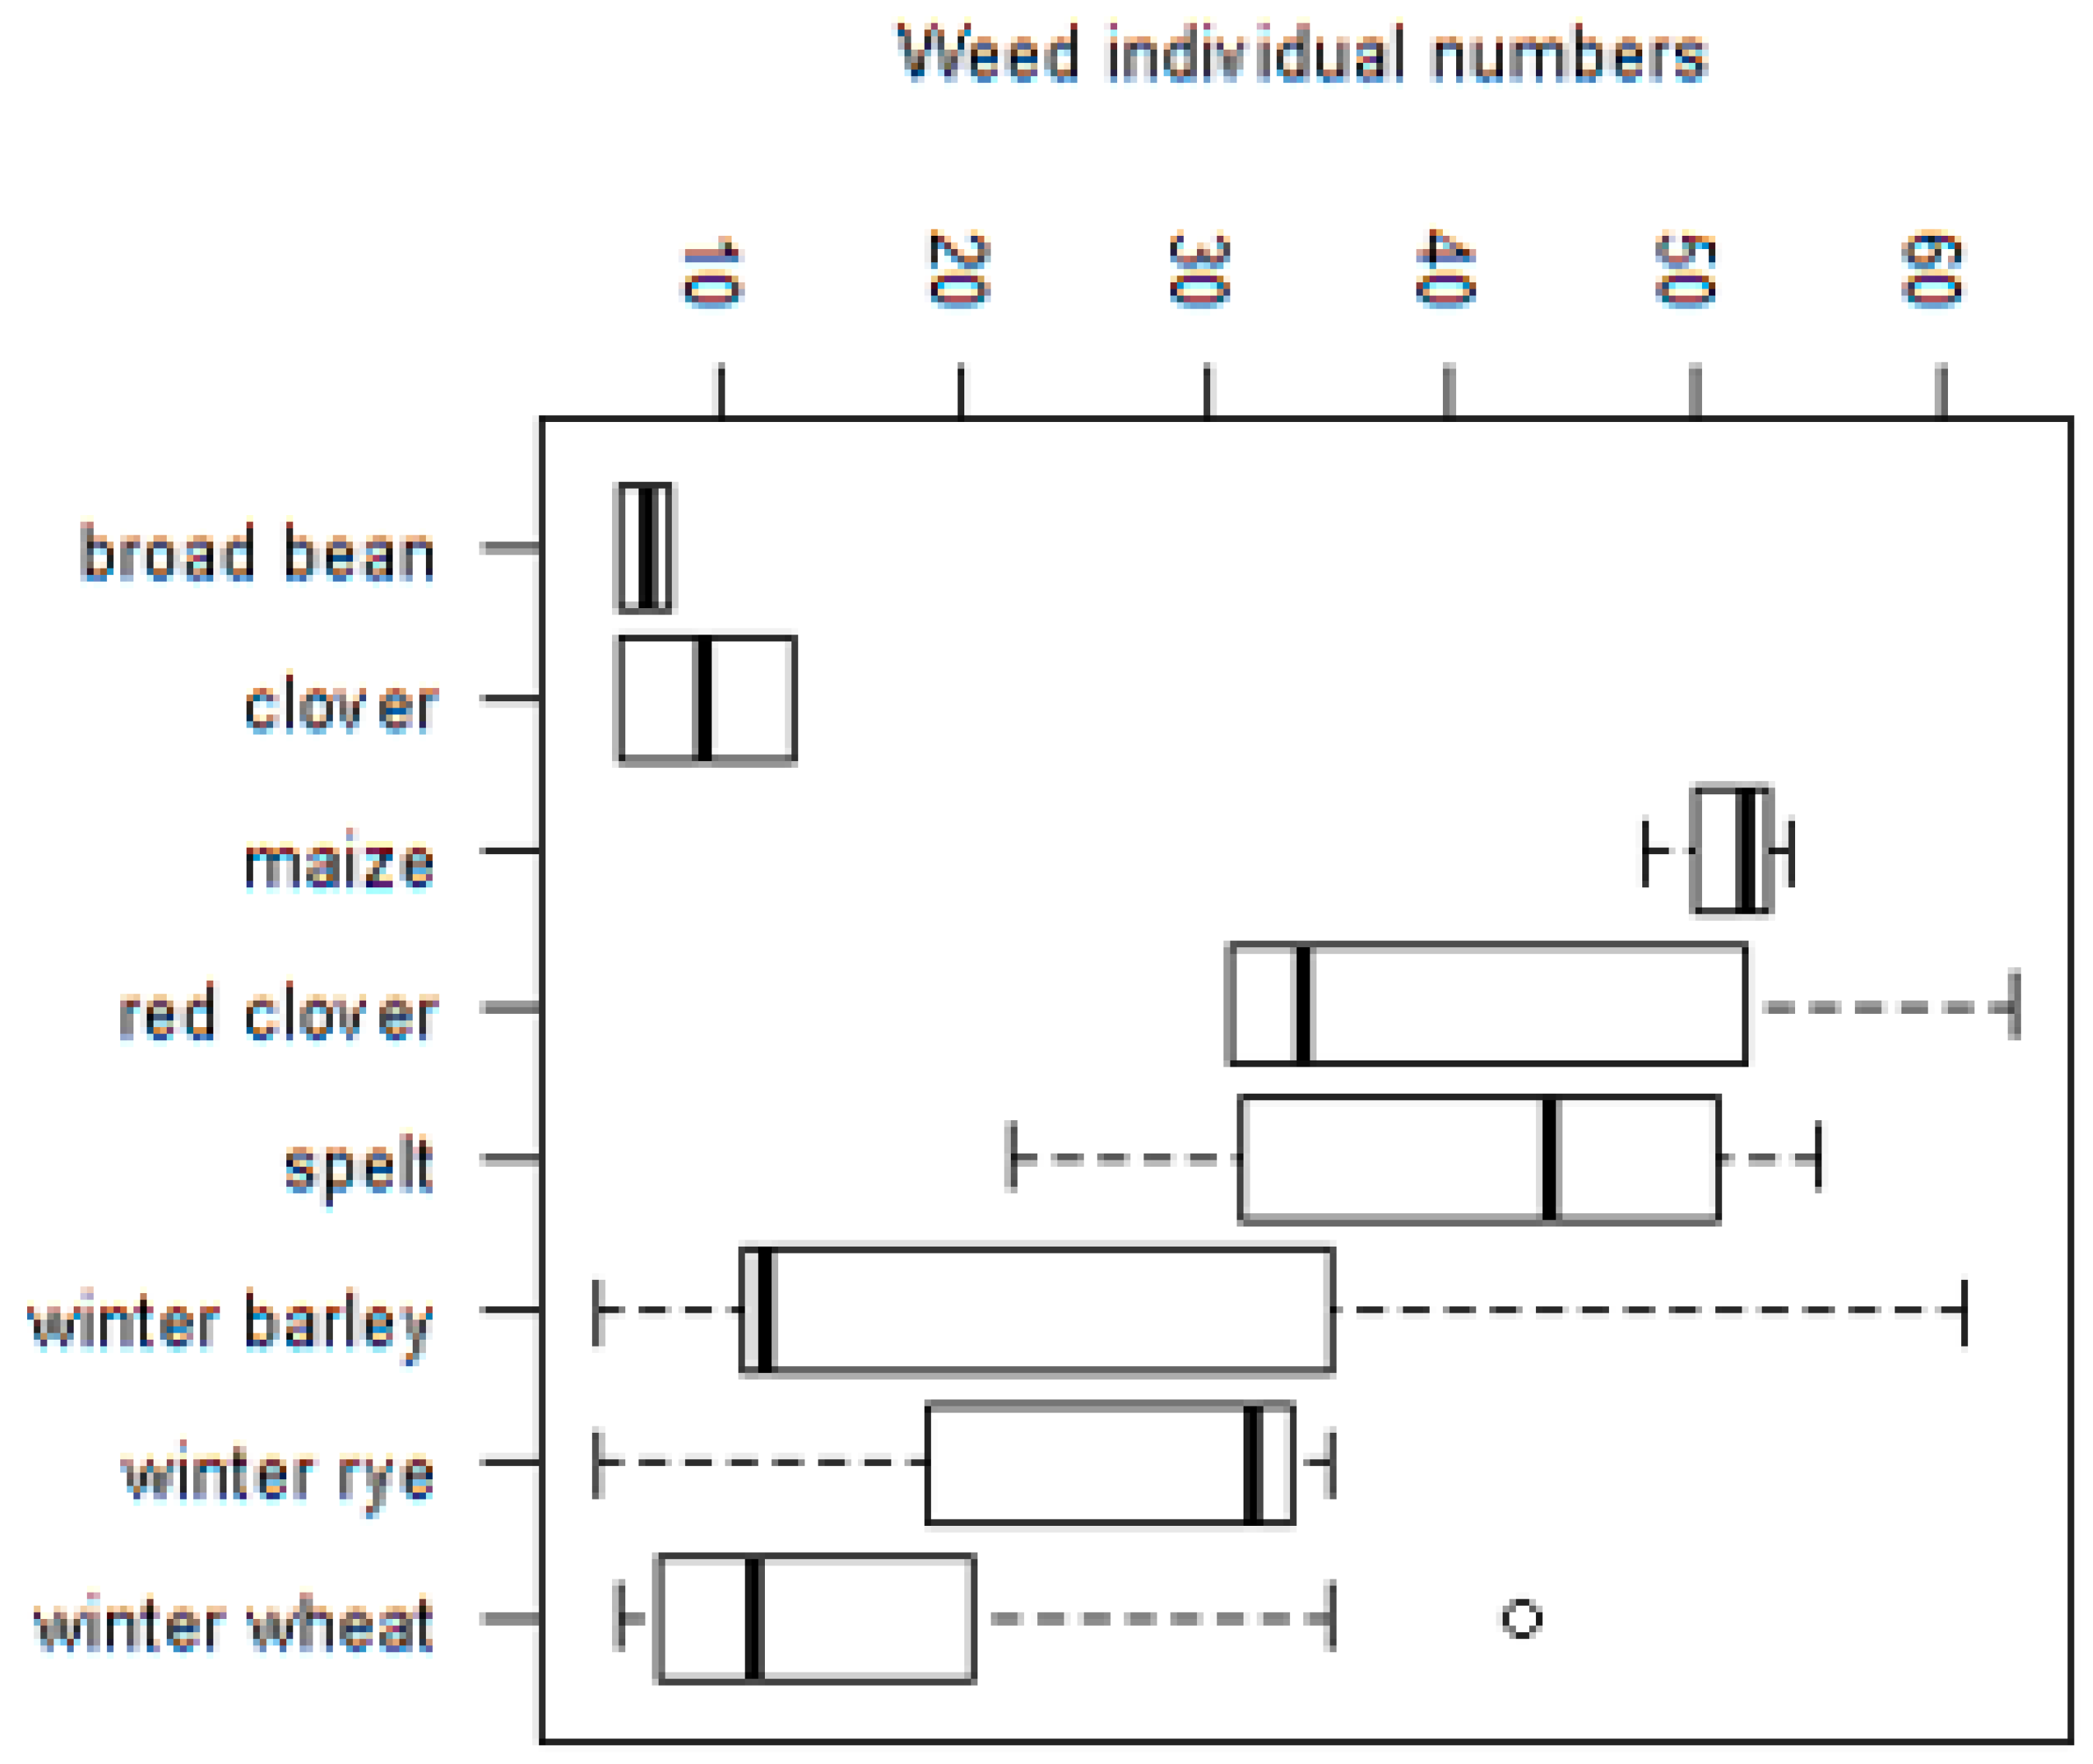
3.2.3. Impact of Crop Type on Species Richness

The effect of crop type has been stated by several studies with mainly a higher species richness and less geophytes in cereal fields than in root crops [36]. As shown in Figure 9 high variation in the weed individual numbers could be observed with significant differences between the crop types.
The highest species and individual numbers were found in the crops maize, red clover and spelt, whereas broad bean and winter wheat showed the lowest individual numbers per square meter.
To access the floristic similarity between the sites, Sorensen quantitative similarity index was calculated:
Sorensen’s qualitative index = 2C/A + B × 100%
where:
  • A—the number of species in one of the two communities compared.
  • B—the number of species in the second community compared.
  • C—the number of common species in the compared communities.
In Table 6, Sorensen’s Qualitative Similarity Index is given for each of the considered pairs of variants. Similarity between organic fields in two different sites was 65% and higher than those between organic and conventional sites (57.3%). Organic and conventional fields differ more in their species composition than organic fields among each other in different locations. However, the similarity between the organic fields is not considerably higher than those between conventional and organic farms, indicating that regional differences between arable weed communities might play a role although on a smaller regional scale.
As shown in Figure 10, Shannon Diversity varied between spring and summer season. Significant higher Diversity values were found during the summer season. As Mennan & Ngouajio [37] stated, there are seasonal cycles in the germination patterns of the weeds Galium aparine and wild mustard (Brassica kaber). Highest germination rates were stated during May with around 70% germination and a strong decrease in germination of around 30% in August.
Diversity of arable weed communities differs between spring and summer. Higher diversity is found during the summer months, since new species have germinated and contribute to a higher index.
Studies of Lososová et al. [36] stated seasonal dynamics as a factor causing changes in arable plant community composition with higher species richness and beta diversity during the summer months. Species that were found in summer were mostly those also present in the spring germination.
There is no significant difference in species diversity between the two areas. There is no significant effect of the landscape area on the diversity of segetal species of arable fields. Studies by Swanton et al. [38] suggest that there is an interaction effect between tillage system and soil type which may influence the distribution of soil seed bank vertically. The management showed significant effects on species diversity. Shannon Diversity Index is almost two times higher in organically managed fields than in the conventional ones. Several studies have stated the impact of an increasing farming intensity (herbicide application, plowing, fertilizing) on the diversity of arable plant communities. With higher intensity levels in farming, diversity of arable plant communities decreased significantly [10,39,40,41,42].
The hypothesis was tested that there is a different accumulation rate of weed seeds in different soil depths resulting in different diversity indices. Therefore, a Kruskal-Wallis Test was conducted which has not become significant. Shannon Diversity Indices were plotted, as shown in Figure 11. Though, species diversity has not been affected by the depth level of the soil sample. The farmers of the study fields have used a mixture of reduced tillage and ploughing. The arable fields show a homogenous mixture of seeds in the soil at a testing depth of 20 cm. A significant difference in the seed number and Shannon Diversity Index could not be found. This observation has also been stated by studies of Feledyn-Szewczyk et al. [43] which showed the effect of the tillage system on the absolute weed seed numbers in the soil and their vertical distribution in the soil of arable fields. Feledyn-Szewczyk et al. [43] showed that reduced tillage systems and ploughing systems tend to establish a mixture of seeds in the soil with higher average seed numbers in reduced tillage systems (4515 seeds m−2 ) compared to ploughing systems (2080 m−2).
Studies by Clements et al. [40] analyzed the impact of different soil tillage methods on the seedbank composition of different weeds. It was found that deep soil tillage, like plowing, results in a more homogeneous distribution of the seedbank over depth. In contrast, in a system with minimal soil tillage, Clements et al. [40] assumed that the upper 5 cm of the soil comprises over 60% of the seed bank. Research by Buhler et al. [41] could identify grass seed accumulation in minimal tillage systems and found higher accumulation rates at the deeper soil levels in moldboard plowing systems.

4. Discussion

Studies on the arable weed flora in the center of the German state Hesse could state a strong reaction of both spontaneous flora and soil seedbank towards the farming intensity. Among others, farming intensity has been identified as the factor with the strongest impact on species numbers, abundances and distribution patterns of arable weeds.
Species numbers derived from soil seedbank data were on average twice as high in organically managed fields (18 species) compared to conventional ones (nine species). For the relevé data, species numbers and diversity indices (Shannon Diversity) were significantly higher in organic cropping systems. Relevés included usually a proportion of the seedbank species so not all species present in the soil seedbank were also found in the relevés.
Besides management system, the crop type played a minor role in explaining differences in species richness and diversity indices. Results from NMDS analysis have shown that highest species richness can be found in organic farming systems in both landscape areas—in Valley of river Lahn and the hill site of Gladenbach. Therefore, landscape area was not detected as a factor for explaining significant differences in species distribution. The hypothesis of a difference in species and individual numbers in different soil depth levels could not be stated, however. A reason for this might be that soil tillage is applied on the study sites. The use of plow and grubber might result in a mixture of soil horizons so seeds will be mixed as well. Comparing germination numbers and diversity indices of different seasons showed a tendency of a slightly higher diversity values in summer compared to spring, significant differences could not be found.
The study could state the assumption that organic farming contributes to the regeneration of the arable seed bank. The period of organic growing affects the abundance and species richness of the arable weed species pool of the soil. Tendencies of an accumulation of seeds in the soil over time were identified. Evidence was also found in the data that, at some point in time, the seedbank increase stagnates again and stays more or less stable on a certain level of seeds per square meter.
Compared to the conventional managed fields, the organically managed fields showed significantly higher species numbers and also Shannon Diversity increased in these fields. Evidence was found that long-term intensive farming conditions result in a depletion of the seed reservoir of arable weeds in the soil, as stated by other studies as well [43,44,45,46].
Regarding the project fields, organic farming could double average seedbank species numbers in the fields from an average of 10 species per field in conventional farming systems to average of 20 species per field in organic farming systems. Crops had a significant effect on the distribution of arable weeds with higher diversity values in winter crops and lower diversity indices in spring grown crops. The season also had a significant impact on species numbers, with the highest species numbers during the summer months.

Author Contributions

Conceptualization, P.K. and R.W. All authors have read and agreed to the published version of the manuscript.

Funding

The study was carried out under the project “Impact of an innovative combine harvesting technique on biodiversity in the agrarian landscape—a pilot study in the region Marburg-Biedenkopf” funded by the German ministry of the environment (Bundesamt für Naturschutz (BfN) Konstantinstrasse 110, 53179 Bonn, Germany) with the funding number 3518892013.

Acknowledgments

Many thanks to Josef Scholz—vom Hofe for support in experimental procedures, field work and sampling and to Laura Ritz for support in data generation and digitalization.

Conflicts of Interest

The authors declare no conflict of interests.

References

  1. Hyvönen, T.; Huusela-Veistola, E. Arable weeds as indicators of agricultural intensity–A case study from Finland. Biol. Conserv. 2008, 141, 2857–2864. [Google Scholar] [CrossRef]
  2. Giam, X.; Bradshaw, C.J.; Tan, H.T.; Sodhi, N.S. Future habitat loss and the conservation of plant biodiversity. Biol. Conserv. 2010, 143, 1594–1602. [Google Scholar] [CrossRef]
  3. Lemoine, C.; Sérusiaux, E.; Mahy, G.; Piqueray, J. Agro-environmental scheme for segetal plant conservation in Wallonia (Belgium): An assessment in conventional and organic fields. Biotechnol. Agron. Soc. Environ. 2018, 22, 35–44. [Google Scholar] [CrossRef]
  4. Chamorro, L.; Masalles, R.M.; Sans, F. Arable weed decline in Northeast Spain: Does organic farming recover functional biodiversity? Agric. Ecosyst. Environ. 2016, 223, 1–9. [Google Scholar] [CrossRef]
  5. Andreasen, C.; Jensen, H.A.; Jensen, S.M. Decreasing diversity in the soil seed bank after 50 years in Danish arable fields. Agric. Ecosyst. Environ. 2018, 259, 61–71. [Google Scholar] [CrossRef]
  6. Hyvönen, T. Can conversion to organic farming restore the species composition of arable weed communities? Biol. Conserv. 2007, 137, 382–390. [Google Scholar] [CrossRef]
  7. Albrecht, H. Development of arable weed seedbanks during the 6 years after the change from conventional to organic farming. Weed Res. 2005, 45, 339–350. [Google Scholar] [CrossRef]
  8. Carmona, C.P.; Guerrero, I.; Peco, B.; Morales, M.B.; Oñate, J.J.; Pärt, T.; Tscharntke, T.; Liira, J.; Aavik, T.; Emmerson, M.; et al. Agriculture intensification reduces plant taxonomic and functional diversity across European arable systems. Funct. Ecol. 2020, 34, 1448–1460. [Google Scholar] [CrossRef]
  9. Hawes, C.; Squire, G.R.; Hallett, P.D.; Watson, C.A.; Young, M. Arable plant communities as indicators of farming practice. Agric. Ecosyst. Environ. 2010, 138, 17–26. [Google Scholar] [CrossRef]
  10. Fonderflick, J.; Besnard, A.; Chardès, M.-C.; Lanuzel, L.; Thill, C.; Pointereau, P. Impacts of agricultural intensification on arable plants in extensive mixed crop-livestock systems. Agric. Ecosyst. Environ. 2020, 290, 106778. [Google Scholar] [CrossRef]
  11. Rotchés-Ribalta, R.; Blanco-Moreno, J.M.; Armengot, L.; Chamorro, L.; Sans, F.X. Both farming practices and landscape characteristics determine the diversity of characteristic and rare arable weeds in organically managed fields. Appl. Veg. Sci. 2015, 18, 423–431. [Google Scholar] [CrossRef]
  12. Gaba, S.; Perronne, R.; Fried, G.; Gardarin, A.; Bretagnolle, F.; Biju-Duval, L.; Colbach, N.; Cordeau, S.; Fernández-Aparicio, M.; Gauvrit, C.; et al. Response and effect traits of arable weeds in agro-ecosystems: A review of current knowledge. Weed Res. 2017, 57, 123–147. [Google Scholar] [CrossRef]
  13. Cavan, G.; Cussans, J.; Moss, S.R. Modelling different cultivation and herbicide strategies for their effect on herbicide resistance in Alopecurus myosuroides. Weed Res. 2000, 40, 561–568. [Google Scholar] [CrossRef]
  14. Menchari, Y.; Camilleri, C.; Michel, S.; Brunel, D.; Dessaint, F.; Le Corre, V.; Délye, C. Weed response to herbicides: Regional-scale distribution of herbicide resistance alleles in the grass weed Alopecurus myosuroides. New Phytol. 2006, 171, 861–874. [Google Scholar] [CrossRef] [PubMed]
  15. Yu, Q.; Abdallah, I.; Han, H.; Owen, M.; Powles, S. Distinct non-target site mechanisms endow resistance to glyphosate, ACCase and ALS-inhibiting herbicides in multiple herbicide-resistant Lolium rigidum. Planta 2009, 230, 713–723. [Google Scholar] [CrossRef]
  16. Storkey, J.; Neve, P. What good is weed diversity? Weed Res. 2018, 58, 239–243. [Google Scholar] [CrossRef]
  17. Seifert, C.; Leuschner, C.; Culmsee, H. Arable plant diversity on conventional cropland—The role of crop species, management and environment. Agric. Ecosyst. Environ. 2015, 213, 151–163. [Google Scholar] [CrossRef]
  18. Albrecht, H.; Cambecèdes, J.; Lang, M.; Wagner, M. Management options for the conservation of rare arable plants in Europe. Bot. Lett. 2016, 163, 389–415. [Google Scholar] [CrossRef] [Green Version]
  19. Wood, T.J.; Holland, J.M.; Goulson, D. Providing foraging resources for solitary bees on farmland: Current schemes for pollinators benefit a limited suite of species. J. Appl. Ecol. 2017, 54, 323–333. [Google Scholar] [CrossRef]
  20. McGinlay, J.; Parsons, D.J.; Morris, J.; Hubatova, M.; Graves, A.; Bradbury, R.B.; Bullock, J.M. Do charismatic species groups generate more cultural ecosystem service benefits? Ecosyst. Serv. 2017, 27, 15–24. [Google Scholar] [CrossRef] [Green Version]
  21. Smith, B.M.; Aebischer, N.J.; Ewald, J.; Moreby, S.; Potter, C.; Holland, J.M. The Potential of Arable Weeds to Reverse Invertebrate Declines and Associated Ecosystem Services in Cereal Crops. Front. Sustain. Food Syst. 2020, 3, 118. [Google Scholar] [CrossRef]
  22. Kolářová, M.; Tyšer, L.; Soukup, J. Impact of site conditions and farming practices on the occurrence of rare and endangered weeds on arable land in the Czech Republic. Weed Res. 2013, 53, 489–498. [Google Scholar] [CrossRef]
  23. Rotchés-Ribalta, R.; Armengot, L.; Mäder, P.; Mayer, J.; Sans, F.X. Long-Term Management Affects the Community Composition of Arable Soil Seedbanks. Weed Sci. 2017, 65, 73–82. [Google Scholar] [CrossRef] [Green Version]
  24. Waldhardt, R.; Fuhr-Boßdorf, K.; Otte, A.; Schmidt, J.; Simmering, D. Floristisch-phytocoenotische Diversitäten einer peripheren Kulturlandschaft in Abhängigkeit von Landnutzung. Raum und Zeit. Agrar. 2000, 31, 121–147. [Google Scholar]
  25. Price, J.N.; Wright, B.R.; Gross, C.L.; Whalley, W.R.D.B. Comparison of seedling emergence and seed extraction techniques for estimating the composition of soil seed banks: Comparison of soil seed bank methods. Methods Ecol. Evol. 2010, 1, 151–157. [Google Scholar] [CrossRef]
  26. Rahman, A.; James, T.K.; Mellsop, J.; Grbavac, N. Effect of cultivation methods on weed seed distribution and seedling emergence. New Zealand Plant Prot. 2000, 53, 28–33. [Google Scholar] [CrossRef]
  27. Ahammad, K.; Rahman, M.; Ali, M. Effect of hydropriming method on maize (Zea mays) seedling emergence. Bangladesh J. Agric. Res. 2014, 39, 143–150. [Google Scholar] [CrossRef]
  28. Kolářová, M.; Tyšer, L.; Soukup, J. Weed vegetation of arable land in the Czech Republic: Environmental a management factors determining weed species composition. Biologia 2014, 69, 443–448. [Google Scholar] [CrossRef]
  29. Hyvönen, T.; Ketoja, E.; Salonen, J.; Jalli, H.; Tiainen, J. Weed species diversity and community composition in organic and conventional cropping of spring cereals. Agric. Ecosyst. Environ. 2003, 97, 131–149. [Google Scholar] [CrossRef]
  30. Feledyn-Szewczyk, B.; Smagacz, J.; Kwiatkowski, C.A.; Harasim, E.; Woźniak, A. Weed Flora and Soil Seed Bank Composition as Affected by Tillage System in Three-Year Crop Rotation. Agriculture 2020, 10, 186. [Google Scholar] [CrossRef]
  31. Berbeć, A.K.; Staniak, M.; Feledyn-Szewczyk, B.; Kocira, A.; Stalenga, J. Organic but Also Low-Input Conventional Farming Systems Support High Biodiversity of Weed Species in Winter Cereals. Agriculture 2020, 10, 413. [Google Scholar] [CrossRef]
  32. van Elsen, T. Species diversity as a task for organic agriculture in Europe. Agric. Ecosyst. Environ. 2000, 77, 101–109. [Google Scholar] [CrossRef]
  33. Chamorro, L.; Armengot, L.; José-María, L.; Sans, F.X. Organic farming enhances the recovery of ancient crops and segetal weeds in Catalonia (NE of Spain). Build. Org. Bridges 2014, 3, 979–982. [Google Scholar]
  34. Mahé, I.; Cordeau, S.; Bohan, D.A.; Derrouch, D.; Dessaint, F.; Millot, D.; Chauvel, B. Soil seedbank: Old methods for new challenges in agroecology? Ann. Appl. Biol. 2021, 178, 23–38. [Google Scholar] [CrossRef]
  35. Schwartz-Lazaro, L.M.; Copes, J.T. A Review of the Soil Seedbank from a Weed Scientists Perspective. Agronomy 2019, 9, 369. [Google Scholar] [CrossRef] [Green Version]
  36. Lososová, Z.; Chytrý, M.; Cimalová, S.; Kropáč, Z.; Otýpková, Z.; Pyšek, P.; Tichý, L. Weed vegetation of arable land in Central Europe: Gradients of diversity and species composition. J. Veg. Sci. 2004, 15, 415–422. [Google Scholar] [CrossRef]
  37. Mennan, H.; Ngouajio, M. Seasonal cycles in germination and seedling emergence of summer and winter populations of catchweed bedstraw (Galium aparine) and wild mustard (Brassica kaber). Weed Sci. 2006, 54, 114–120. [Google Scholar] [CrossRef]
  38. Swanton, C.J.; Shrestha, A.; Knezevic, S.Z.; Roy, R.C.; Ball-Coelho, B.R. Influence of tillage type on vertical weed seedbank distribution in a sandy soil. Can. J. Plant Sci. 2000, 80, 455–457. [Google Scholar] [CrossRef]
  39. Schmitzberger, I.; Wrbka, T.; Steurer, B.; Aschenbrenner, G.; Peterseil, J.; Zechmeister, H.G. How farming styles influence biodiversity maintenance in Austrian agricultural landscapes. Agric. Ecosyst. Environ. 2005, 108, 274–290. [Google Scholar] [CrossRef]
  40. Clements, D.R.; Benoit, D.L.; Murphy, S.D.; Swanton, C.J. Tillage Effects on Weed Seed Return and Seedbank Composition. Weed Sci. 1996, 44, 314–322. [Google Scholar] [CrossRef]
  41. Buhler, D.D.; Kohler, K.A.; Thompson, R.L. Weed Seed Bank Dynamics During a Five-Year Crop Rotation. Weed Technol. 2001, 15, 170–176. [Google Scholar] [CrossRef]
  42. Armengot, L.; José-María, L.; Blanco-Moreno, J.M.; Bassa, M.; Chamorro, L.; Sans, F.X. A novel index of land use intensity for organic and conventional farming of Mediterranean cereal fields. Agron. Sustain. Dev. 2011, 31, 699–707. [Google Scholar] [CrossRef] [Green Version]
  43. Waldhardt, R.; Otte, A. Abschätzung der zur Erhaltung einer lokaltypischen Ackerflora benötigten Fläche am Beispiel der Gemarkung Erda (Lahn-Dill-Bergland, Hessen). Peckiana 2001, 1, 101–108. [Google Scholar]
  44. Chytrý, M.; Schaminée, J.H.J.; Schwabe, A. Vegetation survey: A new focus for Applied Vegetation Science: Vegetation survey. Appl. Veg. Sci. 2011, 14, 435–439. [Google Scholar] [CrossRef]
  45. Kuht, J.; Eremeev, V.; Talgre, L.; Madsen, H.; Toom, M.; Mäeorg, E. Soil weed seed bank and factors influencing the number of weeds at the end of conversion period to organic production. Agron. Res. 2016, 14, 1372–1379. [Google Scholar]
  46. Oksanen, J. Multivariate Analysis of Ecological Communities in R: Vegan tutorial. R Package Version 2011, 1, 1–43. [Google Scholar]
Figure 1. Sampling scheme for soil seedbank samples and relevées.
Diversity 14 00111 g001
Figure 2. Diversity indices for spontaneous arable weeds. Gl and La: site indication: Gl—Gladenbacher Bergland, La—Lahntal. Org and con—management system indication: org—organic farming, con—conventional farming.
Diversity 14 00111 g002
Figure 3. Weed coverage for all considered combinations of the factors: year (2019–2021), area (management system: Gl—Gladenbacher Bergland).
Diversity 14 00111 g003
Figure 4. NMDS-Ordination of spontaneous arable weeds (relevé data); only significant factors are shown. These are winter rye (WR), spelt (SP), winter barley (WB) and winter wheat (WW). Shapes of the symbols (triangle, circle) refer to the area; colours (blue, green) refer to the farm type; e.g., blue circles represent conventional farms in the area of Gladenbach.
Diversity 14 00111 g004
Figure 5. Weed species numbers derived from the soil seed bank data.
Diversity 14 00111 g005
Figure 6. Comparison of time periods of organic growing with regard to the weed seed number.
Diversity 14 00111 g006
Figure 7. Species of the soil seedbank germinated in the period of May 2019. Shapes (triangels and circles) represent the two different areas; the colours green and blue indicate the two farm types. E.g., green circles mean organic farms in the region Gladenbach.
Diversity 14 00111 g007
Figure 8. Species of the soil seedbank germinated in the period of May, June and October 2019.
Diversity 14 00111 g008
Figure 9. Comparison of average weed individual numbers in different crops on the project fields.
Diversity 14 00111 g009
Figure 10. Comparison of average diversity indices for spring and summer germination period of arable weeds.
Diversity 14 00111 g010
Figure 11. Comparison of two soil depths regarding their belowground species diversity. Level A: 0–5 cm below soil surface; B: 5–20 cm below soil surface.
Diversity 14 00111 g011
Table 1. Summary of the GLM model with all considered factors and their significances (p (***) = 0, area. La = sites of the area “Lahntal”, man.org = organic management system, sd.2 = soil depth 2 (5–20 cm below ground level).
EstimateStd.ErrorzPr(>|z|)Significance
(Intercept)7.1610.0025552802.652e × 10−16***
area.La−1.2520.004270−293.202e × 10−16***
man.org0.9440.002259417.832e × 10−16***
sd.21.0310.002249458.352e × 10−16***
area.La × man.org1.0940.003770290.252e × 10−16***
area.La × sd.20.2130.00339962.562e × 10−16***
Table 2. Results of the GLM model for the coverage of spontaneous weeds as a response variable.
EstimateStd.Errort-ValuePr(>|t|)Significance
Intercept103.383.9233.0460.00285*
year−5.0971.675−3.0430.00288*
area7.0083.8081.8400.06819n.s.
management24.0243.9746.0451.73e-08*
Table 3. Results of the GLM for the seedbank data. (p (***) = 0.
EstimateStd.ErrorzPr(>|z|)Significance
(Intercept)7.1610.0025552802.652e × 10−16***
area.La−1.2520.004270−293.202e × 10−16***
man.org0.9440.002259417.832e × 10−16***
sd.21.0310.002249458.352e × 10−16***
area.La × man.org1.0940.003770290.252e × 10−16***
area.La × sd.20.2130.00339962.562e × 10−16***
Table 4. Significance levels between the four periods of organic growing with regard to the total seed number per square meter. Significant differences on the level of α = 0.05 are indicated with *.
14 Years18 Years27 Years
14 years-0.035 *-
27 years0.025 *0.403-
38 years0.4030.4020.207
Table 5. Indicator species with their indicator values and assignments to the groups. (***) significant on α = 0.99, (**) significant on α = 0.95, significant on α = 0.90.
Group nr. ABStatp.Value
1Pap.rho0.97321.00.9870.001***
Cen.cya.0.97840.83330.9030.001***
Ver.arv.0.68161.00.8260.001***
Fal.con.0.81280.50000.6380.001***
Vio.arv.0.47220.66670.5610.004**
Dac.glo.0.65980.33330.4690.013*
Gal.apa.0.90100.16670.3880.011*
Sis.off.0.89870.16670.3870.039*
Pap.dub.0.88120.16670.3830.025*
2Sag.pr.0.874290.244900.4630.032*
Rum.obt.100.0000.061220.2470.041*
3Tri.pra.0.910540.434780.6290.001***
Alop.myo.0.757160.260870.4440.033*
Laps.comm.100.0000.086960.2950.025*
4Matr.cham.0.86400.96360.9120.001***
Cha.mi.0.94450.14550.3710.029*
Table 6. Sorensen’s Qualitative Similarity Indices for the project sites.
ConventionalGl.Organic
organic57.3-
La.organic-65
Publisher’s Note: MDPI stays neutral with regard to jurisdictional claims in published maps and institutional affiliations.

