Article

Distribution Pattern of Fish Richness in the Yarlung Zangbo River Basin

1
Key Laboratory for Conserving Wildlife with Small Populations in Yunnan, Faculty of Biodiversity Conservation, Southwest Forestry University, Kunming 650000, China
2
University of Chinese Academy of Sciences, Beijing 100049, China
3
Southwest Survey and Planning Institute of National Forestry and Grassland Administration, Kunming 650000, China
4
Yunnan Key Laboratory of Plateau Fish Breeding, Kunming Institute of Zoology, Chinese Academy of Sciences, Kunming 650000, China
5
Xishuangbanna Tropical Botanical Garden, Southeast Asia Biodiversity Research Institute, Chinese Academy of Sciences & Center for Integrative Conservation, Mengla 666303, China
*
Author to whom correspondence should be addressed.
These authors contributed equally to this work.
Diversity 2022, 14(12), 1142; https://doi.org/10.3390/d14121142
Submission received: 14 August 2022 / Revised: 12 December 2022 / Accepted: 13 December 2022 / Published: 19 December 2022

Abstract

:
Global warming significantly affects plateau glaciers and surface runoff, and fish are bound to be severely affected. Additionally, an increasing number of human activities (e.g., free captive animals, aquaculture) have led to vulnerable plateau ecosystems being affected by invasive species. To address the above issues, we collected the currently published fish distribution data, and for the first time constructed a richness and fluvial system distribution map of the Yarlung Zangbo River fish (4 orders, 10 families, and 61 species). Based on fish richness and the fluvial system, the native fish in the Yarlung Zangbo River Basin were divided into three clusters, and the non-native fish were divided into six clusters by using Ward’s minimum variance clustering and non-metric multidimensional scaling (NMDS). Environmental factors related to native or non-native fish richness were selected by the random forest model from 21 environmental factors. Then, the relationship between fish richness and environmental factors was explained by the generalized linear model (GLM). Our results showed that the native fish distribution pattern was different from the non-native fish distribution, but their high richness areas were overlapped. Furthermore, native fish richness responds differently than non-native fish richness to environmental factors. The results provided eco-solutions for the conservation and management of fish biodiversity and natural resources in the Yarlung Zangbo River.

1. Introduction

The Tibetan Plateau is a global biodiversity hotspot that is characterized by extremely high elevation and abnormal climate change [1]. In recent decades, human activities have increased and caused water pollution, climate change, and biological invasion, which have driven the diversity of fish to decline in Tibet [2,3,4]. The fish composition in Tibet has a simple structure, which means a fragile aquatic ecosystem, and changes in fish resources can cause an imbalance in the structure and function of the aquatic ecosystem through ecological cascading effects [5,6]. In addition, Tibetan fish are dominated by Schizothoracinae (order Cypriniformes, family Cyprinidae) and Nemacheilidae (order Cypriniformes), which grow slowly and have a long-life cycle. Without effective biodiversity conservation measures, it will be difficult to recover once the population is destroyed [7]. Therefore, it is crucial to understand the distribution and composition of fish under natural conditions in Tibet [8]. The Yarlung Zangbo River, located south of the Tibet Autonomous Region, is the largest river on the Tibetan Plateau. Its water ecological environment gives rise to special fish fauna, and it is a treasure house of genetic resources of fish in China, and plays a vital role in maintaining the ecological security barrier in Southwest China. Human activities are common along the Yarlung Zangbo River, and transportation, population, and urbanization have seriously interfered with fish survival in the Yarlung Zangbo River Basin, so biodiversity conservation should be implemented as soon as possible [5,8,9].
Although the Yarlung Zangbo River has many freshwater fish taxa, 23 of them are only found in the Yarlung Zangbo River in China [10]. However, existing studies have mainly focused on the evolutionary history of the longitudinal pattern of fish diversity, single-species reproduction, and regional fish resources. For example, Liu H et al. studied the fecundity and reproductive strategy of the Ptychobarbus dipogon of the Schizothoracinae subfamily population in the middle reaches of the Yarlung Zangbo River [11]. They suggested that protection was needed due to its characteristics of low fecundity, late maturity, and short breeding period. Deng J et al. investigated fish diversity in the Dogxung Zangbo Basin of the Yarlung Zangbo River; the results showed that the fish species diversity was low, the population diffusion and recovery ability were weak, and the fish resources tended to decline [12,13]. Liu Fei et al. found significant changes in fish along the longitudinal gradient in the middle and lower reaches of the Yarlung Zangbo River. They revealed the main environmental factors affecting the longitudinal distribution of fish communities in this area, comprising elevation, river width, and macroinvertebrate density. Previously, in 1992, the Fisheries Bureau of the Tibet Autonomous Region and the Institute of Zoology of the Chinese Academy of Sciences published “Fish and Their Resources in Tibet” after conducting an investigation of fish resources in Tibet, which comprehensively recorded the characteristics, ecological habits, and economic significance of fish in Tibet [14]. In addition, Zhou J et al. conducted a more comprehensive field survey of fish resources in Nyingchi Prefecture [15]. Generally, these studies mostly used the generalization of collection points, distribution points, or large areas to explain the fish distribution and lacked intuition about the fluvial system’s distribution pattern. Protection measures should be based on fluvial systems. Consequently, we should construct a species richness distribution pattern based on fluvial systems contributing to fish protection in the Tibetan Plateau.
Understanding variations in species diversity and assemblages connected to environments at a large geographical scale has been a central aim of community ecology for decades. In recent years, species richness distribution patterns have not only been used to study the distributional patterns of species, but also to infer the mechanisms involved in their distribution [16].Studies have shown that fish can be constrained by several factors at larger spatial scales, such as river size, macroclimate conditions, and geographic barriers, because these factors can influence the dispersal ability of fish [17]. For example, Field et al. showed that correlations between climate and species richness gradients have shown that contemporary climate is the primary determinant of richness gradients [18]. Contemporary climate is as important as historical climate, while current climates are correlated with past climate, and species richness is also associated with small-scale climate variations. Thus, exploring the current environmental variables that correlate with species richness distributions at spatial scales can provide an ecological sense of biogeographic patterns [19]. Many studies have tested the hypothesis that different species have similar responses to regional environmental constraints by species presence/absence datasets combined with current environmental factors at a regional scale. Pont et al., for example, evaluated the presence or absence of fish species via six environmental factors and described the environmental variables with higher independent explanatory power for each species [17]. Additionally, Griffiths et al. found that freshwater fish richness differences between the Atlantic and European realms follow differences in spatial climatic trends [20]. To date, few studies have investigated the role of environmental factors in shaping fish richness and distribution patterns in China. Thus, a more comprehensive picture of fish richness and assemblage patterns, as well as their potential driving factors, is urgently required at a continental scale for different rivers in China.
In this study, we collected the currently published fish distribution data and drew fish richness distribution maps based on the fluvial systems in the Yarlung Zangbo River, aiming to elaborate on the distribution pattern of fish species richness in the Yarlung Zangbo River Basin. Additionally, we wanted to identify the importance of different environmental factors in shaping the fish richness distribution patterns in the Yarlung Zangbo River using a combination of published fish distribution data and environmental data from various sources in a generalized linear model (GLM) framework, and this data-integrated analysis linked new and old findings to provide eco-solutions for the conservation and management of fish biodiversity and natural resources. Based on these explorations, we want to gain a greater understanding of how fish are distributed in such a special river system and provide valuable information for fish conservation and management initiatives.

2. Materials and Methods

2.1. Study Area

Our study area is composed of 48 counties and covers the whole Yarlung Zangbo River Basin, including main streams and tributaries. The Yarlung Zangbo River is the largest river (length of 2057 km) on the Tibetan Plateau, and arguably the highest river (average bed elevation of 3000 m) in the world [21]. The upper section of the Yarlung Zangbo River originates from the Gyima Yangzoin Glacier on the northern slope of the Himalayas [13]. The river passes through southern Tibet and then turns abruptly southwest and cuts through the Yarlung Zangbo Grand Canyon across the Eastern Himalayas (Figure 1). The high elevation of the Yarlung Zangbo River sets it apart from other lowland rivers in China, with its rather distinct climate, riparian vegetation and topography, which change notably along the longitudinal gradient [13,22]. The upstream section is from the end of Jema Yangtse Glacier to Lizi village of Zhongba County, is 268 km long, and has natural desert grassland vegetation; the middle section is from Lizi to Pai town of Milin County, and is 1360 km long with natural arid steppe vegetation and deciduous scrub [7,22]. The riparian vegetation changes to tropical rainforest from midstream to downstream [13,23].

2.2. Sample Collection

The required information about the fish in the Yarlung Zangbo River was retrieved to create the fish distribution dataset. Each fish’s regional distribution information includes the river it lives in, the river segment, regional location (county, township), and coordinates (longitude, latitude). We gathered information on the distribution of 1518 fish species from 43 published papers, 2 dissertations, 2 scientific research reports, and 7 books, including “Chinese mainland Fish Species and Distribution” [24], “Fishes of Qinghai-Tibet Plateau” [25], “Zoo fauna of China” [26,27,28], “Fish and Their Resources in Tibet” [14], and “Tibet Aquatic Biological Conservation Series 1–3” [29,30,31]. Using the classification system of “Fish Species and Distribution in Mainland China” as the reference, the species with an isolated distribution and altered taxonomic status in the data were corrected. Finally, the distribution of the final fish was verified with the Atlas of the Tibet Autonomous Region.
In this study, the 19 bioclimatic variables from WorldClim were employed, primarily because they are easily accessible and available globally for past, present and future climate scenarios [32]. Additionally, we added two environmental factors, i.e., elevation and water vapor pressure, because these factors are correlated and important bioclimatic and topographic conditions [33]. Finally, a total of 21 environmental variables were used in this study (Table 1). The relevant environmental data were sourced from WorldClim-Global Climate data (https://worldclim.org, accessed on 7 October 2021), with a geographic resolution of 30 s (approximately 1 km). Environmental factor values for the study area were extracted from WorldClim-Global climate data using ArcMap 10.8 [34].

2.3. “Drainage–Range Overlap” Distribution of Fish

Information on the distribution of fish is often described by river systems and administrative divisions. Therefore, we decided to apply a new approach, “drainage–range overlap”, to more intuitively describe the distribution of fish. First, each fish species administrative distribution region was extracted from the vector layer in ArcMap10.8 and defined as the “range”. In this process, the distribution information of fish with a wide distribution range and a hazy location was omitted, and then we cautiously selected small-range distribution information, using more precise distribution information such as “range”, which was at least at the county level of accuracy. Second, we used the Yarlung Zangbo River fluvial vector layer for “drainage”, covering the entire Yarlung Zangbo River Basin (all mainstream and tributaries). Finally, based on the fish’s regional distribution information, to overlap the “drainage” and “range” with ArcMap 10.8 (Environmental Systems Research Institute: Redlands, California, America) [34], a fluvial system distribution map was obtained for each fish. The fish fluvial system distribution map clearly displays different fish distribution regions, e.g., you know the exact location of one fish in the Niyang River, rather than only knowing it is in the Niyang River.

2.4. Species Richness Distribution Patterns

The Yarlung Zangbo River Basin was divided into equal-area grids of 10 km × 10 km to eliminate the influence of different spatial scales or spatial areas on species richness. The river map of fish distribution was superimposed on the extracted grid area according to each fish’s distribution information, i.e., the fish richness in each grid unit was counted and the distribution map of fish richness in the Yarlung Zangbo River was obtained. The above operation was conducted in ArcMap 10.8 [34], and the relevant geographic information layers of the Yarlung Zangbo River Basin used in the operation were from the National Basic Geographic Information System (http://www.ngcc.cn/ accessed on 12 October 2021).
Compared with “Fishes of Qinghai-Tibet Plateau” [25], the invasive fish (non-native) species were determined (Table 2). The main invasive fish species distribution areas were determined according to the distribution of fish systems.
Based on species composition and distribution data, the county region divides the Yarlung Zangbo River mainstream into 24 sections. According to the 24 sections and 31 tributaries, we used Ward’s minimum variance clustering and non-metric multi-dimensional scaling (NMDS) to analyse native or non-native species similarity between different fluvial systems in the Yarlung Zangbo River Basin. To explore the discreteness of the data, Ward’s minimum variance clustering was performed using the “cluster” package. To understand the native or non-native fish compositions between different river sections in the Yarlung Zangbo River Basin, we performed NMDS ordination analysis based on the “presence–absence matrix” of fish distribution and Bray–Curtis dissimilarity distance using the “vegan” package. A combination of both methods can explore differences and connections between different fluvial systems [35]. The two ordinal results showed that the data were well represented with 2 axes of NMDS, because the native fish ordinal stress value = 0.08 (R2 of nonmetric fit was 0.99 and linear fit was 0.99) and non-native fish ordinal stress value = 0.01 (R2 of nonmetric fit was 1 and linear fit was 0.99). We then performed an analysis of similarities (ANOSIM) based on Bray–Curtis dissimilarity distance to quantify the differences in species composition in the three clusters. The range of R values is −1 to 1; a positive value indicates that the variation within a group is lower than that between groups and vice versa, and a larger value indicates a larger difference between groups.
To avoid the collinearity issue of the 21 environmental variables, the random forest approach was deployed to select the important variables using the “VSURF” package. In contrast to some other models, the generalized linear model (GLM) allows researchers to visually determine the significance of environmental variables on species distribution. Our dependent variable is “species distributed” or “species undistributed”, i.e., richness data, and GLM is a good option. Therefore, we deployed the GLM to understand the relationship between fish richness and the selected variables. The negative binomial distribution was used to deploy the error because the model was overdispersed once we used the Poisson distribution. To reduce the collinearity of the GLM, we dropped the variables (selected by random forest approach) based on the threshold of variance inflation factors (i.e., vif > 5). Likelihood ratio tests were used to test whether the quadratic form of each selected variable needed to be added to the GLM. Finally, we reported the results of the developed model. All analyses were conducted in R 4.2.0 [36].
Table 2. List showing fish species composition of the Yarlung Zangbo River: 1 “LC” means “Least Concern”, “VU” means “Vulnerable”, “NT” means “Near Threatened”, “DD” means “Data Deficient”; 2 Reference: “Fish on the Tibetan Plateau” [26]. The presence of an asterisk indicates that the species is a non-native fish, and its absence indicates that the species is a native fish.
Scientific NamesIUCN Red List 1Non-Native Fish 2Reference
I.Cypriniformes
i.Cyprinidae
1Abbottina rivularisLC*[7,30,37,38]
2Aristichthys nonilis *[7,30,31,37]
3Bangana deroLC [13,14,29,31,39,40,41]
4Barbodes hexagonlepis [29,31,39,40,41]
5Carassius auratusLC*[13]
6Carassius auratus *[7,15,30,31,39,42,43]
7Carassius auratus gibelio [30,43]
8Ctenopharyngodon idellaLC*[7,30,31,37]
9Cyprinus carpioVU*[7,13,15,29,30,31,37]
10Garra kempiLC [44]
11Garra motouensis [13]
12Garra tibetana [13,29,31,45]
13Garra yajiangensis [13]
14Gymmocypris chui [7,40,41,46]
15Gymmocypris scleracanthus [46,47]
16Gymnocypris namensis [39,42]
17Gymnocypris waddelli [7,41,46]
18Hypophthalmichthys molitrixNT*[7,30]
19Oxygymnocypris stewartiiNT [7,12,13,14,15,24,30,31,39,41,42,43,46,47,48,49,50]
20Pseudorasbora parvaLC*[7,13,15,29,30,31,37,39,41,42,43]
21Ptychobarbus dipogonLC [7,12,13,14,15,24,25,30,31,38,39,40,42,43,46,47,48,49,50,51,52]
22Ptychobarbus kaznakovi [39,42,46]
23Schizopygopsis younghusbandiDD [7,12,13,14,15,24,30,31,38,39,41,42,43,46,47,48,49,50,53,54,55]
24Schizothorax curvilabiatusDD [13,14,15,24,29,31,39,41,44,47]
25Schizothorax labiata [14,29,39,40,41]
26Schizothorax lissolabiatusLC [40]
27Schizothorax macropogonNT [13,14,30,31,47]
28Schizothorax molesworthiDD [13,14,24,24,29,31,39,40,41,41,44,56]
29Schizothorax oconnoriLC [12,13,30,31,47,50,57]
3Schizothorax plagiostomusVU [25,27,28,40]
31Schizothorax waltoniLC [7,13,14,15,24,27,28,30,31,39,40,41,42,43,46,47,49,50,51,57,58]
ii.Psilorhynchidae
32Psilorhynchus homalopteraLC [13,14,24,25,29,31,39,40,41,59]
iii.Nemacheilidae
33Aborichthys kempiNT [14,24,39,40,41]
34Nemacheilus subfuscus [14,24,25,29,31,39,40,41,56]
35Neolissochilus hexagonolepisNT [13,44]
36Schistura scaturiginaLC [13]
37Triplophysa aliensis [40]
38Triplophysa brevicauda [12,13,14,31,39,41,43,46,48,53,60]
39Triplophysa micropsLC [7,14,15,39,40,46]
40Triplophysa orientalisLC [7,14,24,30,31,39,40,42,43,46,48,53,60]
41Triplophysa stenuraLC [7,12,13,14,15,24,30,39,40,42,43,48,53,56]
42Triplophysa stewartiLC [7,13,14,24,28,30,39,40,42,43,46,48,49,53,60]
43Triplophysa stoliczkai [12,13,27,31,40,41,43,46,48]
44Triplophysa tibetanaLC [7,13,14,15,24,30,31,39,40,42,43,46,48,53]
iv.Cobitidae
45Misgurnus anguillicaudatusLC*[13,30,39,42,43]
46Paramisgurnus dabryanus *[13,30,31,39,41,42]
II.Siluriformes
v.Sisoridae
47Exostoma labiatumLC [13,14,24,26,29,39,40,41,44,52,56,61]
48Exostoma tenuicaudata [13]
49Glaridoglanis andersoniiDD [13,14,15,24,26,29,31,39,40,41,62]
50Glyptosternum maculatum [7,14,15,24,26,31,39,40,41,42,43,46,48,50,62,63,64]
51Glyptothorax annandaleiLC [13,14,24,26,29,31,39,40,41,62]
52Glyptothorax gracilis [13,14,25,39,40,41]
53Parachiloglanis hodgartiLC [13,14,24,26,29,31,39,40,41,62]
54Pareuchiloglanis kamengensis [14,15,24,26,29,31,39,40,41,56,62,65]
55Pseudecheneis sulcataLC [7,13,14,15,24,26,29,30,31,39,41,56,62,66,67,68]
vi.Siluridae
56Siulrus asotus *[7,30,31,43]
III.Perciformes
vii.Odontobutidae
57Micropercops swinhonisLC*[7,13,30,31,37,39,42,43]
58Perccottus gleniiLC*[31]
viii.Channidae
59Channa argusLC*[30,31]
ix.Cichlidae
60Oreochromis mossambicusVU*[30,31]
IV.Synbranchiformes
x.Synbranchidae
61Monopterus albusLC*[31]

3. Results

3.1. Species Composition

We collected 1856 distribution data points, including 61 fish species (44 native and 17 non-native species) (Table 2). These species belonged to three orders and ten families. Cypriniformes were the most abundant, comprising 46 species (75.41% of the total species), followed by Siluriformes (10 species) and Perciformes (4 species). Cyprinidae was the most dominant family, comprising 31 species, followed by Nemacheilidae (12 species), Sisoridae (9 species), Odontobutidae (2 species), Cobe itidae (2 species), Psilorhynchidae (1 species), Siluridae (1 species), Channidae (1 species), and Cichlidae (1 species). The Yarlung Zangbo River has five near-threatened species and three vulnerable species according to the IUCN Red List (Table 2).

3.2. Distribution Patterns of Fish Species

Among the dataset, we only selected 59 fish species (native and non-native) to map the distribution of fish species, and Triplophysa aliensis and Schizothorax lissolabiatus were removed due to their lack of county-level distribution information. The Yarlung Zangbo River basin was divided into 919 grids, and the number of fish species was used as the fish richness in each grid. Finally, we obtained native and non-native fish richness distribution maps (Figure 2).
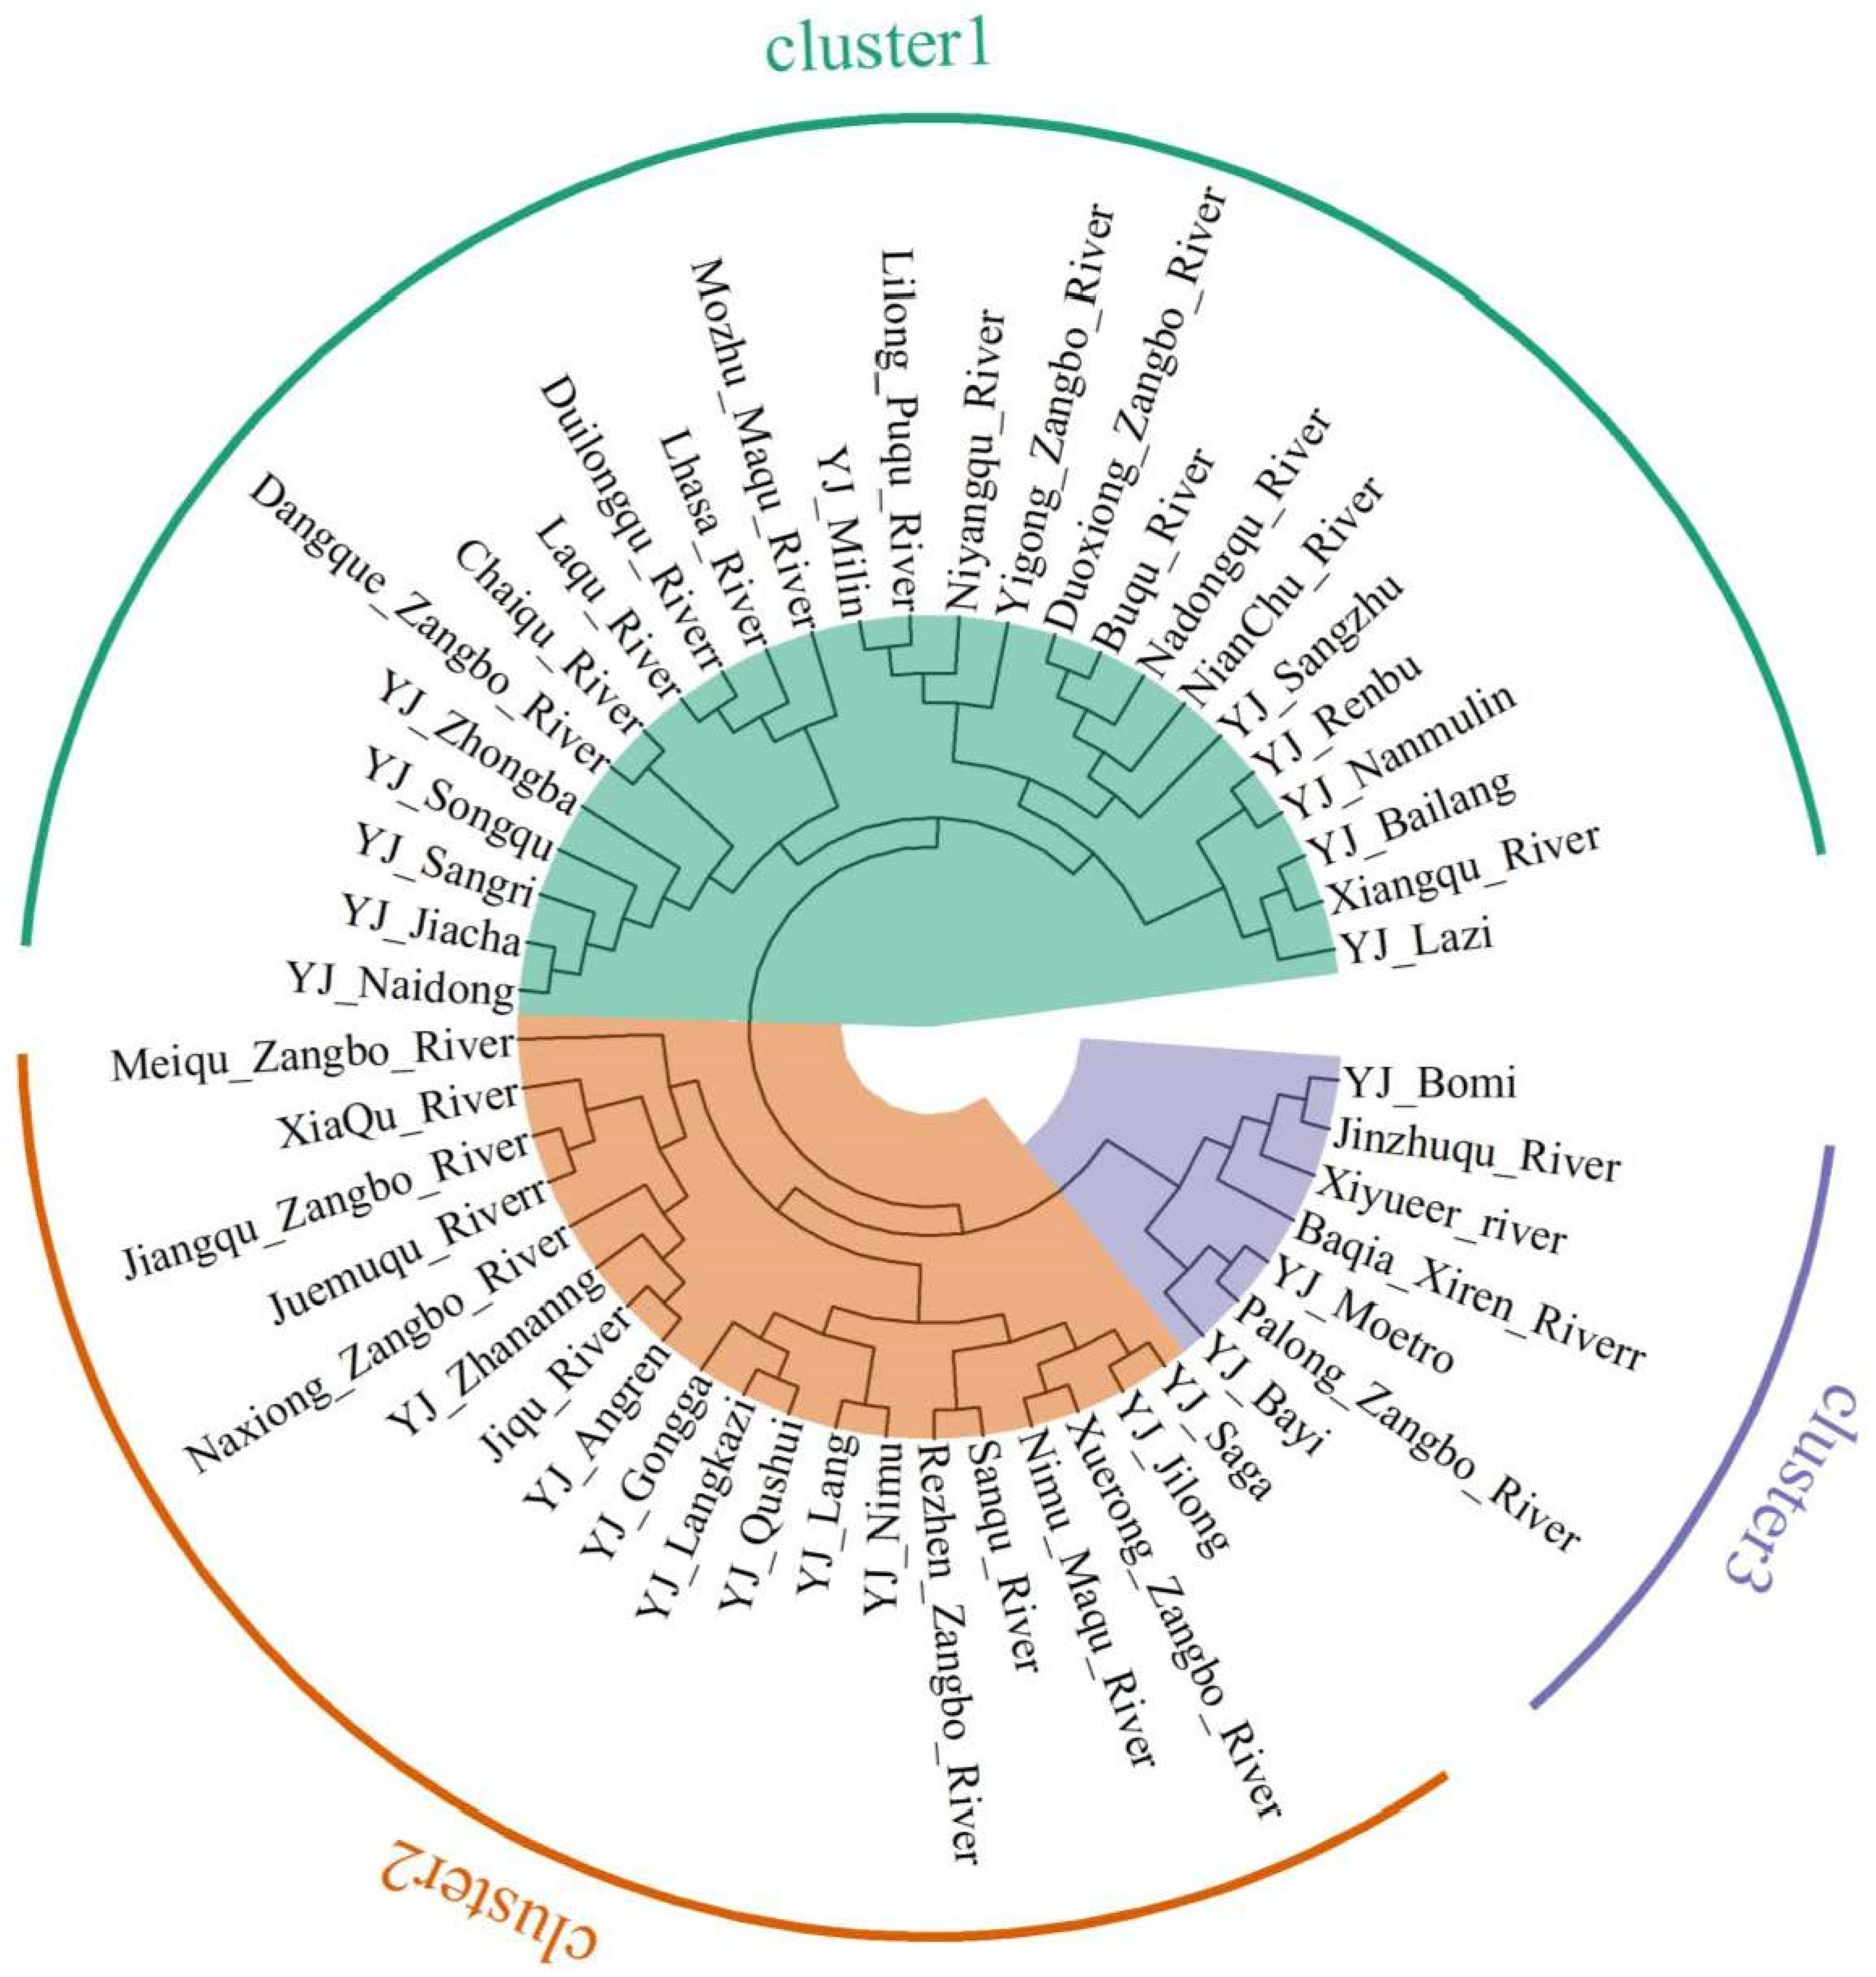
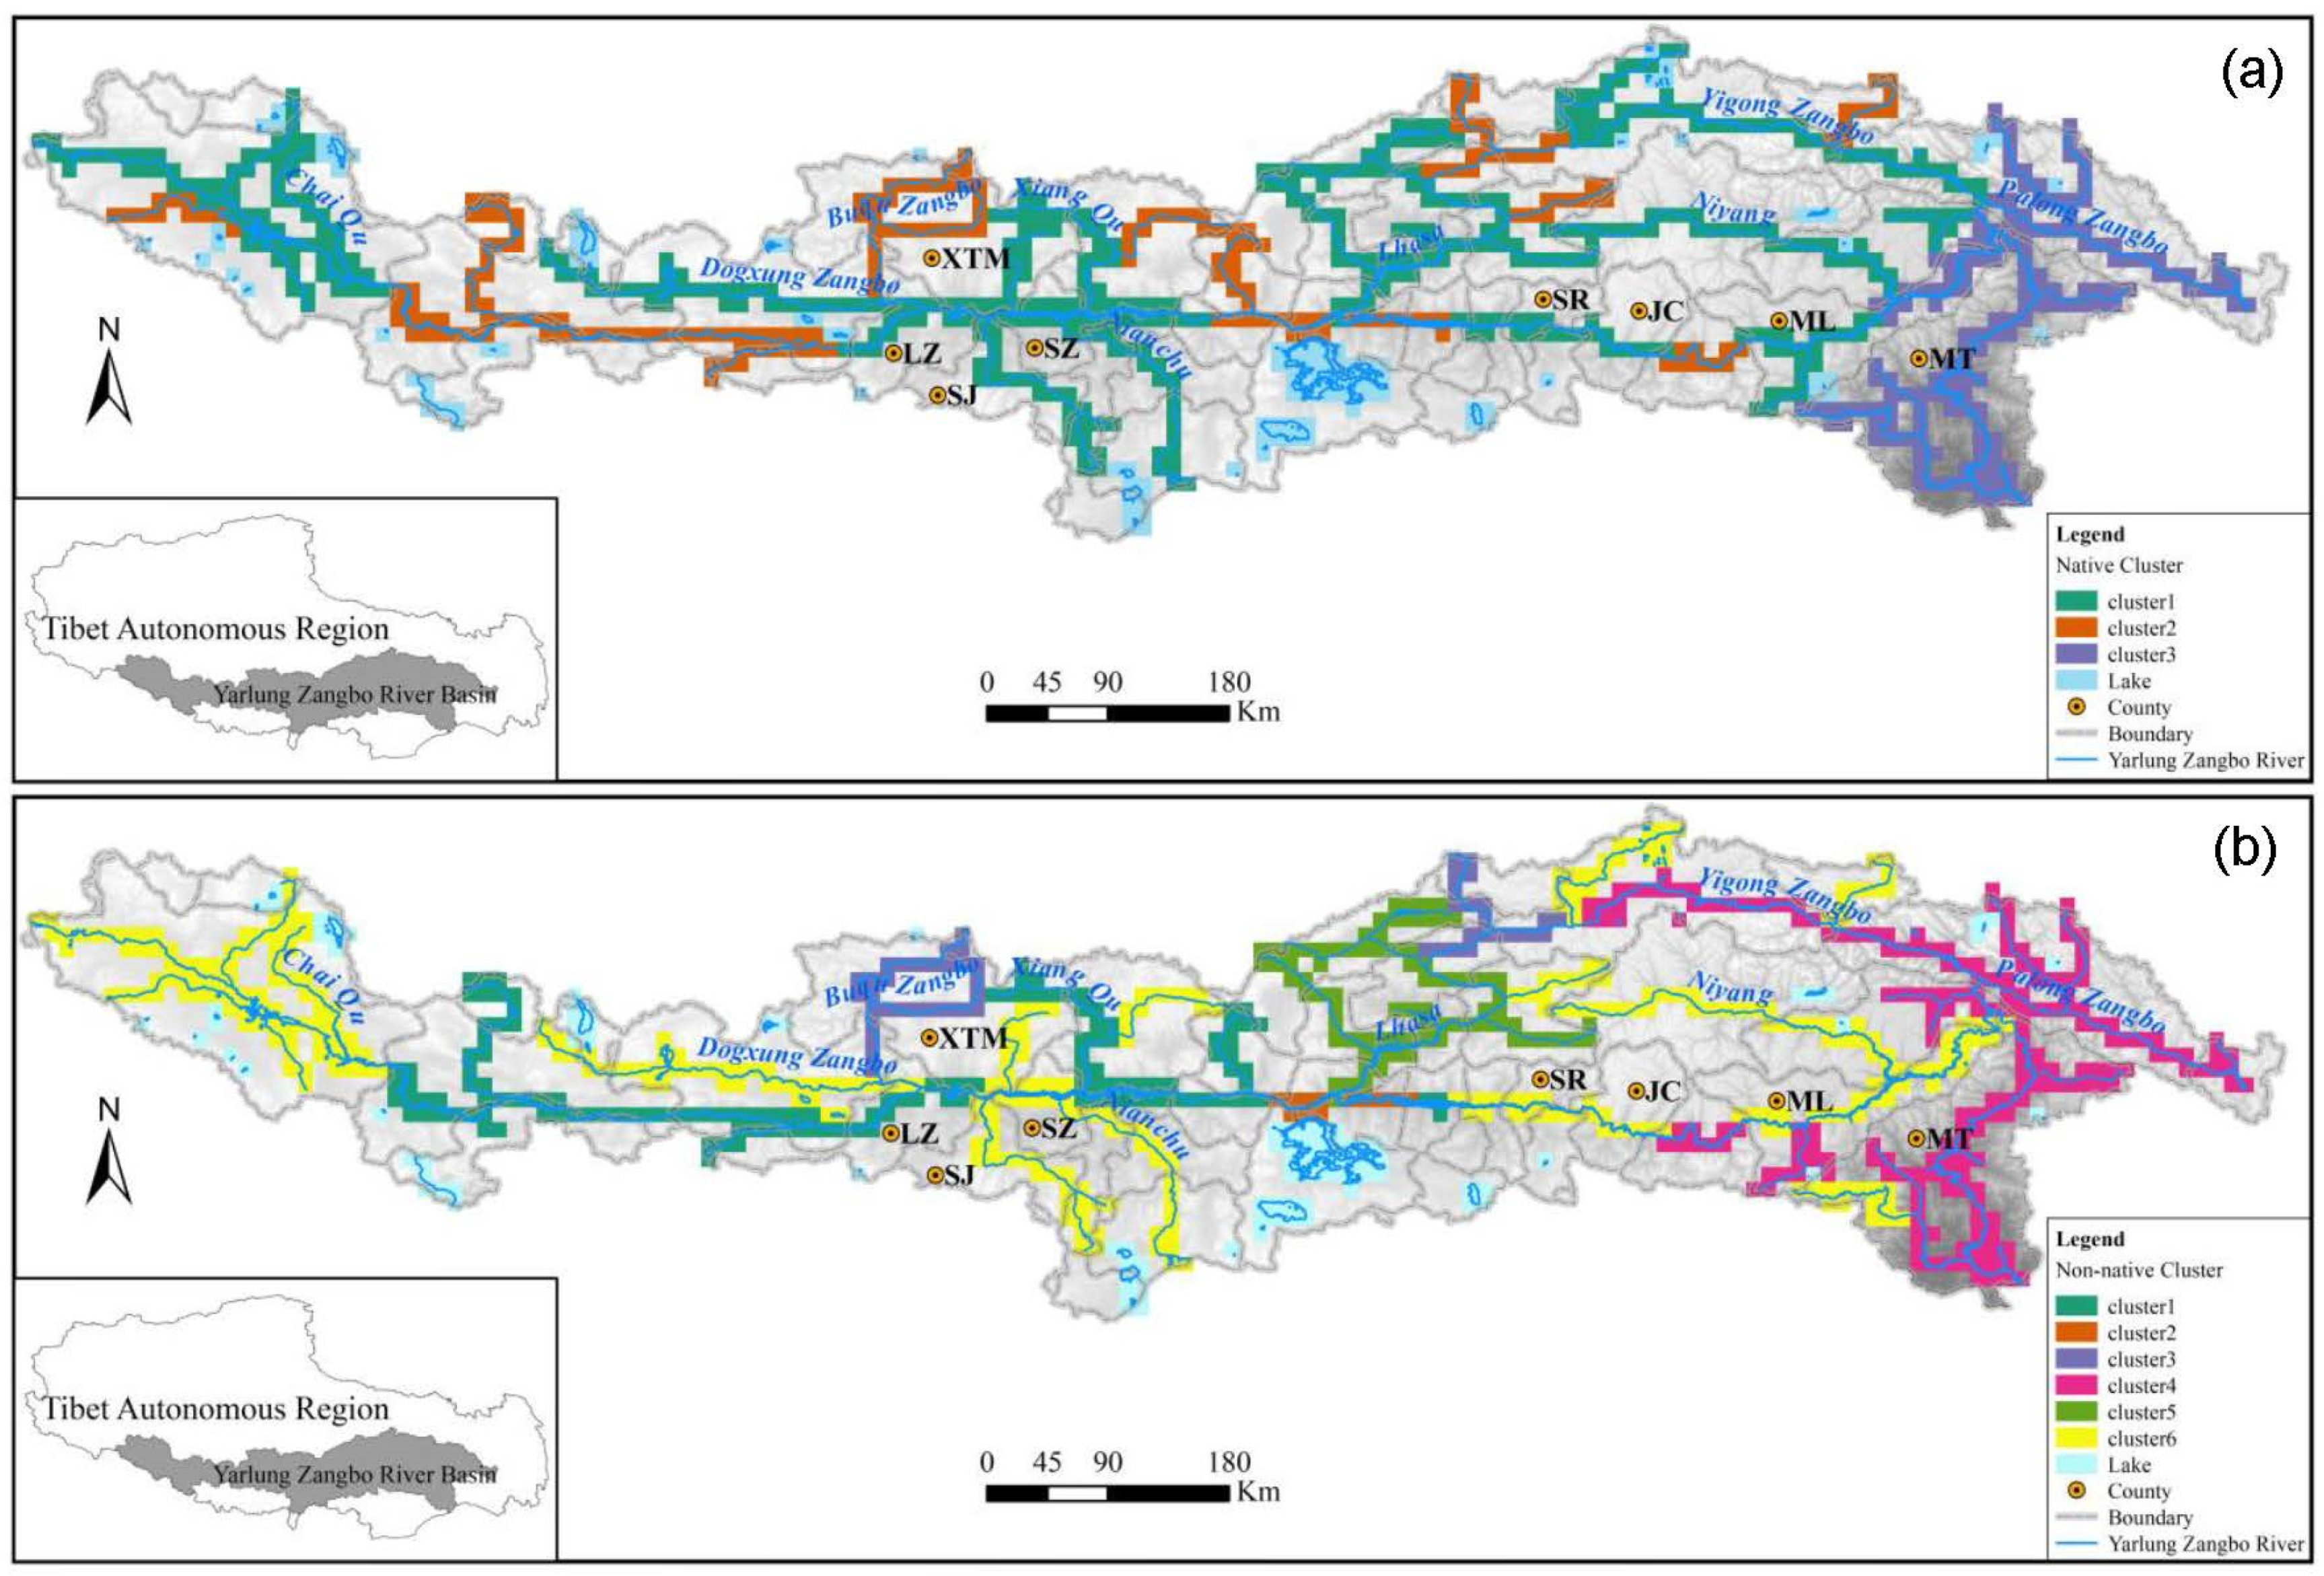
The native fish richness distribution map (Figure 2a) shows the highest fish richness (22 species) fluvial systems in the section of the Yarlung Zangbo River within Motero County. Interestingly, the Yarlung Zangbo River midstream and downstream transition areas, which are the highest native fish richness regions, included the Niyang River, Palong Zangbo River, Yigong Zangbo River and Yarlung Zangbo River (section of Motero). Meanwhile, the other fluvial streams that had high fish richness corresponded to the Yarlung Zangbo River midstream, including the Dogxung Zangbo River (6 species), Nianchu River (6 species) and Lhasa River (8 species). In contrast, fish richness was low in the upstream region, with the highest fish richness in the fluvial system, with only 7 fish. The cluster analysis for native fish based on the fluvial system (Figure 3), with 23 tributaries and 31 mainstream sections, had three clear groups. The first group (Figure 4a, cluster 1) consisted of three discrete parts, located upstream (one part) and midstream (two parts), including 11 mainstream sections and 17 tributaries (Figure 3). The second group (Figure 4a, cluster 2) was composed of 9 mainstream sections and 10 tributaries, which were mostly midstream, and only 1 small tributary was located upstream. In contrast to the other two groups, the spatial distribution of native fish in the third group (Figure 4a, cluster 3) was concentrated, mostly located at the U-shaped bend downstream in the Yarlung Zangbo River, and was the area with the highest native fish richness. The non-metric multi-dimensional scaling (NMDS) ordination (Figure 5) showed distinctive differences in composition between the three clusters. This result is consistent with the result of ANOSIM, which showed significant dissimilarity between the three clusters: cluster I vs. cluster II (R = 0.99, p = 0.01), cluster I vs. cluster III (R = 0.38, p = 0.05) and cluster II vs. cluster III (R = 0.59, p = 0.01).
The non-native fish richness distribution map (Figure 2b) showed that invasive fish had the highest richness in the Lhasa River (17 species). From the invasive fish richness distribution pattern, major tributaries of the Yarlung Zangbo River have higher invasive fish richness, such as the Lhasa River (17 species), the Dogxung Zangbo River (10 species), the Nianchu River (10 species), and the Niyang River (12 species). In addition, two river confluences (9 and 10 species from west to east, located in Zhongba County) upstream and one confluence midstream (10 species, located in Sangri County) also had high invasive fish richness. The clustering analysis results based on the fluvial system showed that the invasive fish had six clusters (Figure 4b, Figure 6). The non-metric multi-dimensional scaling (NMDS) ordination (Figure 5) showed distinctive differences between compositions between the six clusters. This is consistent with the results of ANOSIM, which showed significant differences between all clusters except clusters five and six (p > 0.05).

3.3. Relationships between Fish Richness and Environmental Factors

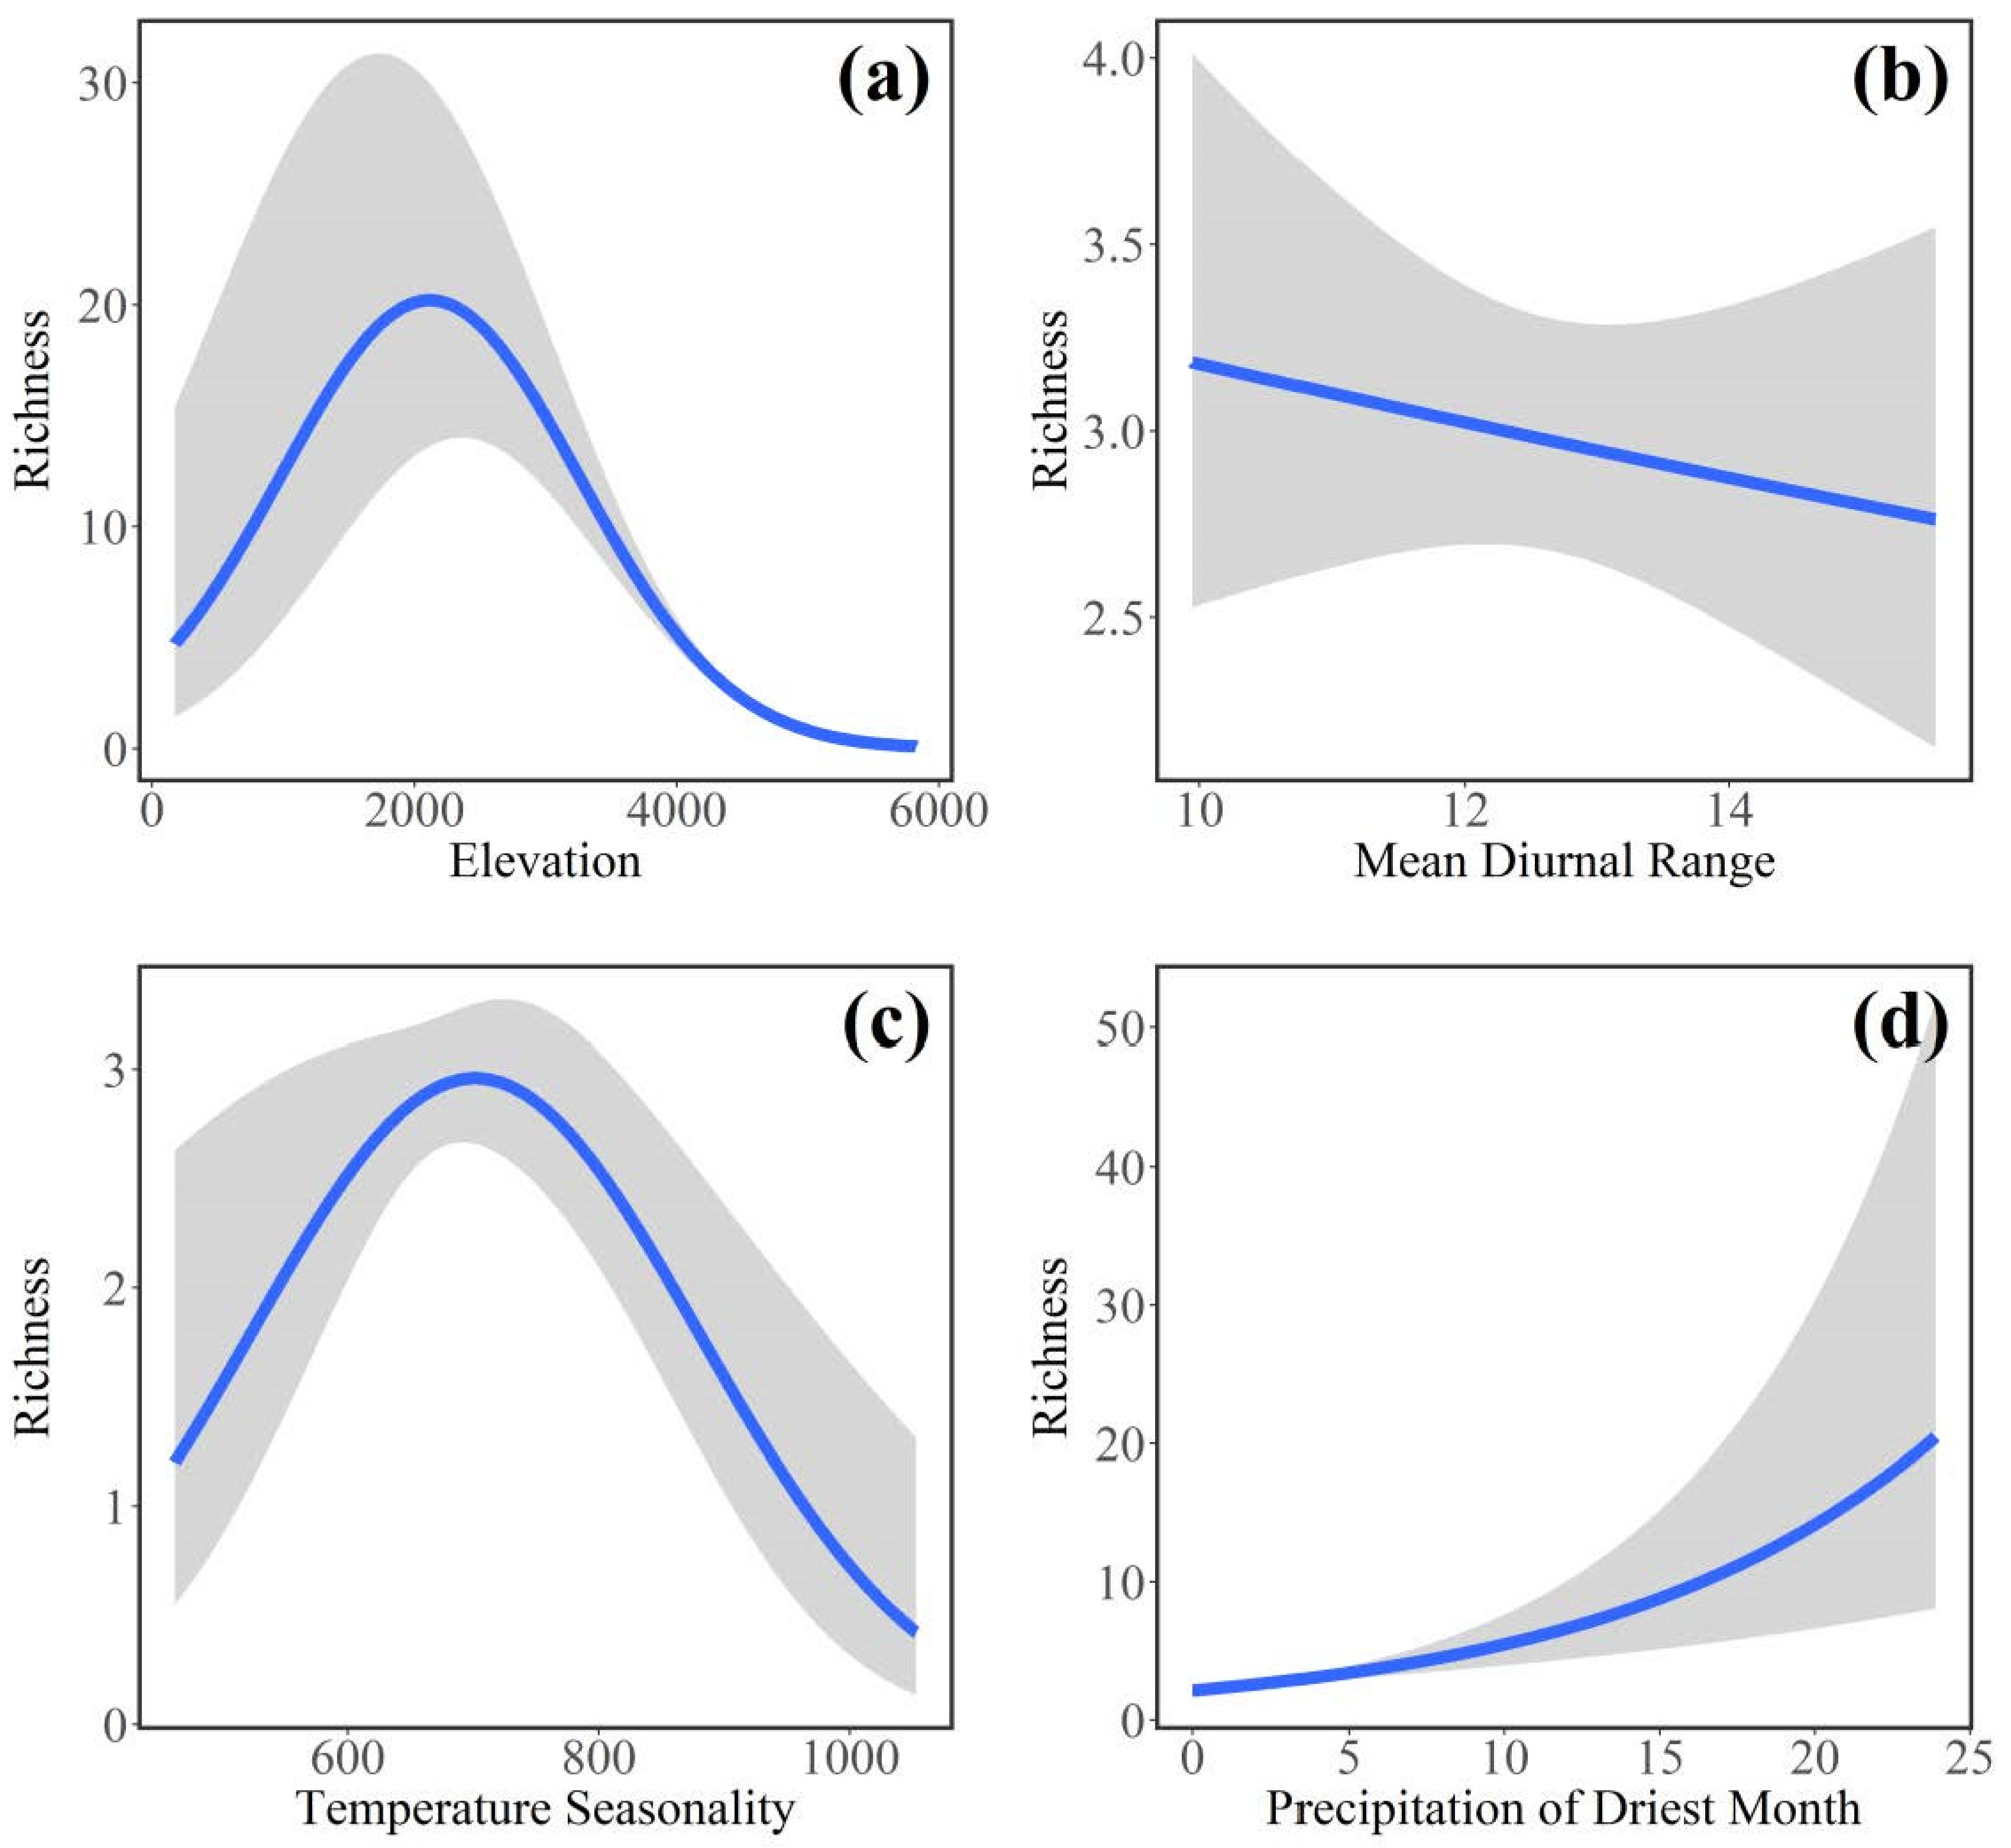
For native fish richness (Figure 7), Ele (elevation), Bio2 (mean diurnal range), Bio4 (temperature seasonality), and Bio17 (precipitation of driest quarter) were the finally selected variables in the GLM (R2 = 0.72). The final model showed that the most striking trait in the elevational distribution patterns of native fish richness was a peak at 2100 m elevation. Furthermore, the highest native fish richness peaked when the temperature seasonality pattern reached 630. Higher native fish richness was also associated with smaller mean diurnal ranges and higher precipitation in the driest quarter.
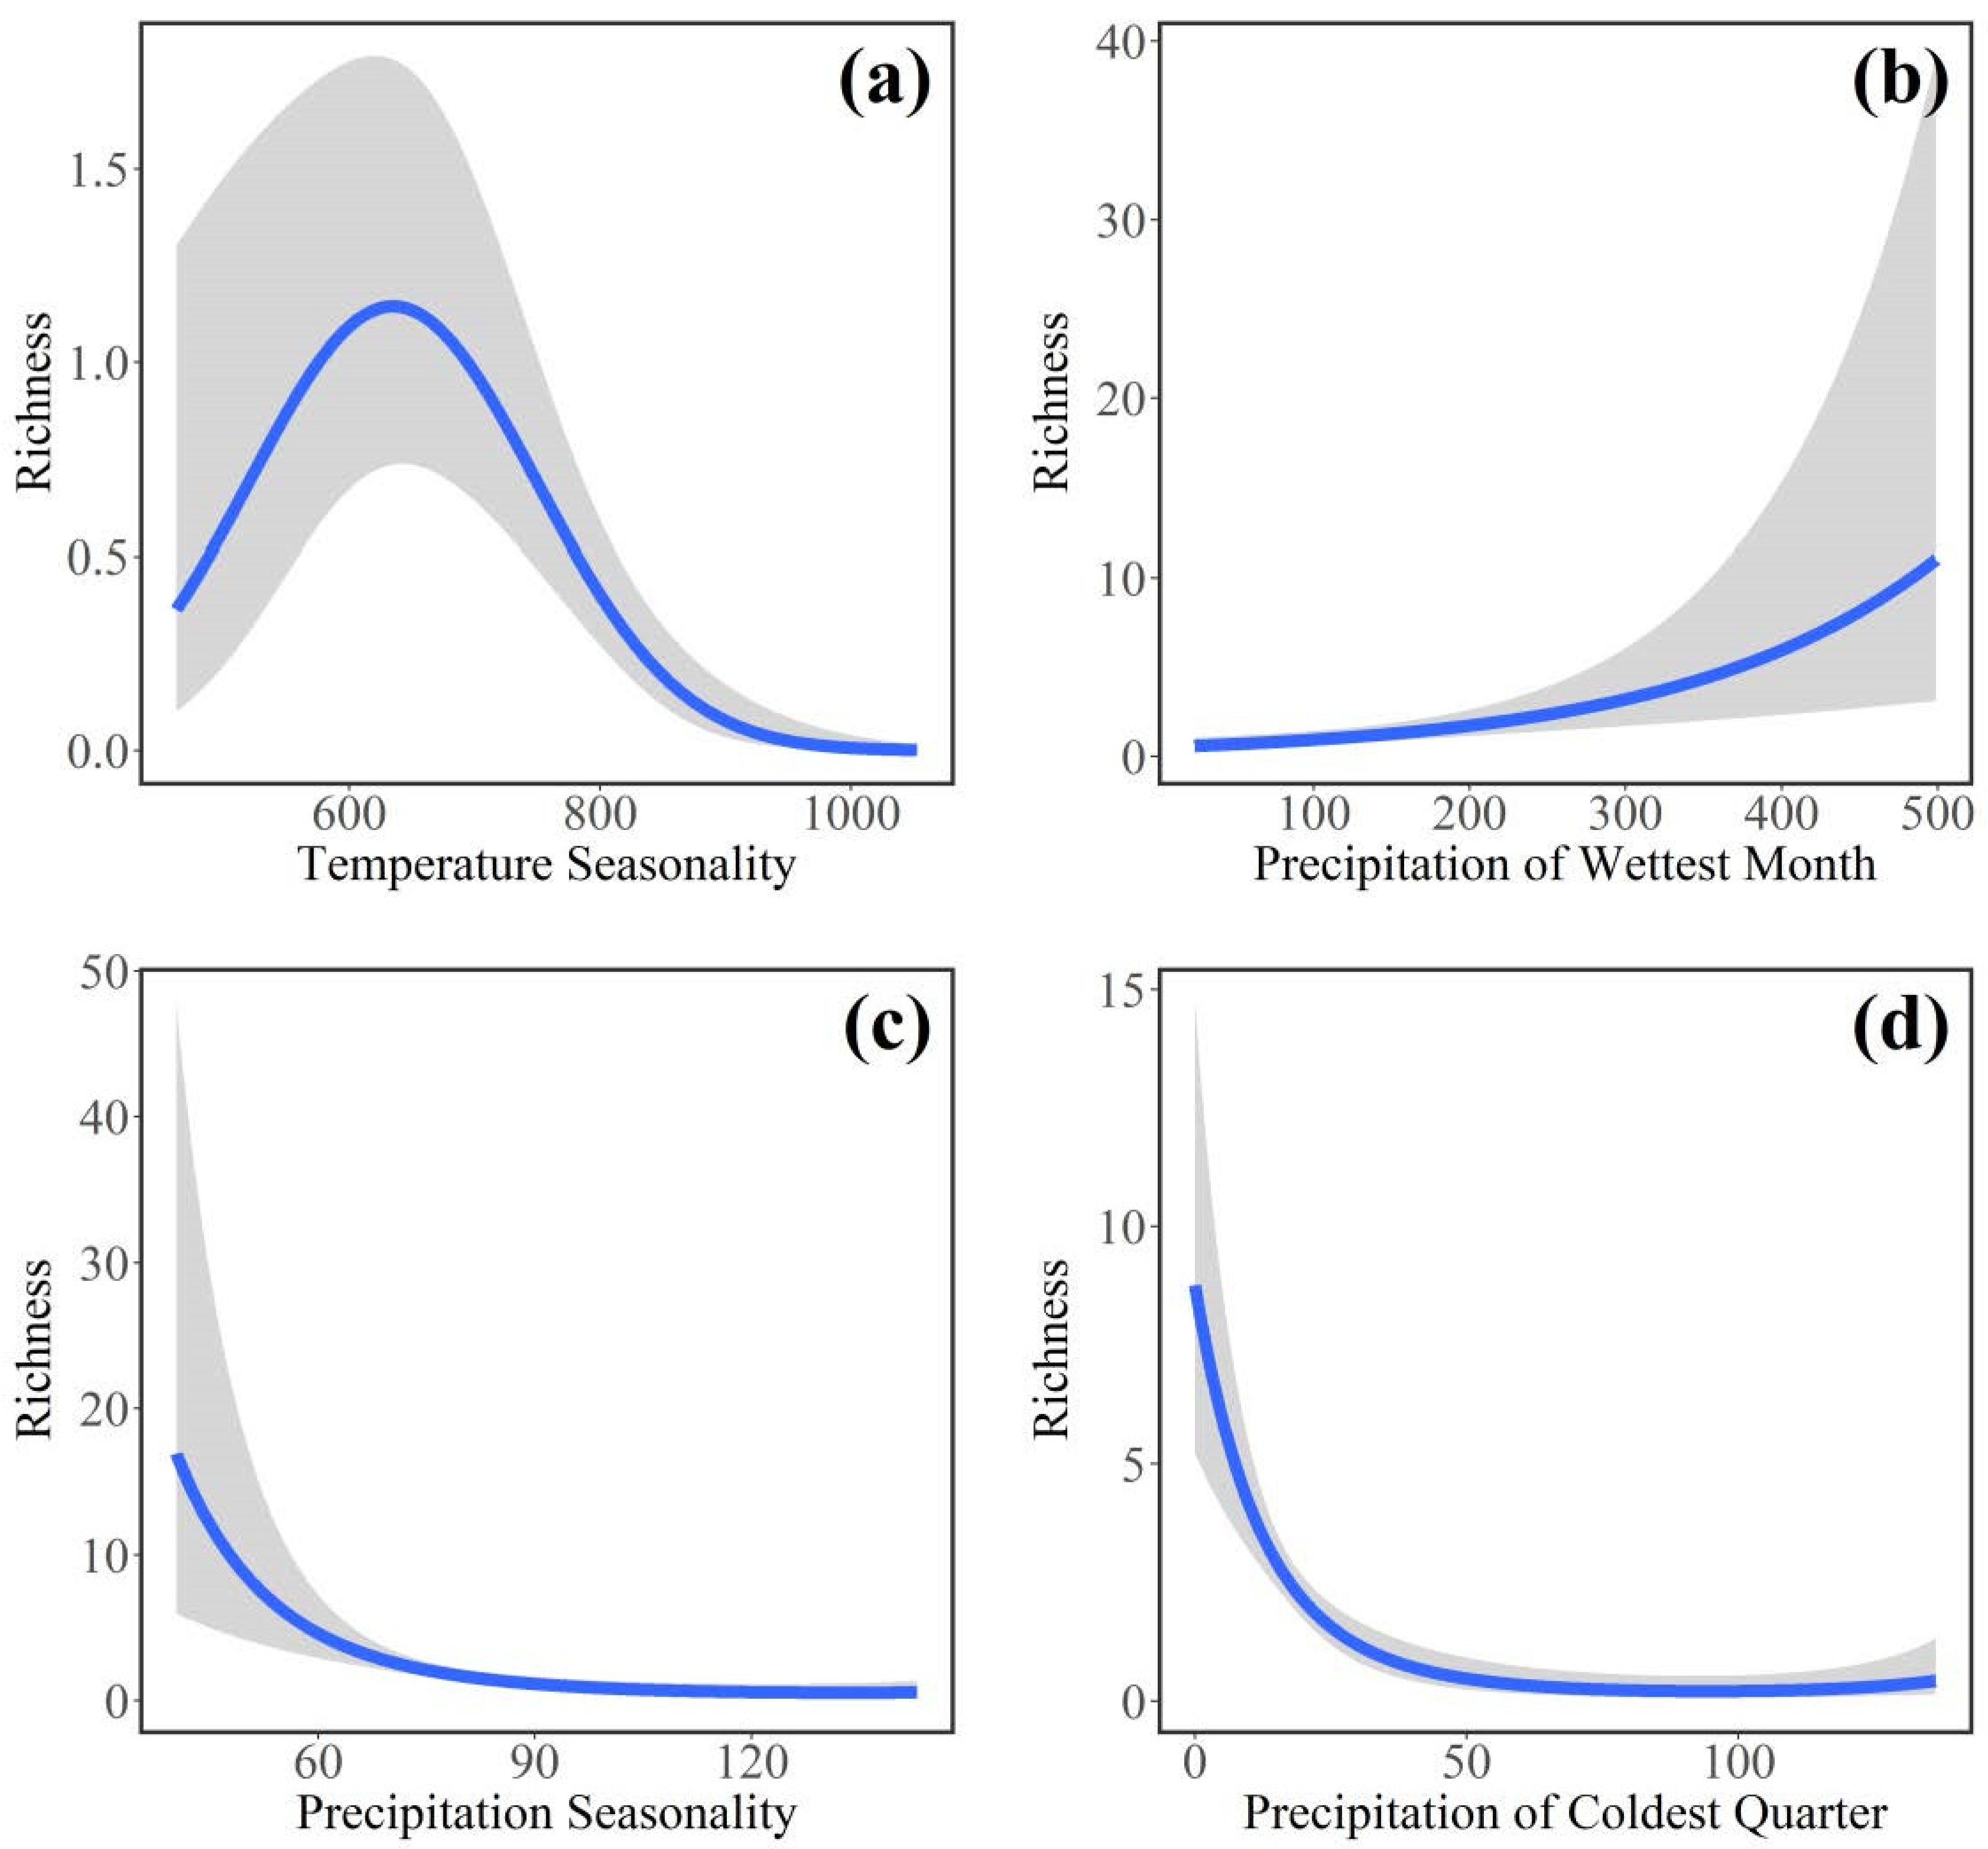
For non-native fish richness (Figure 8), Bio4 (temperature seasonality), Bio15 (precipitation seasonality), Bio17 (precipitation of driest quarter), and Bio19 (precipitation of coldest quarter) were the finally selected variables in the GLM (R2 = 0.3). The final model showed the highest non-native fish richness when the temperature seasonality value reached 650. Furthermore, higher non-native fish richness was also associated with the higher precipitation of the wettest month, and lower precipitation seasonality and precipitation of the coldest quarter.

4. Discussion

4.1. Fish Distribution Pattern in the Yarlung Zangbo River

In addition to the Yarlung Zangbo River, the Nujiang River is also located in Tibet, and is an important international river. The Nujiang River Basin is rich in fish resources, and is known as one of the world’s biodiversity hotspots [35]. The Nujiang River Basin fish spatial distribution pattern can be divided into three parts, and it changes continuously from headstream to downstream [35]. In contrast, based on species composition and distribution data analyses, the Yarlung Zangbo native fish composition can also be divided into three sections, but they are not continuous (Figure 3). Typically, aquatic communities change from headstream to downstream, adjusting to changes in the environment [69], but there are also studies that have revealed that fish assemblages may also change abruptly due to waterfalls or other geological features [13,70]. The Yarlung Zangbo River Basin community changes may be determined by rigid or abrupt boundaries between different zones, and the significant differences between different fish assemblages in different regions may be influenced by the degree of difference in geomorphic structure from upstream to downstream [70]. Unlike the Nujiang River, the Yarlung Zangbo River has many large waterfalls located near the largest and deepest canyon in the world (Yarlung Zangbo Grand Canyon), and native fish respond to these changes by evolving special life history strategies (e.g., cold adaptation, slow growth, long life and late maturation) [71]. Waterfalls, as a geographical barrier, play an important role in shaping the structure of fish assemblages in the Yarlung Zangbo River Basin, which may effectively limit the movement of fish species and help form unique fish fauna, e.g., Schizothoracinae, Nemacheilidae and Sisoridae [7].
Invasive species are known to strongly impact native community structure in many ecosystems [72]. In our study, as opportunistic species, the distribution of non-native fish was unfocused, and some areas of higher non-native fish richness overlapped with those of native fish richness, e.g., the Dogxung Zangbo River, the Nianchu River, the Lhasa Ricer, the Duilongqu River, and the Niyang River. In the plateau ecosystem, fish distribution may be significantly affected by biotic interactions between non-native and native fish, and most of these native fish species (e.g., Schizothorax curvilabiatus and Schizothorax molesworthi) grow slowly and mature late, making them very vulnerable to negative effects from non-native strong invasiveness (e.g., Carassius auratus). Studies show that some fluvial systems have already been severely affected by non-native fish in the Tibetan Plateau, which have occupied the Chabalang wetland in Lhasa City since 2013, and native fish have almost disappeared [73]. Furthermore, some non-native fish (e.g., Carassius auratus) have also formed natural populations in the Lhasa River [43]. Our results indicated the high overlap between native and non-native fish, which may lead to greater threats to native fish in the future. Therefore, considering that the native fish in the Yarlung Zangbo River are composed of a high degree of confirmed endemic and endangered species, we must strengthen fishery management to protect these species. On the one hand, relevant fish removal work must be carried out in areas rich in invasive fish. On the other hand, management needs to carry out local publicity and education on the hazards of fish invasion, provide practical guidance for release activities in local regions, strengthen fishery management, and carry out long-term fish monitoring and related basic research.

4.2. Relationship between Climate Factors and Fish Richness Distribution

Our results show that native fish richness responds differently than non-native fish richness to environmental factors. Environmental factors, especially those related to precipitation (precipitation of seasonality, precipitation of driest quarter, precipitation of coldest quarter), play a significant role in the establishment success of non-native fishes across the Yarlung Zangbo River Basin. In contrast, native fish richness is mainly related to temperature (elevation, mean diurnal range, temperature seasonality). Similar to our results, several macroecological studies in North America also found different associations of non-native fish richness to environmental factors compared with native fishes [74,75,76]. Furthermore, Liu et al. found that the Yarlung Zangbo River has a unique vertical climate because the uplift of the Tibetan Plateau can represent the evolutionary history process of fish species on the Tibetan Plateau to some degree [13]. This means that native fish are already used to the elevation gradient changes, temperature, and precipitation of the plateau ecosystem and the historical processes of the area, but non-native fish have different responses to temperature and precipitation because the majority of non-native fish were introduced through unauthorized pathways. This indicated the importance of the interaction between environmental factor filtering and human interventions in determining the level of invasion.
Elevation and temperature have long been acknowledged to determine the distribution of organisms in various ecosystems. Temperature directly affects fish metabolism, breeding, development and growth, and it is a complex variable: it can cause direct (such as influencing temperature) and indirect (creating geographical barriers) effects on fish distribution [77,78]. Precipitation has also been considered one of the key factors for determining fish distribution in numerous recent studies [33,79] because precipitation can influence stream flows and hydrology [77]. Therefore, another possible explanation is the different swimming abilities of native and non-native fish: non-native fish cannot adapt to the strong water flow caused by heavy precipitation, and due to their unspecialized morphology they cannot live in high-elevation areas. In future analyses, taxonomic and ecological (e.g., based on life history) deviations in broad-scale species distribution patterns should be examined between non-native and native fish.

4.3. Conclusions

This study highlights that fluvial system distribution, as a new method in fish distribution pattern studies, can be used for planning and detecting the future impacts of conservation. Our results show the richness of the Yarlung Zangbo River with a native and non-native fish distribution map based on the fluvial system, and indicate the Yarlung Zangbo River Basin’s native and invasive fish community distribution patterns. Notably, environmental factors, especially those related to precipitation (precipitation of seasonality, precipitation of driest quarter, precipitation of coldest quarter), play a significant role in the establishment success of non-native fish across the Yarlung Zangbo River Basin. However, we lack analyses of specimens in collections housed at national museums, and some regional fish distribution data are still deficient, but they will be included in the next step with data collection and new studies in the future. In addition, future analyses should examine taxonomic and ecological (e.g., based on life history) deviations in broad-scale species distribution patterns between non-native and native fish and explore potential links between hydrological factors and the distribution patterns of plateau fish. We believe that this study can help fish conservation and ecological restoration in the Yarlung Zangbo River Basin.

Author Contributions

Conceptualization, K.L., J.W. and M.W. (Mengjun Wang); methodology, K.L. and J.W.; software, K.L., R.H. and J.W.; validation, K.L., J.W., X.W. and J.W.; formal analysis, K.L. and R.H.; investigation, K.L. and J.W.; resources, K.L.; data curation, K.L.; writing—original draft preparation, K.L.; writing—review and editing, K.L., J.W. and M.W. (Mo Wang); visualization, K.L., R.H. and X.W.; supervision, M.W. (Mo Wang); project administration, M.W. (Mo Wang); funding acquisition, M.W. (Mo Wang). All authors have read and agreed to the published version of the manuscript.

Funding

This research was funded by “Special Project for Basic Research in Yunnan Province (202201AT070046)”, “National Natural Science Foundation of China (31501846)”, and “Western Light Project of Chinese Academy of Sciences”.

Institutional Review Board Statement

Not applicable.

Data Availability Statement

The data presented in this study are available on request from the first author. The data are not publicly available due to restrictions by the research group.

Acknowledgments

We are grateful to Junxing Yang of the Kunming Institute of Zoology, Chinese Academy of Sciences, for helping to improve this manuscript. We are grateful to Bo Ma and Lei Li of Heilongjiang River Fisheries Research Institute for partial data information from the Yalung Zangbo River.

Conflicts of Interest

The authors declare no conflict of interest.

References

  1. LuoZhu, N.; Wang, J.Q.; Xu, X.Y. Zoning for Effective Utilization of Agricultural Water Resources Based on Principal Component Analysis and Fuzzy C-Means Clustering Algorithm. Chin. J. Hydrol. 2011, 31, 76–79. [Google Scholar] [CrossRef]
  2. Matthews, W.J. Fish Faunal “Breaks” and Stream Order in the Eastern and Central United States. Environ. Biol. Fishes 1986, 17, 81–92. [Google Scholar] [CrossRef]
  3. Vörösmarty, C.J.; McIntyre, P.B.; Gessner, M.O.; Dudgeon, D.; Prusevich, A.; Green, P.; Glidden, S.; Bunn, S.E.; Sullivan, C.A.; Liermann, C.R.; et al. Global Threats to Human Water Security and River Biodiversity. Nature 2010, 467, 555–561. [Google Scholar] [CrossRef] [PubMed] [Green Version]
  4. Ma, B.S.; Wang, S.B.; Shao, J.; Li, D.P.; Xie, C.X.; Liu, X.J.; Huo, B. Population resources and fishery conversation policies of Schizothorax oconnori in the Yarlung Zangbo River. J. Fish. Sci. China 2020, 27, 106–117. [Google Scholar] [CrossRef]
  5. Hu, G.; Du, X.; Chen, L.; Ji, F.; Mu, Z.B.; Ma, B.; Li, L.; Jing, X. Current Situation, Major Problems and Countermeasures of Fishery Resources in Xizang Autonomous Region. Chin. J. Fish. 2019, 32, 68–72. [Google Scholar] [CrossRef]
  6. Liu, H.; Mu, Z.; Cai, B.; Zhang, B.; Zhou, J.; Zhang, C.; Pan, Y.; Chen, M. Coupling Supply-Side Structural Reform and Technological Innovation Boosting the Fishery Resource Conservation Process in Tibet. J. Lake Sci. 2018, 30, 266–278. [Google Scholar] [CrossRef] [Green Version]
  7. Yang, H.Y.; Huang, D.M. A Preliminary Investigation on Fish Fauna and Resources of the Upper and Middle Yalu Tsangpo River. J. Cent. China Norm. Univ. (Nat. Sci.) 2011, 45, 629–633. [Google Scholar] [CrossRef]
  8. Liu, S.Z.; Fan, J.R.; Zhu, P.Y.; Wen, A.B.; Zhou, L. Cause analysis of environmental hazards in the middle reaches of Yaluzangbn River in Tibet. J. Nat. Disasters 2001, 10, 25–30. [Google Scholar]
  9. Zhang, S.; Ga, L.; He, Y.P. Some thoughts on the Development of Fisheries in Nyingchi, Tibet. Chin. Aquat. Prod. 2011, 4, 31–32. [Google Scholar] [CrossRef]
  10. Xing, Y.C.; Zhang, C.G.; Fan, E.Y.; Zhao, Y.H. Freshwater Fishes of China: Species Richness, Endemism, Threatened Species and Conservation. Divers. Distrib. 2016, 22, 358–370. [Google Scholar] [CrossRef] [Green Version]
  11. Liu, H.P.; Liu, Y.C.; Liu, S.Y.; Song, X.G.; CiRen, L.J.; Liu, M.J.; Liu, L.L.; Rao, C.W. Fecundity and Reproductive Strategy of Ptychobarbus Dipogon. Acta Hydrobiol. Sin. 2018, 42, 1169–1179. [Google Scholar] [CrossRef]
  12. Deng, J.; Dong, D.H.; Zhang, H.X.; Jiang, W.; Zhao, H.; Kong, F.; Xu, T.; Wang, Q. Investigation and Diversity Analysis of Fish Resources in the Dogxung Zangbo Basin of the Yalu Tsangpo River. Genom. Appl. Biol. 2020, 39, 3468–3474. [Google Scholar] [CrossRef]
  13. Liu, F.; Li, M.Z.; Wang, J.; Gong, Z.; Liu, M.; Liu, H.Z.; Lin, P. cheng Species Composition and Longitudinal Patterns of Fish Assemblages in the Middle and Lower Yarlung Zangbo River, Tibetan Plateau, China. Ecol. Indic. 2021, 125, 107542. [Google Scholar] [CrossRef]
  14. Fisheries Bureau of the Tibet Autonomous Region. Fish and Fish Resources in Xi Zang, China; Fisheries Bureau of the Tibet Autonomous Region: Xi Zang, China, 1995. [Google Scholar]
  15. Zhou, J.; Lai, J.S.; Du, J.; Liu, G.; Zhao, G.; Lin, J.; Wu, M.S.; Liu, Y. Investigation and Protection Countermeasures of Fish Resources in Nyingchi Prefecture. Southwest China J. Agric. Sci. 2010, 23, 938–942. [Google Scholar] [CrossRef]
  16. Zambrano, L.; Martínez-Meyer, E.; Menezes, N.; Peterson, A.T. Invasive Potential of Common Carp (Cyprinus carpio) and Nile Tilapia (Oreochromis niloticus) in American Freshwater Systems. Can. J. Fish. Aquat. Sci. 2006, 63, 1903–1910. [Google Scholar] [CrossRef] [Green Version]
  17. Pont, D.; Hugueny, B.; Oberdorff, T. Modelling Habitat Requirement of European Fishes: Do Species Have Similar Responses to Local and Regional Environmental Constraints? Can. J. Fish. Aquat. Sci. 2005, 62, 163–173. [Google Scholar] [CrossRef] [Green Version]
  18. Field, R.; Hawkins, B.A.; Cornell, H.V.; Currie, D.J.; Diniz-Filho, J.A.F.; Guégan, J.-F.; Kaufman, D.M.; Kerr, J.T.; Mittelbach, G.G.; Oberdorff, T.; et al. Spatial Species-Richness Gradients across Scales: A Meta-Analysi. J. Biogeogr. 2009, 36, 132–147. [Google Scholar] [CrossRef]
  19. Huston, M.A. Local Processes and Regional Patterns: Appropriate Scales for Understanding Variation in the Diversity of Plants and Animals. Oikos 1999, 86, 393–401. [Google Scholar] [CrossRef]
  20. Griffiths, D.; McGonigle, C.; Quinn, R. Climate and Species Richness Patterns of Freshwater Fish in North America and Europe. J. Biogeogr. 2014, 41, 452–463. [Google Scholar] [CrossRef]
  21. Zhou, X.D.; Wang, Z.Y.; Xu, M.Z.; Liu, W.; Yu, B.F.; Pan, B.Z.; Zhao, N.; Shao, X.J. Stream Power as a Predictor of Aquatic Macroinvertebrate Assemblages in the Yarlung Tsangpo River Basin (Tibetan Plateau). Hydrobiologia 2017, 797, 215–230. [Google Scholar] [CrossRef]
  22. Xu, M.Z.; Wang, Z.Y.; Pan, B.Z.; Yu, G.A. The Assemblage Characteristics of Benthic Macroinvertebrates in the Yalutsangpo River, the Highest Major River in the World. Front. Earth Sci. 2014, 8, 351–361. [Google Scholar] [CrossRef]
  23. Yang, Y.C. The discovery of Yalu Zangbo Great Canyon and the researches on its characteristics and the cause of its formation. Geogr. Res. 1999, 18, 342–348. [Google Scholar] [CrossRef]
  24. Zhang, C.G.; Zhao, Y.H.; Xing, Y.C.; Tang, W.Q.; Zhou, W. Fish Species and Distribution in Inland China, 1st ed.; Science Press: Beijing, China, 2015. [Google Scholar]
  25. Wu, Y.F.; Wu, C.Z. Fishes of Qinghai-Tibet Plateau; Sichuan Science and Technology Press: Sichuan, China, 1992. [Google Scholar]
  26. Chu, X.L.; Deng, B.S.; Dai, D.Y. Zoofauna of China: Osteichthys Silocyformes; Science Press: Beijing, China, 1999. [Google Scholar]
  27. Chen, Y.Y. Fauna of China (Osteichthys, Cypriniformes) Mesocoll; Science Press: Beijing, China, 1998. [Google Scholar]
  28. Yue, P.Q. The Fauna of China, Osteichthys, Cypriniformes, Lower Volume; Science Press: Beijing, China, 2000. [Google Scholar]
  29. Jing, X.; Ma, B. Fish and Resources of the Lower Reaches of the Yarlung Zangbo River in Tibet; China Agriculture Press: Beijing, China, 2020. [Google Scholar]
  30. Ji, F.; Ma, B.; Wang, B.Q. Report on Fishery Resources and Environment in the Middle Reaches of the Yarlung Zangbo River; China Agriculture Press: Beijing, China, 2019. [Google Scholar]
  31. Ji, F.; Li, L. Atlas of Fishes of the Xizang Plateau; China Agriculture Press: Beijing, China, 2017. [Google Scholar]
  32. Title, P.O.; Bemmels, J.B. ENVIREM: An Expanded Set of Bioclimatic and Topographic Variables Increases Flexibility and Improves Performance of Ecological Niche Modeling. Ecography 2018, 41, 291–307. [Google Scholar] [CrossRef] [Green Version]
  33. Buisson, L.; Thuiller, W.; Lek, S.; Lim, P.; Grenouillet, G. Climate Change Hastens the Turnover of Stream Fish Assemblages. Glob. Chang. Biol. 2008, 14, 2232–2248. [Google Scholar] [CrossRef]
  34. ArcMap Resources for ArcGIS Desktop|Documentation, Tutorials & More. Available online: https://www.esri.com/en-us/arcgis/products/arcgis-desktop/resources (accessed on 12 October 2022).
  35. Yang, K.; Ding, C.; Chen, X.; Ding, L.; Huang, M.; Chen, J.; Tao, J. Fish Diversity and Spatial Distribution Pattern in the Nujiang River Basin. Biodivers. Sci. 2022, 30, 21334. [Google Scholar] [CrossRef]
  36. R Core Team. R: A Language and Environment for Statistical Computing; R Foundation for Statistical Computing: Vienna, Austria, 2022. [Google Scholar]
  37. Fan, L.Q.; Liu, H.P.; Guo, Q.Q.; Pan, G. Non-natve fishes: Distiubution and assemblage structure in the lhasa River basin, tibet, China. Acta Hydrobiol. Sin. 2016, 40, 958–967. [Google Scholar] [CrossRef]
  38. Lv, Y.L.; Hao, S.X.; Wang, C.; Sun, D.F.; Wang, X.T.; Liu, H.P.; Shang, P. Investigation and analysis on plankton and fish resources in the source area of lhasa river, tibet, china. Oceanol. Et Limnol. Sin. 2016, 47, 407–413. [Google Scholar]
  39. Li, F. Research on the Aquaatic Organisms and Advance Estimate of Effects of Hydropower Engineering in Niyang River Basin, Tibet; Northwest University: Shaanxi, China, 2009. [Google Scholar]
  40. Li, H.J.; Xie, C.X. Fish Resources and Utilization Measures of the Yarlung Zangbo River. Jiangsu Agric. Sci. 2006, 4, 165–167. [Google Scholar] [CrossRef]
  41. Wang, B.S. The Preliminary Construction of Tebet Fish Information System; Southwest University: Chongqing, China, 2008. [Google Scholar]
  42. Shen, H.; Guo, L. Investigation and analysis of fish composition in the Niyang River in Tibet. Hebei Fish. 2008, 5, 51–54. [Google Scholar]
  43. Chen, F.; Chen, Y.F. Investigation and protection strateges of fishes LhaSa River. Acta Hydrobiol. Sin. 2010, 34, 278–285. [Google Scholar] [CrossRef]
  44. Wang, J.; Liu, F.; Gong, Z.; Lin, P.-C.; Liu, H.-Z.; Gao, X. Length–Weight Relationships of Five Endemic Fish Species from the Lower Yarlung Zangbo River, Tibet, China. J. Appl. Ichthyol. 2016, 32, 1320–1321. [Google Scholar] [CrossRef]
  45. Gong, Z.; Deng, S.Q.; Wang, J.; Liu, H.Z. A New Species of Genus Garra (Cypriniformes: Cyprinidae) from the Lower Yarlung ZangBo River Drainage in Southeastern Tibet, China. Chin. J. Zool. 2018, 53, 857–867. [Google Scholar]
  46. Yu, C.J.; Song, J.B. Report on the Comprehensive Scientific Study of the Black-Necked Crane Nature Reserve in the Middle Reaches of the Yarlung Tsangpo River Valley; Tibet Autonomous Region Forestry Survey; Design and Research Institute: Tibet, China, 2002. [Google Scholar]
  47. Liu, M.; Ma, B.; Zhang, C.; Tang, T.; Liu, S.; Duan, X.; Li, L.; Zhu, F.; Wang, N.; Chen, D. Distribution Pattern and Environmental Impact Factors of Schizothoracinae Fishes in the Rivers of Tibet: The Case of Nujiang River and Yalu Zangbo River. Ecol. Environ. Sci. 2020, 29, 1792. [Google Scholar]
  48. Luo, S.; Dan, Z.; Bu, D. Current Status of Fish Resource in Lhasa River and Countermeasure of its Utilization. J. Tibet. Univ. 2011, 26, 7–10. [Google Scholar] [CrossRef]
  49. Ren, B.; Ren, M.L. Notes on fishes from Dam qu (River) of Northern Xizang (Tibet). Chin. J. Fish. 2003, 16, 1–11. [Google Scholar] [CrossRef]
  50. Zhu, T.B.; Yang, D.G. A trophic levels estimation of six fish species from the middle Yarlung Zangbo River, China. Freshw. Fish. 2019, 49, 46–49. [Google Scholar] [CrossRef]
  51. He, D.; Chen, Y.F.; Chen, Y.Y.; Chen, Z.M. Molecular phylogeny of specialized grade Schizothorax fish and uplift on the Tibetan Plateau. Chin. Sci. Bull. 2003, 48, 2354–2362. [Google Scholar] [CrossRef]
  52. Zhang, C.L.; Yue, Z.H.; Huang, H.J. Fishes of Southern Tibet. Acta Zool. Sin. 1964, 2, 272–282. [Google Scholar]
  53. Fan, L.; Liu, H.P.; Guo, Q.Q.; Pan, G. Fishes and Their Distribution Patterns in a Meadow Wetland of the Lhasa River Basin, the Tibetan Plateau. Resour. Sci. 2010, 32, 1657–1665. [Google Scholar]
  54. Shao, J.; Ma, B.S.; Duan, Y.J.; Xie, C.X.; Lin, S.Q.; Zhou, X.J.; Huo, B. Population resources and fishery management policies of Schizopygopsis younghusbandi in the Yarlung Zangbo River, China. Chin. J. Appl. Ecol. 2019, 30, 2437–2446. [Google Scholar] [CrossRef]
  55. Zhou, J.S.; Zeng, B.H.; Wang, Q.L.; Wang, W.L.; Mu, Z.B.; Wang, J.L.; Zhang, C. Sequence Variations and Genetic Differentiations in 16S RRNA Gene in Schizaopygopsis Younghusbandiat Different Altitude Levels. Fish. Sci. Technol. Inf. 2019, 46, 130–134. [Google Scholar] [CrossRef]
  56. Song, L.X. Report on the Comprehensive Scientific Study of Natural Resources in Tsum Tshebalgou National Nature Reserve; Tibet Autonomous Region Forestry Survey; Design and Research Institute: Tibet, China, 2020. [Google Scholar]
  57. Ma, B.; Li, L.; Wang, J.L.; Gong, J.H.; Zhang, C.; Ji, F.; Li, B. Morphological and COI gene barcode analyses of Schizothorax waltoni, S. o’connori and their natural hybrids in the Yarlung Zangbo River. J. Fish. Sci. China 2018, 25, 753. [Google Scholar] [CrossRef]
  58. Zeng, B.H.; Liu, H.P.; Wang, J.; Zhu, C.K. Study on Breeding Time of Wild Schizothorax waltoni in Rikaze Section of Yalu Tsangpo River. Tibet. J. Agric. Sci. 2020, 42, 76–78. [Google Scholar]
  59. Lin, P.C.; Hu, H.M.; Liu, F.; Li, M.Z.; Liu, H.Z. Reproductive Characteristics of Psilorhynchus homaloptera Hora and Mukerji, 1935 (Cyprinidae: Psilorhynchidae) in the Lower Yarlung Zangbo River, Tibet. J. Oceanol. Limnol. 2021, 39, 1513–1522. [Google Scholar] [CrossRef]
  60. He, D.K.; Gao, Y.X.; Chen, Y.F. Molecular phylogenetic and biogeographic studies of Triplophysa fishes. Adv. Nat. Sci. 2006, 11, 1395–1404. [Google Scholar] [CrossRef]
  61. Gong, Z.; Lin, P.C.; Liu, F.; Liu, H.Z. Exostoma tibetana, a New Glyptosternine Catfish from the Lower Yarlung Tsangpo River Drainage in Southeastern Tibet, China (Siluriformes: Sisoridae). Zootaxa 2018, 4527, 392–402. [Google Scholar] [CrossRef]
  62. Wu, X.W.; He, M.J.; Chu, S.L. On the Fishes of Sisoridae from the Region of XiZang. Oceanol. Et Limnol. Sin. 1981, 12, 74–79. [Google Scholar]
  63. Pan, Y.Z.; Liu, H.P.; Zhu, T.B. Morphological Variations between Two Wild Groups of Glyptosternum maculatum in Tibet. J. Fish. Sci. China 2019, 26, 823–833. [Google Scholar] [CrossRef]
  64. Pan, Y.Z.; LI, B.H.; KELSANG, G.; Liu, H.P.; Zhao, J.S. Embryonic development of Glyptosternum maculatum in Tibet. J. Fish. Sci. China 2018, 25, 1205. [Google Scholar] [CrossRef]
  65. Chen, F.; Ma, B.S.; Xie, C.X.; Zhang, H.J. Age and growth characteristics of Pareuchiloglanis kamengensis in Tibet. Freshw. Fish. 2018, 48, 45–51. [Google Scholar] [CrossRef]
  66. Jin, H.Y.; Li, L.; Jin, X.; Wang, N.M.; Ma, Q.Z.; Yin, J.S.; Ma, B. Fecundity of Pseudecheneis sulcatus in Downstream of Yarlung Zangbo River in Xizang. Fish. Sci. 2020, 39, 744–751. [Google Scholar] [CrossRef]
  67. Jin, H.Y.; Li, L.; Jin, X.; Ma, Q.Z.; Wang, N.M.; Ma, Q.; Yin, J.; Ma, B. Age and growth of Pseudecheneis sulcatus in lower reach of Yarlung Zangbo River off medog county reach. Freshw. Fish. 2020, 50, 10–17. [Google Scholar]
  68. Ma, B.; Ji, F.; Li, B.H.; Li, L.; Zhang, Y.; Zhang, C.; Gong, J.H. First Discovery of Sucker Throat Catfish Pseudecheneis sulcatus in Middle Reaches of Yarlung Zangbo River, Tibet. Chin. J. Zool. 2018, 53, 314–316. [Google Scholar] [CrossRef]
  69. Vannote, R.L.; Minshall, G.W.; Cummins, K.W.; Sedell, J.R.; Cushing, C.E. The River Continuum Concept. Can. J. Fish. Aquat. Sci. 1980, 37, 130–137. [Google Scholar] [CrossRef]
  70. Matthews, W.J. Patterns in Freshwater Fish Ecology; Chapman and Hall: London, UK, 1998. [Google Scholar]
  71. Ma, B.S.; Xie, C.X.; Huo, B.; Yang, X.F.; Li, P. Age Validation, and Comparison of Otolith, Vertebra and Opercular Bone for Estimating Age of Schizothorax o’connori in the Yarlung Tsangpo River, Tibet. Environ. Biol. Fish 2011, 90, 159–169. [Google Scholar] [CrossRef]
  72. Martin, C.W.; Valentine, M.M.; Valentine, J.F. Competitive Interactions between Invasive Nile Tilapia and Native Fish: The Potential for Altered Trophic Exchange and Modification of Food Webs. PLoS ONE 2010, 5, e14395. [Google Scholar] [CrossRef] [Green Version]
  73. Ding, H.P. Study on the Biology of Exotic Fishes in Chanbalang Wetland and Their Stresses on Native Fishes. Master’s Thesis, Huazhong Agricultural University, Wuhan, China, 2014. [Google Scholar]
  74. Anas, M.U.M.; Mandrak, N.E. Drivers of Native and Non-Native Freshwater Fish Richness across North America: Disentangling the Roles of Environmental, Historical and Anthropogenic Factors. Glob. Ecol. Biogeogr. 2021, 30, 1232–1244. [Google Scholar] [CrossRef]
  75. Oberdoff, T.; Guégan, J.-F.; Hugueny, B. Global Scale Patterns of Fish Species Richness in Rivers. Ecography 1995, 18, 345–352. [Google Scholar] [CrossRef]
  76. Stohlgren, T.J.; Barnett, D.; Flather, C.; Fuller, P.; Peterjohn, B.; Kartesz, J.; Master, L.L. Species Richness and Patterns of Invasion in Plants, Birds, and Fishes in the United States*. Biol. Invasions 2006, 8, 427–447. [Google Scholar] [CrossRef] [Green Version]
  77. Guo, C.; Chen, Y.; Lek, S.; Li, Z. Large Scale Patterns in the Diversity of Lake Fish Assemblages in China and the Effect of Environmental Factors. Fundam. Appl. Limnol. 2016, 188, 129–145. [Google Scholar] [CrossRef]
  78. Murugavel, P.; Pandian, T.J. Effect of Altitude on Hydrology, Productivity and Species Richness in Kodayar—A Tropical Peninsular Indian Aquatic System. Hydrobiologia 2000, 430, 33–57. [Google Scholar] [CrossRef]
  79. Buisson, L.; Grenouillet, G. Contrasted Impacts of Climate Change on Stream Fish Assemblages along an Environmental Gradient. Divers. Distrib. 2009, 15, 613–626. [Google Scholar] [CrossRef]
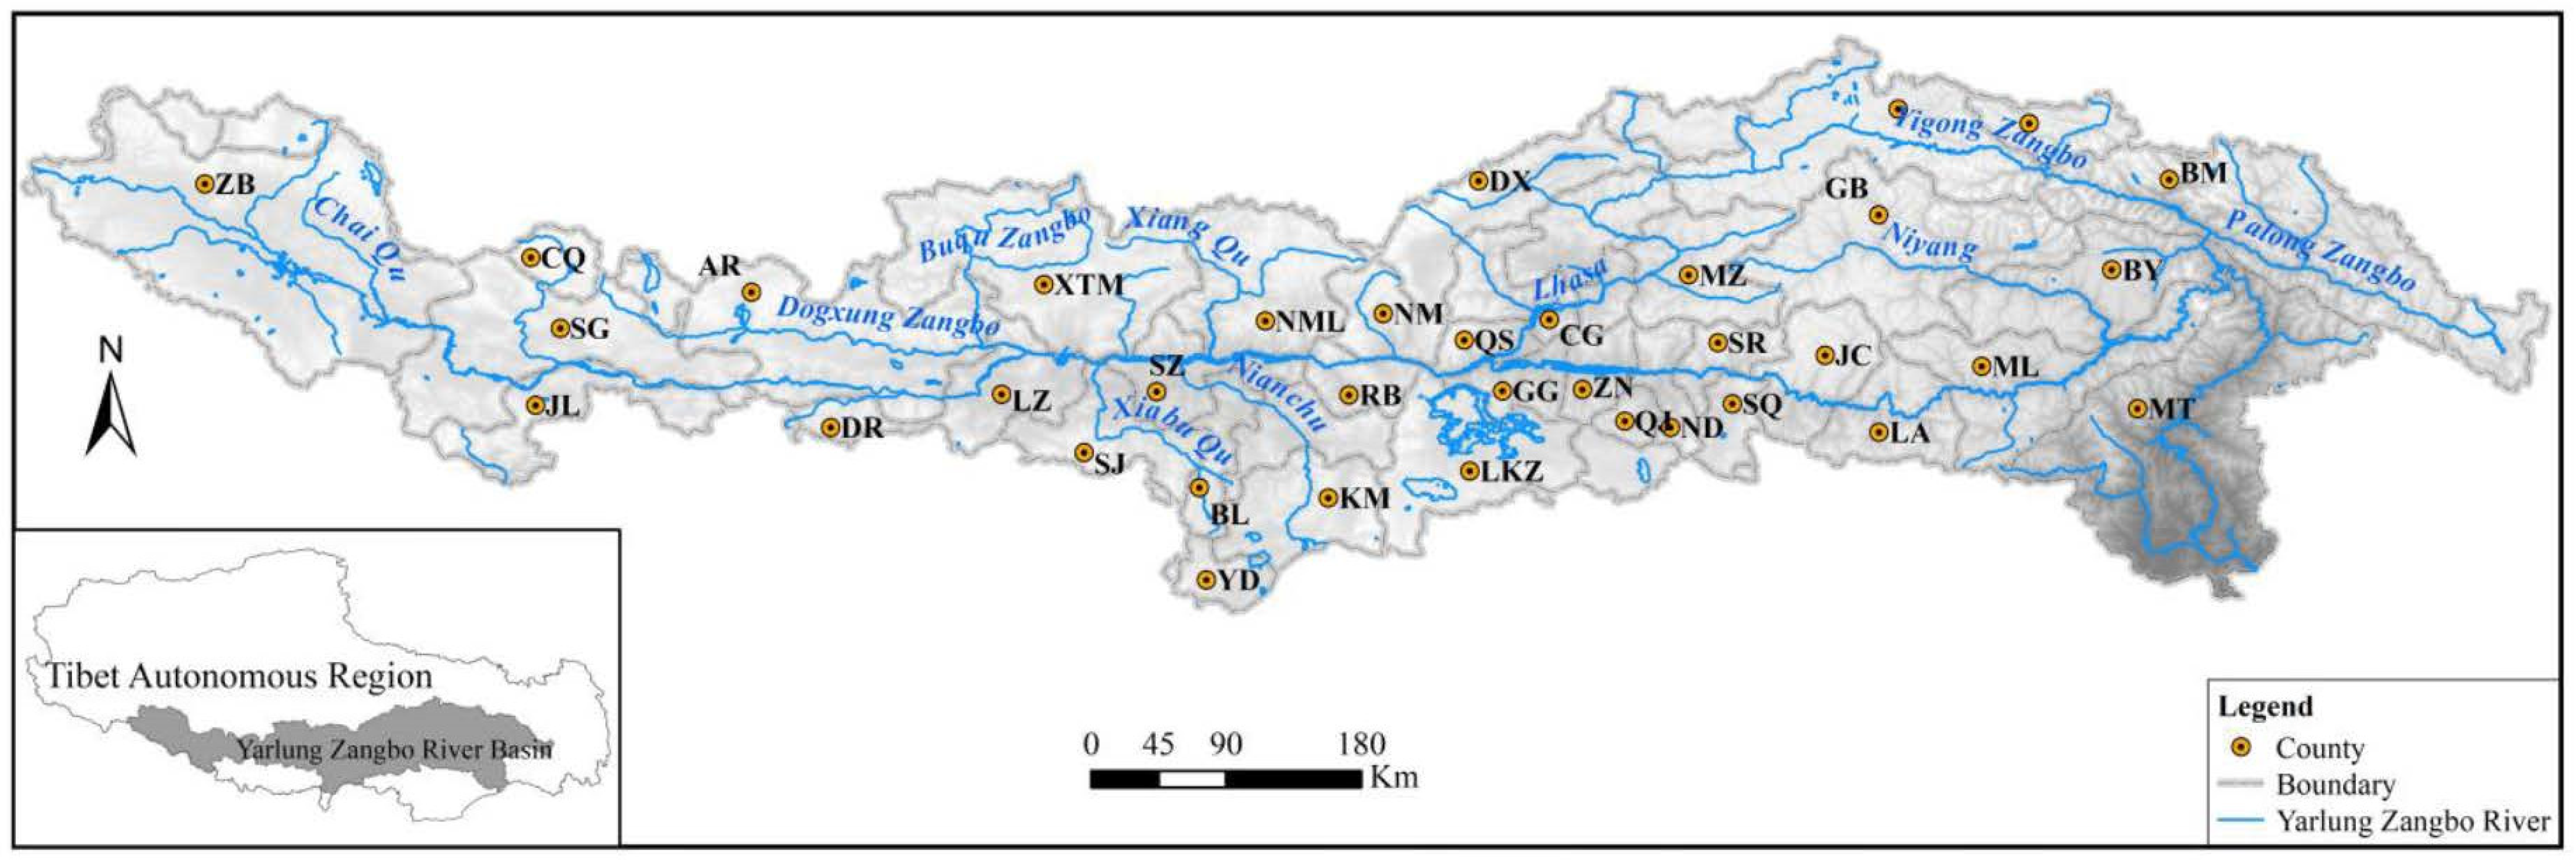
Figure 1. The study area map includes the Yarlung Zangbo River Basin and its covered administrative region. County Codes: ZB, Zhongba; SG, Saga; CQ, Cuoqing; JL, Jilong; AR, Angren; DR, Dingri; XTM, Xietongmen; LZ, Lazi; SJ, Sajia; SZ, Sangzhu; BL, Bailang; NML, Nanmulin; RB, Renbu; NM, Nimu; QS, Qushui; GG, Gongga; LKZ, Langkazi; CG, Chengguan; DX, Dangxiong; ND, Naidong; ZN, Zhanang; QJ, Qiongjie; SR, Sangri; SQ, Songqu; JC, Jiacha; MZ, Mozhugongka; GB, Gongbujiangda; LA, Lang; ML, Milin; BY, Bayi; MT, Moetro; BM, Bomi; BB, Bianba; JL, Jiali; KM, Kangma; YD, Yadong.
Diversity 14 01142 g001
Figure 2. (a) Native fish richness distribution in the Yarlung Zangbo River Basin. (b) Non-native fish richness in the Yarlung Zangbo River Basin. The references “Fishes of Qinghai-Tibet Plateau” [25] and “Tibet Aquatic Biological Conservation Series 1–3” [29,30,31] were used to categorize the “native fish” and “non-native fish” species in this study. County Codes: XTM, Xietongmen; LZ, Lazi; SJ, Sajia; SZ, Sangzhu; SR, Sangri; JC, Jiacha; ML, Milin; MT, Moetro.
Diversity 14 01142 g002
Figure 3. Ward clustering for native fish in the Yarlung Zangbo River Basin showing 3 main groups (clusters 1–3). Code for different mainstream locations in the Yarlung Zangbo River: (1) “YJ” is the code name for “Yarlung Zangbo River”; (2) the names of the counties where different sections of the Yarlung Zangbo River are located after “YJ”, such as “YJ_Lazi”, mean that the Yarlung Zangbo River section is in Lazi County, etc.
Diversity 14 01142 g003
Figure 4. Native and non-native fish distributions in the Yarlung Zangbo River. (a) The three clusters on the native fish distribution map. (b) The six clusters on the non-native fish distribution map.
Diversity 14 01142 g004
Figure 5. The non-metric multi-dimensional scaling (NMDS) ordination of species composition based on fluvial system. (a) NMDS ordination of native fish; (b) NMDS ordination of non-native fish. Points with different colors represent dissimilar species compositions of rivers, and ellipses represent the 95% confidence intervals of the two kinds of sites.
Diversity 14 01142 g005
Figure 6. Ward clustering for non-native fish in the Yarlung Zangbo River Basin showing 6 main groups (clusters 1–6).
Diversity 14 01142 g006
Figure 7. The relationship between four important factors selected by the random forest model and native fish richness. The gray range is the 95% confidence interval. (a) Ele: elevation; (b) Bio2: mean diurnal range; (c) Bio4: temperature seasonality; (d) Bio14: precipitation of driest month.
Diversity 14 01142 g007
Figure 8. The relationship between four important factors selected by the random forest model and non-native fish richness. The gray range is the 95% confidence interval. (a) Bio4: temperature seasonality; (b) Bio13: precipitation of wettest month; (c) Bio15: precipitation seasonality; (d) Bio19: precipitation of coldest quarter.
Diversity 14 01142 g008
Table 1. Related environmental variables.
Environmental VariableAbbreviation
Annual mean temperature Bio1
Mean diurnal range Bio2
Isothermally Bio3
Temperature seasonalityBio4
Max temperature of warmest month Bio5
Min temperature of coldest month Bio6
Temperature annual range Bio7
Mean temperature of wettest quarter Bio8
Mean temperature of driest quarter Bio9
Mean temperature of warmest quarter Bio10
Mean temperature of coldest quarter Bio11
Annual precipitation Bio12
Precipitation of wettest month Bio13
Precipitation of driest month Bio14
Precipitation seasonality Bio15
Precipitation of wettest quarter Bio16
Precipitation of driest quarter Bio17
Precipitation of warmest quarter Bio18
Precipitation of coldest quarter Bio19
Water vapor pressure Vapor
Elevation Ele
Publisher’s Note: MDPI stays neutral with regard to jurisdictional claims in published maps and institutional affiliations.