Article

Recent Changes in Genetic Diversity, Structure, and Gene Flow in a Passerine Experiencing a Rapid Population Decline, the Dupont’s Lark (Chersophilus duponti)

by
Daniel Bustillo-de la Rosa
1,2,*,
Juan Traba
1,2,
María Calero-Riestra
3,4,
Manuel B. Morales
1,2,
Adrián Barrero
1,2,
Javier Viñuela
3,
Cristian Pérez-Granados
1,5,
Julia Gómez-Catasús
1,2,6,
Juan J. Oñate
1,2,
Margarita Reverter
1,2,
Israel Hervás
1,2,
Jorge Hernández Justribó
7,
Eladio L. García de la Morena
1,8,
Germán M. López-Iborra
5 and
Jesús T. García
3
1
Terrestrial Ecology Group (TEG-UAM), Department of Ecology, Universidad Autónoma de Madrid, c/Darwin, 2, 28049 Madrid, Spain
2
Centro de Investigación en Biodiversidad y Cambio Global (CIBC-UAM), Universidad Autónoma de Madrid, c/Darwin, 2, 28049 Madrid, Spain
3
Instituto de Investigación en Recursos Cinegéticos (IREC, CSIC-UCLM), Ronda de Toledo s/n, 13005 Ciudad Real, Spain
4
Instituto Pirenaico de Ecología, Consejo Superior de Investigaciones Científicas (IPE-CSIC), 22700 Zaragoza, Spain
5
Ecology Department/IMEM “Ramón Margalef”, Universidad de Alicante, 03080 Alicante, Spain
6
Raasepori Campus (Raseborg), Novia University of Applied Sciences, Raseborgsvägen 9, FI-10600 Ekenäs, Finland
7
Minuartia, 08011 Barcelona, Spain
8
Biodiversity Node S.L. Sector Foresta, Tres Cantos, 28760 Madrid, Spain
*
Author to whom correspondence should be addressed.
Diversity 2022, 14(12), 1120; https://doi.org/10.3390/d14121120
Submission received: 23 November 2022 / Revised: 10 December 2022 / Accepted: 11 December 2022 / Published: 15 December 2022

Abstract

:
Monitoring temporal dynamics in genetic diversity is of great importance for conservation, especially for threatened species that are suffering a rapid population decline and increased fragmentation. Here, we investigate temporal variation in genetic diversity, structure, and gene flow in the Dupont’s lark (Chersophilus duponti) across most of its range. This species shows increasing levels of population fragmentation, substantial population declines, and severe range contraction, so temporal losses of genetic diversity, increasing differentiation, and decreasing gene flow are expected when comparing present day data with previous situations. To address this, we resampled sites (nine regions in two countries) after 12–15 years (five-to-seven generations) and assessed changes in genetic parameters using 11 microsatellite markers. We found no substantial loss in genetic diversity over time at the species level, but we detected considerable variation among regions in the amount of allelic diversity and heterozygosity lost over time. Temporal variation in allele frequencies (common, rare, and private alleles), and changes in genetic differentiation and gene flow over time suggest a major role of connectivity for the stability of the overall metapopulation. Our results agree with the hypothesis that connectivity rescues genetic diversity via immigration and gene flow. However, evidence of recent genetic bottleneck and the substantial changes detected in some regions are clear signs of genetic erosion and may be signalling a rapid decline of the populations. Urgent actions must be carried out to stop and reverse human impacts on this threatened lark and its habitat.

1. Introduction

Precise estimates of basic features of wildlife populations, such as genetic diversity, population size, or the extent to which neighbouring populations are spatially separated and connected by gene flow are critical for conservation efforts [1,2,3]. These features are shaped by the interaction between genetic drift, gene flow, and natural selection, which in turn are highly influenced by the demographic and spatial distribution of populations. Smaller and more isolated populations may experience stronger genetic drift and inbreeding than larger, genetically diverse, and well-connected ones [4,5]. As a consequence, they have a higher possibility of losing genetic diversity and accumulating deleterious mutations which can contribute (among other factors) to extinction risk [6,7]. Indeed, isolation, associated with habitat fragmentation, is one of the main threats for the persistence of populations [8,9]. It reduces or limits gene flow across landscapes, increasing genetic differentiation among disjunct range fragments, which results in increased relatedness and decreased genetic diversity in each range fragment due to inbreeding [10,11]. Ultimately, all these processes act concomitantly by reducing the abundance of individuals in the remaining habitat patches [12]. In all, the genetic impacts of population fragmentation depend critically upon gene flow among fragments and their effective sizes.
Despite the undoubted importance of genetic factors in determining the level of threat and the fate of populations or species [13], the main criteria used by the International Union for Conservation of Nature (IUCN) in tracking biodiversity loss and guiding conservation efforts are still based on (observed) population size and range extent [13,14]. Access to genetic information requires physical sampling which can be costly and time consuming, so genetic approaches are unlikely to be applicable in all cases. Nevertheless, the use of minimally invasive sampling methods [15] and the recent development of molecular and analytical methods [13,16] make genetic monitoring an increasingly important tool for conservation. In the case of species of conservation concern and for which population decline and increased fragmentation have already been detected, assessing temporal changes in genetic diversity and structure are crucial to evaluate population viability and resilience to future changes and to inform conservation actions [17].
Since genetic monitoring aims to quantify temporal changes in population genetic metrics using information from molecular markers [18], careful thought needs to be given to the spatio-temporal design of genetic assessment. Most published research on genetic diversity and structure in wild populations has focused on populations sampled at a point in time [16,19,20]. The information collected in these works has been used to infer population parameters and demographic trends, with different degrees of accuracy depending on the estimators used and the model assumptions [21]. More detailed genetic evaluations based on a time-spaced sampling scheme of the same populations and sites are still relatively scarce, but are becoming more frequent [1,22,23,24,25].
Here, we investigate temporal variation in genetic diversity and structure over time in Dupont´s lark (Chersophilus duponti) across its range using two time-spaced samples. The Dupont’s lark is a threatened steppe passerine considered to be a good indicator of steppe habitat quality [26,27,28]. Its distribution is restricted to natural shrub-steppes of Spain and northern Africa [29,30,31], typically inhabiting flat areas (<15% of slope) with sparse small scrubs and bare ground [32,33,34]. Its global and European conservation status have been assessed by the IUCN as ‘Vulnerable’ due to the rapid declining trend observed in key areas across the species’ range [35]. Annual population declines of 3.9% between 2004 and 2015 were detected in Spain [34], and severe declines (10–13% over 10 years) were detected in some North African populations [35]. A significant range contraction (ca. 40%) was reported over the past two decades in Spain [34,36], and a high probability of extinction in 20 years for the whole Spanish metapopulation was also predicted [36]. Some of the main threats described for the species are: habitat fragmentation and loss, decrease in habitat quality [27], and isolation of populations [30,32,36,37,38,39].
The Dupont´s lark is a resident species with adult breeding dispersal movements usually shorter than 200 m [40,41], strict habitat requirements [31,32,42], and a marked metapopulation structure [31,34,43]. These characteristics make Dupont´s lark a good model to study whether genetic diversity and structure are affected in species experiencing substantial changes in population and range size. Two single time point genetic studies have reported the first measures of genetic diversity and signals of genetic structure between Spanish and Moroccan populations based on mitochondrial DNA [29] or microsatellite data [38]. Both studies suggested genetic erosion caused by ongoing habitat fragmentation [38,44]. Here, we applied a population genetic approach using multilocus genotypic data from microsatellite DNA to monitor recent temporal trends in population genetic diversity and structure. We evaluated potential trends at two time points spaced across 5–7 generations. Being aware of the range contractions and population declines of the species in recent decades, a detectable change in intraspecific genetic diversity and population structure was expected between the two temporal samples [45].

2. Materials and Methods

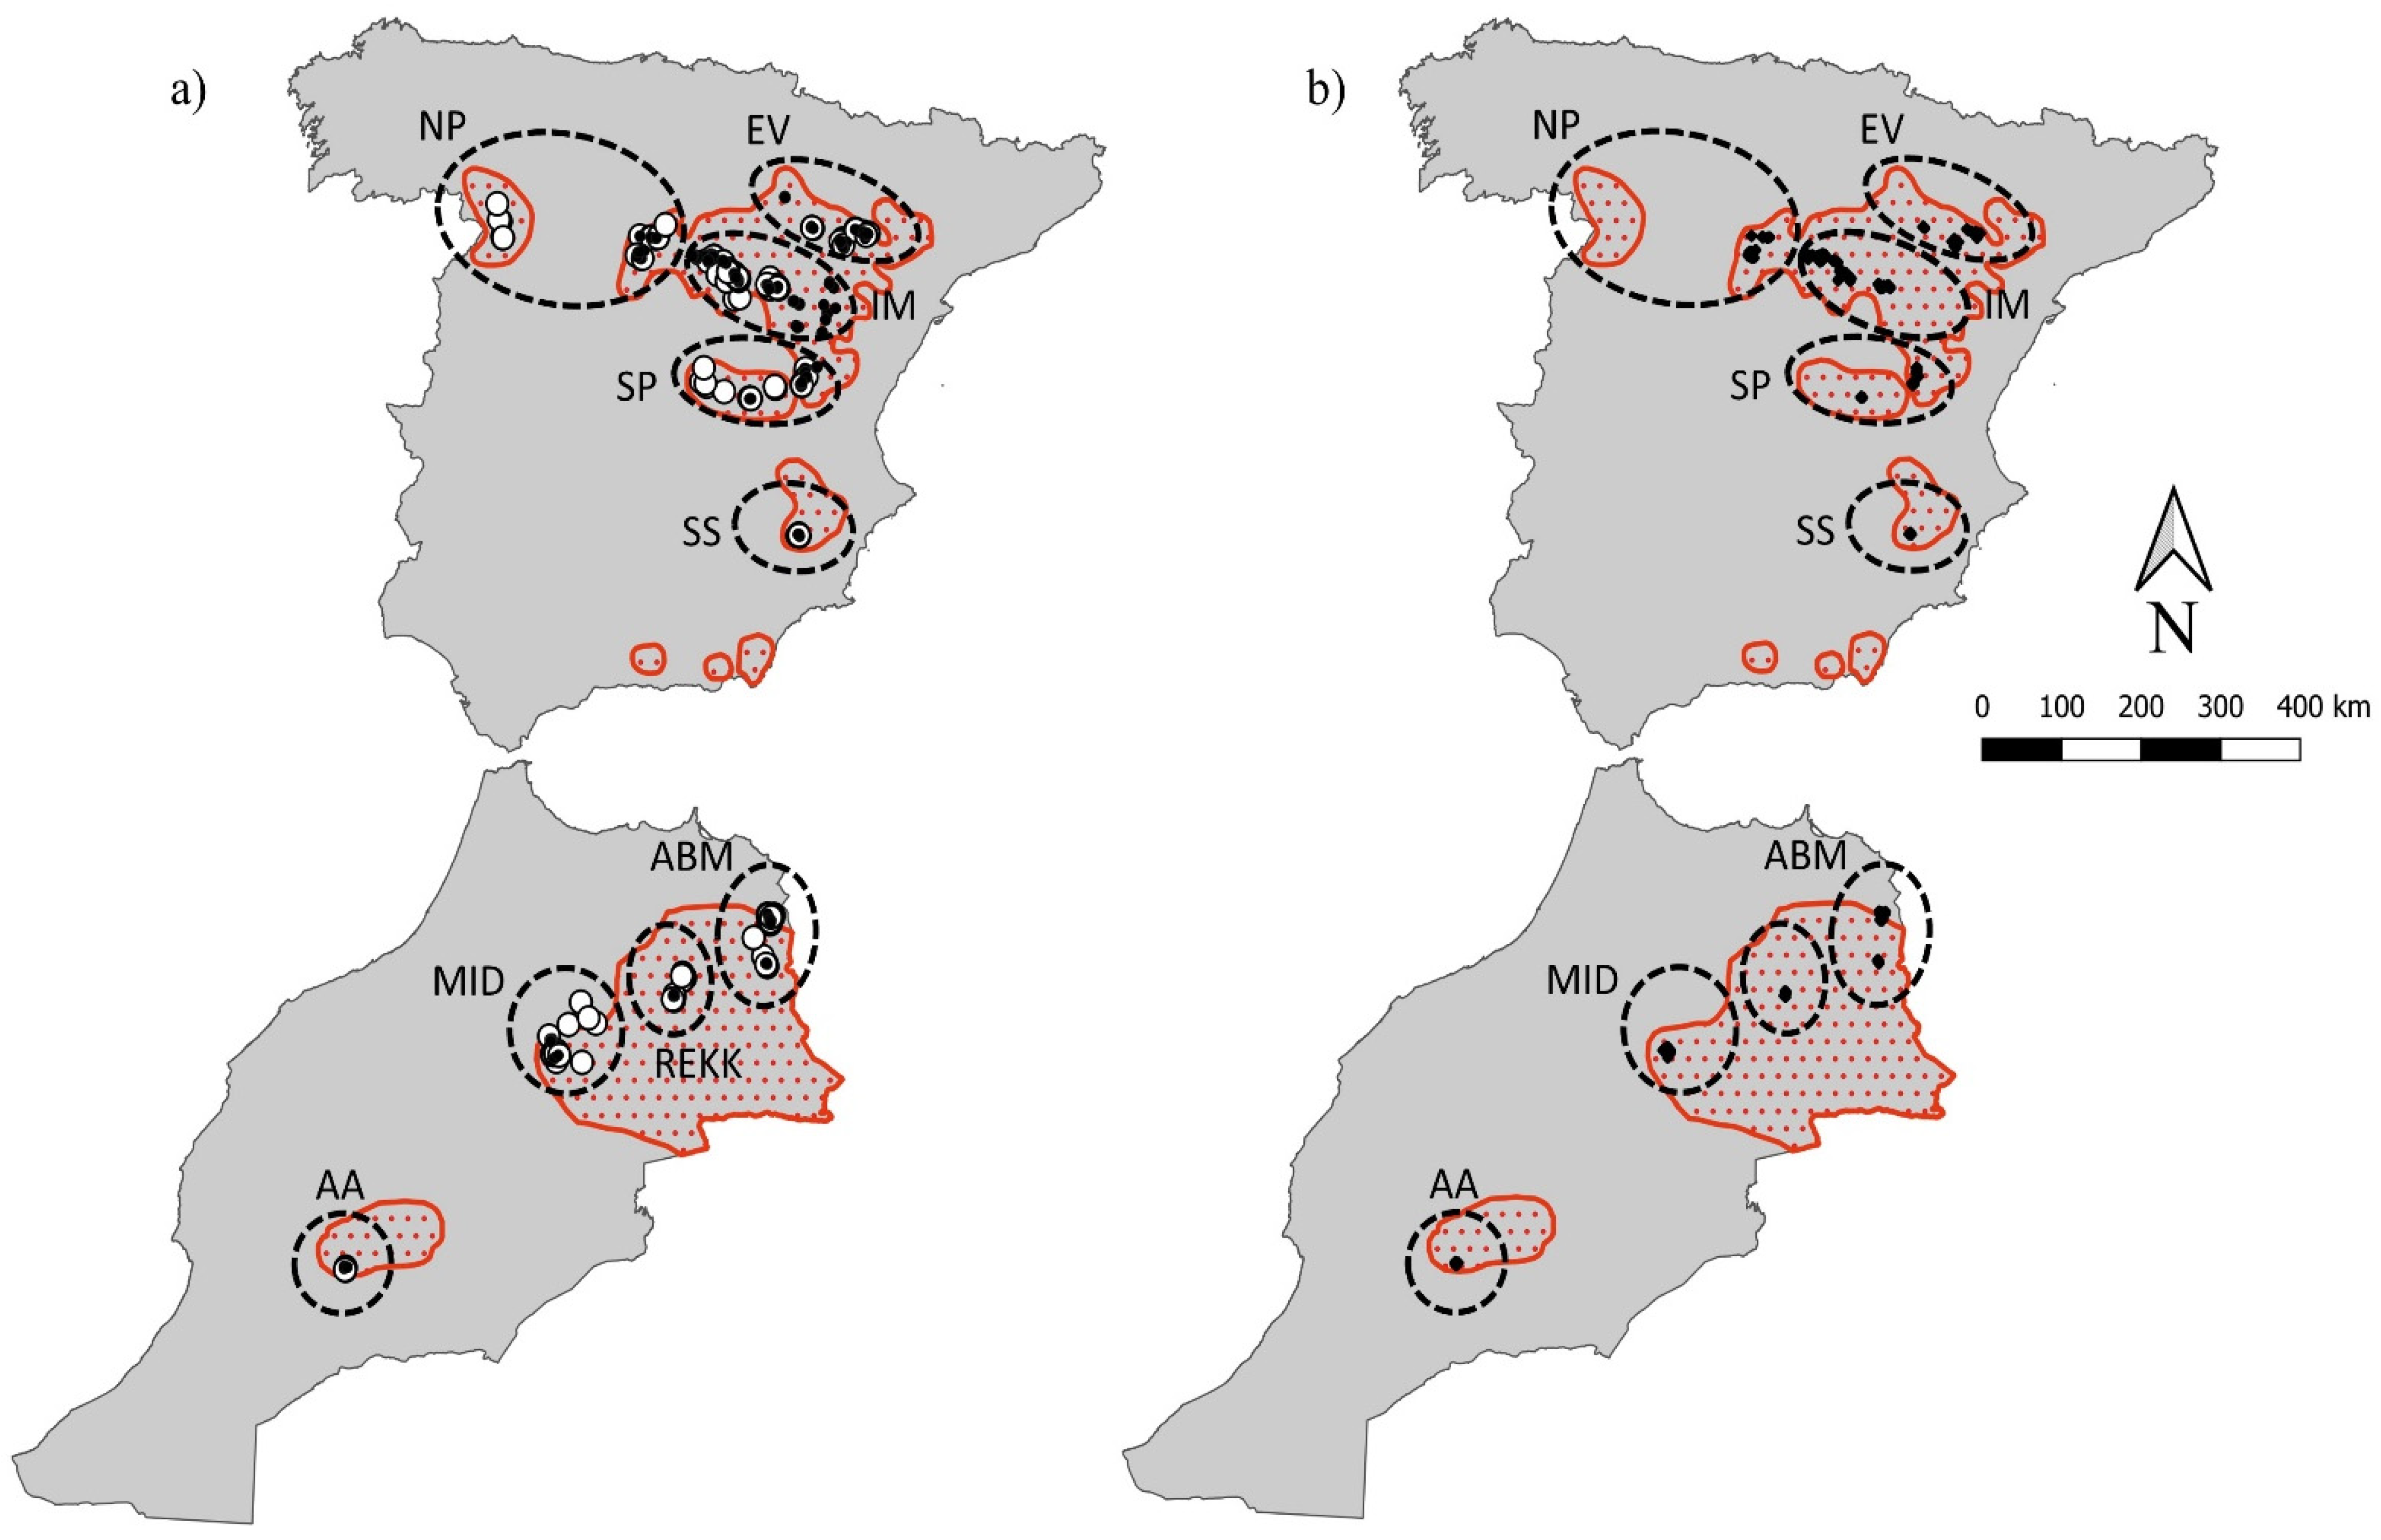
2.1. Study Area and Sampling

We collected blood samples from individuals in Spain and Morocco, covering most of the species’ distribution range [30,33] (Figure 1). The dominant landscape in both the Spanish and Moroccan steppe areas is a sparsely vegetated flat (slope between 10 and 15%) and high plateaux (around 1000 m.a.s.l.). In eastern Morocco, the vegetation is dominated by alfa grass Stipa tennacissima and Artemisia and Chenopodiacea spp. shrub, with some cereal crops cultivated along the Moulouya River and in the valley bottoms [44]. Climate is arid with an average rainfall of 210 mm per year. Traditional management of nomadic sheep herding was based on the long-distance transhumance practised during all the year, depending on the availability of pasture linked to the seasonal distribution of rain and water points. However, there has been a major shift to sedentarisation in recent decades, leading to rangelands’ degradation due to overgrazing and clearing of the best sites for cultivation to supplement animal feed [46]. Genetic composition of herds is also changing from the traditional Beni Guil breed, which is currently considered as under risk [47], to the introduced Ouled Djellal and their cross (the “Safra” population), which achieve higher productivity under good feeding conditions.
In Spain, the occupied altitudinal gradient is wider (from sea level to 1400 m.a.s.l.), and its habitat composition is more diverse in vegetation but requiring, in general, low-sized chamephyte thickets (20–40 cm) with a high percentage of bare soil [30]. The traditional management of Spanish steppe areas combines extensive sheep grazing on the low-scrub and pasture areas and extensive cereal cropping in the more productive pockets. Both the abandonment of traditional livestock use and agricultural intensification are the main threats to the species, although reforestation, mycorrhizal tree plantations and, more recently, the expansion of wind power plants are also negative changes.
In Spain, the five regions previously defined by [48] based on their ecological and geographic characteristics, were sampled: Northern Plateau (NP), Ebro Valley (EV), Iberian Mountains (IM), Southern Plateau (SP), and Southern Spain (SS) (Figure 1). In Morocco, the four regions described as suitable for the species in [44] were sampled: Aïn Bni Mathar (ABM) located in northeastern Morocco, the Rekkam (REKK) and Midelt-Missour regions (MID) at the central plateau, and the Anti-Atlas region (AA) located in southwestern Morocco (Figure 1). In all these regions, we captured birds at two time periods: in 2005–2006 (‘recent past period’ hereafter) and 2017–2020 (‘current period’ hereafter). This period spans over 5–7 Dupont’s lark generations (generation length of 2.5 years, [49]). A total of 752 Dupont’s lark males were sampled (n = 492 samples for the current period and n = 260 samples for the recent past period) (Table 1).
We used tape luring to trap individuals of Dupont´s larks with spring-traps baited with mealworms (Tenebrio molitor), which biases captures towards territorial males [40]. The few females (n = 26) and juvenile birds (n = 23) captured were not considered in our analyses, as the species is multibrooded (2–3 broods/ season; [30]) and shows limited dispersal [30,41], so we tried to avoid biases related to the inclusion of genetically related individuals. All individuals were ringed to avoid repetitions and were released at the site of capture. We collected blood samples from the jugular or brachial vein and stored them in 99% ethanol. UTM coordinates of every individual were recorded with a handheld GPS unit. All birds were captured and handled in accordance with both national and international guidelines and under permits from Moroccan and Spanish authorities. All procedures were approved by the Local Ethical Committee for Animal Experiments of the Universidad Autónoma de Madrid (CEI80-1468-A229).

2.2. Molecular Analysis

We extracted total DNA from blood samples using a standard ammonium acetate protocol [50], and diluted to a working concentration of 25 ng/µL. Twelve microsatellite loci isolated in Dupont´s larks (A112, B107, D115, D109, B9, C119, A7, C112, B10, D10, A113, D112; [51]) were amplified through a multiplex PCR using four dyes (FAM, PET, NED, VIC) in a total volume of 10 µL containing: 25–50 ng of template DNA, 1× QIAGEN Multiplex PCR Master Mix, and 0.1 μM of each primer (forward and reverse). The amplification conditions were as follows: initial denaturalization at 95 °C for 5 min, followed by 30 cycles of denaturation at 95 °C for 30 s, annealing at 60 °C for 90 s, and extension at 72 °C for 30 s, and final extension at 60 °C for 30 min. Amplified products were evaluated using 2 µL of each reaction on a 2% agarose gel, using 0.5× TBE buffer and ethidium bromide. Capillary electrophoresis of PCR products was performed with an ABI 3730 Sequencer by Unidad de Genómica, Universidad Complutense de Madrid, Spain (https://www.ucm.es/gyp/genomica). Electropherograms were scored using Geneious 10.2.3 (https://www.geneious.com). We included negative controls (i.e., ddH2O) in all runs. We re-amplified and re-scored 7% of the samples to confirm our genotypes and to estimate the genotyping error rate.

2.3. Genetic Diversity

We assessed potential genotypic errors, such as the presence of null alleles, short allele dominance, and stutter peaks with Micro-Checker software v.2.2.3 [52], using 1000 Monte Carlo simulations. The Hardy–Weinberg Equilibrium (HWE) across loci and regions and linkage disequilibrium (LD) across the entire population were checked using Markov Chain Monte Carlo simulations (dememorization of 10,000, 100 batches and 5000 iterations per batch) in Genepop on the web [53]. Significance of HWE and LD was checked after applying a Bonferroni correction for multiple comparisons.
We used the “diveRsity” v1.1.9 R package [54] to estimate genetic diversity indices in the two temporal samples of each region: number of alleles (A), allele frequencies observed, observed heterozygosity (Ho), unbiased expected heterozygosity (uHe), inbreeding coefficient (FIS), and allelic richness (AR) using a rarefaction approach [55] to account for the uneven sample size between regions. We used the smallest sample size in the dataset [56], thus allowing us to estimate AR with rarefaction to 10 gene copies. We calculated the 95% confidence intervals (CI) for FIS estimates using 999 bootstrap iterations. The effective population size (Ne) and 95% confidence intervals (CI) was estimated for each region using the two-sample temporal method in the program NeEstimator v2.1 [57]. We considered 6 generations between samples and used two based-F statistic estimators available in the Plan I sampling procedure (i.e., individuals sampled are not removed and can therefore contribute to the next generations; [58]): namely, FS [59] and FC [60].
We analysed differences in genetic diversity in each region between the two study periods using a paired t-test (paired by locus) and applying the Bonferroni correction adjustment. Since some of the regions considered are very large (see Figure 1), it would be possible that the results were affected by the different location of the samples collected in each region between both periods. To make more direct comparisons, we also tested temporal differences using a restricted set of samples (80% of the original samples) that overlapped geographically within each region (i.e., samples obtained at the same localities in the two study periods) (Figure 1). As the results obtained using the restricted dataset did not differ substantially from those obtained with the entire dataset (see Supplemental material, Tables S3 and S4), we carried out the following analysis using the full dataset.
In addition, the temporal stability of the allelic frequencies was quantified by computing Pearson’s correlation coefficients between the frequencies for each allele observed in the two temporal samples for each population [61,62] using the function “cor.test” in R. We also calculated rare alleles (frequency < 5%) and the number and percentage of alleles private to a single population (Ap = (nº private alleles/total nº of alleles) × 100) in earlier and recent samples and explored changes between the two sampling periods. We calculated the number of private and rare alleles lost over time as those that were private/rare in the recent past period but were not detected in the current period within a region (Ap_losses/RA_losses, respectively). Those private alleles which had lost their privacy over time were not considered as private allele losses. We also calculated the number of private allele gains (Ap_gains), defined by those alleles that were private in the current period and that were not found in the recent past in that region. Moreover, we also estimated the number of rare alleles gains (RA_gains) as the number of common alleles that became rare over time in a given region. Rare alleles detected for the first time (novel) in a region in the current period were not included in the rare allele gains count, as this is likely due to low sample size in the recent past period.
We also tested for a recent genetic bottleneck following the heterozygosity-excess method [63] and implemented in BOTTLENECK v1.2.02 [64]. This method compares expected heterozygosity (HE) in an empirical sample with the heterozygosity (HEq) that is expected at mutation-drift equilibrium, given the number of alleles observed in the sample. A sharp reduction in effective population size (Ne) may result in a transitory heterozygosity excess at selectively neutral loci. We used a mixed two-phase mutational model (TPM), which best fits the mutation processes of STRs [65]. It was run with a 70% stepwise mutation model (SSM) and 30% infinite allele model (IAM) and with a variance among multiple steps of 30. We used a one tailed Wilcoxon test to test for an excess of heterozygosity in each of the regions (samples from the two periods pooled). Significance was assessed after 10,000 iterations.

2.4. Genetic Structure of Populations

Genetic structure was quantified based on the genetic differentiation among regions in both study periods by calculating pairwise FST [66], GST [67], and D [68] implemented in GenAlex v6.5 [69,70]. We used 9999 permutations to test for significance of pairwise comparisons. We then examined changes in the amount of genetic differentiation between the two time periods for each region.
Furthermore, the stability of the population structure was also examined in each country by comparing the temporal variation within regions with the spatial variation among regions by applying a global analysis of molecular variance (AMOVA) as a weighted average over all 11 loci using Arlequin 3.5 [71]. The model partitioned variation first by regions (i.e., among-group level) and then by time periods within each region (i.e., among-populations within group level). Significance for grouping levels was estimated by 999 permutations. To determine whether isolation-by-distance patterns existed and how they varied over time, we tested for a significant relationship between genetic [72] and geographic distances (Euclidean distances) among pairs of individuals using Mantel tests (run in Genalex). For each country and time period, we performed a Mantel test using 9999 permutations to estimate statistical significance. We then compared Mantel’s r coefficient between the two time periods.

2.5. Gene Flow Estimation

The extent of gene flow among regions was estimated for both time periods using the Nm (effective number of migrants per generation) estimator adapted by [73] in “divMigrate” online (https://popgen.shinyapps.io/divMigrate-online) [74]. This method provides a relative migration network graph with relative values of gene flow (from 0 to 1) scaled to the largest magnitude estimated. We used 9999 bootstrap iterations to test the significance of the asymmetric gene flow. We also calculated the effective number of migrants per generation (Nem), according to the relationship Nem = 1 − FST/4FST [6], where Ne is the effective population size, m is the migration rate between regions, and FST is the pairwise genetic differentiation between regions.

3. Results

3.1. Genetic Diversity and Effective Population Size Estimates

All samples were successfully genotyped for the 12 polymorphic microsatellite loci. There was no evidence of allele dropout or genotyping errors due to stutter peaks. No loci deviated globally from HWE and no linkage disequilibrium were observed after Bonferroni’s correction (adjusted p-value < 0.00046). Two loci (B10 and D10) showed the presence of null alleles at some locations (frequency less than 0.25), but the test for HWE yielded similar results when dropping these two loci, and thus, both were used in further analyses. We decided to exclude locus C112 from further analyses because it consistently showed a low level of polymorphism.
We detected a total of 139 and 134 different alleles across all loci for the recent past and the current period, respectively (Table S1). The mean number of alleles per locus ranged from 5 to 22 in the recent past period and from 3 to 22 in the current one (Table S1). The mean level of genetic diversity across 11 microsatellite loci showed similar values in both countries, with moderate variations in Morocco among the recent past (mean Ho = 0.701; mean uHe = 0.759; mean AR = 4.544) and current samples (mean Ho = 0.658; mean uHe = 0.745; mean AR = 4.536). We detected the same pattern in Spain (mean Ho = 0.702; uHe = 0.744; AR = 4.605 for the recent past period, and mean Ho = 0.689; uHe = 0.734; AR = 4.567 for the current samples) (Table 1).
The contemporary estimates of Ne are summarized in Table 2. In general, the two methods revealed Ne values of the same order of magnitude and provided lower estimates than the population census size except in the case of AA (Morocco) and NP (Spain), where both estimates of Ne were clearly higher than the population census size reported previously (Table 2). We found the lowest Ne/NC ratio in Midelt (Ne/NC = 0.03) and the highest in the Anti-Atlas region (Ne/NC = 1.84).

3.2. Temporal Variation of Genetic Diversity

The temporal stability of genetic diversity of Dupont’s lark from Spain and Morocco was relatively high. We detected an overall loss of heterozygosity (Ho, uHe) over time in most regions, which was too weak to reach the significance level, although in the Midelt region was almost significant (paired t-test: p-value = 0.056). All other p-values in the paired t-test were higher than 0.118 (see Table S3). Moreover, there was no evidence for the reduction in allelic richness except for the Midelt region, which showed a significant decrease of AR over time (Table 1 and Table S3). For the nine regions and two time periods, six regions were found significantly deviated from the Hardy–Weinberg equilibrium, indicating a deficit of heterozygotes in those regions/periods (i.e., nonrandom mating that could favour inbreeding). However, no regions showed consistent deviations from HWE in both periods (Table 1). The average inbreeding coefficient (FIS) was low in most populations, but two regions (ABM in Morocco and NP in Spain) showed significant values (FIS > 0.1) during the recent past period, and in ABM (Morocco) and EV (Spain) during the current period (Table 1).
We found similar results in terms of overall stability with the restricted dataset (only samples that overlapped geographically among the two time periods; Table S4). MID (Morocco) was the single region that showed a significant reduction in AR (p = 0.001) and an almost significant variation in uHe (p = 0.05; Table S4), and REKK (Morocco) showed a significant decrease in Ho (p = 0.015). Although both regions (MID, REKK) also showed significant temporal changes in FIS (Table S4), the levels of inbreeding in each period were negligible in both cases (FIS ≤ 0.08) (Table S4).
Statistically significant heterozygosity excess suggests recent genetic bottlenecks in five out of nine regions analysed (Table 1). Most of the private alleles were found in low frequencies (<5%) in both countries (Table S2), and a remarkable percentage of these private variants were lost over time: 14 out of 21 (66%) in Morocco, and 5 out of 8 (62%) in Spain (Table 1 and Table S2). Midelt (MID, Morocco) and the Ebro Valley (EV, Spain) regions lost the highest percentage of private variants over time. Moreover, the private alleles lost in the EV are variants that have disappeared from the entire metapopulation (Table S2). We detected the appearance of new private alleles during the current period (Table S2) in some regions, especially in the ABM and IM regions. Percentages of rare alleles were similar in both countries during the recent past period, varying between zero at the smallest and most geographically isolated regions and 41.3% (Morocco) or 34.7% (Spain) in the regions with the largest population sizes (Table 1). Over time, the loss of rare alleles was greater in Morocco than in Spain (Table 1).
There were no substantial changes in allele frequencies over time. Allele frequencies in the two sampling periods were highly correlated for all regions (Table S2). The highest correlation value was obtained in the Spanish IM region (Pearson´s r = 0.977) and the lowest at the two regions with lowest population size: AA in Morocco (Pearson´s r = 0.787) and SS in Spain (Pearson´s r = 0.693) (Table S2).

3.3. Genetic Structure of Populations

Temporal changes in population genetic structure were supported by the variation in pairwise genetic differentiation (FST) over time in both countries. Overall, FST values of the current period in Morocco were higher than in the recent past period (Table 3), but we found no significant differentiation among temporal samples within any region (i.e., FST among periods within regions; see Table 3). Temporal changes were most notable in Spain, which showed a weak genetic structure in the recent past period (only two significant pairwise FST values) and where we found significant FST between all pairs of regions except SS–EV and SS–NP in the current period (Table 3). Other estimators (GST and D) provided a similar pattern of temporal change in genetic differentiation between regions (Tables S5 and S6). As in the case of Morocco, we did not detect a significant level of genetic differentiation among the two temporal samples within each region except in SP (Table 3). In general, FST values reflected higher differentiation among the regions of Morocco than among the regions of Spain, suggesting less gene exchange in the former than in the latter.
Results of the AMOVA revealed that differences between samples from different temporal collections did not explain a significant amount of the total genetic variation in Morocco (Table 4). The analysis assigned a significant percentage of variation to the spatial component (FCT = 0.035, p < 0.001), but not to the temporal one (FSC = 0.003, p > 0.05). Most of the variation was due to differences within regions (Table 4). In Spain, both temporal (FSC = 0.005, p = 0.040) and spatial (FCT = 0.005, p = 0.047) differences between samples explained a significant amount of the genetic variation. As it happened in Morocco, most of the genetic variation was because of differences within regions (Table 4).
The Mantel tests of IBD revealed that there was no significant correlation between genetic and geographic distances during the recent past period in Spain (r = −0.004; p = 0.476), while in Morocco, the correlation was positive and nearly significant (r = 0.069; p = 0.053. During the current period, we detected weak but statistically significant IBD pattern in both countries (Spain: r = 0.064; p = 0.002, Morocco: r = 0.203, p = 0.01). Therefore, Morocco showed a stronger pattern of IBD than Spain in the current period.

3.4. Direction of Gene Flow

The pattern of migration direction as calculated from divMigrate together with the estimated number of migrants per generation (Nem) showed intense gene flow in Spain between the IM region (central in the network) and the adjacent NP and SP regions during the recent past period (Figure 2, Table 5). Both NP and SP regions exported more genes to IM than they received, although we found no significant evidence of asymmetric gene flow between nodes. The SS and EV were the most distant regions as indicated by their lower relative rates of migration. The current temporal collection also showed increased genetic connectivity between IM and EV and decreased gene flow between IM and NP compared to the recent past period. The effective number of migrants (Nem) was, on average, lower during the current period than in the recent past one (Table 5). In Morocco, the migration rates suggested temporal stability and a lesser level of connectivity between regions than in Spain (Figure 2 and Table 5). ABM was a receiving population of migrants from other Moroccan regions (Figure 2) in both periods, while the relative migration network indicates that REKK was mainly a donor population. As in the case of Spain, gene exchange between the three main Moroccan regions changed over time and estimates of the effective number of migrants (Nem) indicates that the magnitude of gene flow has halved in the current period (see Table 5). There was also no statistical evidence of asymmetrical gene flow except in the case of the Anti-Atlas region (Figure 2), which in the recent past period showed asymmetric and northeast-biased gene flow.

4. Discussion

The main objective of this study was to explore the temporal stability of genetic diversity and structure among Dupont’s larks in the face of evident ongoing changes in demography (population decline) and range loss (fragmentation). To address this, we compared the genetic diversity and structure among contemporary samples with samples from the same sites 5–7 generations older.
From an overall genetic diversity perspective, our data suggest that there has been no substantial loss in genetic diversity at the species level over the last two decades, despite several studies having consistently reported a severe decrease in abundance, increased fragmentation, and evident range contraction [34,35,36]. Allelic richness in the current samples was almost as high as in the recent past samples. Averaging over all regions and loci, AR (rarefied to 10 gene copies) was only reduced from 4.54 in 2005–2006 to 4.53 in 2017–2020 (Morocco) and from 4.61 to 4.57 (Spain). This change represents an average loss of only 0.18% (Morocco) and 0.84% (Spain) of the allelic richness present in earlier samples (Table 1). Both countries also showed a small loss of heterozygosity (uHe), from a mean of 0.74 across Moroccan regions in the recent past period to 0.73 in the current samples (1.37%), and from 0.76 to 0.74 in Spain (1.91%).
However, we detected substantial variation among regions in the amount of allelic diversity lost over the last generations. The proportional loss of AR (across loci) in Morocco ranged from −0.097 (AR increased by 9.7% in AA region) to 0.08 (8% of AR lost in MID region). In Spain, AR increased in one region (SS; AR = −0.052) while in the others, between 1.6% and 3.0% of AR was lost (Table 1). Hence, not all regions showed reductions in genetic diversity, and some of them even showed patterns of increased allelic richness over time. In contrast, the loss of heterozygosity across generations was consistent in all regions within the range, with reductions ranging from 0.28% (AA) to 3.38% (MID) in Morocco and from 0.39% (IM) to 1.90% (NP) in Spain.
This different response of allelic richness and heterozygosity to demographic change is consistent with theoretical expectations that for neutral loci, allelic diversity should respond more strongly and rapidly than heterozygosity [78,79]. Heterozygosity largely depends on the presence of alleles at high frequency, whereas allelic richness does not consider abundances of the alleles but only their presence. Therefore, a rare allele being lost or gained over time probably will not affect heterozygosity much, but it does reduce/increase allelic richness [78]. In our study system, losses of alleles are likely due to genetic drift while gains are likely caused by the occurrence of immigration accompanied by gene flow among populations. The region of Midelt (Morocco) was the single one showing a significant reduction in genetic diversity, both in allelic richness and heterozygosity, either when we use the full dataset or only those geographically overlapping samples. This supports a reduction in population size in this region and a reduced connectivity with neighbour populations. Moreover, 19.6% of its total alleles have been lost in 5–7 generations (with 51% fewer samples collected in the current period compared to the recent past one). With similar or even greater reductions in sample size (53% REKK, 56% ABM), their neighbouring regions showed a smaller reduction in the number of alleles (12.5% and 13.7%, respectively). In addition, many of the alleles detected at high frequencies in earlier samples was detected at low frequencies later, and 71% of the singular (private) alleles were lost over time. Such loss of diversity observed in Midelt may likely be the result of the reduction in population size due human-induced landscape changes and exacerbated by climate change [80,81,82]. Traditionally, human settlements in Morocco were not common within Dupont´s lark habitats because of the nomadic lifestyle of shepherds in these areas. However, over the last decades, many of these pastoral nomads have permanently settled, with no regular or very limited (local) movement of animals [83]. This has led to an increase in the permanent presence of sheep herds, the introduction of new livestock species (cows), and increased sedentary agricultural pressures [83,84]. Today, these landscape impacts are evident in the region of Midelt, along with the species’ virtual disappearance from large areas, something that we have been able to verify during a recent survey carried out in 2020 (authors, unpublished data). All these human activities, along with the desertification process [83], may have led to marked degradation and fragmentation of the suitable habitat for the species in Morocco [35], which may have reduced population size and landscape connectivity. Specifically, in the region of Midelt (also in Rekkam), we already found in the past a greater presence of suboptimal habitats than in other regions, where the species still occurred but in lower densities than in optimal ones [44].
Although our results showed no significant drop of either allelic richness or expected heterozygosis in other regions, there is an evident loss of genetic variants and a significant reduction in singularity (private alleles) in several regions in both countries. With the necessary caution due to the fact that low-frequency variants are less well detected, we think that the loss of singularity and rare variants indicates a true genetic degradation, at least in some populations that have been sampled more intensively in the current period than in the recent past one, such as the Spanish EV region. Bottleneck testing supported this overall genetic erosion and demonstrated significant excess of heterozygosity in several Spanish and Moroccan regions. According to other results obtained from Midelt, the signature of the bottleneck in that region was the strongest. In our study system, however, genetic drift was insufficient to explain the results found. The severity of genetic erosion in declining populations is greater as populations are smaller due to genetic drift [6], but this is not the case here. The gains of alleles over time, the increase in AR in some regions, and the weak genetic structure and substantial gene flow observed was best explained by connectivity among populations. The small (although significant) genetic differentiation in each country suggests high levels of gene flow and connectivity among populations at a broad spatial scale, typical of one large interbreeding population, although not necessarily panmictic.
The results are, therefore, consistent with the hypothesis that connectivity might have rescued genetic diversity via immigration and gene flow [85,86]. However, there is evidence of increased differentiation and reduced gene flow over time in the network of populations. Based on the obtained FST values and isolation-by-distance (IBD) patterns, it can be concluded that the overall rate of differentiation among regions is low, but higher in the current samples than in the previous ones. An increasing signal of IBD over time in both countries suggests that the fragmentation is an ongoing process, probably related to the continuous habitat fragmentation and loss [34], that will increase in the coming years if the underlying causes are not reversed [43].
This is also supported by the temporal reduction in the estimates of immigration by gene flow, which is typical of species undergoing the process of recent fragmentation [87]. Previous research carried out 10 years ago suggests that Dupont’s lark populations were already showing the genetic consequences of recent fragmentation, which could be indicating a rapid decline of the populations [38]. Considering the effective number of migrants per generation (Nem) as the joint estimation of gene flow (m) and effective population size Ne [6], it is likely that the temporal drop observed in most regions could be reflecting not only changes in connectivity but also reductions in the effective size of the metapopulation. Unfortunately, we cannot provide accurate estimates of the temporal changes in Ne, but it is evident from our Ne estimates that most regions showed consistently much lower Ne than NC (Table 2). Assuming that contemporary estimates of Ne should be regarded with caution, and using published estimates of Ne/NC ratios obtained from other birds species [75,76,77], the data suggest that Midelt harbours a much smaller population than previously reported [44]. This could be due to population overestimation in the past, but it is more likely related to a recent decline in line with the steep population declines described for the species over the last decades [35] and the results of the bottleneck analysis. Interestingly, our data also showed that the southernmost Moroccan population (Anti-Atlas) displays Ne values that far exceed the census size (Table 2). This suggests either recent population growth in this region or an underestimation of the size of this small and poorly studied population in the past [44]. More detailed research is needed for an accurate delimitation of the occurrence of the species in this region, and to assess whether undiscovered populations exist elsewhere that were connected with the known population in the Anti-Atlas.
Connectivity loss has dramatic impacts on the rate of decline of genetic diversity and has been recognized as an important driver of extinction risk of populations [88,89]. Hence, maintaining dispersal and gene flow at a broad scale, favouring suitable habitat corridors, and avoiding fragmentation should be a priority in Dupont´s lark conservation [38]. In spite their ongoing regression, the current size of Dupont´s lark populations seems sufficient to maintain the overall genetic diversity through connectivity. However, current samples show clear signs of genetic erosion in some regions, suggesting that negative pressures may become more acute in the future. Currently, it appears that in both countries there is at least one refuge or source population (the central regions of Iberian mountains in Spain and Rekkam in Morocco) large enough to consistently provide immigrants to the others and, therefore, to maintain the viability of the overall metapopulation [90,91,92]. Conservation of these populations is crucial to the fate of the Dupont’s lark.
The incorporation of conservation genetics in international policy is imperative. There is an urgent need for developing means to monitor genetic diversity over time, to systematically resample sites, and to evaluate the human impacts on the genetic diversity of wild populations [13]. The data presented here can help to understand how future but predictable changes are likely to affect biodiversity at different levels of organisation (e.g., population size and genetic diversity) and how these levels interact. Moreover, these data can be used as a starting point to closely monitor the genetic parameters in this threatened lark species before genetic diversity loss becomes irreversible.

Supplementary Materials

The following supporting information can be downloaded at: https://www.mdpi.com/article/10.3390/d14121120/s1, Table S1: Number of alleles per locus in the recent past and current periods for Dupont´s lark; Table S2: Observed allele frequencies at each locus in each region at both periods of time (left = recent past; right = current). The number of individuals typed is shown in brackets. Person´s r correlation values (R) between allele frequencies in each period within each region are also indicated. Rare alleles are in bold and private alleles at each period are underlined; Table S3: Paired t-test results for temporal variation of genetic diversity (observed heterozygosity, Ho; unbiased expected heterozygosity, uHe; allelic richness, Ar; and inbreeding, FIS) of Dupont´s lark males at country (Morocco, Spain) and regional level. Significant values are represented with an asterisk; Table S4: Genetic diversity estimates for each of the nine Dupont´s lark regions considering the samples that overlapped geographically (sampled at the same localities) during the recent past (P) and the current (C) period. Sample size (N), observed heterozygosity (Ho), unbiased expected heterozygosity (uHe), allelic richness (AR), inbreeding coefficient (FIS). Paired t-test results for temporal variation of genetic diversity (observed heterozygosity, Ho; unbiased expected heterozygosity, uHe; allelic richness, AR and inbreeding, FIS) at regional level are also shown. Significant values are represented with an asterisk; Table S5: Matrix of pairwise (GST and D) values between regions in Morocco (Anti Atlas, AA; Ain Bni Mathar, ABM; Midelt, MID; Plateau of Rekkam, REKK). Values below diagonal correspond to comparisons in the recent past period and above diagonal in the current period. Values among sampling periods within regions are shown on the diagonal. Asterisks indicate statistically significant values; Table S6: Matrix of pairwise (GST and D) values between regions in Spain (Ebro Valley, EV; Iberian Mountains, IM; Northern Plateau, NP; Southern Plateau, SP and Southern Spain, SS). Values below diagonal correspond to comparisons in the recent past period and above diagonal in the current period. Values among sampling periods within regions are shown on the diagonal. Asterisks indicate statistically significant values.

Author Contributions

J.T.G., D.B.-d.l.R., J.T. and M.B.M. conceived the study. J.T., J.T.G. and G.M.L.-I. obtained funds for the research. All authors collected samples. D.B.-d.l.R., M.C.-R. and J.T.G. performed the lab work. D.B.-d.l.R. and J.T.G. analysed the genetic data. D.B.-d.l.R. and J.T.G. led the writing, and the rest of authors contributed to edit and review the manuscript. All authors have read and agreed to the published version of the manuscript.

Funding

This study was partially funded by the Spanish Agency for International Cooperation (AECI; C/3868/05), and the LIFE Ricoti (LIFE15-NAT-ES-000802) and LIFE Connect Ricoti (LIFE20-NAT-ES-000133) projects, supported by the European Commission. D.B.R. was supported by the FPI-UAM fellowship from the Universidad Autónoma de Madrid (UAM). The Instituto de Investigación en Recursos Cinegéticos, IREC (CSIC-UCLM-JCCM), provided vehicles for the Moroccan expeditions and the laboratory for DNA analysis. This is a contribution to the REMEDINAL-TE Network (ES2018-EMT-4338).

Institutional Review Board Statement

All procedures were approved by the Local Ethical Committee for Animal Experiments of the Universidad Autónoma de Madrid (CEI80-1468-A229).

Data Availability Statement

The data presented in this study are available upon request from the corresponding author. The data are not publicly available due to privacy restrictions as it is being used in further studies for upcoming publications.

Acknowledgments

We wish to thank the Spanish Ministry of Environment (MMA. “Situación y problemática de conservación de la Alondra de Dupont en España”), the Servicio de Vida Silvestre of Conselleria D’infraestructures, Territori i Medi Ambient (Generalitat Valenciana), and the Moroccan government (Le Secretaire General du Departement des Eaux et Forets) for fieldwork permits, and M. Radi and M. Znari (Université Cadi Ayyad, Marrakech), María J. de Lope and A. Qninba for help with arrangements in Morocco. We thank V. Garza, E. Ramírez, R. del Pozo, A. Ramírez, Colectivo Ornitológico Cigüena Negra, I. Abril-Colón, for their help during fieldtrips. This work was approved by the Local Ethical Committee for Animal Experiments of the Universidad Autónoma de Madrid (CEI80-1468-A229). All participants accepted to be part of the study. We also thank the Instituto de Investigación en Recursos Cinegéticos, IREC (CSIC-UCLM-JCCM), who provided vehicles for the Moroccan expeditions and the laboratory for DNA analysis. We will forever be grateful to Quico Suárez, who started and led this research and obtained the funds to collect the samples of the recent past period. This study was partially supported by the European Commission (Life Ricotí project LIFE15-NAT-ES-000802 and Life Connect Ricotí project LIFE20-NAT-ES-000133) and the BBVA Foundation (BBVA-Dron Ricotí project). This paper contributes to project REMEDINAL TE-CM (P2018/EMT4338).

Conflicts of Interest

The authors have no relevant financial or nonfinancial interests to disclose.

References

  1. Heath, D.D.; Busch, C.; Kelly, J.; Atagi, D.Y. Temporal Change in Genetic Structure and Effective Population Size in Steelhead Trout (Oncorhynchus Mykiss). Mol. Ecol. 2002, 11, 197–214. [Google Scholar] [CrossRef] [PubMed]
  2. Collier, N.; Gardner, M.; Adams, M.; McMahon, C.R.; Benkendorff, K.; Mackay, D.A. Contemporary Habitat Loss Reduces Genetic Diversity in an Ecologically Specialized Butterfly. J. Biogeogr. 2010, 37, 1277–1287. [Google Scholar] [CrossRef]
  3. Kleinhans, C.; Willows-Munro, S. Low Genetic Diversity and Shallow Population Structure in the Endangered Vulture, Gyps Coprotheres. Sci. Rep. 2019, 9, 5536. [Google Scholar] [CrossRef] [PubMed] [Green Version]
  4. Frankham, R.; Ballou, S.E.J.D.; Briscoe, D.A.; Ballou, J.D. Introduction to Conservation Genetics; Cambridge University Press: Cambridge, UK, 2002; ISBN 978-0-521-63985-9. [Google Scholar]
  5. Riva, F.; Fahrig, L. The Disproportionately High Value of Small Patches for Biodiversity Conservation. Conserv. Lett. 2022, 15, e12881. [Google Scholar] [CrossRef]
  6. Wright, S. Evolution in Mendelian Populations. Genetics 1931, 16, 97–159. [Google Scholar] [CrossRef]
  7. Allendorf, F.W.; Luikart, G.; Aitken, S.N. Conservation and the Genetics of Populations, 2nd ed.; John Wiley & Sons: Hoboken, NJ, USA, 2013; ISBN 978-0-470-67146-7. [Google Scholar]
  8. Fahrig, L. Effects of Habitat Fragmentation on Biodiversity. Annu. Rev. Ecol. Evol. Syst. 2003, 34, 487–515. [Google Scholar] [CrossRef] [Green Version]
  9. Haddad, N.M.; Brudvig, L.A.; Clobert, J.; Davies, K.F.; Gonzalez, A.; Holt, R.D.; Lovejoy, T.E.; Sexton, J.O.; Austin, M.P.; Collins, C.D.; et al. Habitat Fragmentation and Its Lasting Impact on Earth’s Ecosystems. Sci. Adv. 2015, 1, e1500052. [Google Scholar] [CrossRef] [Green Version]
  10. Harrisson, K.A.; Pavlova, A.; Amos, J.N.; Takeuchi, N.; Lill, A.; Radford, J.Q.; Sunnucks, P. Fine-Scale Effects of Habitat Loss and Fragmentation despite Large-Scale Gene Flow for Some Regionally Declining Woodland Bird Species. Landsc. Ecol. 2012, 27, 813–827. [Google Scholar] [CrossRef]
  11. Stevens, K.; Harrisson, K.A.; Hogan, F.E.; Cooke, R.; Clarke, R.H. Reduced Gene Flow in a Vulnerable Species Reflects Two Centuries of Habitat Loss and Fragmentation. Ecosphere 2018, 9, e02114. [Google Scholar] [CrossRef] [Green Version]
  12. Dale, S. Female-Biased Dispersal, Low Female Recruitment, Unpaired Males, and the Extinction of Small and Isolated Bird Populations. Oikos 2001, 92, 344–356. [Google Scholar] [CrossRef]
  13. Willi, Y.; Kristensen, T.N.; Sgrò, C.M.; Weeks, A.R.; Ørsted, M.; Hoffmann, A.A. Conservation Genetics as a Management Tool: The Five Best-Supported Paradigms to Assist the Management of Threatened Species. Proc. Natl. Acad. Sci. USA 2022, 119, e2105076119. [Google Scholar] [CrossRef] [PubMed]
  14. Duncan, C.; Böhm, M.; Turvey, S.T. Identifying the Possibilities and Pitfalls of Conducting IUCN Red List Assessments from Remotely Sensed Habitat Information Based on Insights from Poorly Known Cuban Mammals. Conserv. Biol. 2021, 35, 1598–1614. [Google Scholar] [CrossRef] [PubMed]
  15. Carroll, E.L.; Bruford, M.W.; DeWoody, J.A.; Leroy, G.; Strand, A.; Waits, L.; Wang, J. Genetic and Genomic Monitoring with Minimally Invasive Sampling Methods. Evol. Appl. 2018, 11, 1094–1119. [Google Scholar] [CrossRef] [PubMed] [Green Version]
  16. Bruford, M.W.; Davies, N.; Dulloo, M.E.; Faith, D.P.; Walters, M. (Eds.) Monitoring changes in genetic diversity. In The GEO Handbook on Biodiversity Observation Networks; Springer: Cham, Switzerland, 2017; pp. 107–128. [Google Scholar]
  17. Schlaepfer, D.R.; Braschler, B.; Rusterholz, H.-P.; Baur, B. Genetic Effects of Anthropogenic Habitat Fragmentation on Remnant Animal and Plant Populations: A Meta-Analysis. Ecosphere 2018, 9, e02488. [Google Scholar] [CrossRef]
  18. Schwartz, M.K.; Luikart, G.; Waples, R.S. Genetic Monitoring as a Promising Tool for Conservation and Management. Trends Ecol. Evol. 2007, 22, 25–33. [Google Scholar] [CrossRef] [Green Version]
  19. Ripperger, S.P.; Tschapka, M.; Kalko, E.K.V.; Rodriguez-Herrera, B.; Mayer, F. Life in a Mosaic Landscape: Anthropogenic Habitat Fragmentation Affects Genetic Population Structure in a Frugivorous Bat Species. Conserv. Genet. 2013, 14, 925–934. [Google Scholar] [CrossRef]
  20. Peeters, B.; Le Moullec, M.; Raeymaekers, J.A.M.; Marquez, J.F.; Røed, K.H.; Pedersen, Å.Ø.; Veiberg, V.; Loe, L.E.; Hansen, B.B. Sea Ice Loss Increases Genetic Isolation in a High Arctic Ungulate Metapopulation. Glob. Change Biol. 2020, 26, 2028–2041. [Google Scholar] [CrossRef] [Green Version]
  21. Barker, J.S.F. Effective Population Size of Natural Populations of Drosophila Buzzatii, with a Comparative Evaluation of Nine Methods of Estimation. Mol. Ecol. 2011, 20, 4452–4471. [Google Scholar] [CrossRef]
  22. Crispo, E.; Chapman, L.J. Temporal Variation in Population Genetic Structure of a Riverine African Cichlid Fish. J. Hered. 2010, 101, 97–106. [Google Scholar] [CrossRef] [Green Version]
  23. Charlier, J.; Laikre, L.; Ryman, N. Genetic Monitoring Reveals Temporal Stability over 30 Years in a Small, Lake-Resident Brown Trout Population. Heredity 2012, 109, 246–253. [Google Scholar] [CrossRef]
  24. Hagen, S.B.; Kopatz, A.; Aspi, J.; Kojola, I.; Eiken, H.G. Evidence of Rapid Change in Genetic Structure and Diversity during Range Expansion in a Recovering Large Terrestrial Carnivore. Proc. R. Soc. B Biol. Sci. 2015, 282, 20150092. [Google Scholar] [CrossRef] [PubMed] [Green Version]
  25. Kunz, F.; Kohnen, A.; Nopp-Mayr, U.; Coppes, J. Past, Present, Future: Tracking and Simulating Genetic Differentiation over Time in a Closed Metapopulation System. Conserv. Genet. 2021, 22, 355–368. [Google Scholar] [CrossRef]
  26. Gómez-Catasús, J.; Garza, V.; Morales, M.B.; Traba, J. Hierarchical Habitat-Use by an Endangered Steppe Bird in Fragmented Landscapes Is Associated with Large Connected Patches and High Food Availability. Sci. Rep. 2019, 9, 19010. [Google Scholar] [CrossRef] [PubMed] [Green Version]
  27. Reverter, M.; Gómez-Catasús, J.; Barrero, A.; Traba, J. Crops Modify Habitat Quality beyond Their Limits. Agric. Ecosyst. Environ. 2021, 319, 107542. [Google Scholar] [CrossRef]
  28. Traba, J.; Pérez Granados, C. Extensive Sheep Grazing Is Associated with Trends in Steppe Birds in Spain: Recommendations for the Common Agricultural Policy. PeerJ 2022, 10, e12870. [Google Scholar] [CrossRef]
  29. García, J.T.; Suárez, F.; Garza, V.; Calero-Riestra, M.; Hernández, J.; Pérez-Tris, J. Genetic and Phenotypic Variation among Geographically Isolated Populations of the Globally Threatened Dupont’s Lark Chersophilus Duponti. Mol. Phylogenet. Evol. 2008, 46, 237–251. [Google Scholar] [CrossRef]
  30. Suárez LA ALONDRA RICOTI (CHERSOPHILUS DUPONTI)|VV.AA.|Casa del Libro. Available online: https://www.casadellibro.com/libro-la-alondra-ricoti-chersophilus-duponti/9788480147736/1769714 (accessed on 22 November 2022).
  31. García-Antón, A.; Garza, V.; Hernández Justribó, J.; Traba, J. Factors Affecting Dupont´s Lark Distribution and Range Regression in Spain. PLoS ONE 2019, 14, e0211549. [Google Scholar] [CrossRef]
  32. Vögeli, M.; Serrano, D.; Pacios, F.; Tella, J.L. The Relative Importance of Patch Habitat Quality and Landscape Attributes on a Declining Steppe-Bird Metapopulation. Biol. Conserv. 2010, 143, 1057–1067. [Google Scholar] [CrossRef] [Green Version]
  33. Gómez-Catasús, J.; Barrero, A.; Garza, V.; Traba, J. Alondra ricotí—Chersophilus duponti. In Enciclopedia Virtual de los Vertebrados Españoles; Salvador, A., Morales, M.B., Eds.; Museo Nacional de Ciencias Naturales: Madrid, Spain, 2016; p. 25. Available online: http://www.vertebradosibericos.org/ (accessed on 21 November 2022).
  34. Gómez-Catasús, J.; Pérez-Granados, C.; Barrero, A.; Bota, G.; Giralt, D.; López-Iborra, G.M.; Serrano, D.; Traba, J. European Population Trends and Current Conservation Status of an Endangered Steppe-Bird Species: The Dupont’s Lark Chersophilus Duponti. PeerJ 2018, 6, e5627. [Google Scholar] [CrossRef] [Green Version]
  35. BirdLife International. Chersophilus Duponti. IUCN Red List Threat Spec 2020. Available online: https://www.birdlife.org (accessed on 15 November 2022).
  36. García-Antón, A.; Traba, J. Population Viability Analysis of the Endangered Dupont’s Lark Chersophilus Duponti in Spain. Sci. Rep. 2021, 11, 19947. [Google Scholar] [CrossRef]
  37. Tella, J.L.; Vögeli, M.; Serrano, D.; Carrete, M. Current Status of the Threatened Dupont’s Lark Chersophilus Duponti in Spain: Overestimation, Decline, and Extinction of Local Populations. Oryx 2005, 39, 90–94. [Google Scholar] [CrossRef] [Green Version]
  38. Méndez, M.; Tella, J.; Godoy, J. Restricted Gene Flow and Genetic Drift in Recently Fragmented Populations of an Endangered Steppe Bird. Biol. Conserv. 2011, 144, 2515–2622. [Google Scholar] [CrossRef] [Green Version]
  39. Pérez-Granados, C.; López-Iborra, G.M. Census of Breeding Birds and Population Trends of the Dupont’s Lark Chersophilus Duponti in Eastern Spain. Ardeola 2013, 60, 143–150. [Google Scholar] [CrossRef]
  40. Laiolo, P.; Vögeli, M.; Serrano, D.; Tella, J.L. Testing Acoustic versus Physical Marking: Two Complementary Methods for Individual-Based Monitoring of Elusive Species. J. Avian Biol. 2007, 38, 672–681. [Google Scholar] [CrossRef] [Green Version]
  41. Pérez-Granados, C.; Sáez-Gómez, P.; López-Iborra, G.M. Breeding Dispersal Movements of Dupont’s Lark Chersophilus Duponti in Fragmented Landscape. Bird Conserv. Int. 2022, 32, 53–63. [Google Scholar] [CrossRef]
  42. Pérez-Granados, C.; López-Iborra, G.M.; Seoane, J. A Multi-Scale Analysis of Habitat Selection in Peripheral Populations of the Endangered Dupont’s Lark Chersophilus Duponti. Bird Conserv. Int. 2017, 27, 398–413. [Google Scholar] [CrossRef]
  43. García-Antón, A.; Garza, V.; Traba, J. Connectivity in Spanish Metapopulation of Dupont’s Lark May Be Maintained by Dispersal over Medium-Distance Range and Stepping Stones. PeerJ 2021, 9, e11925. [Google Scholar] [CrossRef]
  44. García, J.T.; Suárez, F.; Garza, V.; Justribó, J.H.; Oñate, J.J.; Hervás, I.; Calero, M.; García de la Morena, E.L. Assessing the Distribution, Habitat, and Population Size of the Threatened Dupont’s Lark Chersophilus Duponti in Morocco: Lessons for Conservation. Oryx 2008, 42, 592. [Google Scholar] [CrossRef] [Green Version]
  45. Ceballos, G.; Ehrlich, P.R.; Dirzo, R. Biological Annihilation via the Ongoing Sixth Mass Extinction Signaled by Vertebrate Population Losses and Declines. Proc. Natl. Acad. Sci. USA 2017, 114, E6089–E6096. [Google Scholar] [CrossRef] [Green Version]
  46. Boughalmi, A.; Araba, A.; Yessef, M. Dynamics of Extensive Sheep Production Systems in Morocco. Livest. Res. Rural Dev. 2015, 27, 221. [Google Scholar]
  47. Gaouar, S.B.S.; Lafri, M.; Djaout, A.; El-Bouyahiaoui, R.; Bouri, A.; Bouchatal, A.; Maftah, A.; Ciani, E.; Da Silva, A.B. Genome-Wide Analysis Highlights Genetic Dilution in Algerian Sheep. Heredity 2017, 118, 293–301. [Google Scholar] [CrossRef] [PubMed]
  48. Laiolo, P.; Tella, J.L. Fate of Unproductive and Unattractive Habitats: Recent Changes in Iberian Steppes and Their Effects on Endangered Avifauna. Environ. Conserv. 2006, 33, 223–232. [Google Scholar] [CrossRef] [Green Version]
  49. Íñigo Íñigo, A.; Garza, V.; Tella, J.L.; Laiolo, P.; Suárez, F.; Barov, B. Action Plan for the Dupont’s Lark Chersophilus Duponti in the European Union; SEO/BirdLife/BirdLife International: Madrid, Spain, 2008. [Google Scholar]
  50. Strauss, W.M. Preparation of Genomic DNA from Mammalian Tissue. Curr. Protoc. Mol. Biol. 1998, 42, 2.2.1–2.2.3. [Google Scholar] [CrossRef] [PubMed]
  51. Méndez, M.; Prats, L.; Tella, J.L.; Godoy, J.A. Isolation and Characterization of Twenty Polymorphic Microsatellite Markers for the Endangered Dupont′s Lark (Chersophilus Duponti) and Cross-Amplification in Crested Lark (Galerida Cristata) and Thekla Lark (Galerida Theklae). Conserv. Genet. Resour. 2010, 3, 107–111. [Google Scholar] [CrossRef] [Green Version]
  52. Van Oosterhout, C.; Hutchinson, W.F.; Wills, D.P.M.; Shipley, P. Micro-Checker: Software for Identifying and Correcting Genotyping Errors in Microsatellite Data. Mol. Ecol. Notes 2004, 4, 535–538. [Google Scholar] [CrossRef]
  53. Raymond, M.; Rousset, F. An Exact Test for Population Differentiation. Evolution 1995, 49, 1280–1283. [Google Scholar] [CrossRef]
  54. Keenan, K.; McGinnity, P.; Cross, T.F.; Crozier, W.W.; Prodöhl, P.A. DiveRsity: An R Package for the Estimation and Exploration of Population Genetics Parameters and Their Associated Errors. Methods Ecol. Evol. 2013, 4, 782–788. [Google Scholar] [CrossRef] [Green Version]
  55. Kalinowski, S.T. Counting Alleles with Rarefaction: Private Alleles and Hierarchical Sampling Designs. Conserv. Genet. 2004, 5, 539–543. [Google Scholar] [CrossRef]
  56. Leberg, P.L. Estimating Allelic Richness: Effects of Sample Size and Bottlenecks. Mol. Ecol. 2002, 11, 2445–2449. [Google Scholar] [CrossRef]
  57. Do, C.; Waples, R.S.; Peel, D.; Macbeth, G.M.; Tillett, B.; Ovenden, J.; Do, C.; Waples, R.S.; Peel, D.; Macbeth, G.M.; et al. NeEstimator v2: Re-Implementation of Software for the Estimation of Contemporary Effective Population Size (Ne) from Genetic Data. Mol. Ecol. Resour. 2014, 14, 209–214. [Google Scholar] [CrossRef]
  58. Waples, R.S. A Generalized Approach for Estimating Effective Population Size from Temporal Changes in Allele Frequency. Genetics 1989, 121, 379–391. [Google Scholar] [CrossRef] [PubMed]
  59. Jorde, P.E.; Ryman, N. Unbiased Estimator for Genetic Drift and Effective Population Size. Genetics 2007, 177, 927–935. [Google Scholar] [CrossRef] [PubMed]
  60. Nei, M.; Tajima, F. Genetic Drift and Estimation of Effective Population Size. Genetics 1981, 98, 625–640. [Google Scholar] [CrossRef] [PubMed]
  61. Tessier, N.; Bernatchez, L. Stability of Population Structure and Genetic Diversity across Generations Assessed by Microsatellites among Sympatric Populations of Landlocked Atlantic Salmon (Salmo Salar L.). Mol. Ecol. 1999, 8, 169–179. [Google Scholar] [CrossRef] [Green Version]
  62. Ozerov, M.Y.; Veselov, A.E.; Lumme, J.; Primmer, C.R. Temporal Variation of Genetic Composition in Atlantic Salmon Populations from the Western White Sea Basin: Influence of Anthropogenic Factors? BMC Genet. 2013, 14, 88. [Google Scholar] [CrossRef] [Green Version]
  63. Luikart, G.; Cornuet, J.-M. Empirical Evaluation of a Test for Identifying Recently Bottlenecked Populations from Allele Frequency Data. Conserv. Biol. 1998, 12, 228–237. [Google Scholar] [CrossRef]
  64. Piry, S.; Luikart, G.; Cornuet, J.-M. Computer Note. BOTTLENECK: A Computer Program for Detecting Recent Reductions in the Effective Size Using Allele Frequency Data. J. Hered. 1999, 90, 502–503. [Google Scholar] [CrossRef]
  65. Di Rienzo, A.; Peterson, A.C.; Garza, J.C.; Valdes, A.M.; Slatkin, M.; Freimer, N.B. Mutational Processes of Simple-Sequence Repeat Loci in Human Populations. Proc. Natl. Acad. Sci. USA 1994, 91, 3166–3170. [Google Scholar] [CrossRef] [Green Version]
  66. Weir, B.S.; Cockerham, C.C. Estimating F-Statistics for the Analysis of Population Structure. Evolution 1984, 38, 1358–1370. [Google Scholar] [CrossRef]
  67. Nei Molecular Evolutionary Genetics. Available online: https://www.degruyter.com/document/doi/10.7312/nei-92038/html (accessed on 22 November 2022).
  68. Jost, L. G(ST) and Its Relatives Do Not Measure Differentiation. Mol. Ecol. 2008, 17, 4015–4026. [Google Scholar] [CrossRef]
  69. Peakall, R.; Smouse, P.E. Genalex 6: Genetic Analysis in Excel. Population Genetic Software for Teaching and Research. Mol. Ecol. Notes 2006, 6, 288–295. [Google Scholar] [CrossRef]
  70. Peakall, R.; Smouse, P.E. GenAlEx 6.5: Genetic Analysis in Excel. Population Genetic Software for Teaching and Research—An Update. Bioinformatics 2012, 28, 2537–2539. [Google Scholar] [CrossRef] [PubMed] [Green Version]
  71. Excoffier, L.; Lischer, H.E.L. Arlequin Suite Ver 3.5: A New Series of Programs to Perform Population Genetics Analyses under Linux and Windows. Mol. Ecol. Resour. 2010, 10, 564–567. [Google Scholar] [CrossRef] [PubMed]
  72. Smouse, P.E.; Peakall, R. Spatial Autocorrelation Analysis of Individual Multiallele and Multilocus Genetic Structure. Heredity 1999, 82, 561–573. [Google Scholar] [CrossRef] [PubMed] [Green Version]
  73. Alcala, N.; Goudet, J.; Vuilleumier, S. On the Transition of Genetic Differentiation from Isolation to Panmixia: What We Can Learn from GST and D. Theor. Popul. Biol. 2014, 93, 75–84. [Google Scholar] [CrossRef]
  74. Sundqvist, L.; Keenan, K.; Zackrisson, M.; Prodöhl, P.; Kleinhans, D. Directional Genetic Differentiation and Relative Migration. Ecol. Evol. 2016, 6, 3461–3475. [Google Scholar] [CrossRef] [Green Version]
  75. Hoban, S.; Bruford, M.; D’Urban Jackson, J.; Lopes-Fernandes, M.; Heuertz, M.; Hohenlohe, P.A.; Paz-Vinas, I.; Sjögren-Gulve, P.; Segelbacher, G.; Vernesi, C.; et al. Genetic Diversity Targets and Indicators in the CBD Post-2020 Global Biodiversity Framework Must Be Improved. Biol. Conserv. 2020, 248, 108654. [Google Scholar] [CrossRef]
  76. Frankham, R. Effective Population Size/Adult Population Size Ratios in Wildlife: A Review. Genet. Res. 1995, 66, 95–107. [Google Scholar] [CrossRef]
  77. Palstra, F.P.; Ruzzante, D.E. Genetic Estimates of Contemporary Effective Population Size: What Can They Tell Us about the Importance of Genetic Stochasticity for Wild Population Persistence? Mol. Ecol. 2008, 17, 3428–3447. [Google Scholar] [CrossRef]
  78. Nei, M.; Maruyama, T.; Chakraborty, R. The Bottleneck Effect and Genetic Variability in Populations. Evolution 1975, 29, 1–10. [Google Scholar] [CrossRef]
  79. Barrandeguy, M.E.; García, M.V. The Sensitiveness of Expected Heterozygosity and Allelic Richness Estimates for Analyzing Population Genetic Diversity; IntechOpen: London, UK, 2021; ISBN 978-1-83881-097-9. [Google Scholar]
  80. Schilling, J.; Freier, K.P.; Hertig, E.; Scheffran, J. Climate Change, Vulnerability and Adaptation in North Africa with Focus on Morocco. Agric. Ecosyst. Environ. 2012, 156, 12–26. [Google Scholar] [CrossRef]
  81. del Barrio, G.; Sanjuan, M.; Hirche, A.; Yassin, M.; Ruiz, A.; Ouessar, M.; Martinez Valderrama, J.; Essifi, B.; Puigdefabregas, J. Land Degradation States and Trends in the Northwestern Maghreb Drylands, 1998–2008. Remote Sens. 2016, 8, 603. [Google Scholar] [CrossRef] [Green Version]
  82. Barakat, A.; Ouargaf, Z.; Khellouk, R.; El Jazouli, A.; Touhami, F. Land Use/Land Cover Change and Environmental Impact Assessment in Béni-Mellal District (Morocco) Using Remote Sensing and GIS. Earth Syst. Environ. 2019, 3, 113–125. [Google Scholar] [CrossRef]
  83. Heshmati, G.A.; Squires, V.R. (Eds.) Combating Desertification in Asia, Africa and the Middle East: Proven Practices; Springer: Dordrecht, The Netherlands, 2013; ISBN 978-94-007-6651-8. [Google Scholar]
  84. Le Cuziat, J.L.; Vidal, E.; Roche, P.; Lacroix, F. Human Acitivities Affect the Potential Distribution of the Houbara Bustard. Ardeola 2005, 52, 21–30. [Google Scholar]
  85. Frankham, R. Genetic Rescue of Small Inbred Populations: Meta-Analysis Reveals Large and Consistent Benefits of Gene Flow. Mol. Ecol. 2015, 24, 2610–2618. [Google Scholar] [CrossRef]
  86. Jangjoo, M.; Matter, S.F.; Roland, J.; Keyghobadi, N. Connectivity Rescues Genetic Diversity after a Demographic Bottleneck in a Butterfly Population Network. Proc. Natl. Acad. Sci. USA 2016, 113, 10914–10919. [Google Scholar] [CrossRef] [Green Version]
  87. Couvet, D. Deleterious Effects of Restricted Gene Flow in Fragmented Populations. Conserv. Biol. 2002, 16, 369–376. [Google Scholar] [CrossRef]
  88. Keller, I.; Largiadèr, C.R. Recent Habitat Fragmentation Caused by Major Roads Leads to Reduction of Gene Flow and Loss of Genetic Variability in Ground Beetles. Proc. R. Soc. B Biol. Sci. 2003, 270, 417–423. [Google Scholar] [CrossRef] [Green Version]
  89. Chan, J.; Pan, B.; Geng, D.; Zhang, Q.; Zhang, S.; Guo, J.; Xu, Q. Genetic Diversity and Population Structure Analysis of Three Deep-Sea Amphipod Species from Geographically Isolated Hadal Trenches in the Pacific Ocean. Biochem. Genet. 2020, 58, 157–170. [Google Scholar] [CrossRef]
  90. Smith, M.M.; Gilbert, J.H.; Olson, E.R.; Scribner, K.T.; Van Deelen, T.R.; Van Stappen, J.F.; Williams, B.W.; Woodford, J.E.; Pauli, J.N. A Recovery Network Leads to the Natural Recolonization of an Archipelago and a Potential Trailing Edge Refuge. Ecol. Appl. 2021, 31, e02416. [Google Scholar] [CrossRef]
  91. Boudjemadi, K.; Lecomte, J.; Clobert, J. Influence of Connectivity on Demography and Dispersal in Two Contrasting Habitats: An Experimental Approach. J. Anim. Ecol. 1999, 68, 1207–1224. [Google Scholar] [CrossRef]
  92. Hastings, A.; Botsford, L.W. Persistence of Spatial Populations Depends on Returning Home. Proc. Natl. Acad. Sci. USA 2006, 103, 6067–6072. [Google Scholar] [CrossRef] [PubMed]
Figure 1. Limits of the nine regions (dashed lines) considered in this study and sampling locations of Dupont´s lark males (dots) within the Dupont´s lark distribution (red dotted polygons, obtained from [35,43]): (a) White dots represent samples collected during 2005–2006 (recent past period) and black dots represent samples collected during 2017–2020 (current period); (b) restricted set of samples (black dots) that overlapped geographically between the two study periods. Spanish regions: Northern Plateau (NP), Ebro Valley (EV), Iberian Mountains (IM), Southern Plateau (SP), and Southern Spain (SS). Moroccan regions: Aïn Bni Mathar (ABM), Plateau of Rekkam (REKK), Midelt-Missour (MID), and Anti-Atlas (AA).
Diversity 14 01120 g001
Figure 2. Relative migration networks for Dupont’s lark generated using divMigrate and based on the Nm estimator. Filter threshold was set to 0. Networks were calculated between Spanish regions in the recent past (a) and the current (b) sampling periods, and between Moroccan regions in the recent past (c) and the current (d) periods. Thicker arrows and proximity of nodes indicate stronger gene flow. Statistically significant asymmetric gene flows are indicated with an asterisk. Region codes as in Figure 1.
Diversity 14 01120 g002
Table 1. Genetic diversity estimates for each of the nine Dupont´s lark regions during the recent past (P) and the current (C) sampling periods, showing sample size (N), number of alleles (A), observed heterozygosity (Ho), unbiased expected heterozygosity (uHe), allelic richness (AR), p values for Hardy–Weinberg equilibrium (HWE) tests (significant values after Bonferroni correction in bold), inbreeding coefficient (FIS), number and percentage (in brackets) of private alleles (Ap), and number and percentage of rare alleles (RA). Significant FIS values are represented with an asterisk. The number of private and rare alleles lost (Ap_losses/RA_losses) and gained (Ap_gains/ RA_gains) is indicated (see main text for further details of calculations). Of the Ap_losses count, those that are completely lost at the metapopulation level in the current period are in brackets. Of the Ap_gains count, those already detected in any other region in the recent past period are in brackets. The population size (census size) of each region is also indicated. The result of the bottleneck analysis, using the two-phase mutation model (TMP) and the Wilcoxon 1-tailed test for heterozygosity excess is also shown (significant results in bold). Region codes as in Figure 1. See Supplementary material, Table S2 for further information about allele frequencies.
MoroccoSpain
AAABMMIDREKKEVIMNPSPSS
NP7574319175725269
C5252195327228745
AP4310997727495758164
C4394786387113768754
HoP0.6620.6870.7210.7370.7010.7210.6330.710.747
C0.6180.6760.6930.6460.6310.7160.6460.6710.782
uHeP0.6990.7920.7850.7630.7330.7510.7350.7510.75
C0.6970.7790.7590.7460.7210.7480.7210.7380.741
ARP3.5635.0754.954.5884.5474.7544.5154.5464.666
C3.9095.0854.5534.5964.4724.6524.3814.4214.909
HWEP0.6210.0000.0000.0010.0090.0310.0000.0780.736
C0.3400.0140.0090.0790.0000.0000.0010.0000.955
FISP−0.0160.123 *0.068 *−0.010.0090.0360.127 *0.038−0.058
C0.020.124 *0.070.080.108 *0.036 *0.0750.09 *−0.191
Ap aP012 (11)7 (7.2)2 (2.8)3 (4.1)3 (3.2)01 (1.2)1 (1.6)
C1 (2.3)7 (7.4)1 (1.3)2 (3.2)1 (1.1)8 (7.2)1 (1.3)1 (1.1)0
  Ap_losses 07 (5)5(2)2 (2)3 (3)1 (1)00 (0)1 (0)
  Ap_gains 13 (1)0 (0)2 (2)1 (0)6 (3)0 (0)1 (0)0
RA bP045(41.3)34 (35)10 (13.9)14 (18.9)33 (34.7)19 (25.3)24 (29.6)0
C029 (30.8)28 (35.9)028 (32.2)53 (46.9)22 (28.9)34 (39.1)0
  RA_losses 023 17 6 5 2 6 3 0
  RA_gains 04 14 084890
Census size c162107965533426629261221630067
He ≠ Heq (prob)0.2320.0270.0010.0020.1030.0340.0510.0020.087
a Alleles found only in a single region within each period. b Alleles with frequency lower than 5% in that region. c Population (census) size of each region, based on the estimated minimum number of males [30,44].
Table 2. Summary of effective population size (Ne) estimates and 95% CI (parametric bootstrap) for each region using the temporal methods (FS, FC) implemented in NeEstimator v2.1 [57]. The census size (NC) and the Ne of each region assuming different Ne/NC ratios observed in scientific reviews is also shown.
FS aFC b
NCNe *Ne NeLow 95%–High 95%NeLow 95%–High 95%
Morocco
AA162681629823–∞687411–1033
ABM1079453108410126–∞274186–378
MID6553275265519074–2147202136–281
REKK3426143934381–∞∞–∞
Spain
EV6292646327887–∞157105–219
IM26121097261765279–∞15921074–2210
NP2169122486110–∞457298–651
SP3001263012361–27811878–167
SS6728711026–∞5838–82
a [59]. b [60]. * Estimate of Ne assuming an Ne/NC ratio of 0.42 [75]. Estimate of Ne assuming an Ne/NC ratio of 0.1 [76,77].
Table 3. Matrix of pairwise FST values between regions in Morocco (Anti Atlas, AA; Ain Bni Mathar, ABM; Midelt, MID; and Plateau of Rekkam, REKK) and Spain (Ebro Valley, EV; Iberian Mountains, IM; Northern Plateau, NP; Southern Plateau, SP; and Southern Spain, SS). FST values below diagonal correspond to comparisons in the recent past period and above diagonal in the current period. FST values among sampling periods within regions are shown on the diagonal. Asterisks indicate statistically significant values.
MoroccoSpain
AAABMMIDREKK EVIMNPSPSS
AA0.0460.075 *0.085 *0.098 *EV0.0140.007 *0.014 *0.012 *0.042
ABM0.052 *0.0100.022 *0.023IM0.014 *0.0030.010 *0.008 *0.040 *
MID0.050 *0.010 *0.0130.029NP0.0160.0070.0100.013 *0.040
REKK0.058 *0.0110.016*0.020SP0.020 *0.0090.0140.012 *0.048 *
SS0.0250.0180.0190.0160.051
Table 4. Global hierarchical analysis of molecular variance (AMOVA) testing for temporal variation in the population structure of Dupont’s lark in Morocco and Spain.
Source of VariationdfVariance Components% of Variationp-Value
Morocco
Among groups (regions)30.143.50<0.001
Among temporal samples 40.010.310.18
Within regions1783.9596.19<0.001
Spain
Among groups (regions)40.020.530.047
Among temporal samples50.020.470.040
Within regions5563.7098.99<0.001
Table 5. Estimated number of migrants per generation (Nem) between pairs of regions in Morocco and Spain during the recent past (below diagonal) and the current (above diagonal) periods.
CountryRegionAAABMMIDREKK
MoroccoAA 3.12.72.3
ABM4.5 11.310.6
MID4.824.6 8.5
REKK4.123.315.2
EVIMNPSPSS
SpainEV 38.217.020.55.7
IM18.1 25.633.16.1
NP15.234.0 18.56.0
SP12.126.718.1 5.0
SS9.713.913.215.0
Publisher’s Note: MDPI stays neutral with regard to jurisdictional claims in published maps and institutional affiliations.

