Article

Trophic Structure of Macrozoobenthos in Permanent Streams in the Eastern Balkans

by
Biljana Rimcheska
1,*,
Yanka Vidinova
1 and
Emilia Varadinova
1,2
1
Department of Aquatic Ecosystems, Institute of Biodiversity and Ecosystem Research, Bulgarian Academy of Sciences, 2 Gagarin St. 1113/1 Tsar Osvoboditel Blvd., 1000 Sofia, Bulgaria
2
Department Geography, Ecology and Environmental Protection, Faculty of Mathematics and Natural Sciences, South-West University “Neofit Rilski”, 66 Ivan Michailov St., 2700 Blagoevgrad, Bulgaria
*
Author to whom correspondence should be addressed.
Diversity 2022, 14(12), 1121; https://doi.org/10.3390/d14121121
Submission received: 3 October 2022 / Revised: 9 December 2022 / Accepted: 11 December 2022 / Published: 15 December 2022
(This article belongs to the Special Issue Ecology, Diversity and Evolution of Aquatic Macroinvertebrates)

Abstract

:
The present study provides data on the trophic structure of the benthic macroinvertebrate communities in mountainous and semi-mountainous small streams and river sections belonging to Mesta, Struma and Vardar River catchments from 7th Ecoregion. The benthic macroinvertebrates were assigned to seven Functional Feeding Groups. We analyzed their trophic structure and the dynamics in different seasons. The level of similarity between the sampling localities was analyzed in the context of both the river typology and the water catchment. A comparison between the two trophic indices was conducted in order to analyze the advantages of the application of these indices for assessment of the ecological status at the studied sites. We found that the trophic structure of the benthic macroinvertebrate communities in ostensibly typologically similar river sections differs at the undisturbed vs the impacted sampled sites. To a large extent, these differences were also determined by the presence of anthropogenic influence that resulted in the predominance of deposit feeders amplifying on higher disturbance on some of the studied rivers. Long-term negative pressure has led to changes in microhabitats that affect the structure and functioning of the aquatic ecosystem by transformation of the trophic structure of the macrozoobenthos.

1. Introduction

Macroinvertebrates play a fundamental role in the transfer of energy in freshwater ecosystems, as they have a considerable influence on the processing of autochthonous organic matter [1,2]. Therefore, feeding groups have been introduced in hydrobiology to characterize the macrozoobenthos morpho-behavior capacity and to indicate the location and role of aquatic invertebrates for the functioning of the lotic ecosystems [3,4,5]. The composition of functional feeding groups (FFGs) reflects the stream ecosystem conditions through adaptation of communities to stream habitat and food resources, including those associated with check-dam construction [6] or inorganic drainages [7]. As ecosystem function can be altered by a diversity of environmental factors, changes in FFG composition could also be used as an indicator of ecosystem health and recovery after disturbances [8]. Looking at the functional or trophic structure of communities is an essential step to better understanding the effects of environmental perturbations on biodiversity and ecosystem functions [9].
Studies have shown that the trophic structure of macrozoobenthos changes along the river continuum as a result of both natural factors [10] and anthropogenic impact [7,11,12,13]. This demonstrates the trophic structure of macroinvertebrates’ communities as an indicator for the conditions of the aquatic environment as well [14].
The achievements of German hydrobiologists [15], which tested different functional groups’ based indices, supported the strong indicative abilities of the trophic structure of the macrozoobenthos in lotic ecosystems. In addition, the Index of Trophic Completeness (ITC) bioassessment approach [16] had good reliability and confirmed degradation in benthic communities caused by different types of anthropogenic impact such as alluvial gold mining [17].
Nowadays, most European freshwater ecosystems are impacted by human activities that lead to losses of taxa and/or discontinuities in the distribution of the benthic fauna [18]. Moreover, the local site-specific conditions contribute to the shaping of the FFG composition [19]. A great deal of research on FFGs from various watercourses across Europe has been conducted [19,20,21] but still there is a little information on the species and trophic structure of macroinvertebrates in the small mountainous and semi-mountainous rivers and streams from Eastern Balkans (e.g., [22,23,24,25]).
In Bulgaria, the trophic structure of the freshwater macrozoobenthos was studied for the first time in detail for Mesta River covering a 30-year period [26] regarding its designation as a site for a long-term research network within the European Network LTER. The Rhithron/Potamon Feeding Type Index (RETI-PETI) and its adapted version used in Bulgaria [27,28], is among the most frequently applied trophic indices in hydrobiological/benthological studies in the country. Later, the bio-indicative potential of the trophic structure and the application of different trophic indices in ecological status assessment of the benthic communities were analyzed on the example of representative lotic water bodies from the upper, middle and lower streams stretches of the Mesta, Tundzha, Veleka, Vit and Maritsa Rivers [29,30,31].
This study is the first to present data on the FFG of the macrozoobenthos in river stretches flowing through the territory of North Macedonia. In addition, it is an attempt to analyze the trophic structure of bottom macroinvertebrate communities in the poorly studied small, mostly 1st and 2nd order mountainous and semi-mountainous permanent river sections from the Eastern Balkans Ecoregion [32]—Mesta, Struma and Vardar River catchments.
The previous performed work on the same small rivers was focused on the ecological status assessment and general degradation due to hydromorphological stress, habitat loss or organic pollution [33]. In order to analyze how these processes reflect on the FFG of the studied bottom communities, our main objectives were: (i) to characterize the trophic structure of benthic macroinvertebrate communities in small 1st and 2nd order permanent streams in the studied area; (ii) to track the changes of the basic trophic groups in different periods and to determine the degree of similarity between the sampling sites, river basins and river types; (iii) to assess the ecological status and communities’ functional completeness based on trophic indices.

2. Materials and Methods

2.1. Study Site

Field studies were conducted in the permanent small streams and rivers in the cross-border territory of Bulgaria (abbreviation code-BG) and North Macedonia (abbreviation code-MKD) belonging to the Mesta (MW—1_ to 6_BG sites), Struma (SW—7_ to 22_BG; 1_ to 9_MKD sites) and Vardar (VW—10_ to 16_MKD sites) River watersheds (Figure 1).
Sampling sites were selected from river sections that correspond to semi-mountainous (R5 river type) and mountainous (R3 river type) stretches in the 7th Ecoregion, in accordance with the current river typology of Bulgaria [34,35]. These river types are characteristic of the three studied river watersheds. The R3 group included 14 sites (>800 m a.s.l.) and the R5 group consisted of 24 sites (<800 m a.s.l.). The sites were mainly on 1st and 2nd order streams. For some of the sampling sites there was evidence of hydromorphological degradation and/or organic pollution, but for the rest of the sites no substantial sources of disturbances were noted [36]. Additionally, the degree of shading, assessed as a percentage of shade of the mirror from riparian vegetation, was determined in situ (Table A1). More details for site codes, altitude, stream order, stream type, predominant substrate, main pressures, the level of disturbances and anthropogenic alterations, were described within previous publications [33,36].

2.2. Benthic Macroinvertebrates Data Set

Within the study, a total of 38 sites were selected (Figure 1), with a total of 69 macroinvertebrates samples being processed (collected in autumn—October 2017 and in spring—April/May 2018). During the study periods, we observed in situ that the autumn sampling period had a lower flow regime compared to the following spring. The sampling was performed with a standard hydrobiological hand net (mesh size 500 μm) applying kick and sweep multihabitat procedure [37,38]. Laboratory treatment included the elutriation of the inorganic substrata and separation of the macroinvertebrates into benthic groups. All specimens were preserved in 70% ethanol identified to the possible lowest taxonomic level (Table 1). Concerning the established taxa within the separate river watersheds, all the details including the taxa list and FFG association are presented by Rimcheska and Vidinova [36].

2.3. Data Analysis

A total of 280 taxa identified for the entire survey [36] were used for the analysis. The classification of the taxa to FFGs and the calculation of the Rhithron Feeding Type Index (RETI) were performed in accordance with the conducted survey [33]. All the benthic macroinvertebrate taxa were assigned to the following FFGs: shredders (SH), scrapers (SC), collectors (CL), filter feeders (FL), deposit feeders (DF), predators (PR) and parasites (PA) [36]. The Index of Trophic Completeness (ITC) methodology was implemented [16]. Further, using the Macrozoobenthos Trophic Structure (MaTroS 2.0) specialized program, the ITC index was calculated (http://macro.nemi-ekb.ru/index.php?r=site/login&lang=en, accessed on 30 April 2020).

2.4. Statistical Analysis

The descriptive statistics function of MS Excel 2010 (min, max, median, range and interquartile ranges) was used for the analyses of the total abundance of taxa and trophic groups of R3 and R5 river types and indices values. A cluster analysis of the data set, based on the abundance of the trophic groups, was performed to assess the similarity level between the studied sites (Euclidean distance, Ward’s method) with Statistica7 software. The Pearson correlation was used to determine the relation between the abundance of each trophic group and the degree of shading per site, and season and further multiple linear regression was applied through program package StatSoft (STATISTICA 7.0).
Using statistical software PRIMER-E v.6 [39], the multidimensional scaling (MDS) plot analysis was conducted to determine the level of similarity (Bray-Curtis) in the macrozoobenthos trophic structure between the R3 and R5 type sites with regard to the altitude and both river basin and river type affiliation.

3. Results

3.1. Trophic Structure of the Macroinvertebrates Communities, Dynamics of Abundance and Changes of the FFGs

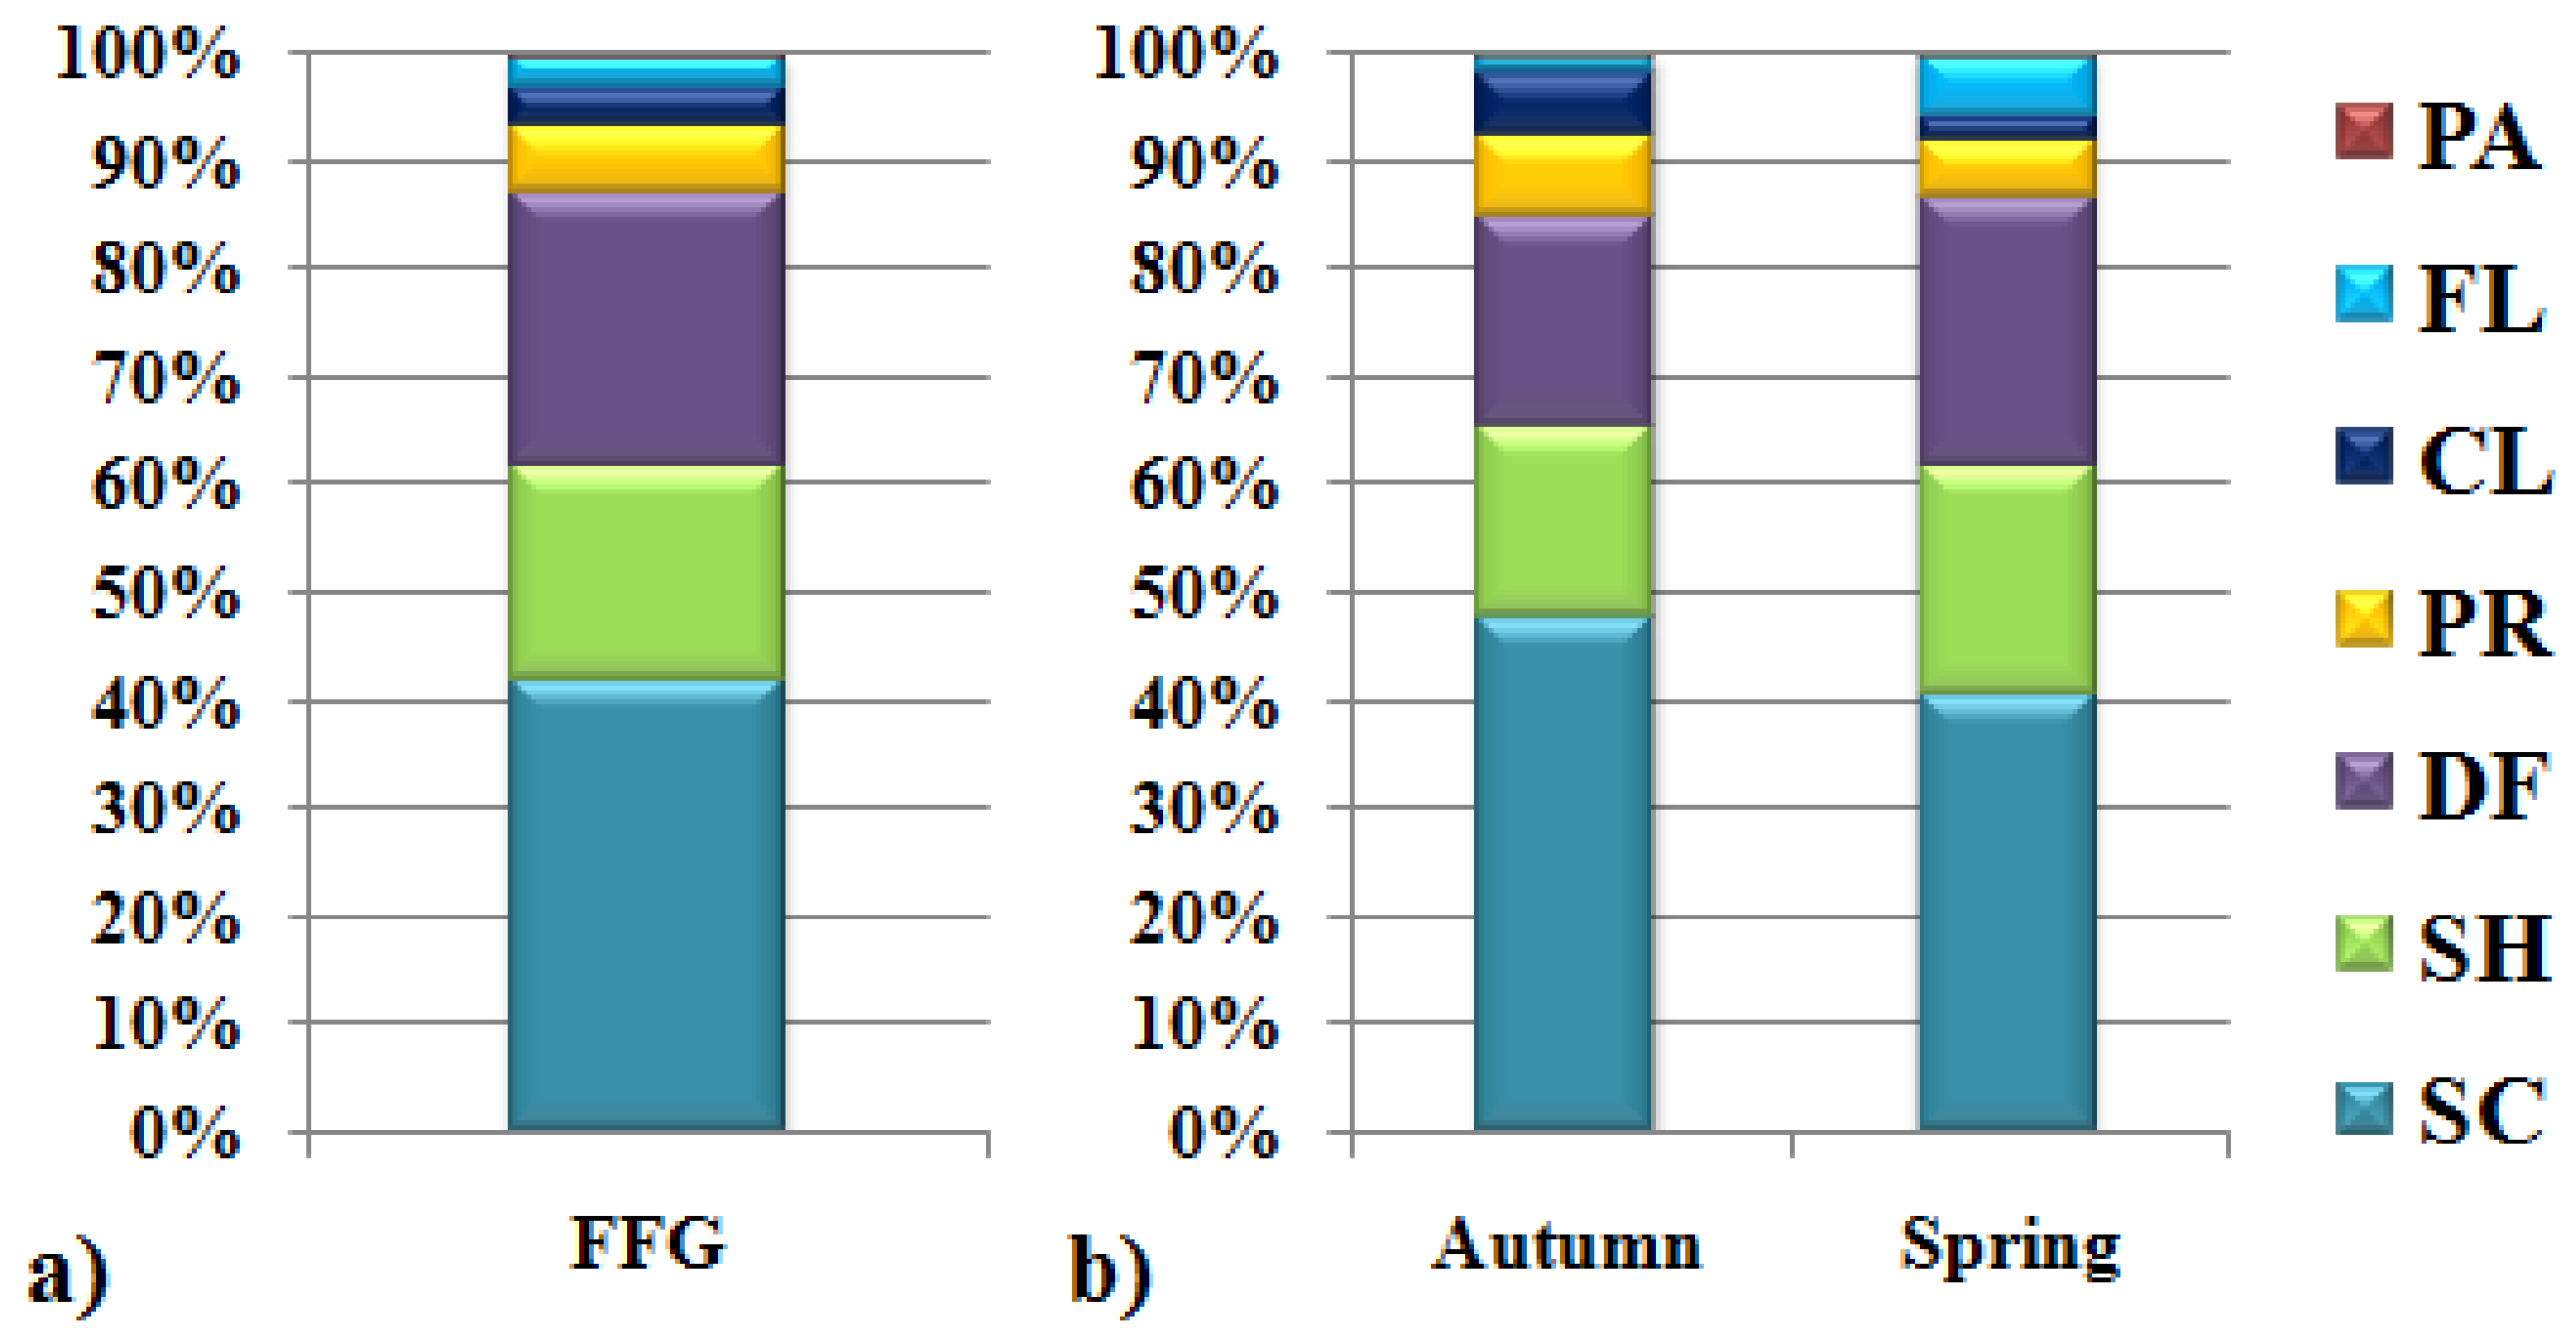
Based on the summarized relative abundance of FFGs (in %), the studied macroinvertebrate communities were dominated by SC, DF and SH (42%, 26% and 20%, resp., Figure 2a). PR, CL and FL were represented with much smaller partitions (6%, 4% and 3% resp.), while the share of the PA was practically neglected (0.07%). The percentage share of SC, PR and CL were higher in autumn, while those of SH, DF and FL were higher during spring (Figure 2b). Furthermore, in both seasons, stenobiont species belonging to the groups of SH (e.g., Plecoptera) and SC (e.g., Ephemeroptera genera-Rhithrogena and Epeorus) were numerically dominant.
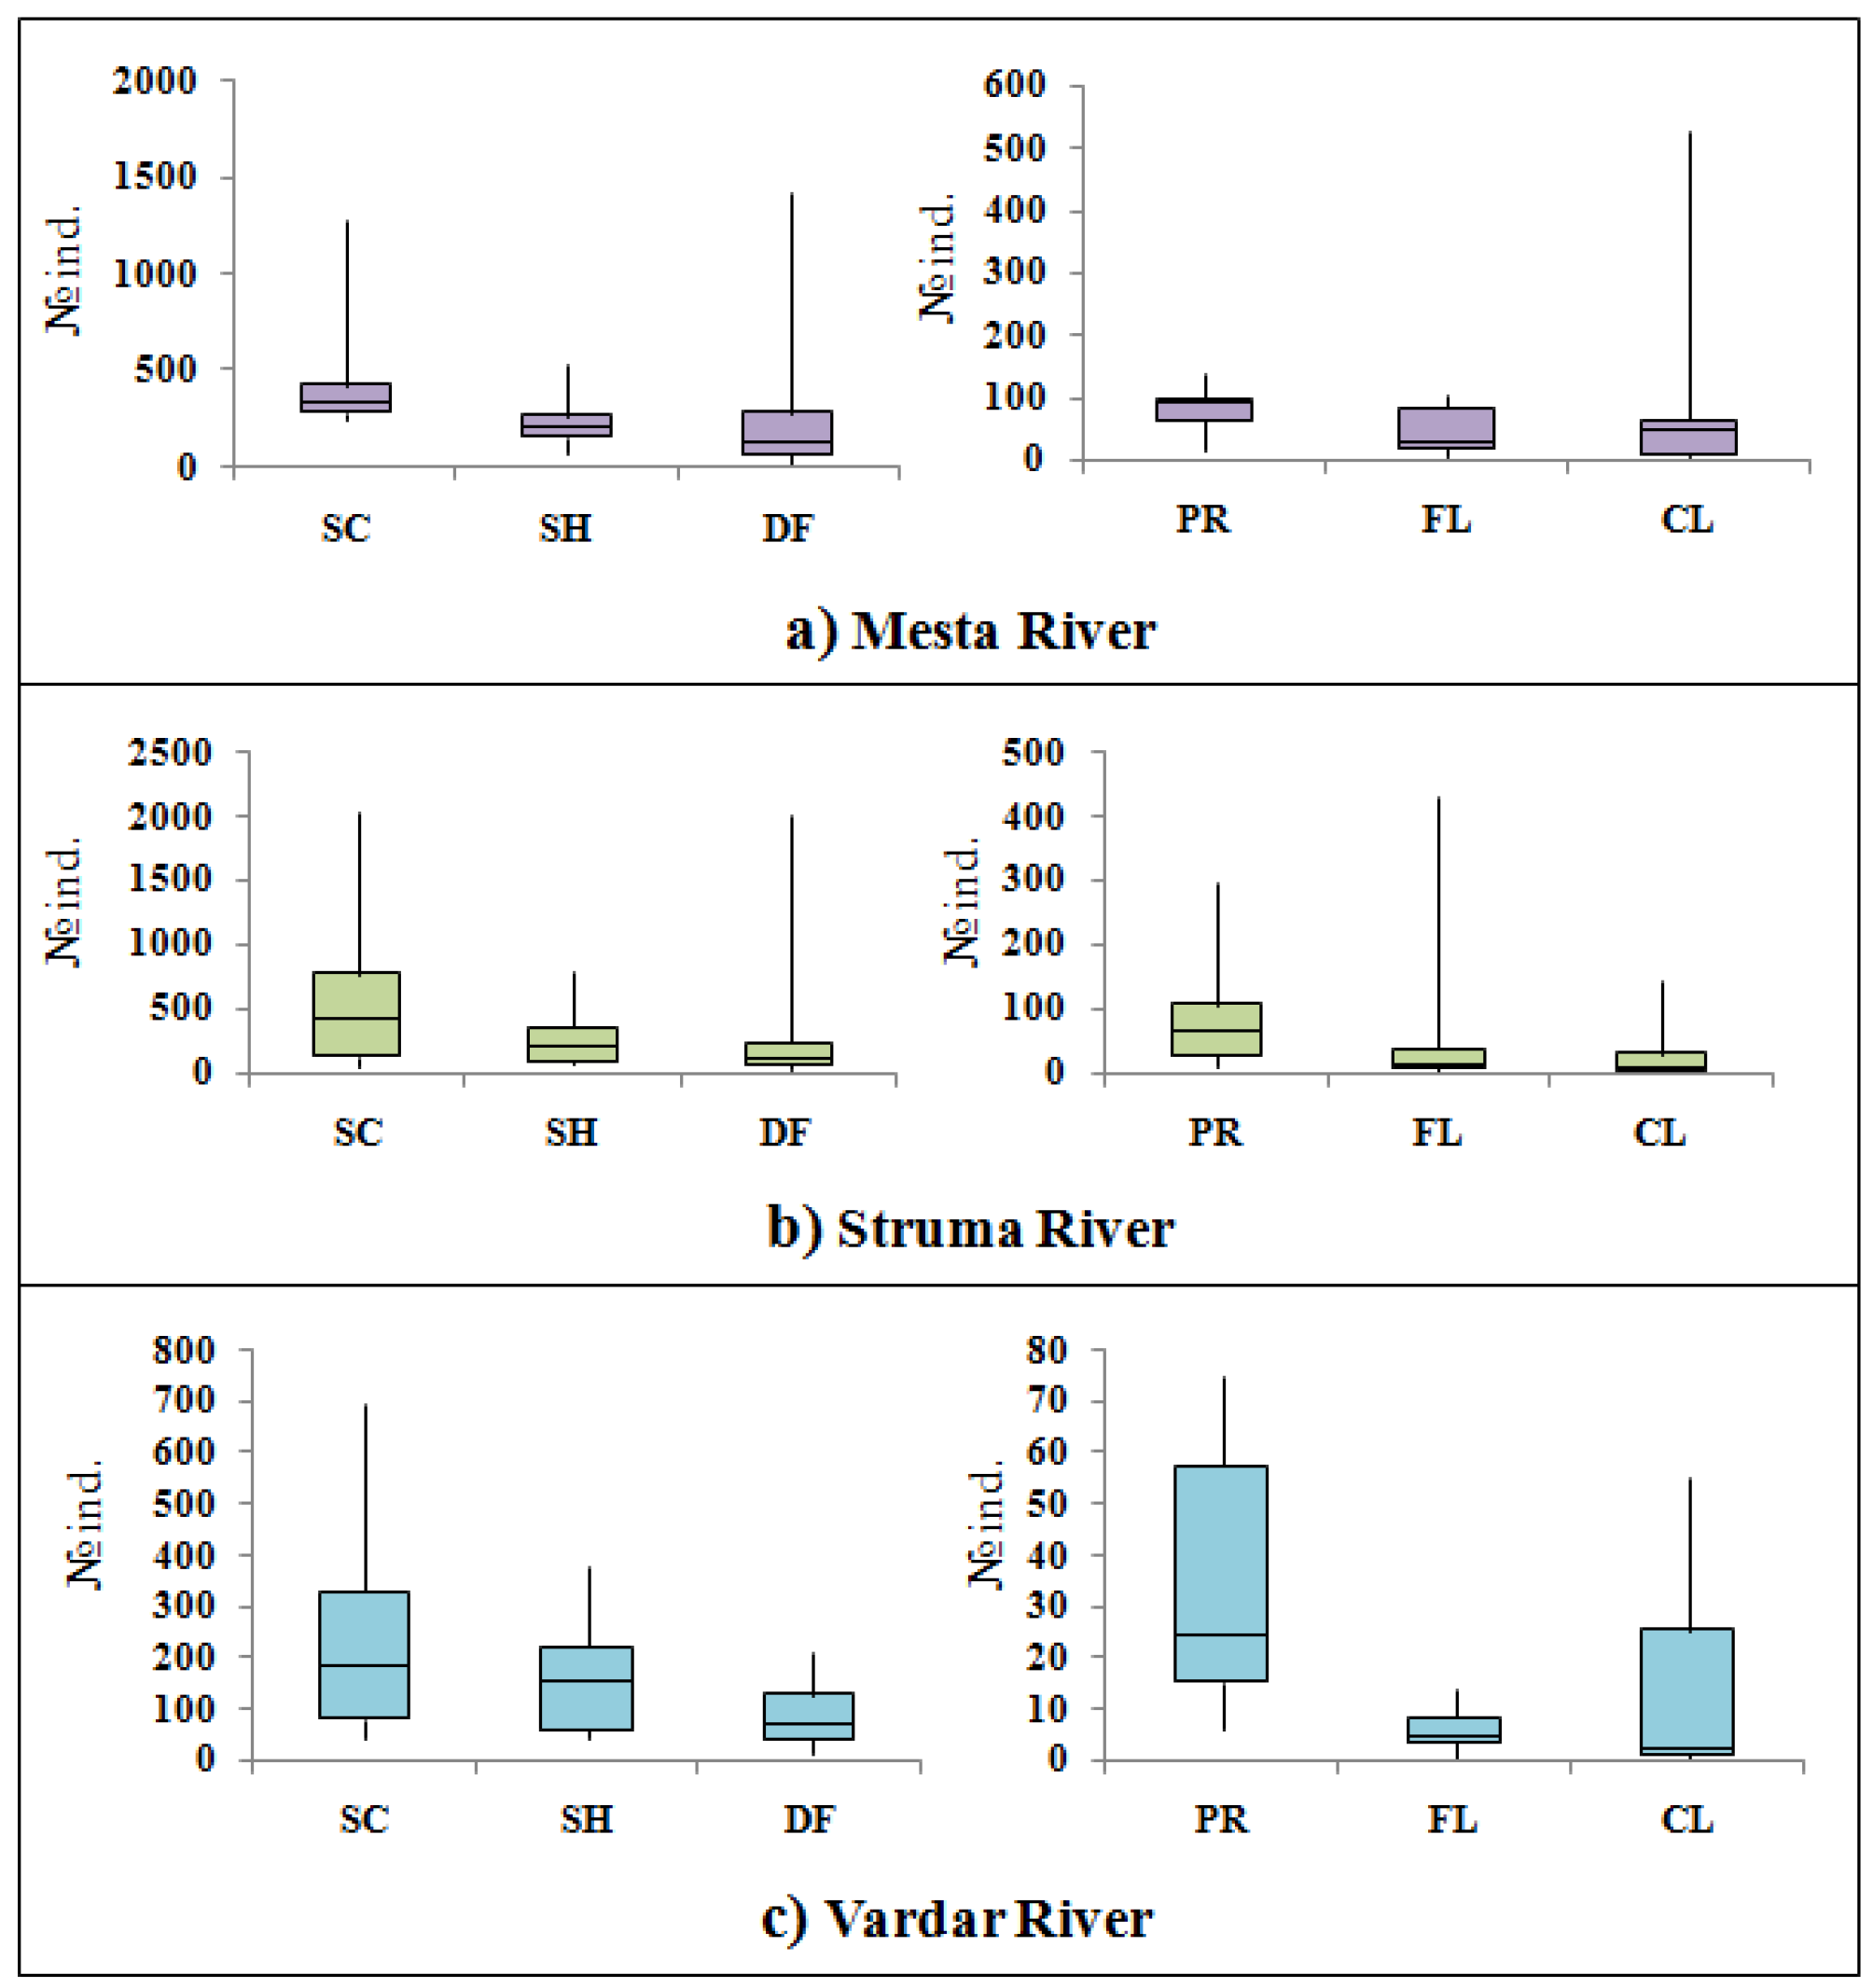
Analyzing the studied watersheds, we established different proportions within the trophic groups and in each river basin (Figure 3). With the exception of CL, the closest structure with regard to the share of the FFG was observed between the Mesta and Struma Rivers (Figure 3a,b). In Vardar River basin, the sampled sites showed narrow ranges of the variation of CL and PR (Figure 3c). Compared to other watersheds, DF in Vardar have the smallest share, FL in Struma were with highest numbers, while SH occurred in roughly equal share in all studied river watersheds (Figure 3).
Regarding the proportions of each trophic group, different patterns were registered between the two river types in the studied watersheds, and slight changes were evident (Figure 4). Primarily, compared with R3 sites, the R5 sites had higher FFG abundance and lower median range variability. Herein, SH (in R3 river type), SC and DF (in R5 river type) were the most abundant trophic groups. Thus, in R3 sites, the SC were more abundant during the spring, while in the autumn they were decreasing in numbers. The abundance of SC in R5 sites was lower in the spring season (Figure 4b). We found more pronounced dynamics of the SH, which were the most numerous for R3 sites during autumn (Figure 4a).
The group of FL at R3 sites was more abundant in spring, while in autumn it had a negligible share regarding the total number of specimens. Downstream, at R5 sites, FL prevailed also in spring (Figure 4b) but with a less pronounced change in the abundance. Concerning the dynamics of DF, we found them with more indicative numbers for R5 sites in both seasons. Simultaneously, DF represent the most abundant group at this river type during spring. In R3 sites, DF did not show a different seasonal pattern (Figure 4a). CL characterized the R5 sites with the highest abundance in autumn, while at R3 sites their numbers were much lower, especially in spring. The PR had similar patterns for both river types having higher numbers in autumn and reduced in spring (Figure 4).
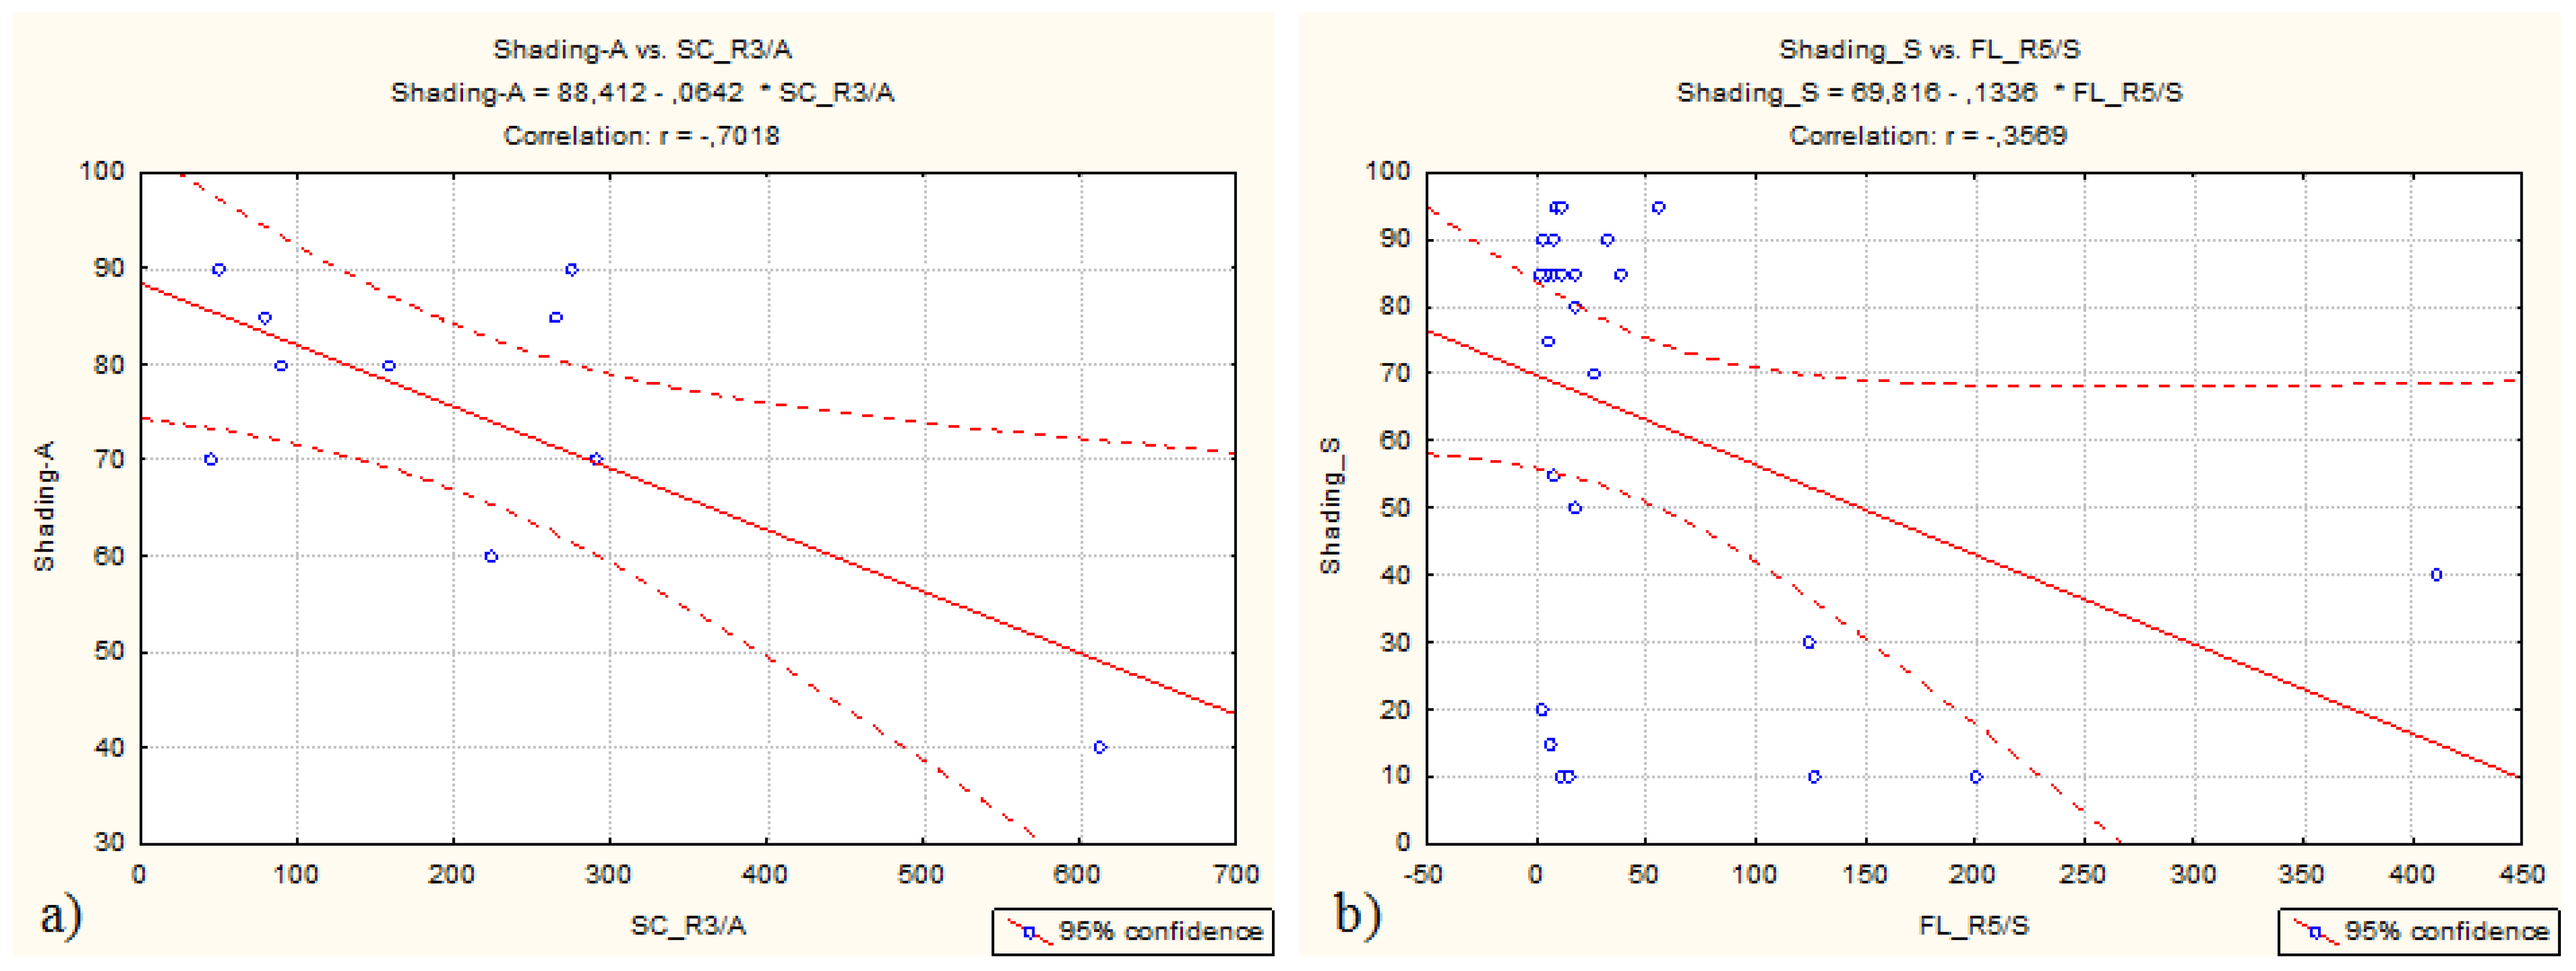
The performed linear correlation analysis between the degree of shading and abundance of the FFG by river types and seasons showed several significant negative correlations (p < 0.05) for R3 river type–SC in autumn (r = −0.70) and FL in spring (r = −0.68) and for R5 river type–DF in both seasons (r = −0.42 and r = −0.41 resp.) (Table 2). In general, the shading negatively affected the numbers of individual trophic groups to a greater extent at the R5 river type sites (albeit with lower values of ‘r’) (Table 2). The regression analyses of SC and FL distributional patterns (both having higher significant values of ‘r’) clearly pointed out the tendency for diminishing abundance with increasing percentage of shading (Figure 5).

3.2. Similarity in the Trophic Structure of the Benthic Communities

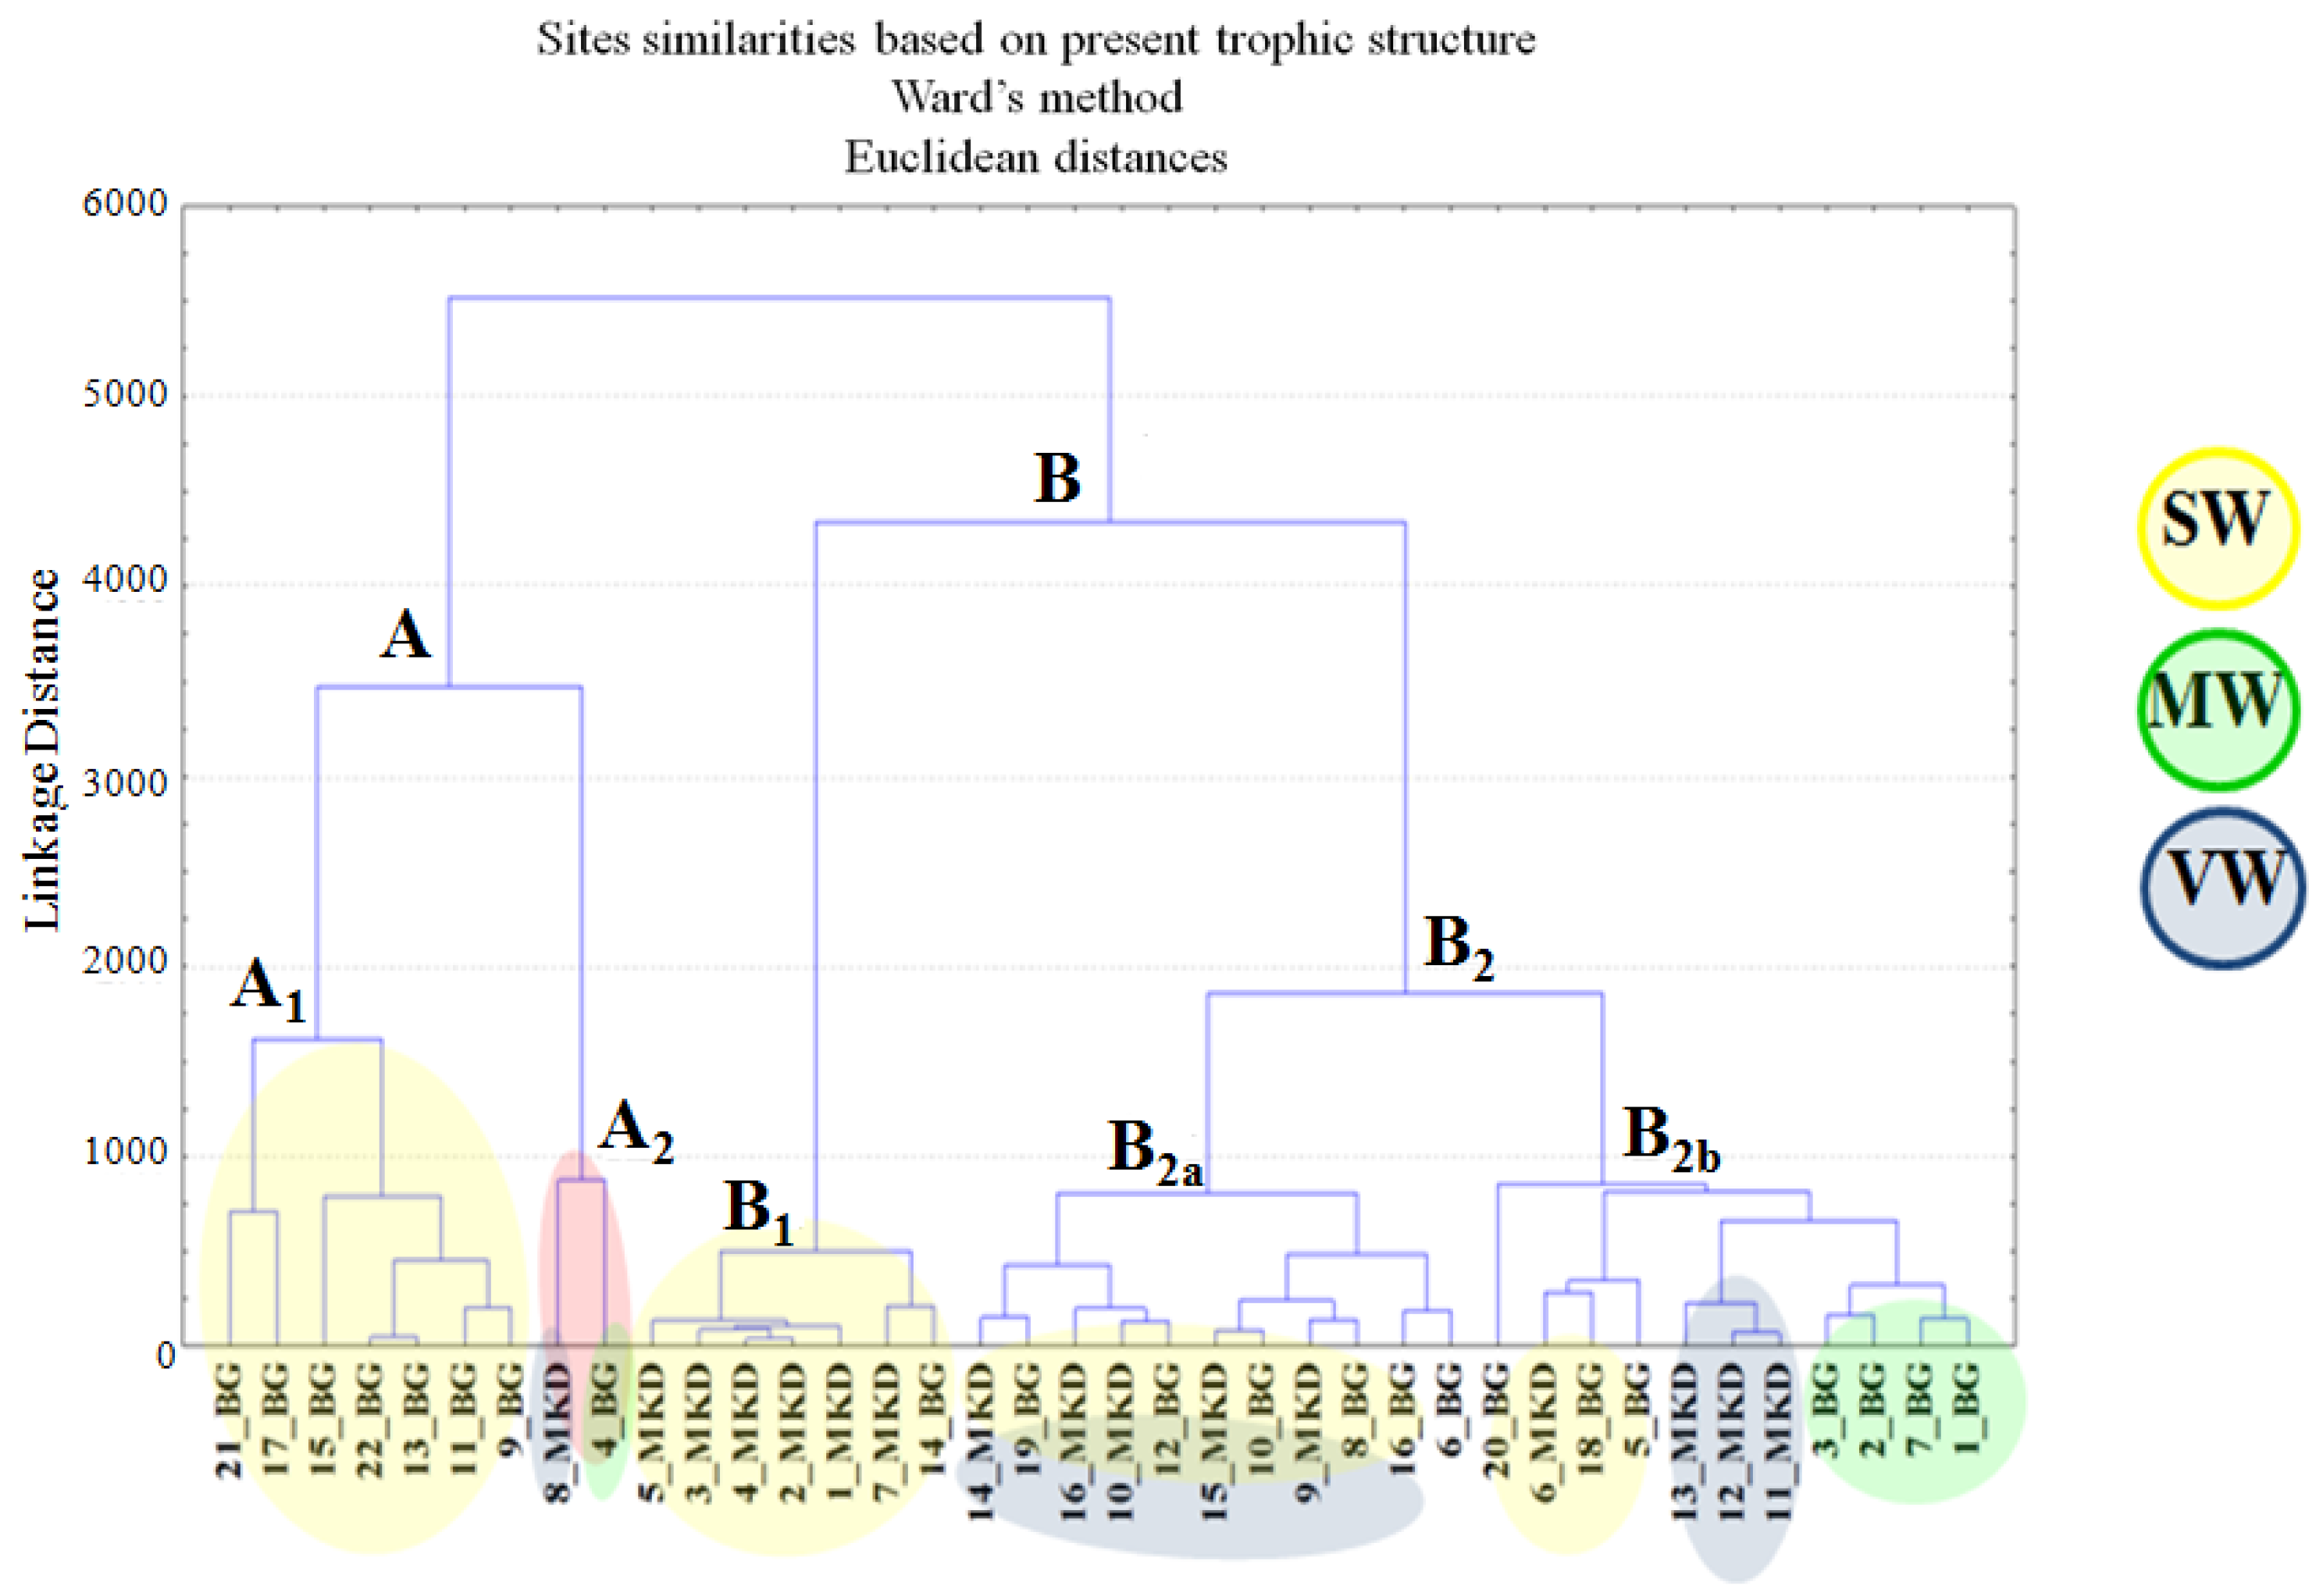
The cluster analysis of the similarities based on the benthic FFG, distinguished two well-separated groups depending on river types, whether R3 or R5 clusters A, B1, B2a consisted of R5 sites, and B2b contained R3 sites only (Figure 5). Considering the differences in benthic FFG composition according to the degree of the anthropogenic impact, the most polluted sites were grouped in cluster A2 (8_MKD and 4_BG). The sites in subgroups B2a and B2b were the most similar regarding the trophic structure. Within these subgroups, the only distinction was the altitude as they were separated based on the affiliation R3 or R5 river type sites. Cluster B1 consisted of samples with the most similar FFG composition (from SW) or in closest geographical distances-MKD sites (1_, 2_, 3_, 4_, 5_, 7_) and 14_BG site (Figure 1 and Figure 6).

3.3. Ecological Quality and Classification of the Studied Sites by Different FFG-Based Indices

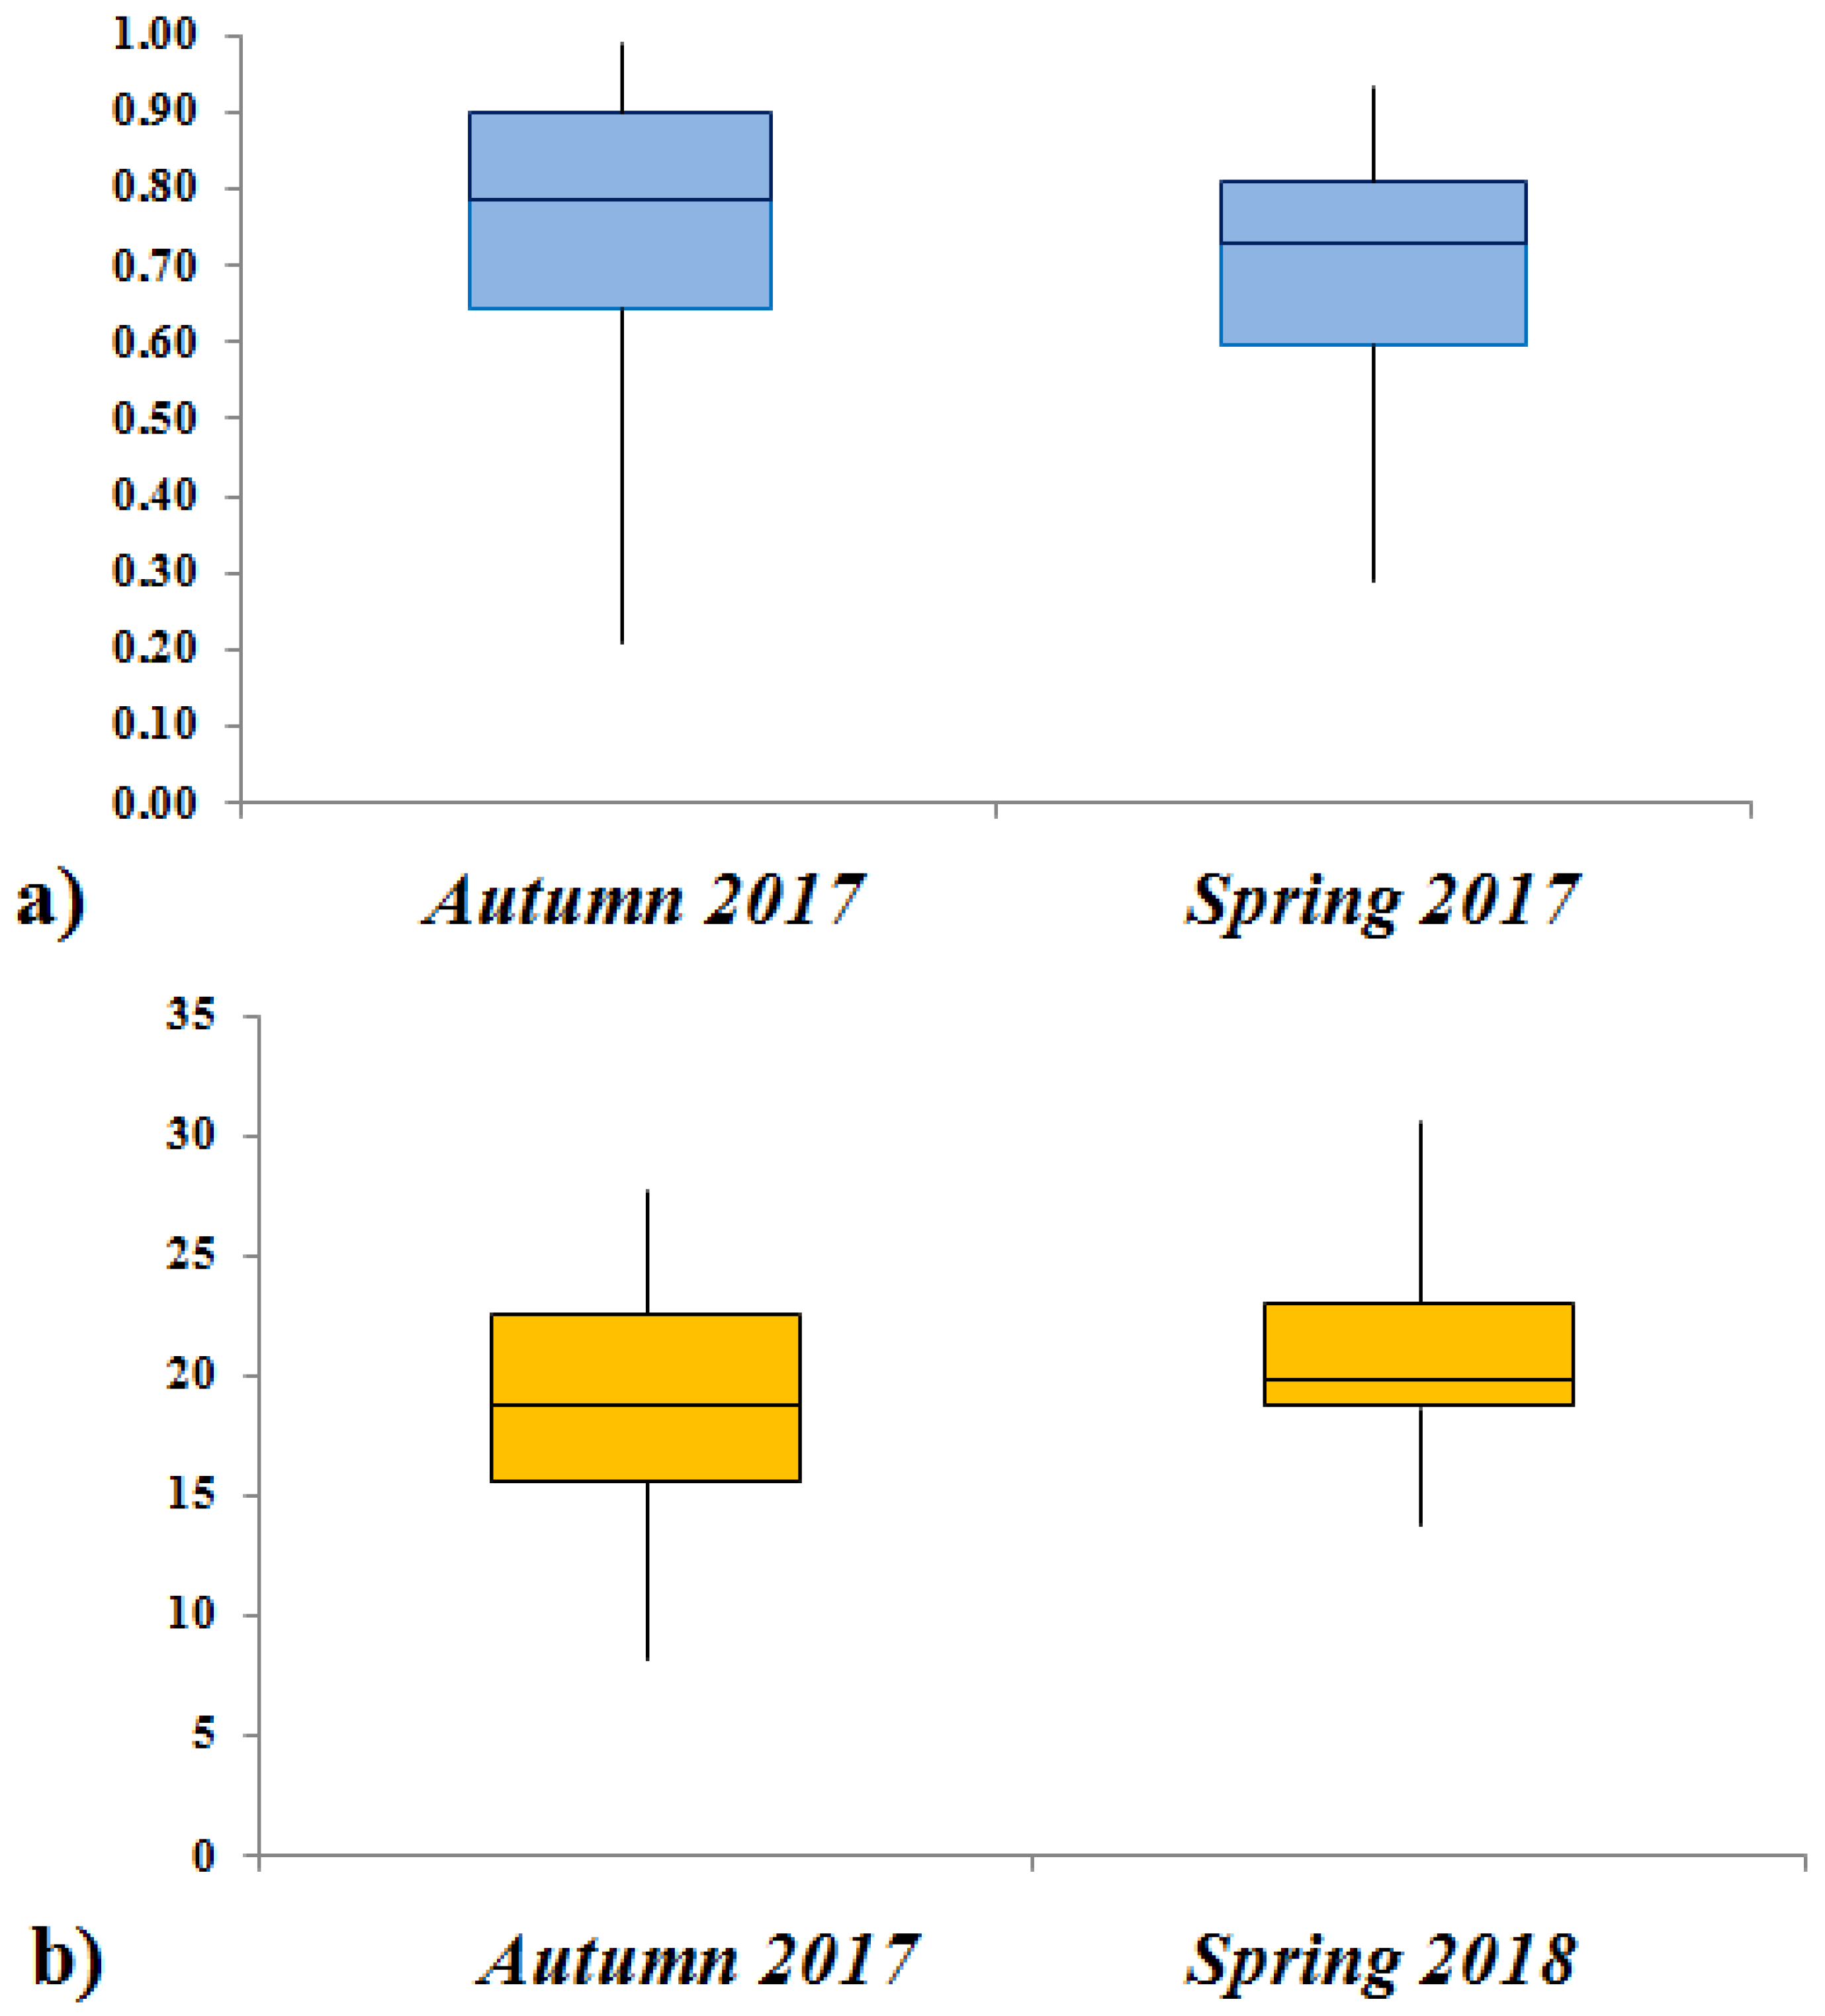
The RETI values varied from 0.21 (5_MKD, “bad” ecological quality, EQ) to 0.99 (17_BG and 12_MKD, “high” EQ) (Appendix A). Despite the wide ranges of the index values, most of them were higher than 5.9 in both seasons, which corresponded to good and high EQ (Figure 7a). The RETI values did not differ significantly between R3 and R5 river type sites (Figure 7a).
Compared to the RETI, the variation in the ITC values was much lower. The index varied from 8.27 (11_ and 13_MKD in autumn, poor EQ—IV class) to 30.6 (1_BG in spring, high EQ—I class) (Figure 7b, Appendix A). The lowest EQ was established during the autumn period. Moreover, a total of seven MKD sites had poor EQ (class IV) in the same season. Significant differences between the ITC scores of R3 and R5 river type sites were noted, with lower EQ of R3 river sections being strongly expressed during the autumn period (Figure 7b). The variations of both indices were more pronounced in autumn (Figure 7).
Within the MDS analysis, the most polluted sites (8_MKD, 4_BG) were clearly separated on the left side of the plot (Figure 8). The rest of the sites were grouped in the central part of the diagram, pointing out the higher similarity between the trophic structures of the most alike sites per river types. It also included the sites with the highest values of RETI and ITC indices as well. Herein, the separation by the river typology is observed, as most of the R5 sites were grouped at the lower left side of the plot and the R3 sites were spread more at the center and upper part of the diagram (Figure 8). Exceptions were the R3 (2_BG, 13_MKD) and R5 site (19_BG) whose trophic structure slightly differed from the other ones.

4. Discussion

In natural conditions, environmental factors determine the trophic structure of the river ecosystem health [40]. Jiang et al. [41] noted the main structure-determining factors in the formation of the trophic composition of benthic communities to be altitude, bottom substrate, river order and river width. In this study, the ratio between FFGs at the undisturbed sites corresponded to the principles set in the River Continuum Concept [10], where this was further confirmed in the research conducted by the following studies [18,26,42,43]. SH inhabit predominantly gravelly and rocky bottom substrates, typical riverbed of high mountain river stretches [44]. This characteristic of SH dominance corresponds to our findings for R3 river type sites in autumn. SC are primary consumers associated with gravel bottom, open river stretches and rapids [45,46]. SH and SC are dominant in macrozoobenthic trophic structure at reference lotic sites [29], an observation that was also supported by our study. Under human pressure, depending on the type and strength of the impact transformation of the trophic structure of the macrozoobenthos and reorganization between FFGs was observed (e.g. [30]). The process of this restructuring primarily affected the sensitive taxa, which belong to groups of SH and SC. They decreased in numbers or even vanished from the community, at the expense of increasing the share of more tolerant groups of DF or FL. Barbour et al. [47] pointed out that the SH and SC, named obligate groups, respond more sensitively to anthropogenic stress, while generalist groups such as FL, CL exhibit considerable tolerance for various contaminations. According to some studies [48,49], SH are rare in impacted streams, which was also confirmed by our results. Moreover, the predominance of stenobiont oligosaprobic (most of the representatives from the order of Plecoptera: Taeniopteryx schoenemundi, Brachyptera seticornis, B. risi, Dinocras megacephala, Leuctra pseudosignifera, L. hippopus, L. inermis, Protonemura montana, P. intricata intricata, P. praecox praecox, Nemoura flexuosa [36]) benthic species which belong to the group of SH were associated with the presence of CPOM of natural origin in the water and indicate unaffected environmental conditions. Conversely, the group of DF was the dominant trophic group in muddy sediments [30,50] and indicative of the presence of a significant amount of organic matter (autochthonous or allochthonous) [44,45,51]. Within this study, these findings were observed at R5 sites (4_BG and 8_MKD). CL are relatively tolerant and occur in different habitats and under specific environmental conditions [46]. A high proportion of CL is often associated with downstream parts of rivers [52], similar to that found at site 14_BG. PRs are fed by actively pursuing their preys [50] and their density is relatively evenly distributed along the river [14]. We observed that the higher presence of PR usually was combined with the lowest presence/or total absence of the CL, findings supported by Kerakova et al. [29] as well. The group of PR does not have a pronounced seasonal character while the remaining trophic groups differ in abundance during different seasons, even within a single river type. FL representatives, which usually inhabit soft and muddy substrates, are fed by passive filtration of the FPOM and UFPOM from the water column [45,52]. Their abundance is associated with the presence of large quantities of water carrying suspended solids [53]. In our study, the FL proportion in the surveyed communities was negligible, findings observed also by Nicola et al. [23]. Only at site 5_MKD, in autumn the passive FL (Simuliidae) dominated the other feeding groups, probably as result of the hydromorphological/and anthropogenical processes expressed at this season that influenced the FFG composition. Concerning the following spring, the proportion of FL on this site was negligible and the SH, SC and DF took over the benthic community’ trophic structure.
We stated that in unaffected conditions especially in the mountainous river sections, the trophic structure is type-specific and slightly differs between the studied, closely related rivers. At the sites, which are characterized as unaffected/undisturbed (1_, 13_, 17_BG; 1_, 9_, 11_, 12_MKD) [33], SH and SC dominate in the macrozoobenthos communities. According to Kerakova et al. [30] SH does not show differential grouping based on factors such as season, river type or river basin. Herein, at R3 sites SC and SH prevailed in spring, while at R5 sites SC decreased in VW and MW compared to SH, which were outnumbered by SC in SW and MW. Regardless of the river type, DF in SW were more abundant in autumn, in VW they increased in spring, while in MW DF did not show seasonal variation in abundance. Moreover, even we noted degradation at the sampled localities from VW, due to hydromorphological alterations [33]. These findings correspond to lower values of the RETI index as we detected bad and poor EQ at sites 8_MKD (autumn) and 14_MKD (spring). At these sites, DF prevailed in the macroinvertebrates communities, as a result of the anthropogenic interference [33,36]. The less anthropogenic disturbances (organic pollution) resulted in the lowest numbers of DF (e.g. sites 2_, 14_, 20_BG and 13_MKD).
The transformation of the trophic structure, expressed by the increase in DF as a result of mining activities on site 14_MKD (VW) was evident. The most polluted sites (as contained tolerant taxa, mainly aquatic worms and caddisflies) [33] 4_BG and 8_MKD (SW) were separated as a result of the highest dominance of the DF. At these sites, we found many tolerant taxa, mainly of the subclass Oligochaeta and less tolerant species from the order Trichoptera, which prevailed in the benthic community. Herein, the values of ecological quality indices (BMWP, BI, EPT taxa richness and ASPT) were also lowest [33]. Moreover, within the cluster analysis (subgroups B1 and B2b), we noted the longest linkage distances among the sites (with similar FFG distribution at the similar altitudes) with the highest water quality.
From the previously performed work, it was evident that the seasonality and site degradation had a determining role in the formation of the FFG’s species composition [33]. Within this study, our results pointed out on a negative correlation between the abundance of SC (in autumn) and FL (in spring) and the degree of shedding in the mountainous rivers. Another authors also found that at lower altitudes and less shading, the proportion of FL increased [30].
In general, ecological assessment of the lotic water bodies is based on species richness that strongly depends on the diversity of the microhabitats, seasonal changes, the river typology, riverbed alteration and all aspects of anthropogenic disturbances [33,36]. The trophic index RETI is very sensitive toward hydro-morphological degradation [26]. Thus, according to the RETI values, only seven undisturbed sites kept the high EQ during both seasons. The gained RETI scores for site 5_BG pointed out on a transition from moderate (as the lowest) in autumn to high EQ the following spring, likely owing to the increased water level during the late winter period. We also noted the disturbances on eight sites where a lower EQ was recorded at the following spring. For these findings, we can summarize that not only natural factors (water level fluctuation during different seasons) but anthropogenic impact (hydro-morphological changes and organic pollution) can led to restructuring of the FFG. Moreover, the effect caused by global climate processes in high-mountain (free of human impact) vulnerable ecosystems, which are reflected in the local scale [26], should not be neglected. Further, we obtained the EQ scores at some of the undisturbed sites that corresponded with the lower RETI values at autumn. An example is the site 5_MKD (autumn), where the RETI and ITC values corresponded to the lowest EQ, results that differed from the gained biotic indices values, which correspond to high/good water quality, and this site was listed as referent/or near the natural site [33]. Kerakova et al. [29] found comparatively lower variations of the assessment within no more than two ecological classes. A probable reason for the above discrepancy between the biotic and trophic index estimates may be the fact that at this stage no type-specific scale has been developed for RETI.
Unlike the RETI values, which do not differ between R3 and R5 river type sites, those of the ITC report larger differences, especially if the R3 rivers have a lower EQ during the autumn period. Testing the ITC index on our studied sites gave us a reason to suggest the following: When there are more than five random species [48] found in river sites of R3 and R5 type (without dominant representatives) and where more than 1/4 of the total species belong to a guild not presented in the sample itself, these species should be added at MaTroS 2.0 for calculation. This is very important especially if all the taxa in the sample belong to one/or two different trophic guilds only. Our result demonstrated that the incomplete list included in the software product was a reason why the EQ determined by the ITC is lower compared to the RETI value. In the R3 and R5 rivers that we studied, such cases with single specimens/species were commonly noted, depending on the water catchment and available water resources as opposed to the situations in big lowland rivers. Thus, the hypothesis expressed here has to be further tested and adjusted for other river types.

5. Conclusions

The FFG composition demonstrated a pronounced seasonal dynamics. Although at the undisturbed/reference R3 and R5 sites the close similarity was evident, the trophic structure of the macroinvertebrate communities was characterized as type-specific. Under anthropogenic influence, a transformation is observed in the composition of the trophic structure, which is associated with a decreasing in the abundance of the more sensitive groups (SH and SC) at the expense of an increase in the abundance of more tolerant ones (DF). The ecological status of the river ecosystems assessed by the FFGs of the benthic macroinvertebrates showed high sensitivity and vulnerability of the RETI to human impacts. Based on our results, we consider that once type-specific scales have been developed, the RETI could be reliable and applicable for ecological status evaluation of the mountainous and semi-mountainous rivers. As for the ITC, its application in this study showed that this trophic index needs further adjustment for small mountain rivers and streams.
Our results are also a contribution to the study of the processes of the functioning of macrozoobenthos communities as a key biological element in semi-mountain and mountain lotic ecosystems. In order to avoid the adverse impact of the factors with negative effects on these extremely valuable ecosystems, the authorized institutions should pay particular attention to conservation and take adequate measures aimed at preventing their pollution in semi-mountainous and mountain rivers.

Author Contributions

Conceptualization, B.R., Y.V. and E.V.; methodology, B.R. and Y.V.; validation, B.R., Y.V. and E.V.; investigation, B.R. and Y.V.; writing—original draft preparation, B.R., Y.V. and E.V.; draft review, B.R., Y.V. and E.V. All authors have read and agreed to the published version of the manuscript.

Funding

This research was funded by the “Program for Support of Young Researchers and PhD Students” at the Bulgarian Academy of Sciences (Grant no. DFNP-17-108/28.07.2017-“Implementation of biotic indices BMWP and ASPT in order to evaluate the ecological status of mountain and semi-mountain rivers in the 7th Ecoregion (Eastern Balkans)”).

Institutional Review Board Statement

During the research period, the authors followed all applicable national, international and/or institutional guidelines for the care and use of animals. The study did not involve endangered or protected species. Therefore, no specific permissions were required for conducting this study.

Data Availability Statement

Not applicable.

Acknowledgments

We are grateful to the person who maintains the MaTroS 2.0 website for allowing us access for ITC calculation (http://www.riza.nl/itc/; accessed on 30 April 2020). We express our gratitude to the anonymous reviewers for their valuable comments and recommendations that improved the final version of the manuscript.

Conflicts of Interest

The authors declare no conflict of interest.

Appendix A

Table A1. Values of ITC and RETI indices, the corresponding ecological quality class (EQ-class) and the degree of shading (% SHA) per studied sites and sampled seasons.
Autumn 2017Spring 2018
Site CodeITCEQ-ClassRETIEQ-Class% SHAITCEQ-ClassRETIEQ-Class% SHA
1_BG26.73II0.91I4030.6II0.69II60
2_BG14.25III0.96I90/ / /
3_BG26.44II0.8I6026.44II0.8II90
4_BG21II0.41III1023.64II0.46III10
5_BG26.73II0.77III7022.88II0.8I80
6_BG26.44II0.57III3023.64II0.53II30
7_BG22.58II0.75II8026.44II0.83I85
8_BG26.75II0.84I7026.75II0.83I85
9_BG15.92III0.94I1018.73III0.55II10
10_BG19.79III0.9I8017.15III0.75II85
11_BG19.79III0.81I9519.79III0.79II95
12_BG26.75II0.66II2013.85III0.7II20
13_BG15.59III0.96I9015.59III0.83I90
14_BG20.8III0.64II7023.94II0.81I70
15_BG26.75II0.66II6026.75II0.71II40
16_BG27.75II0.8I9019.79III0.53II95
17_BG19.77III0.99I9015.92III0.9I85
18_BG16.34III0.5III80/ / /
19_BG/ / /19.79III0.81I90
20_BG/ / /22.58II0.47III50
21_BG/ / /19.77III0.67II90
22_BG/ / /19.79III0.9I50
1_MKD16.64III0.76II9022.58II0.68II95
2_MKD15.92III0.5III7022.59II0.67II85
3_MKD15.92III0.82I7515.59III0.49III85
4_MKD18.73III0.55II7019.79III0.59II75
5_MKD12.95IV0.21V7022.59II0.6II85
6_MKD18.73III0.5III9019.79III0.65II95
7_MKD/ / /19.44III0.81I95
8_MKD11.96IV0.25V3019.79III0.35III10
9_MKD19.79III0.79I8519.79III0.93I80
10_MKD15.59III0.85I8526.44II0.75II75
11_MKD8.27IV0.67II7018.73III0.76II70
12_MKD12.42IV0.99I8522.88II0.81I95
13_MKD8.27IV0.92I8015.59III0.84I85
14_MKD10.4IV0.82I1020.08III0.29IV15
15_MKD19.79III0.92I5015.92III0.94I55
16_MKD12.79IV0.7II1017.4III0.71II10

References

  1. Cummins, K.W.; Merritt, R.W.; Andrade, P.C. The use of invertebrate functional groups to characterize ecosystem attributes in selected streams and rivers in south Brazil. Stud. Neotrop. Fauna Environ. 2005, 40, 69–89. [Google Scholar] [CrossRef]
  2. Tamaris-Turizo, C.E.; Pinilla, A.G.A.; Muñoz, I. Trophic network of aquatic macroinvertebrates along an altitudinal gradient in a Neotropical mountain river. Rev. Bras. Entomol. 2018, 62, 180–187. [Google Scholar] [CrossRef]
  3. Cummins, K.W. Structure and function of stream ecosystems. Bio Science 1974, 24, 631–641. [Google Scholar] [CrossRef]
  4. Cummins, K.W.; Klug, M.J. Feeding ecology of stream invertebrates. Annu. Rev. Ecol. Syst. 1979, 10, 147–172. [Google Scholar] [CrossRef]
  5. Tamaris-Turizo, C.E.; Pinilla, A.G.A.; Guzmán-Soto, C.J.; Granados-Martínez, C.E. Assigning functional feeding groups to aquatic arthropods in a Neotropical mountain river. Aquat. Biol. 2020, 29, 45–57. [Google Scholar] [CrossRef] [Green Version]
  6. Suriyawong, P.H.; Thapanya, D.; Bergey, E.; Chantaramongkol, P. Aquatic Insect Functional Feeding Groups in a MountainStream with a Series of Check Dams in Northern Thailand. Sains Malays. 2018, 47, 1379–1386. [Google Scholar] [CrossRef]
  7. Svitok, M.; Novikmec, M.; Bitušík, P.; Máša, B.; Oboňa, J.; Očadlík, M.; Michalková, E. Benthic communities oflow-order streams affected by acid mine drainages: A case study from Central Europe. Water 2014, 6, 1312–1338. [Google Scholar] [CrossRef] [Green Version]
  8. Ramírez, A.; Gutiérrez-Fonseca, P.E. Functional feeding groups of aquatic insect families in Latin America: A critical analysis and review of existing literature. Rev. Biol. Trop. 2014, 62, 155–167. [Google Scholar] [CrossRef]
  9. Harvey, E.; Altermatt, F. Regulation of the functional structure of aquatic communities across spatial scales in a major rivernetwork. Ecology 2019, 100, e02633. [Google Scholar] [CrossRef] [Green Version]
  10. Vannote, R.L.; Minshall, G.W.; Cummins, K.W.; Sedell, J.R.; Cushing, C.E. The river continuum concept. Can. J. Fish. Aquat. Sci. 1980, 37, 130–137. [Google Scholar] [CrossRef]
  11. Mc Cormick, P.V.; Shuford, R.B.E.; Pawlik, P.S. Changes in macroinvertebrate community structure and function along a river length. Hydrobiologia 2004, 529, 113–132. [Google Scholar] [CrossRef]
  12. Carlisle, D.M.; Clements, W.H. Leaf litter breakdown, microbioal respiration and shredders production in metal-polluted streams. Freshw. Biol. 2005, 50, 380–391. [Google Scholar] [CrossRef]
  13. Gregory, K.J. The human role in changing river channels. Geomorphology 2006, 79, 172–191. [Google Scholar] [CrossRef]
  14. de Vaate, A.B.; Pavluk, T.I. Practicability of the Index of Trophic Completeness for running waters. Hydrobiologia 2004, 519, 49–60. [Google Scholar] [CrossRef]
  15. Rawer-Jost, C.; Bohmer, J.; Blank, J.; Rahmann, H. Macroinvertebrate functional feeding group methods in ecological assessment. Hydrobiologia 2000, 422, 225–232. [Google Scholar] [CrossRef]
  16. Pavluk, T.I.; de Vaate, A.B.; Leslie, H.A. Development of an index of trophic completeness for benthic macroinvertebrate communities in flowing waters. Hydrobiologia 2000, 427, 135–141. [Google Scholar] [CrossRef]
  17. Stepanov, L.N.; Pavluk, T.E. Benthic Fauna Shifts Downstream from Alluvial Gold Mine: A Case Study in a Subpolar Urals River. J. Fish. Aquat. Sci. 2019, 14, 15–24. [Google Scholar] [CrossRef] [Green Version]
  18. Compin, A.; Céréghino, R. Spatial patterns of macroinvertebrate functional feeding groups in streams in relation to physical variables and land-cover in southwestern France. Landsc. Ecol. 2007, 22, 1215–1225. [Google Scholar] [CrossRef]
  19. Jourdan, J.; O’Hara, R.B.; Bottarin, R.; Huttunen, K.L.; Kuemmerlen, M.; Monteith, D.; Muotka, T.; Ozoliņš, D.; Paavola, R.; Pilotto, F.; et al. Effects of changing climate on European stream invertebrate communities: A long-term data analysis. Sci. Total Environ. 2018, 621, 588–599. [Google Scholar] [CrossRef]
  20. Pastorino, P.; Bertoli, M.; Squadrone, S.; Brizio, P.; Piazza, G.; Noser, A.G.O.; Prearo, M.; Abete, M.C.; Pizzul, E. Detection of trace elements in freshwater macrobenthic invertebrates of different functional feeding guilds: A case study in Northeast Italy. Ecohydrol. Hydrobiol. 2019, 19, 428–440. [Google Scholar] [CrossRef]
  21. TiernodeFigueroa, J.M.; López-Rodríguez, M.J.; Villar-Argaiz, M. Spatial and seasonal variability in the trophic role of aquatic insects: An assessment of functional feeding group applicability. Freshw. Biol. 2019, 64, 954–966. [Google Scholar] [CrossRef]
  22. González, M.; Graça, M.A. Influence of detritus on the structure of the invertebrate community in a small Portuguese stream. Int. Rev. Hydrobiol. J. Cover. All Asp. Limnol. Mar. Biol. 2005, 90, 534–545. [Google Scholar] [CrossRef] [Green Version]
  23. Nicola, G.G.; Almodóvar, A.; Elvira, B. Effects of environmental factors and predation on benthic communities in headwater streams. Aquat. Sci. 2010, 72, 419–429. [Google Scholar] [CrossRef]
  24. Von Fumetti, S.; Nagel, P. A first approach to a faunistic crenon typology based on functional feeding groups. J. Limnol. 2011, 70, 147. [Google Scholar] [CrossRef] [Green Version]
  25. Strzelec, M.; Białek, K.; Spyra, A. Activity of beavers as an ecological factor that affects the benthos of small rivers-a case study in the Żylica River (Poland). Biologia 2018, 73, 577–588. [Google Scholar] [CrossRef] [Green Version]
  26. Varadinova, E.; Kerakova, M.; Uzunov, Y. Mesta River: Trophic structure of the macrozoobenthos. In Mesta River: Biological Quality Elements and Ecological Status; Uzunov, Y., Pehlivanov, L., Georgiev, B.B., Varadinova, E., Eds.; Professor Marin Drinov Academic Publishing House: Sofia, Bulgaria, 2013; pp. 97–122. [Google Scholar]
  27. Schweder, H. Neue Indices für die Bewertung des ökologischen Zustandes von Fließgewässern, abgeleitetaus der Makroinvertebraten-Ernährungstypologie. Limnol. Aktuell 1992, 3, 353–377. [Google Scholar]
  28. Cheshmedjiev, S.; Varadinova, E. Macrozoobenthos. In Biological Analysis and Ecological Status Assessment of Bulgarian Surface Water Ecosystems; Belkinova, D., Gecheva, G., Cheshmedjiev, S., Dimitrova-Dyulgerova, I., Mladenov, R., Marinov, M., Teneva, I., Stoyanov, P., Ivanov, P., Mihov, S., et al., Eds.; University of Plovdiv Pub. House: Plovdiv, Bulgaria, 2013; pp. 147–163. (In Bulgarian) [Google Scholar]
  29. Kerakova, M.; Ihtimanska, M.; Varadinova, E. Application of trophic indices in ecological state assessment of riverine waterbodies. Bulg. J. Agric. Sci. 2013, 19, 277–281. [Google Scholar]
  30. Kerakova, M.; Uzunov, Y.; Varadinova, E. Comparison of Trophic Structure of the Benthic Macroinvertebrates in Three Bulgarian Riverine Water Bodies. Turk. J. Zool. 2017, 41, 267–277. [Google Scholar] [CrossRef]
  31. Varadinova, E.; Sakelarieva, L.; Park, J.; Ivanov, M.; Tyufekchieva, V. Characterisation of Macroinvertebrate Communities in Maritsa River (South Bulgaria)-Relation to Different Environmental Factors and Ecological Status Assessment. Diversity 2022, 14, 833. [Google Scholar] [CrossRef]
  32. Illies, J. Limnofaunaeuropaea, 2nd ed.; Gustav Fischer: Stuttgart, Germany, 1978; pp. 1–532. [Google Scholar]
  33. Rimcheska, B.; Vidinova, Y. Ecological Status Assessment of Mountain and Semi-mountain Streams in the Aegean Watershed: Applicability of Biotic Indices BMWP and ASPT Based on Macroinvertebrates. Acta Zool. Bulg. 2020, 72, 49–60. [Google Scholar]
  34. Cheshmedjiev, S.; Marinov, M. Typology of water ecosystems in Bulgaria (implementation of Water Framework Directive 2000/60/EC). In Proceedings of the Anniversary Scientific Conference of Ecology, Plovdiv, Bulgaria, 1 November 2008; Velcheva, I.G., Tsekov, A.G., Eds.; Plovdiv University Press: Plovdiv, Bulgaria, 2008; pp. 371–383. (In Bulgarian) [Google Scholar]
  35. West Aegean River Basin Management Plan 2016–2021. Available online: https://wabd.bg/docs/plans/purb1621 (accessed on 15 May 2020).
  36. Rimcheska, B.; Vidinova, Y. Diversity and structure of macroinvertebrate communities in permanent small streams and rivers in Eastern Balkans. Hydrobiologia 2022, 1–17. [Google Scholar] [CrossRef]
  37. Cheshmedjiev, S.; Soufi, R.; Vidinova, Y.; Tyufekchieva, V.; Yaneva, I.; Uzunov, Y.; Varadinova, E. Multihabitat sampling method for benthic macroinvertebrate communities in different river types in Bulgaria. Water Research Manag. 2011, 1, 55–58. [Google Scholar]
  38. EN ISO 10870:2012; Water Quality—Guidelines for the Selection of Sampling Methods and Devices for Benthic Macroinvertebrates in Fresh Waters. Finnish Standards Association: Helsinki, Finland, 2012; p. 26.
  39. Clarke, K.R.; Gorley, R.N. Primer v6: User Manual/Tutorial. Plymouth Routine in Multivariate Ecological Researc; Primer-e Ltd.: Plymouth, UK, 2006; p. 182. [Google Scholar]
  40. Young, R.G.; Matthaei, C.D.; Townsend, C.R. Organic matter breakdown and ecosystem metabolism: Functional indicators for assessing river ecosystem health. J. N. Am. Benthol. Soc. 2008, 27, 605–625. [Google Scholar] [CrossRef]
  41. Jiang, X.; Xiong, J.; Xie, Z.; Chen, Y. Longitudinal patterns of macroinvertebrate functional feeding groups in a Chinese river system: A test for river continuum concept (RCC). Quat. Int. 2011, 244, 289–295. [Google Scholar] [CrossRef]
  42. Groff, M.H. Does the River Continuum Concept Work in Small Island Streams? Functional Feeding Group Variation Along a Longitudinal Gradient. UC Berkeley: Student Research Papers. 2006. Available online: https://escholarship.org/uc/item/6db9m25g (accessed on 17 April 2020).
  43. Burgad, A.A.; Clark, S.T.; Furr, M.E.; Lenard, A.N.; Polett, M.E.; Robinson, C.D.; Sherwood, C.R.; Spooner, G.L.; Stoughton, S.J.; Adams, S.R. Longitudinal patterns in an Arkansas River Valley stream: An Application of the River Continuum Concept. J. Ark. Acad. Sci. 2017, 71, 153–164. [Google Scholar] [CrossRef]
  44. Merrit, R.W.; Cummins, K.W. Trophic relations of macroinvertebrates. In Methods in Stream Ecology; Hauer, F.R., Lamberti, G.A., Eds.; Academic Press Inc.: San Diego, CA, USA, 1996; pp. 453–474. [Google Scholar]
  45. Bis, B.; Zdanowicz, A.; Zalevski, M. Effects of catchment properties on hydrochemistry habitat complexity and invertebrate community structure in a lowland river. Hydrobiologia 2000, 422–423, 369–387. [Google Scholar] [CrossRef]
  46. Velasquez, S.M.; Miserendino, M.L. Habitat type and macroinvertebrate assemblages in low order Patagonian streams. Arch. Hydrobiol. 2004, 158, 461–483. [Google Scholar] [CrossRef]
  47. Barbour, M.T.; Gerritsen, J.; Snyder, B.D.; Stribling, J.B. Revision to Rapid Bioassessment Protocol for Use in Streams and Rivers. In Periphyton, Benthic Macroinvertebrates and Fish, 2nd ed.; EPA841-B-99-002; U.S. Environmental Protection Agency, Office of Water: Washington, DC, USA, 1999. [Google Scholar]
  48. de Vaate, A.B. Macroinvertebrate communities in the Grensmaas stretch of the river Meuse: 1981–1990. J. Freshw. Ecol. 1995, 10, 75–82. [Google Scholar] [CrossRef]
  49. Paunović, M.; Jakovčev-Todorović, D.; Simić, V.; Stojanović, B.; Petrović, A. Trophic relations between macroinvertebrates in the Vlasina river (Serbia). Arch. Biol. Sci. 2006, 58, 105–114. [Google Scholar] [CrossRef]
  50. Shull, D.H.; Mayer, L.M. Dissolution of particle-reactive radionuclides in deposit-feeder digestive fluids. Limnol. Oceanogr. 2002, 47, 1530–1536. [Google Scholar] [CrossRef]
  51. Varadinova, E.; Uzunov, Y.; Soufi, R. A new integrated index for assessment of the ecological status of rivers as based on functional feeding groups of the macrozoobenthos. J. Environ. Prot. Ecol. 2007, 8, 754–762. [Google Scholar]
  52. Quinn, J.; Hickey, C.; Linklater, W. Hydraulic influences on periphyton and benthic macroinvertebrates: Simulating the effects of upstream bed roughness. Freshw. Biol. 1996, 35, 301–309. [Google Scholar] [CrossRef]
  53. Wright, J.F.; Clarke, R.T.; Gunn, R.J.M.; Winder, J.M.; Kneebone, N.T.; Davy-Bowker, J. Response of the flora and macroinvertebrate fauna of a chalk stream site to changes in management. Freshw. Biol. 2003, 48, 894–911. [Google Scholar] [CrossRef]
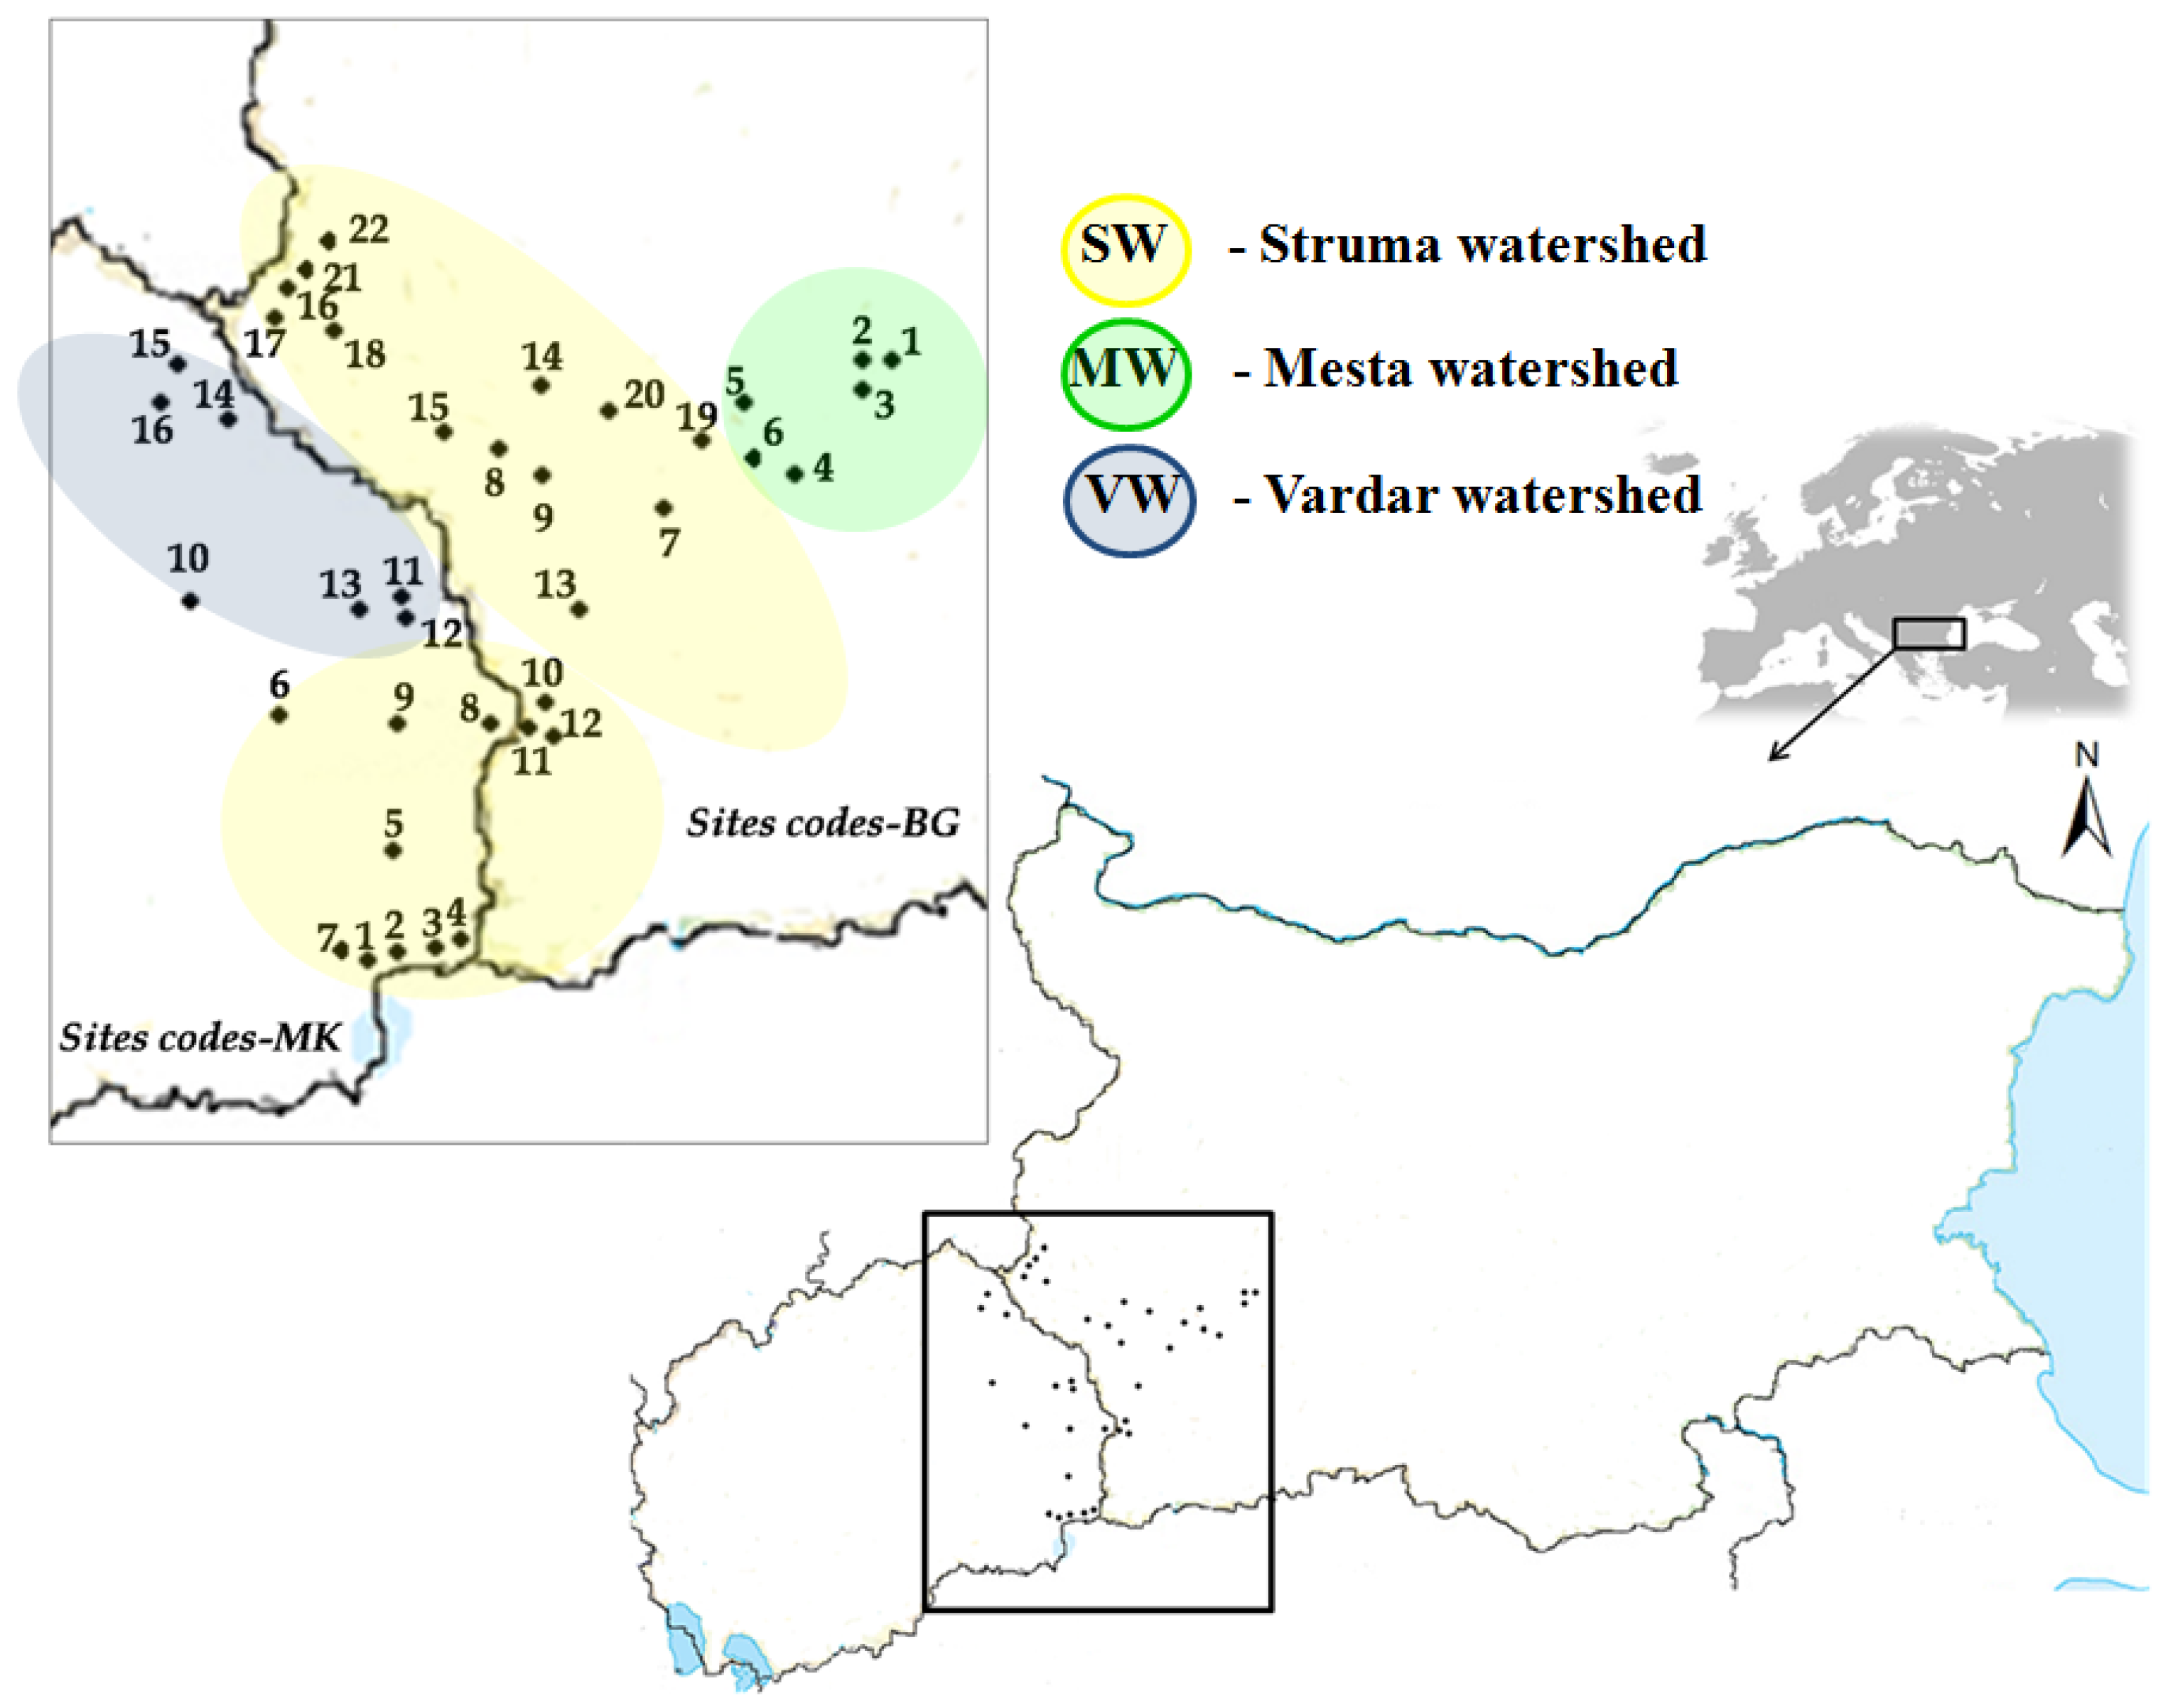
Figure 1. Map of the study area and location of the sampling sites per watersheds.
Diversity 14 01121 g001
Figure 2. Relative abundance of the FFGs (in %): (a) for the whole survey period; (b) per sampling season. Legend: x-axis, FFG composition (a) and FFG composition per sampled season (b); y-axis, relative abundance of the trophic groups (For trophic groups abbreviations, see Materials and Methods).
Diversity 14 01121 g002
Figure 3. Box plots (median, range and interquartile ranges) of total abundance of the FFGs within the studied watersheds. Legend: x-axis: FFG (for abbreviations, see Materials and Methods); y-axis: total number of individuals.
Diversity 14 01121 g003
Figure 4. Total abundance of the trophic groups (min, max, median values) per season: (a) for the R3 sites and (b) for the R5 sites. For abbreviations, see Materials and Methods. Legend: A—autumn, S—spring.
Diversity 14 01121 g004
Figure 5. Scatterplots (Multiple linear regression) of the total number of individuals: (a) SC from R3 sites in relation to the % of shading during the autumn season (R2 = 0.,5402; F = 4.11, p = 0.06); and (b) FL from R5 sites in relation to the degree of shading during the spring season (R2 = 0.2045; F = 3.08, p = 0.06). Legend: A—autumn, S—spring.
Diversity 14 01121 g005
Figure 6. A cluster dendrogram of the similarity between the sampling sites based on the absolute abundance of the FFG (For abbreviations and site codes, see Materials and Methods). The red circle (subgroup A2) represents the most polluted sites.
Diversity 14 01121 g006
Figure 7. Box plot (median, range and interquartile ranges) of RETI (a) and ITC (b) index values during the study period. Legend: x-axis–sampling season; y-axis–indices values.
Diversity 14 01121 g007
Figure 8. MDS plot of the similarity between the studied mountainous (R3) and semi-mountainous (R5) sites based on their trophic structure (For site codes see Materials and Methods).
Diversity 14 01121 g008
Table 1. Level of identification of the systematic groups established during the study.
Systematic GroupLevel of Identification
Turbellariagenera, species
Oligochaetafamilies, genera, species
Hirudineagenera, species
Gastropodagenera, species
Bivalviagenera
Crustaceagenera, species
Ephemeropteragenera, species
Odonatagenera, species
Plecopteragenera, species
Coleopteragenera, species
Heteropteragenera, species
Megalopteragenera, species
Trichopteragenera, species
Dipterafamilies, genera, species
Nematodapresence
Table 2. Linear correlation coefficients between the degree of shading and abundance of each trophic groups for both river types and sampling season (p < 0.05; n—number of cases). The (*) asterisk indicates the significant correlations.
River Type/SeasonnSCSHPRDFFLCL
R3_A10−0.70 *−0.38−0.120.02−0.15−0.35
R3_S90.320.46−0.550.51−0.68 *0.10
R5_A23−0.020.28−0.16−0.42 *−0.24−0.40
R5_S27−0.11−0.190.37−0.41 *−0.36−0.26
Publisher’s Note: MDPI stays neutral with regard to jurisdictional claims in published maps and institutional affiliations.