Article

Aquatic Plant Invasion and Management in Riverine Reservoirs: Proactive Management via a Priori Simulation of Management Alternatives

by
Elizabeth Edgerton
1,2,†,
Hsiao-Hsuan Wang
3,*,†,
William E. Grant
3 and
Michael Masser
1
1
Department of Wildlife and Fisheries Sciences, Texas A&M University, College Station, TX 77843, USA
2
Texas Water Resources Institute, Texas A&M University, College Station, TX 77843, USA
3
Ecological Systems Laboratory, Department of Ecology and Conservation Biology, Texas A&M University, College Station, TX 77843, USA
*
Author to whom correspondence should be addressed.
These authors contributed equally to this work.
Diversity 2022, 14(12), 1113; https://doi.org/10.3390/d14121113
Submission received: 18 November 2022 / Revised: 2 December 2022 / Accepted: 12 December 2022 / Published: 14 December 2022
(This article belongs to the Special Issue Invasive Species as Game-Changers of Aquatic Ecosystems)

Abstract

:
Negative impacts from aquatic invasive plants in the United States include economic costs, loss of commercial and recreational use, and environmental damage. Simulation models are valuable tools for predicting the invasion potentials of species and for the management of existing infestations. We developed a spatially explicit, agent-based model representing the invasion, growth, and senescence of aquatic weeds as functions of day length, water temperature, water depth, and the response of aquatic weeds to biological control. As a case study to evaluate its potential utility, we parameterized the model to represent two historical invasions (1975–1983 and 2004–2007) of Hydrilla (Hydrilla verticillata (L. fil.) Royle) in Lake Conroe, Texas, USA, and their subsequent biological control using grass carp (Ctenopharyngodon idella). Results of several hypothetical alternative management schemes indicated that grass carp stocking densities needed to control Hydrilla infestation increased exponentially as the lag time between initial invasion and initial stocking increased, whereas stocking densities needed to control infestation decreased as the amount of time allowed to control the infestation increased. Predictions such as those produced by our model aid managers in developing proactive management plans for areas most likely to be invaded.

1. Introduction

Biological invasions generate pervasive global change, challenging biodiversity conservation and natural resource management [1,2,3,4]. Invasive species within freshwater ecosystems are of particular concern. Freshwater ecosystems make up less than 0.04% of terrestrial ecosystems, but a disproportionately high percentage, ≈13½% (5 out of 37), of the world’s worst invasive plant species are aquatic invasive plants (AIP) [5].
Negative impacts from AIP include changing habitat structure, decreasing native biodiversity, changing nutrient cycling and biological productivity, and modifying food webs [6], as well as the associated economic costs [7]. Economic costs include the monetary value of ecological and environmental damages, losses of commercial and recreational use, and costs of management and control [8]. For example, Eiswerth et al. [9] estimated the loss of water-based recreation value at only a subset of sites in the watershed of western Nevada and northeastern California could range from USD $30 to $45 million annually. The Florida Department of Environmental Protection invested USD $32 million to control invasive plants in natural areas in 2003, of which around USD $26 million was designated for AIP control [10]. The US government invested roughly USD $100 million annually in control and management efforts for AIP during the 1990s [8].
Many AIP can grow rapidly from fragments, tubers, or rhizomes [11], disperse efficiently [12], and have high phenotypic plasticity [13]. In addition to these biological attributes facilitating invasiveness, high propagule pressure is one of the most critical factors explaining the success of AIP [14]. Obviously, a key to minimizing the negative impacts and costs associated with AIP is to prevent their introduction into new non-native areas [15]. An a priori understanding of how a new species might grow and spread once introduced [2,16], and an assessment of the relative effectiveness of alternative management techniques [17,18,19], would be invaluable to management entities in regulating planned species introductions and managing unplanned invasions. Simulation models are widely used to assess potential causes of observed patterns and to project future patterns [20], and several models have simulated the spread and management of AIP.
Some AIP simulation models have focused on population dynamics [21,22], whereas others have focused on spatial processes [23,24]. Even though some AIP population dynamic models have been developed [20,25], to the best of our knowledge, Miller et al. [26] are the only group that has developed an individual-based AIP model. However, their model does not include a spatially explicit presentation. We are unaware of a spatially explicit, agent-based model simulating AIP spread and control in a real, large reservoir.
Thus, in the present study, we developed a spatially explicit, agent-based model simulating the invasion, growth, and senescence of aquatic weeds as functions of day length, water temperature, water depth, and the response of aquatic weeds to biological control. As a case study to assess its potential management utility, we evaluated the ability of the model to simulate the historical invasion of Hydrilla (Hydrilla verticillata (L. fil.) Royle) and subsequent biological control by grass carp (Ctenopharyngodon idella) in Lake Conroe, Texas, USA. We then used the model to simulate several hypothetical alternative management schemes.

2. Materials and Methods

2.1. Study Area and Target Species

Lake Conroe is a 9332-hectare impoundment in southeast Texas (30°25′ W, 95°35′ N) [27], which was impounded in 1973 as a water supply reservoir for Houston, Texas, USA, [27] and is operated and maintained by the San Jacinto River Authority [28]. Shortly after impoundment, the lake was invaded by Hydrilla, which had covered ≈190 hectares by 1975 [29], and since that time, Hydrilla infestation has been a concern for both the San Jacinto River Authority and the Texas Parks and Wildlife Department [28].
Hydrilla is native to tropical Asia and was first discovered in two locations in Florida, USA, in 1960 [30]. By the early 1970s, it was found in all major drainage areas in the state [30]. Hydrilla is extremely competitive due to its biological characteristics, including fast spreading through underground rhizomes and above-ground stolons [31], high propagule pressure, such as the form of stem fragments, tubers, and turions [32], and fast sprouting and growing [11]. Currently, it is reported in 29 states in the USA [33]. Hydrilla can occur as monoecious and dioecious strains that differ in distribution, growth form, and competitive interactions [30]. The female dioecious strain is dominant in Lake Conroe [34], and the demographic parameters of this strain were therefore used in our model development.
Grass carp are long-lived generalist herbivores that have been used as biological control agents for several decades in the United States to control AIP [35]. They are one of the largest members of the minnow family (Cyprinidae), typically reaching weights of more than 30 kg in their native environments in Asia [36]. Details of the biology of grass carp, including both diploid and triploid (sterile) forms, are available in [36], and detailed descriptions of different types of biocontrol agents for aquatic weeds are available in [37].

2.2. Model Description

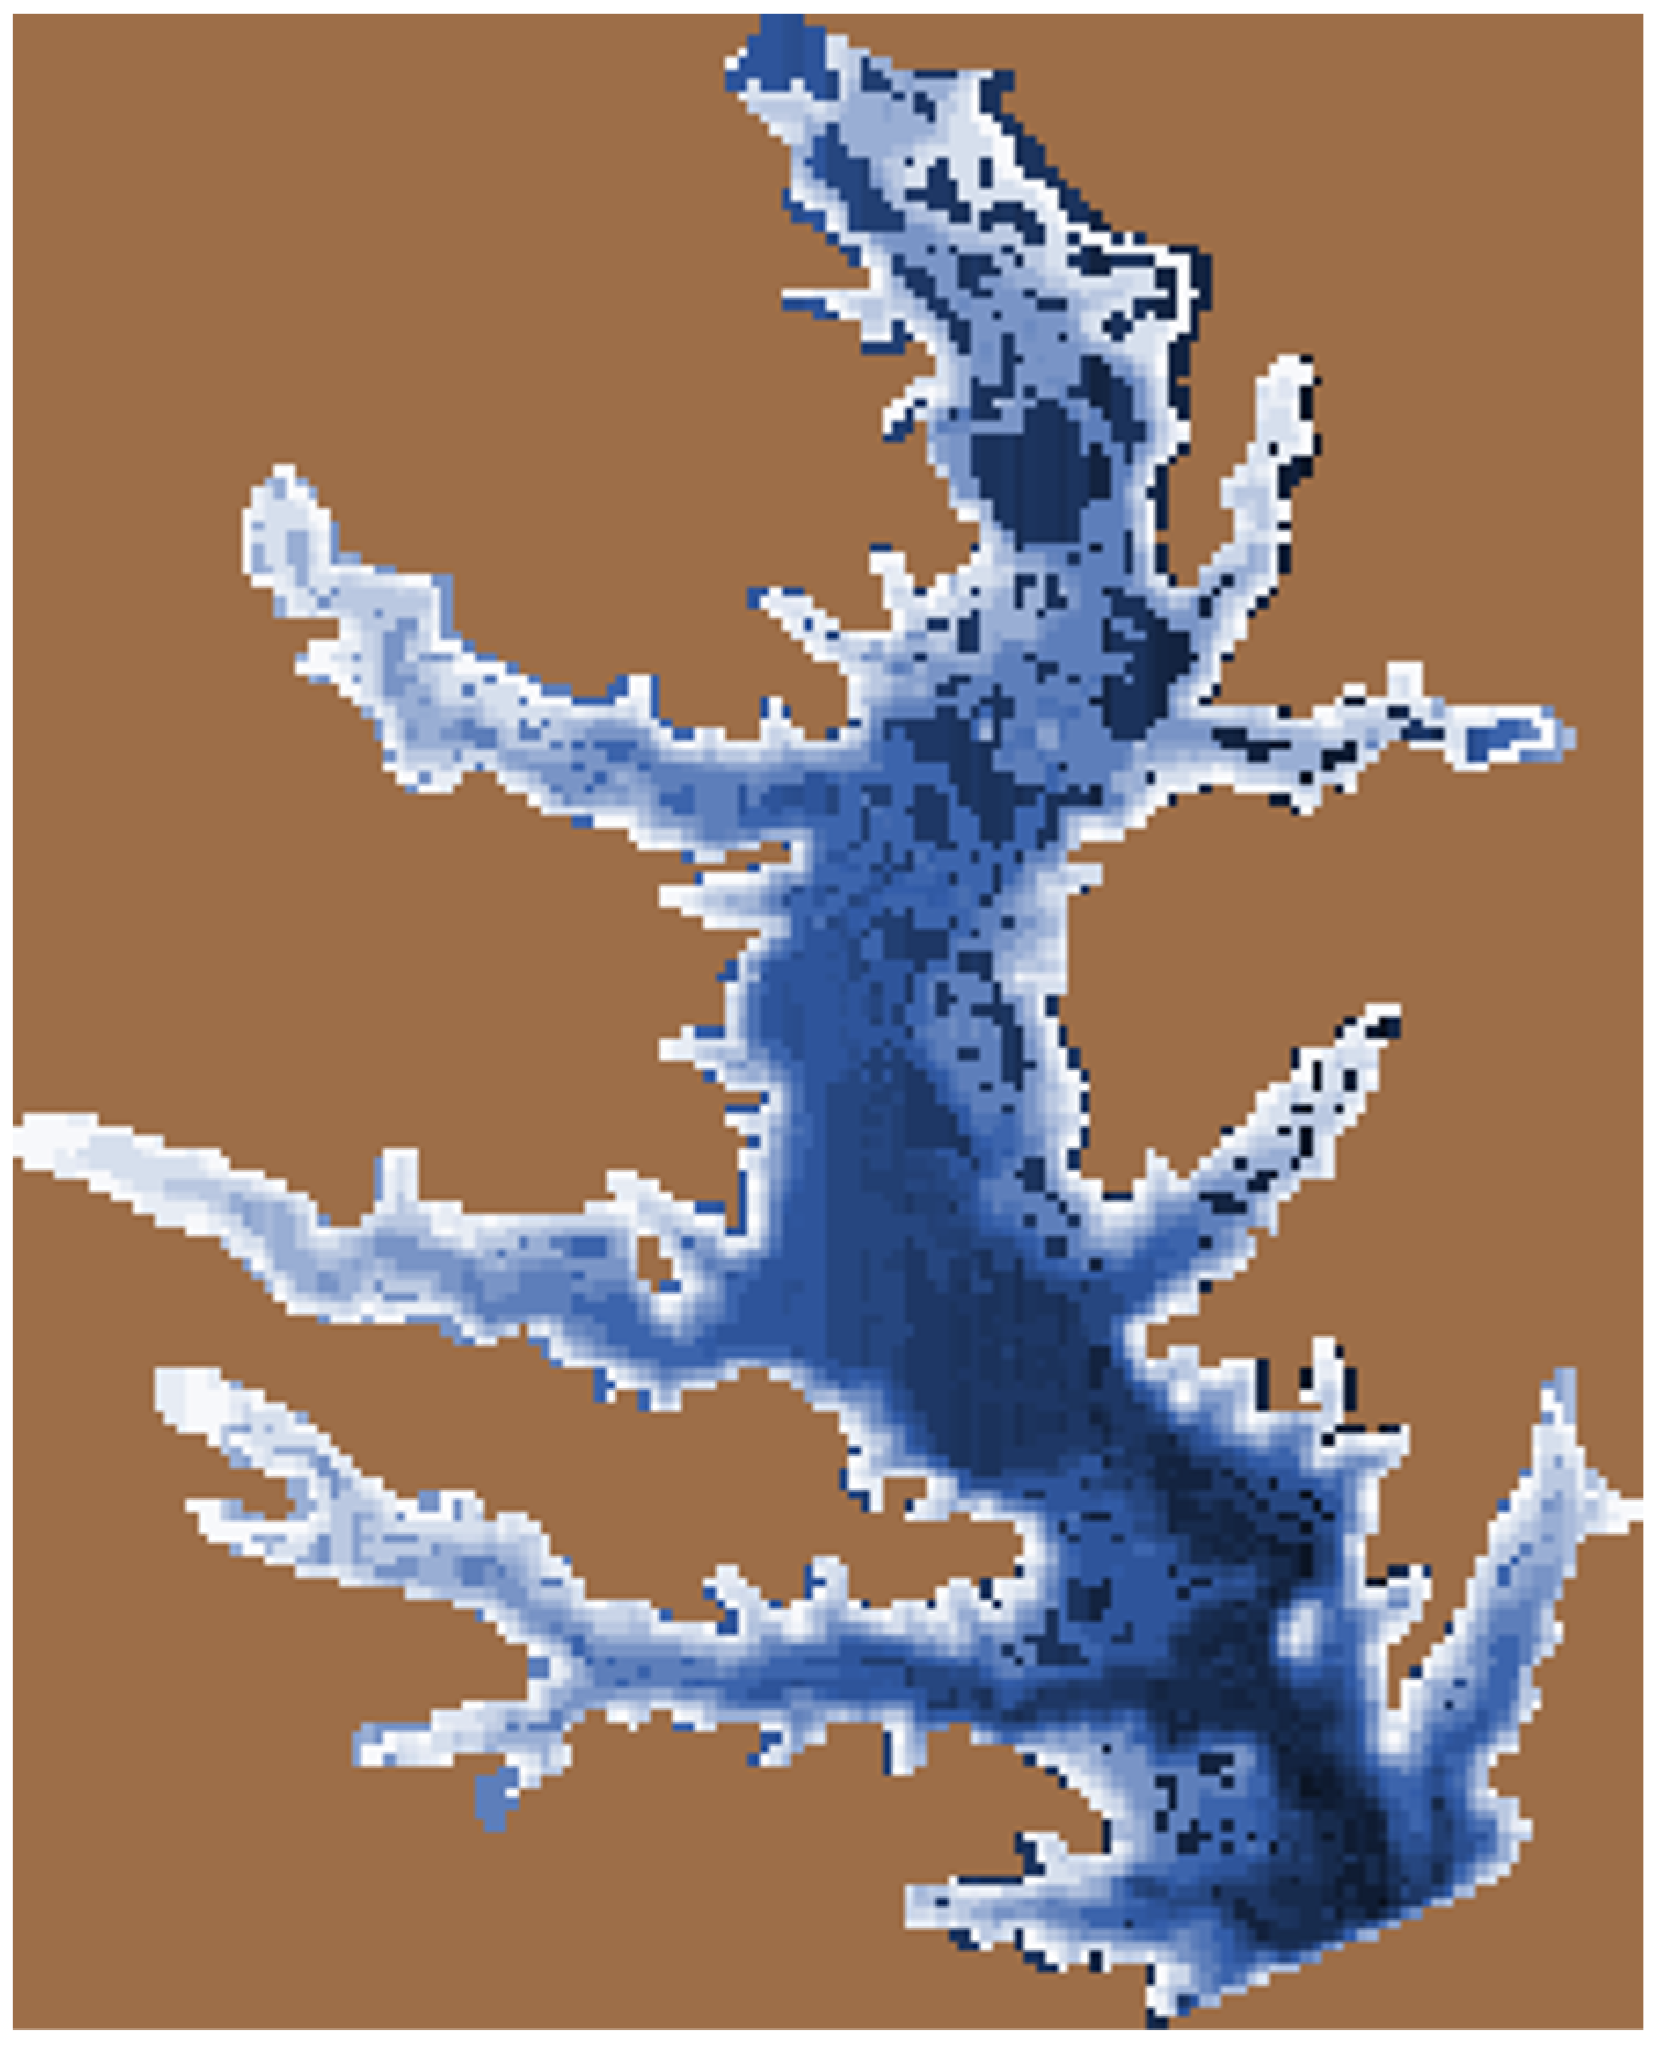
We developed a spatially explicit, agent-based model representing the invasion, growth, and senescence of aquatic weeds as functions of day length, water temperature, and water depth, as well as the response to biological control (Figure 1). As a case study to evaluate its potential utility, we parameterized the model to represent the invasion of Hydrilla in Lake Conroe, Texas, USA, and its subsequent biological control using grass carp. This infestation, which began just two years after the lake was impounded in 1973, is well documented [29]. We programmed the model in NetLogo 6.0.2 [38], representing the lake and a portion of the surrounding land area as a 148 × 183 lattice of 27,084, 1-ha patches, of which 9332 represented the lake proper (Figure 2). Input into the model included spatially explicit data on lake bathymetry [39], water depth [39], and time series of data representing day lengths [40] and water temperatures [39]. We parameterized daily rates of local (within habitat patches) growth and senescence of Hydrilla, consumption of Hydrilla by triploid grass carp, and growth of grass carp based on Santha et al. [21] (Table 1), and represented grass carp mortality as a daily probability of dying based on an annual mortality rate (32%) estimated by Chilton et al. [28]. Note that the use of diploid grass carp in Texas is now prohibited, although it has been used for aquatic vegetation control in the past [36]. Only triploid grass carp, a sterile form of this fish, has been permitted for use in the state since 1992, and, therefore, triploid grass carp were used in our model [41].
The model calculates the daily rates of invasion (spread among habitat patches) of Hydrilla based on the assumption that an uninvaded habitat patch will be invaded by an initial biomass of Hydrilla (α) if the density of Hydrilla in any of the eight neighboring patches has passed a threshold level (β), provided that the water depth in the uninvaded patch is <6 m [42,43]. Although many submerged plants require ≈15% sunlight penetration, Hydrilla requires only ≈1%, which occurs at ≈6 m in Lake Conroe [39]. The model also allows Hydrilla to re-sprout in habitat patches from which all biomass has been removed by herbivory, with an initial re-sprouting biomass equal to α, and a daily probability of re-sprouting (γ) that decreases by one-half after each extinction event. α, β, and γ are calibration parameters (see Section 2.3).
The model represents the daily foraging movements of grass carp based on the assumption that an individual will stay in a single habitat patch until there is no longer forage (Hydrilla) in that patch, at which time it will move to another patch. The individual first tries to randomly select from among the neighboring patches that contain forage. If none of the neighboring patches contain forage, the individual tries to randomly select from among the patches within a distance of 4 patch widths (400 m) and then 8 patch widths (800 m) that contain forage [44,45]. If none of these patches contain forage, the individual tries to randomly select from among the patches at any distance that contains forage. If none of the patches contain forage, the individual moves to a randomly selected patch with water.

2.3. Model Calibration

To calibrate the model, we drew upon a study describing the use of grass carp to control Hydrilla in Lake Conroe from 1979 to 1983 [46]. Following the initial Hydrilla invasion in 1975, approximately 270,000 grass carp (stocking weights ≈ 0.2–0.3 kg) were introduced to the lake in two large stocking events at 29 sites throughout the reservoir. A total of 166,835 fish were stocked in the fall of 1981, and 103,165 were stocked in the summer of 1982, which represented a stocking density of ≈74 fish per vegetated hectare. By 1983, two years after the first grass carp were stocked, no Hydrilla remained in the lake.
We ran a series of calibration simulations in which we initialized the coverage of Hydrilla to represent the spatial distribution of biomass observed in 1979 and simulated the time series of introductions of grass carp into the lake (mimicking the number and mean size released) during the period from October 1979 to October 1983 [46]. We calibrated α (initial invasion biomass), β (invasion threshold), and γ (probability of re-sprouting) such that the simulated spatial–temporal dynamics of Hydrilla resembled the observed pattern of the invasion as represented by the spatial distributions of Hydrilla reported in 1980 and 1981 [46].

2.4. Model Evaluation

To evaluate model performance with regard to the adequacy of the rules representing grass carp foraging movements, we compared simulated grass carp weights produced by the calibrated model with the weights reported for grass carp stocked in Lake Conroe in September 1981 and sampled in May 1982 [46]. Note that we did not calibrate parameters directly affecting grass carp consumption and growth rates (those representing effects of temperature and day length), which were based on Santha et al. [21]. However, simulated weights were also affected by foraging movements. Thus, the comparison of simulated observed weights provided an evaluation of the adequacy of these foraging rules.
To evaluate overall model performance, we drew upon a second study describing the use of grass carp from 2006 to 2007 to control a reinvasion of Hydrilla in Lake Conroe (Table 2) [28]. During this study, nearly 102,000 grass carp (stocking weights ≈ 0.2–0.3 kg) were stocked in the lake from March 2006 to November 2007. The stocking scheme differed from that used during the previous invasion. During the earlier invasion, fish were stocked in two large events to achieve a final stocking density of ≈74 fish per vegetated hectare. During the 2006–2007 control effort, fish were stocked in seven small events, with the initial stocking density estimated at ≈22 fish per vegetated hectare and the final stocking density estimated at ≈104 fish per vegetated hectare [28]. Despite repeated stockings over the 20-month period, the grass carp were unable to reduce the amount of Hydrilla in the lake. One hypothesis regarding the failure of the 2006–2007 control effort was that grass carp mortality, either during stocking events or subsequently due to predation, had been underestimated [28]. Eventually, Hydrilla coverage was reduced to roughly 40 acres by 2008 using an integrated pest management plan that included grass carp, herbicide, and planting of carp-resistant native plant species [28].
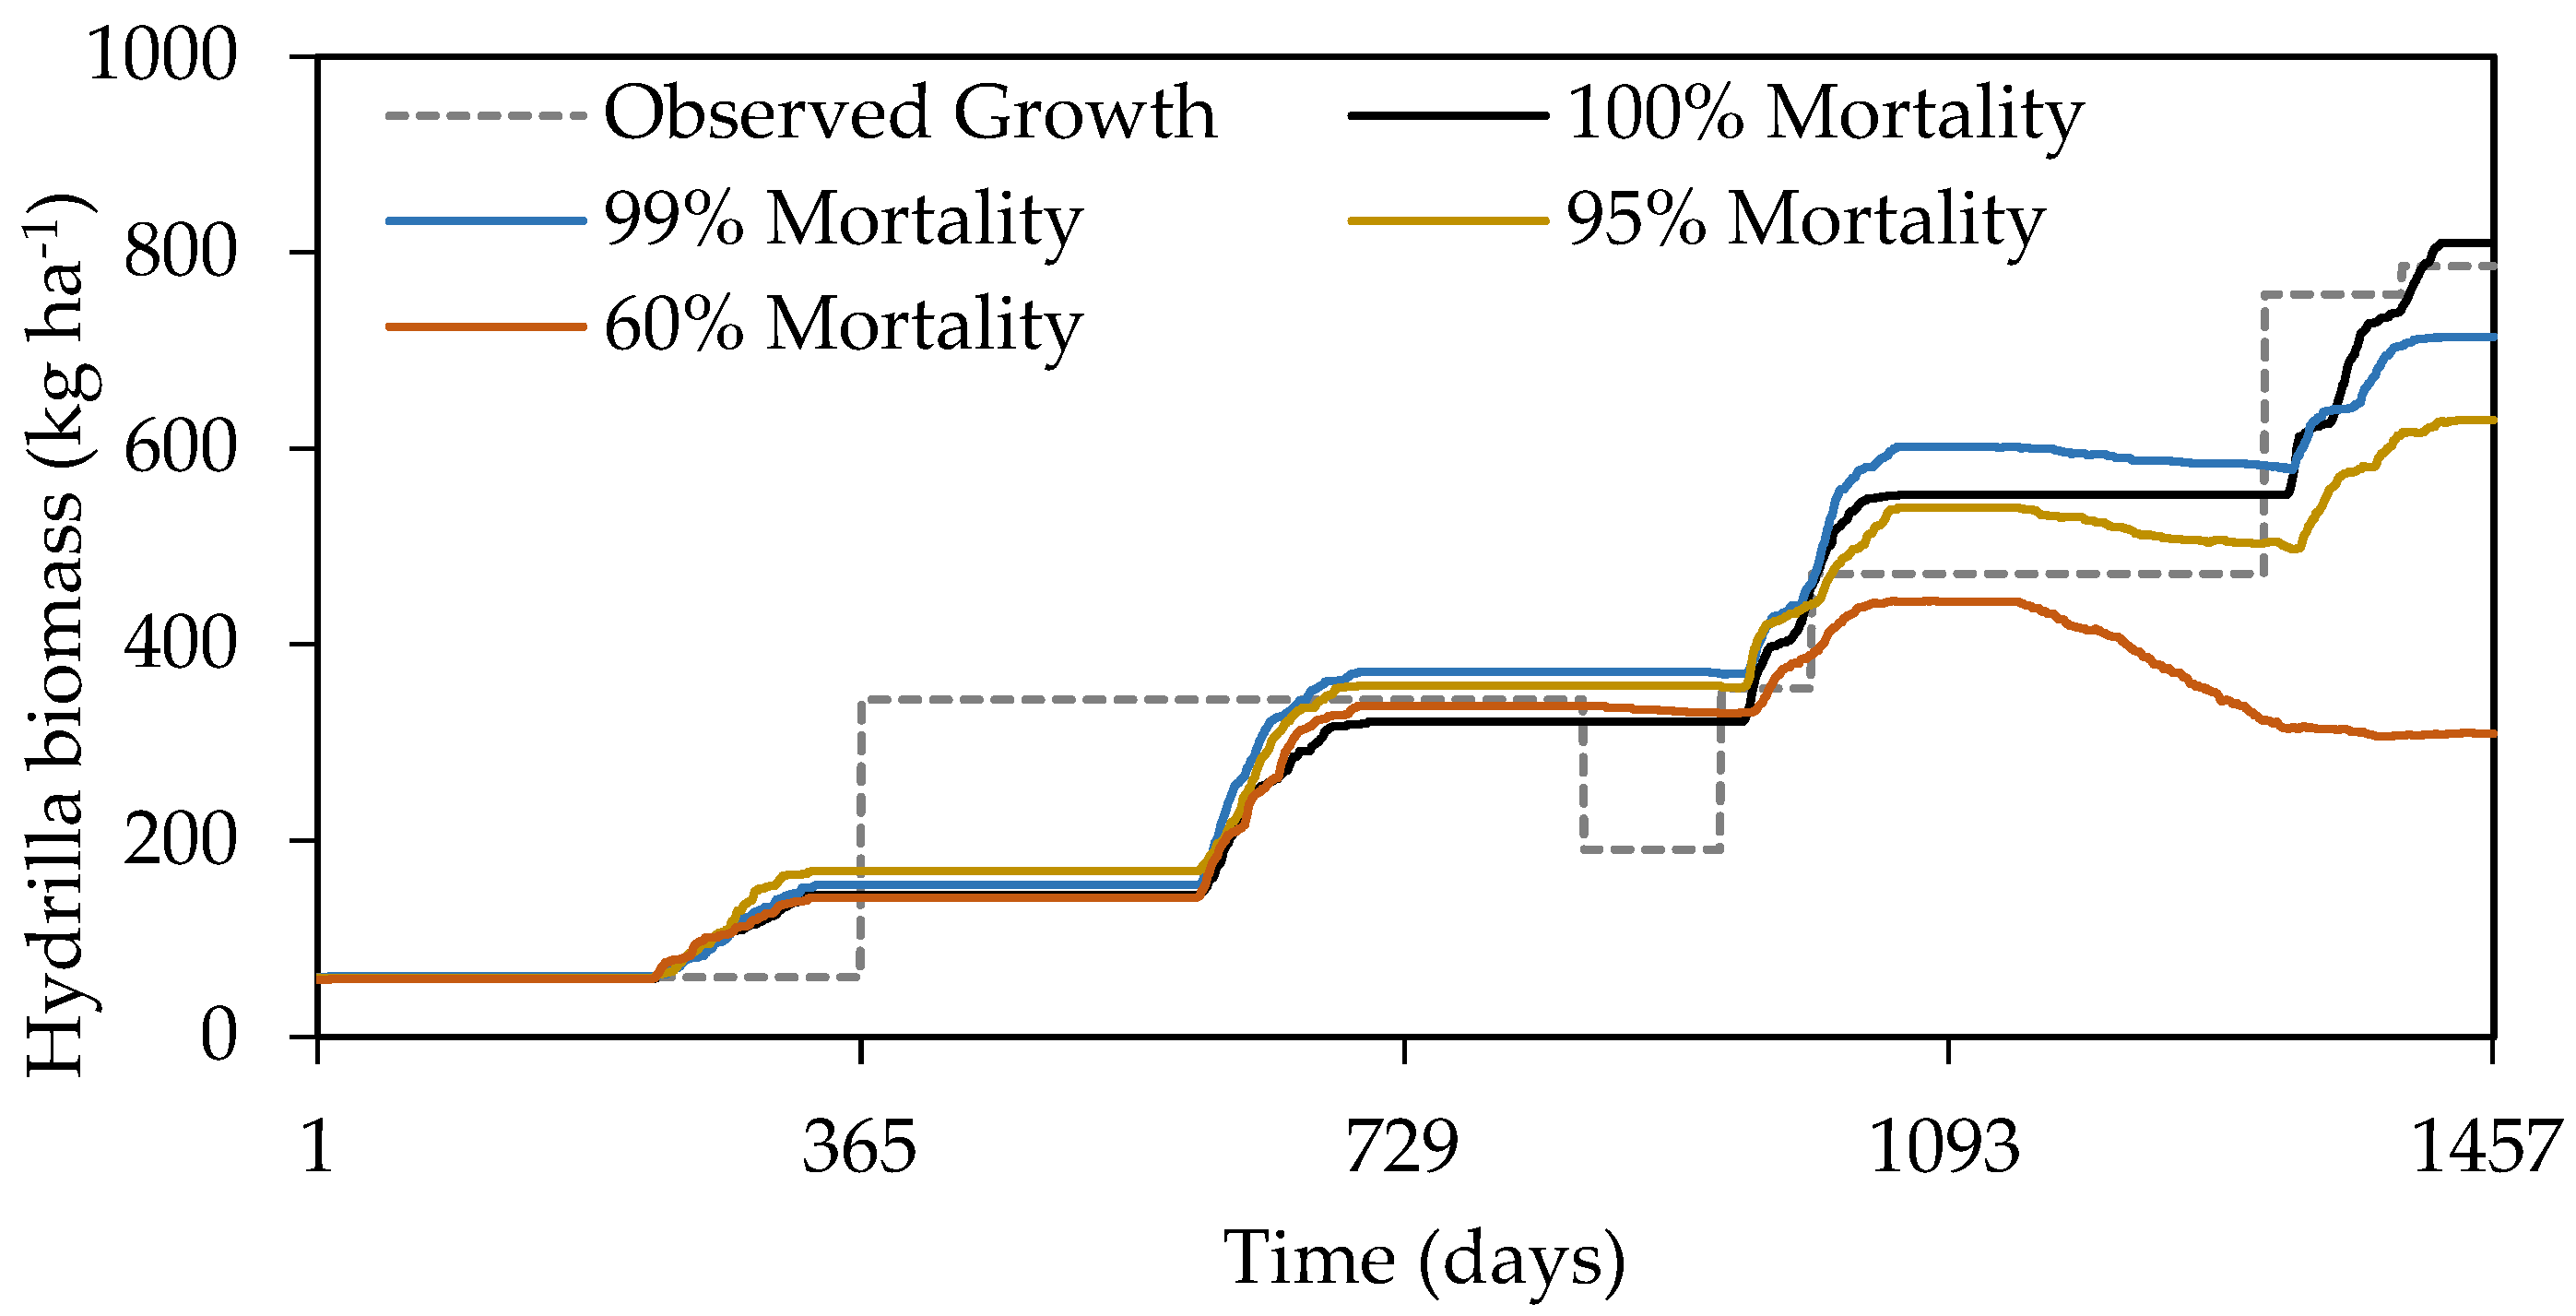
We evaluated the overall model performance by initializing the simulated coverage of Hydrilla to represent the coverage observed in 2004 [28] and simulating the time series of introductions of grass carp into the lake during the period from March 2006 to November 2007 [28]. We compared the simulated invasion pattern of Hydrilla with the pattern observed from 2004 to 2007 [28]. If the pattern did not match the observation, we would test the hypothesis to increase the grass carp mortality rate since previous studies had reported mortality rates as high as 62% [47] or 95% [48] due to stress from hauling and stocking, water temperatures, and predators. To test the hypothesis, we reran a series of simulations of the 2006–2007 control effort in which we increased annual grass carp mortality rates incrementally from 32% until the simulated Hydrilla invasion mimicked the field data.

2.5. Model Application

To demonstrate model use, we ran two sets of simulations exploring the effects of timing and magnitude of invasion control on control efficacy. In the first set, we varied the time between the discovery of a Hydrilla invasion and the stocking of grass carp, and in the second set, we varied the number of grass carp stocked (Figure 3). In the first set, we determined the number of grass carp that would need to be stocked to eradicate Hydrilla within four years of grass carp stocking, assuming the stocking occurred (1) six months, (2) one year, (3) or three years after an invasion. In the second set, we determined the number of grass carp that would need to be stocked to eradicate Hydrilla within (1) one, (2) three, or (3) five years after a Hydrilla invasion, assuming the stocking occurred one year after the invasion. We initialized each simulation with an invasion that covered 190 ha and no grass carp present and introduced grass carp (weighing 0.309 kg) only once during the simulation.

3. Results

3.1. Model Calibration and Evaluation

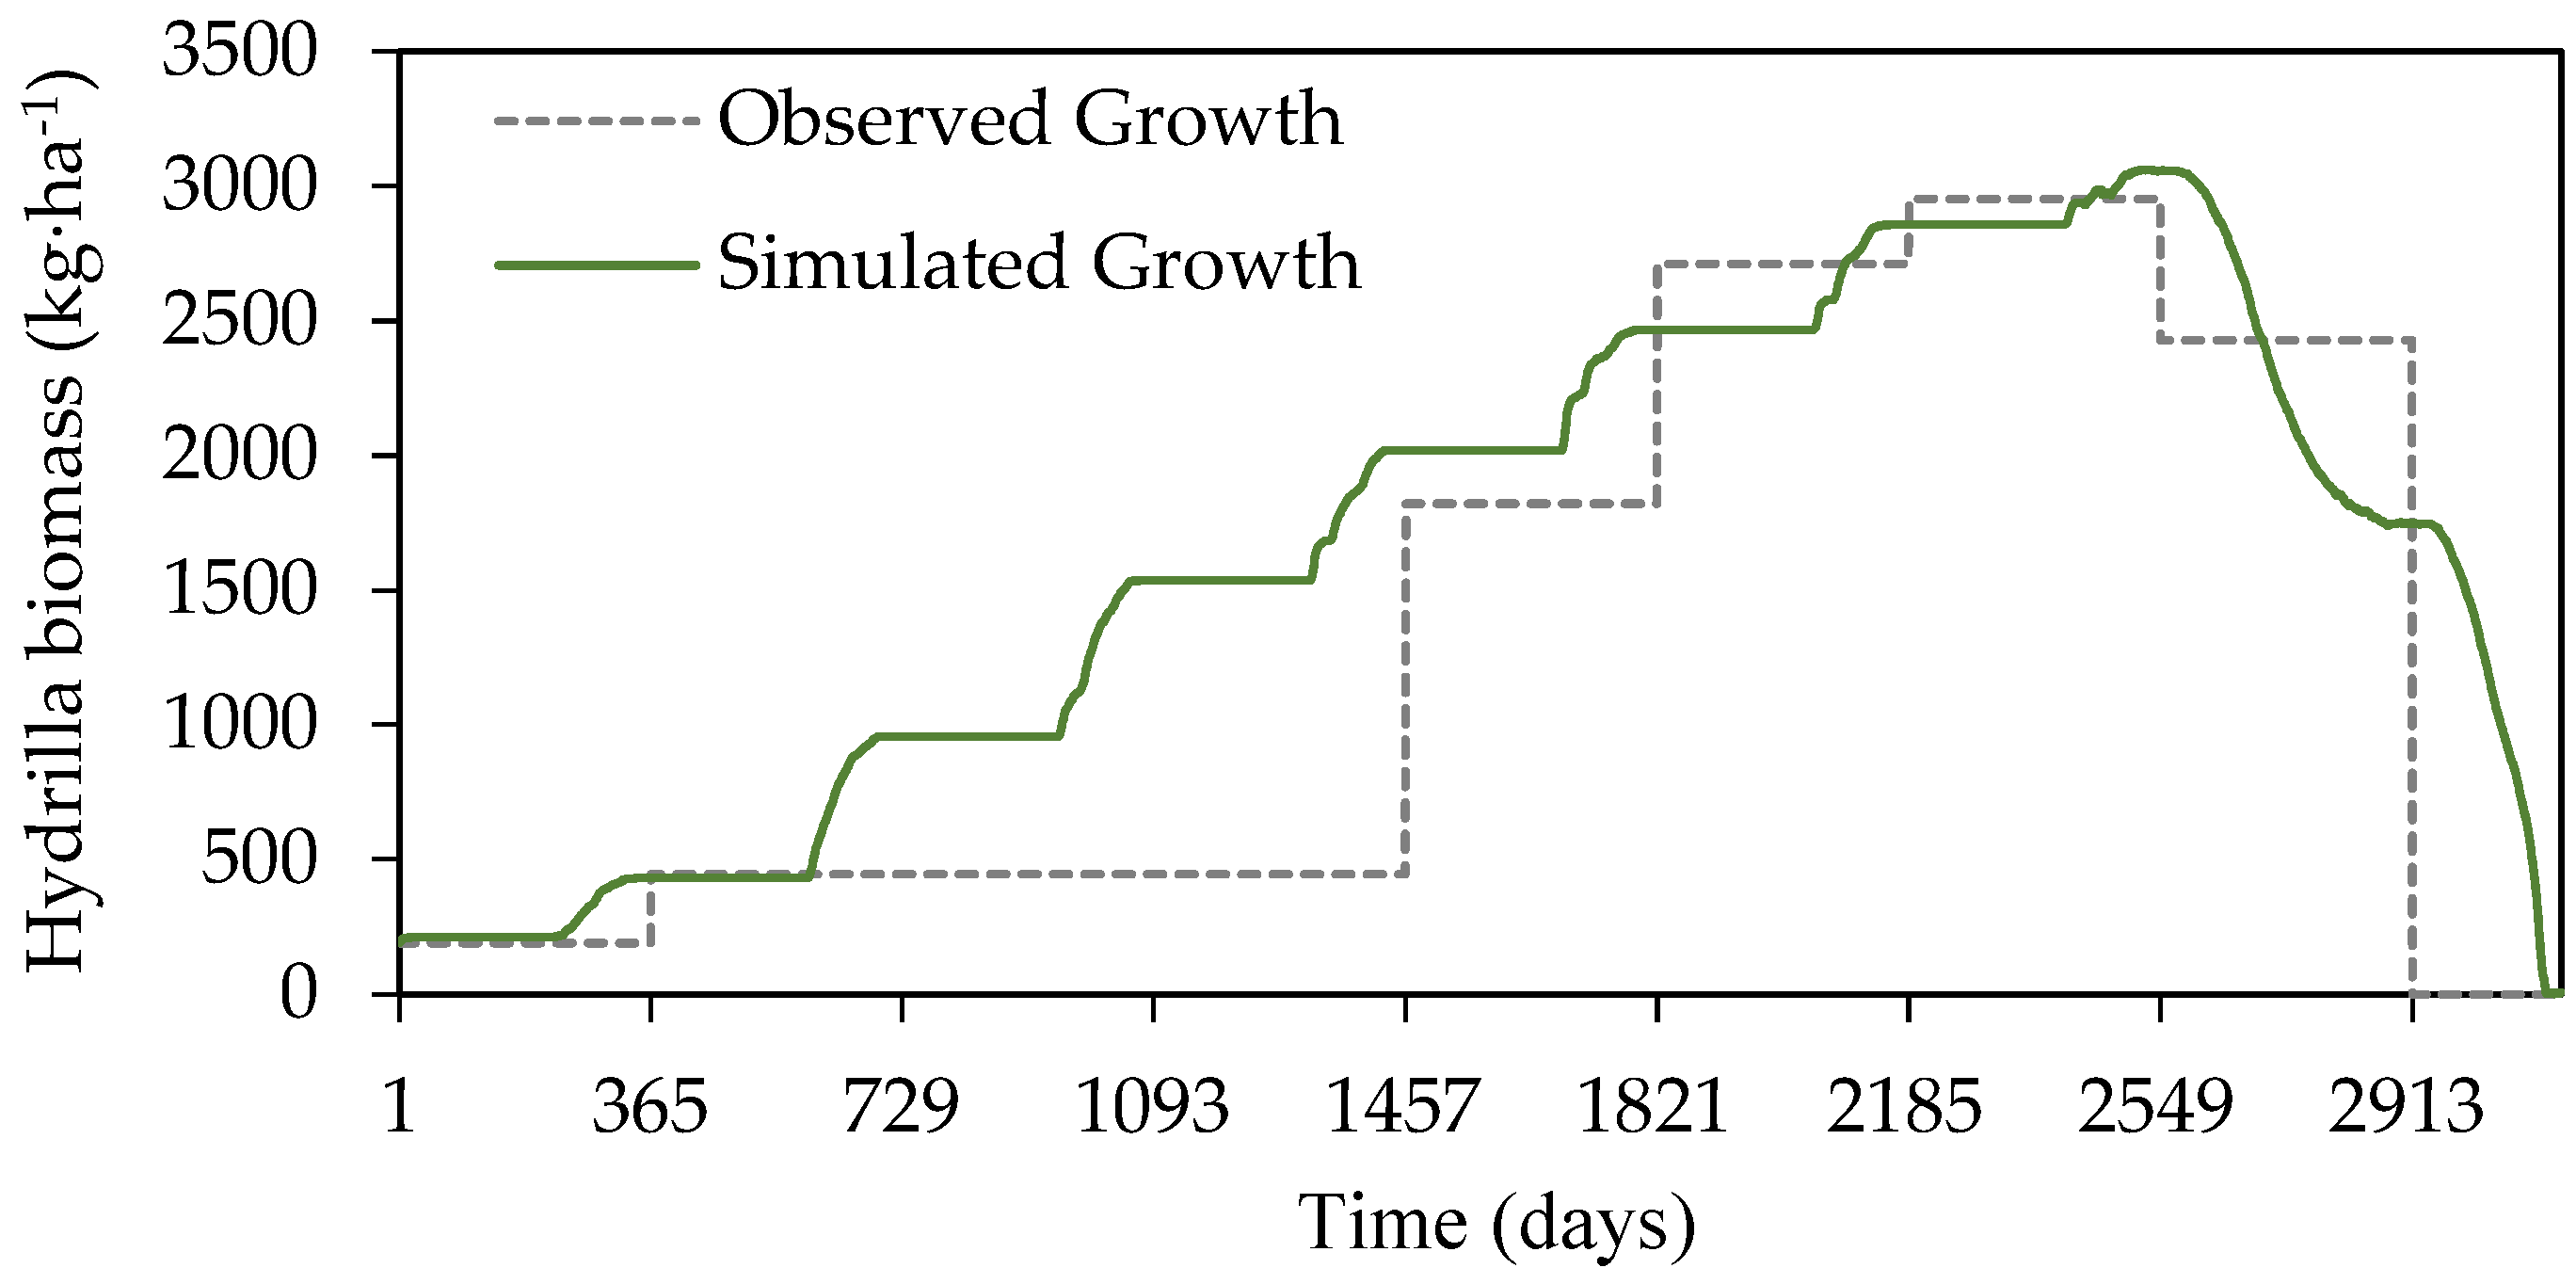
With α = 10,000 kg∙ha−1, β = 20,000 kg∙ha−1, and γ = 0.1, the simulated Hydrilla dynamics resembled those observed in the field, reaching peak biomass during the fall of 1981 and being completely eliminated from the lake by 1983 (Figure 4). Even though mean simulated weights were slightly lower than the observed weights, reaching ≈5.1 kg, it was still within the 95% confidence interval of weights observed in the field, which reached ≈5.6 kg [46]. Thus, the foraging rules were adequate.
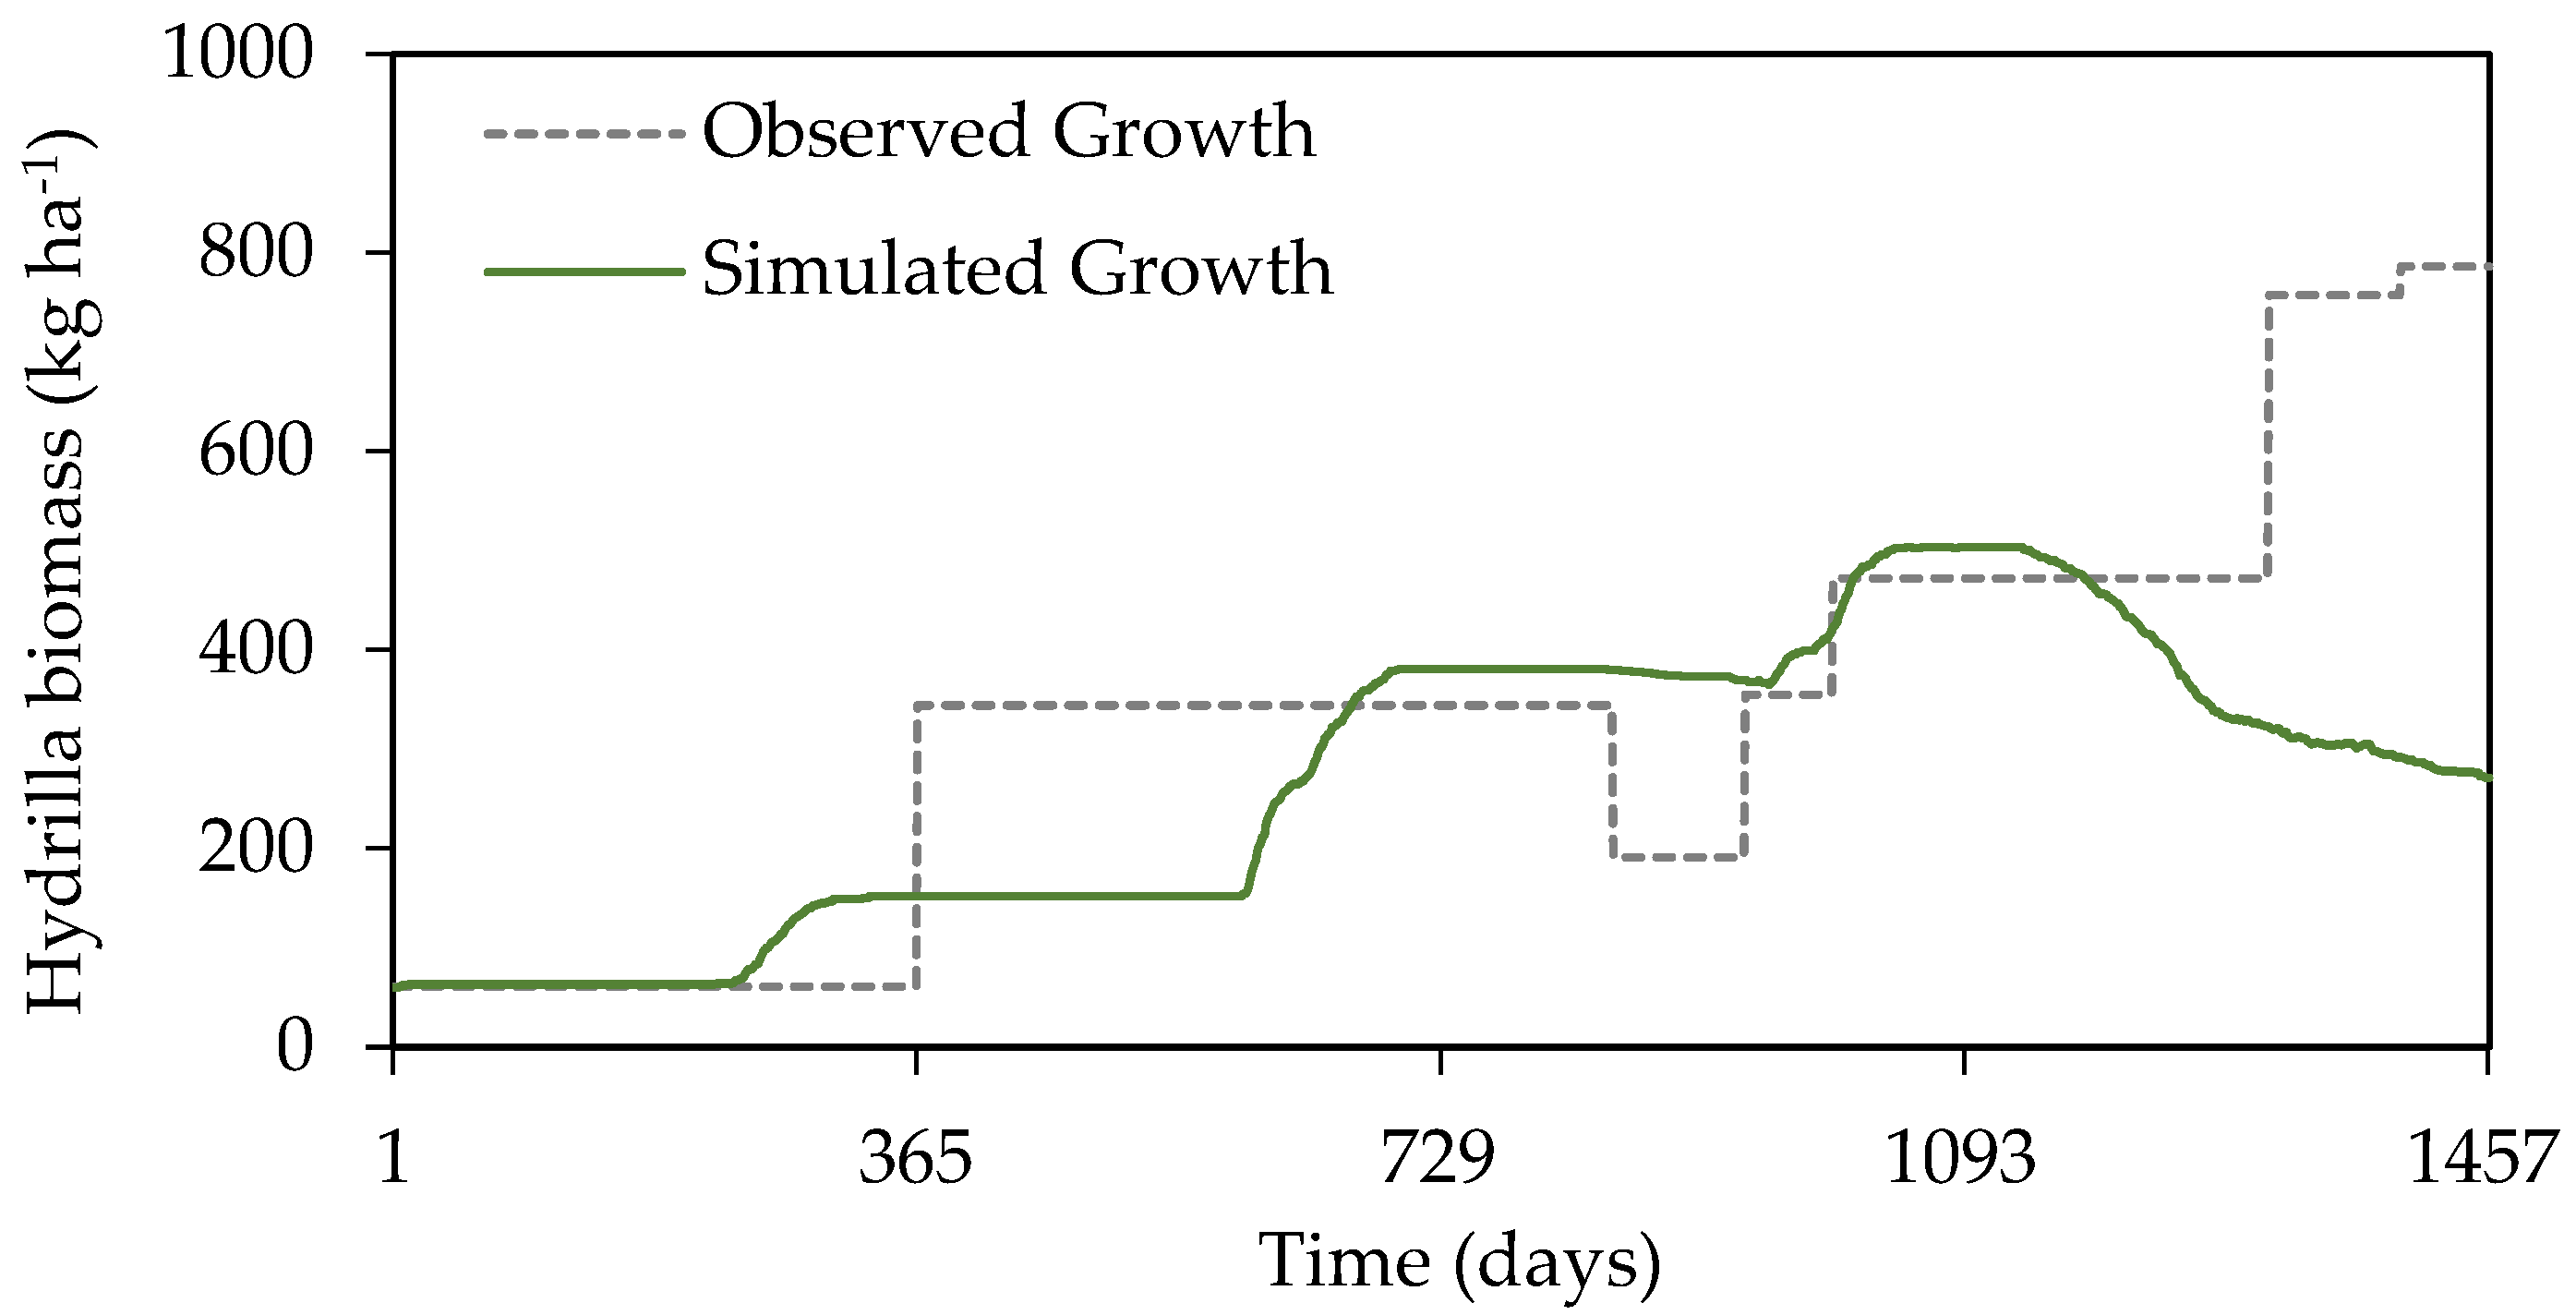
The simulated spatial–temporal dynamics of Hydrilla differed markedly from the observed pattern of the invasion when an annual mortality rate of 32% was used [28]. The simulated biomass of Hydrilla decreased as a result of the introduction of grass carp, whereas the observed biomass continued to increase despite the introduction of grass carp (Figure 5). However, simulations in which annual grass carp mortality rates exceeded 95% produced results most similar to the field data (Figure 6).

3.2. Model Application

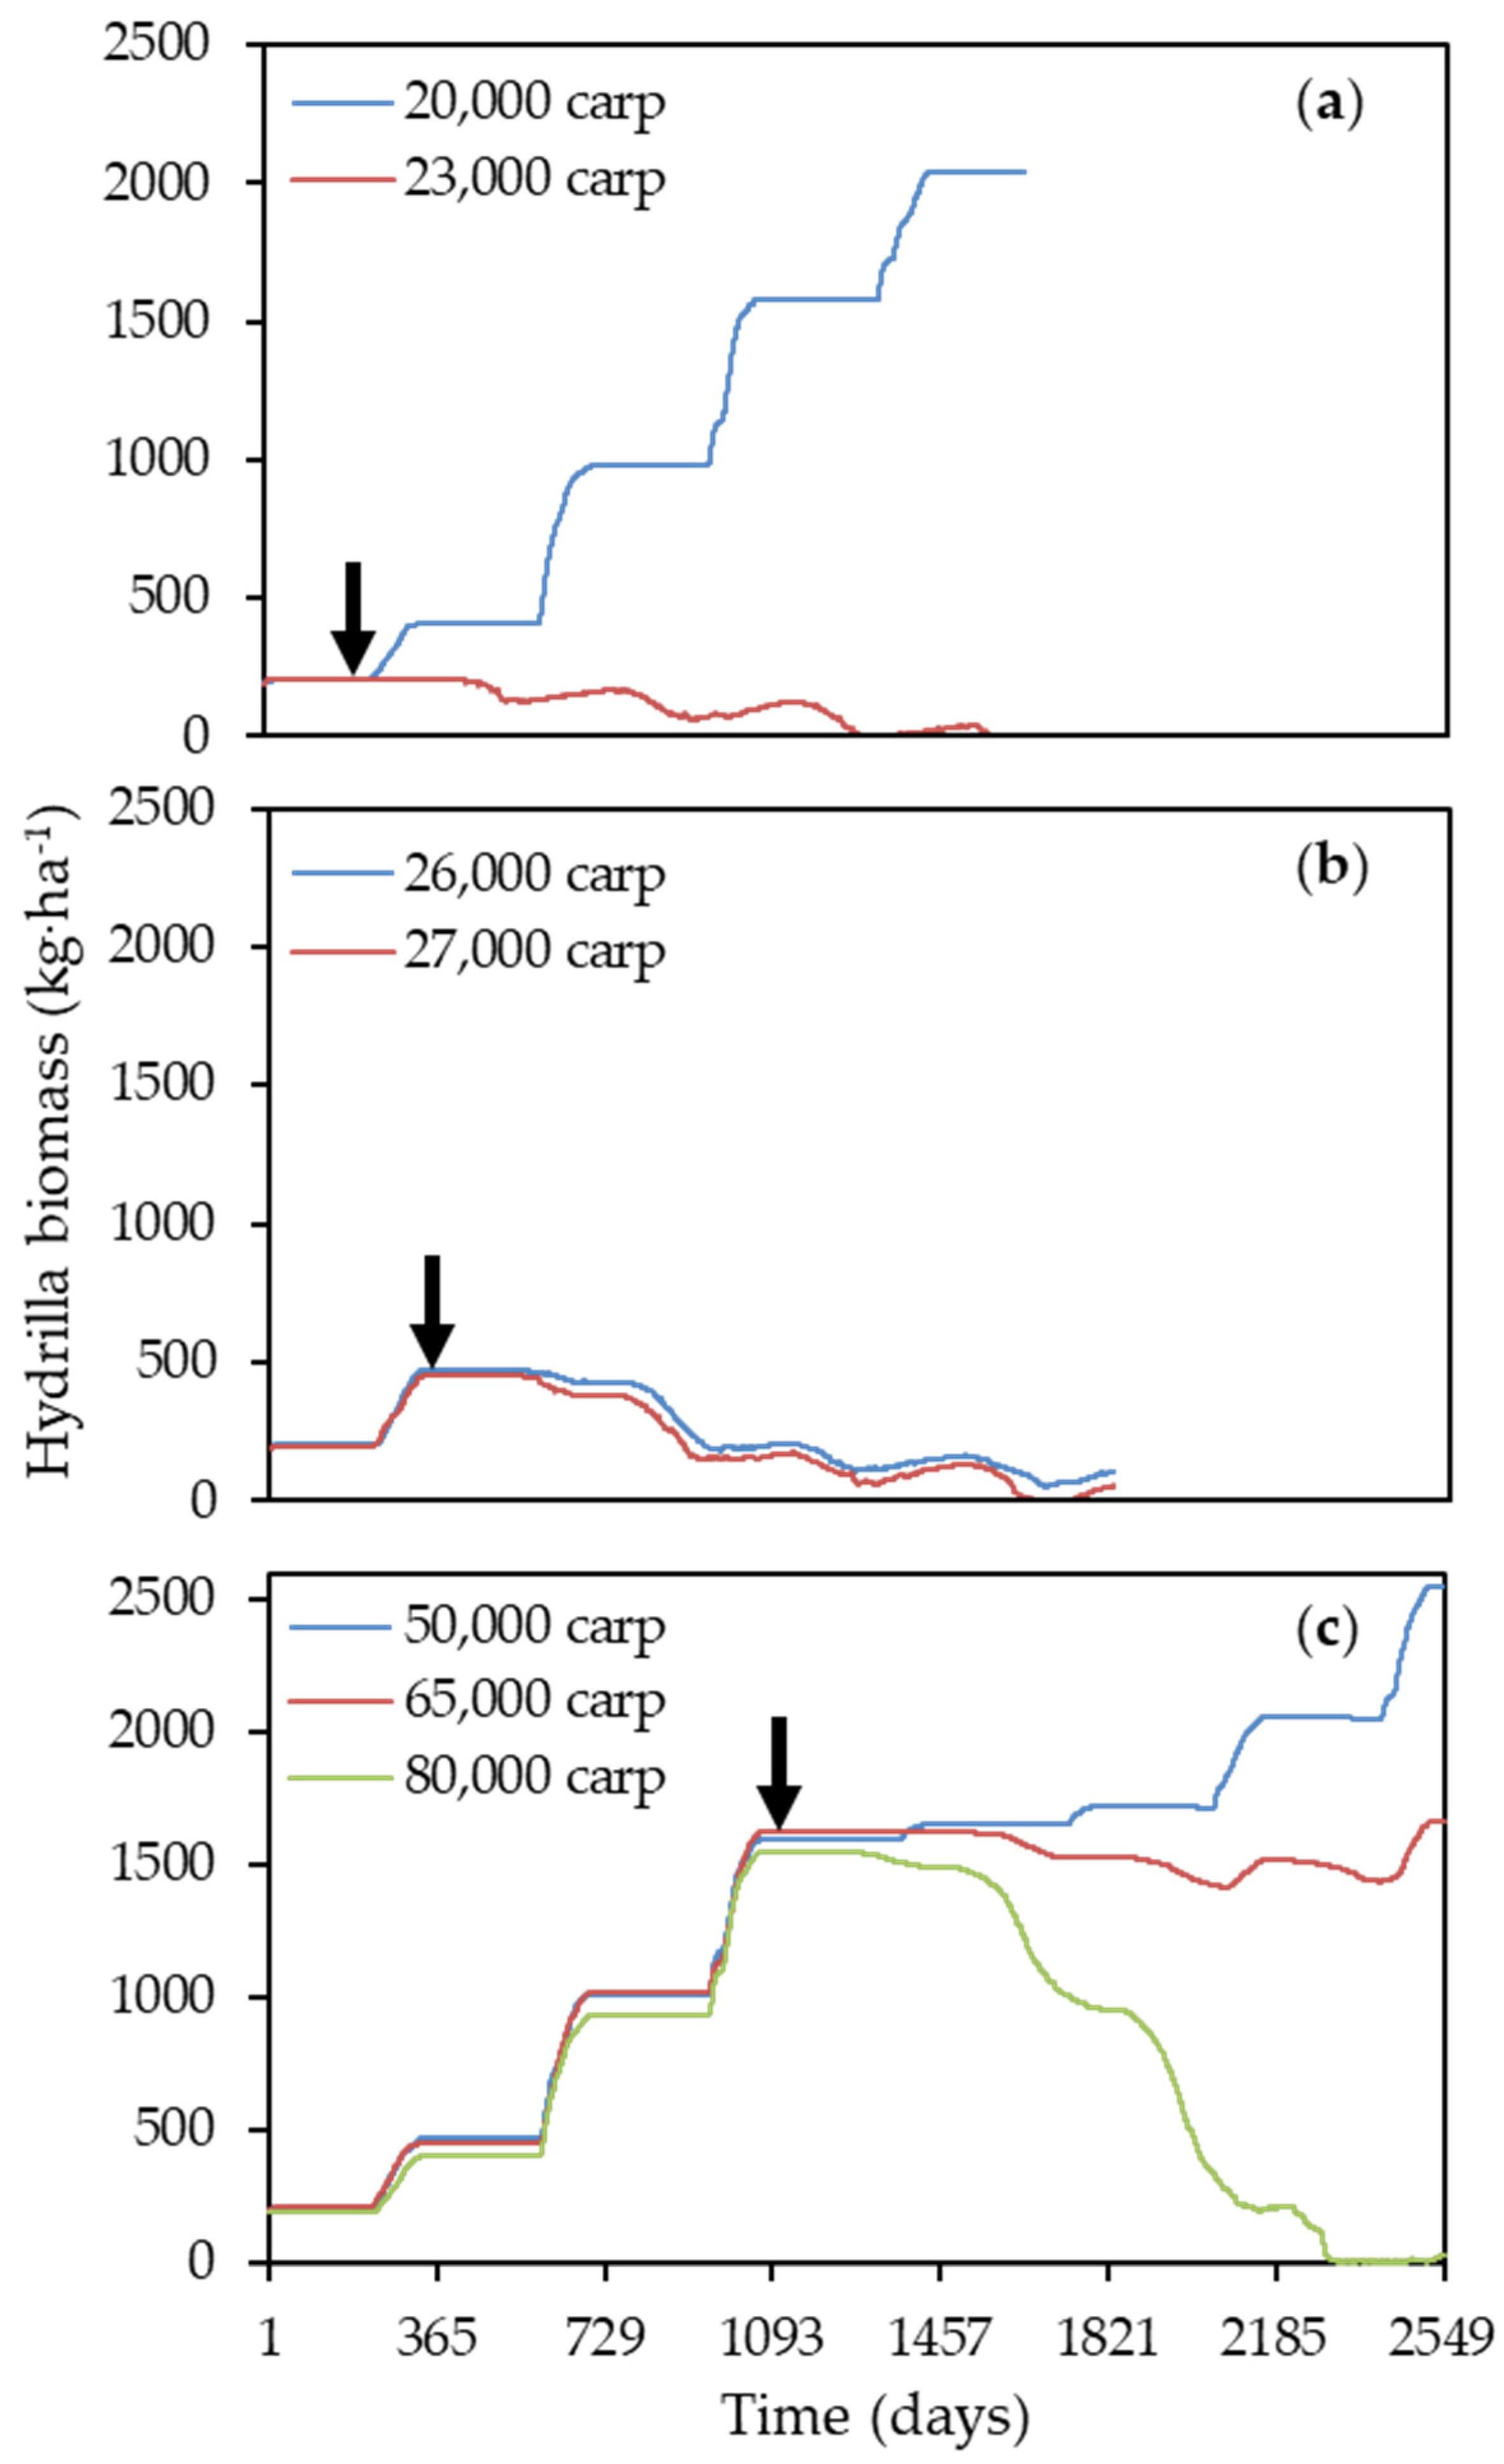
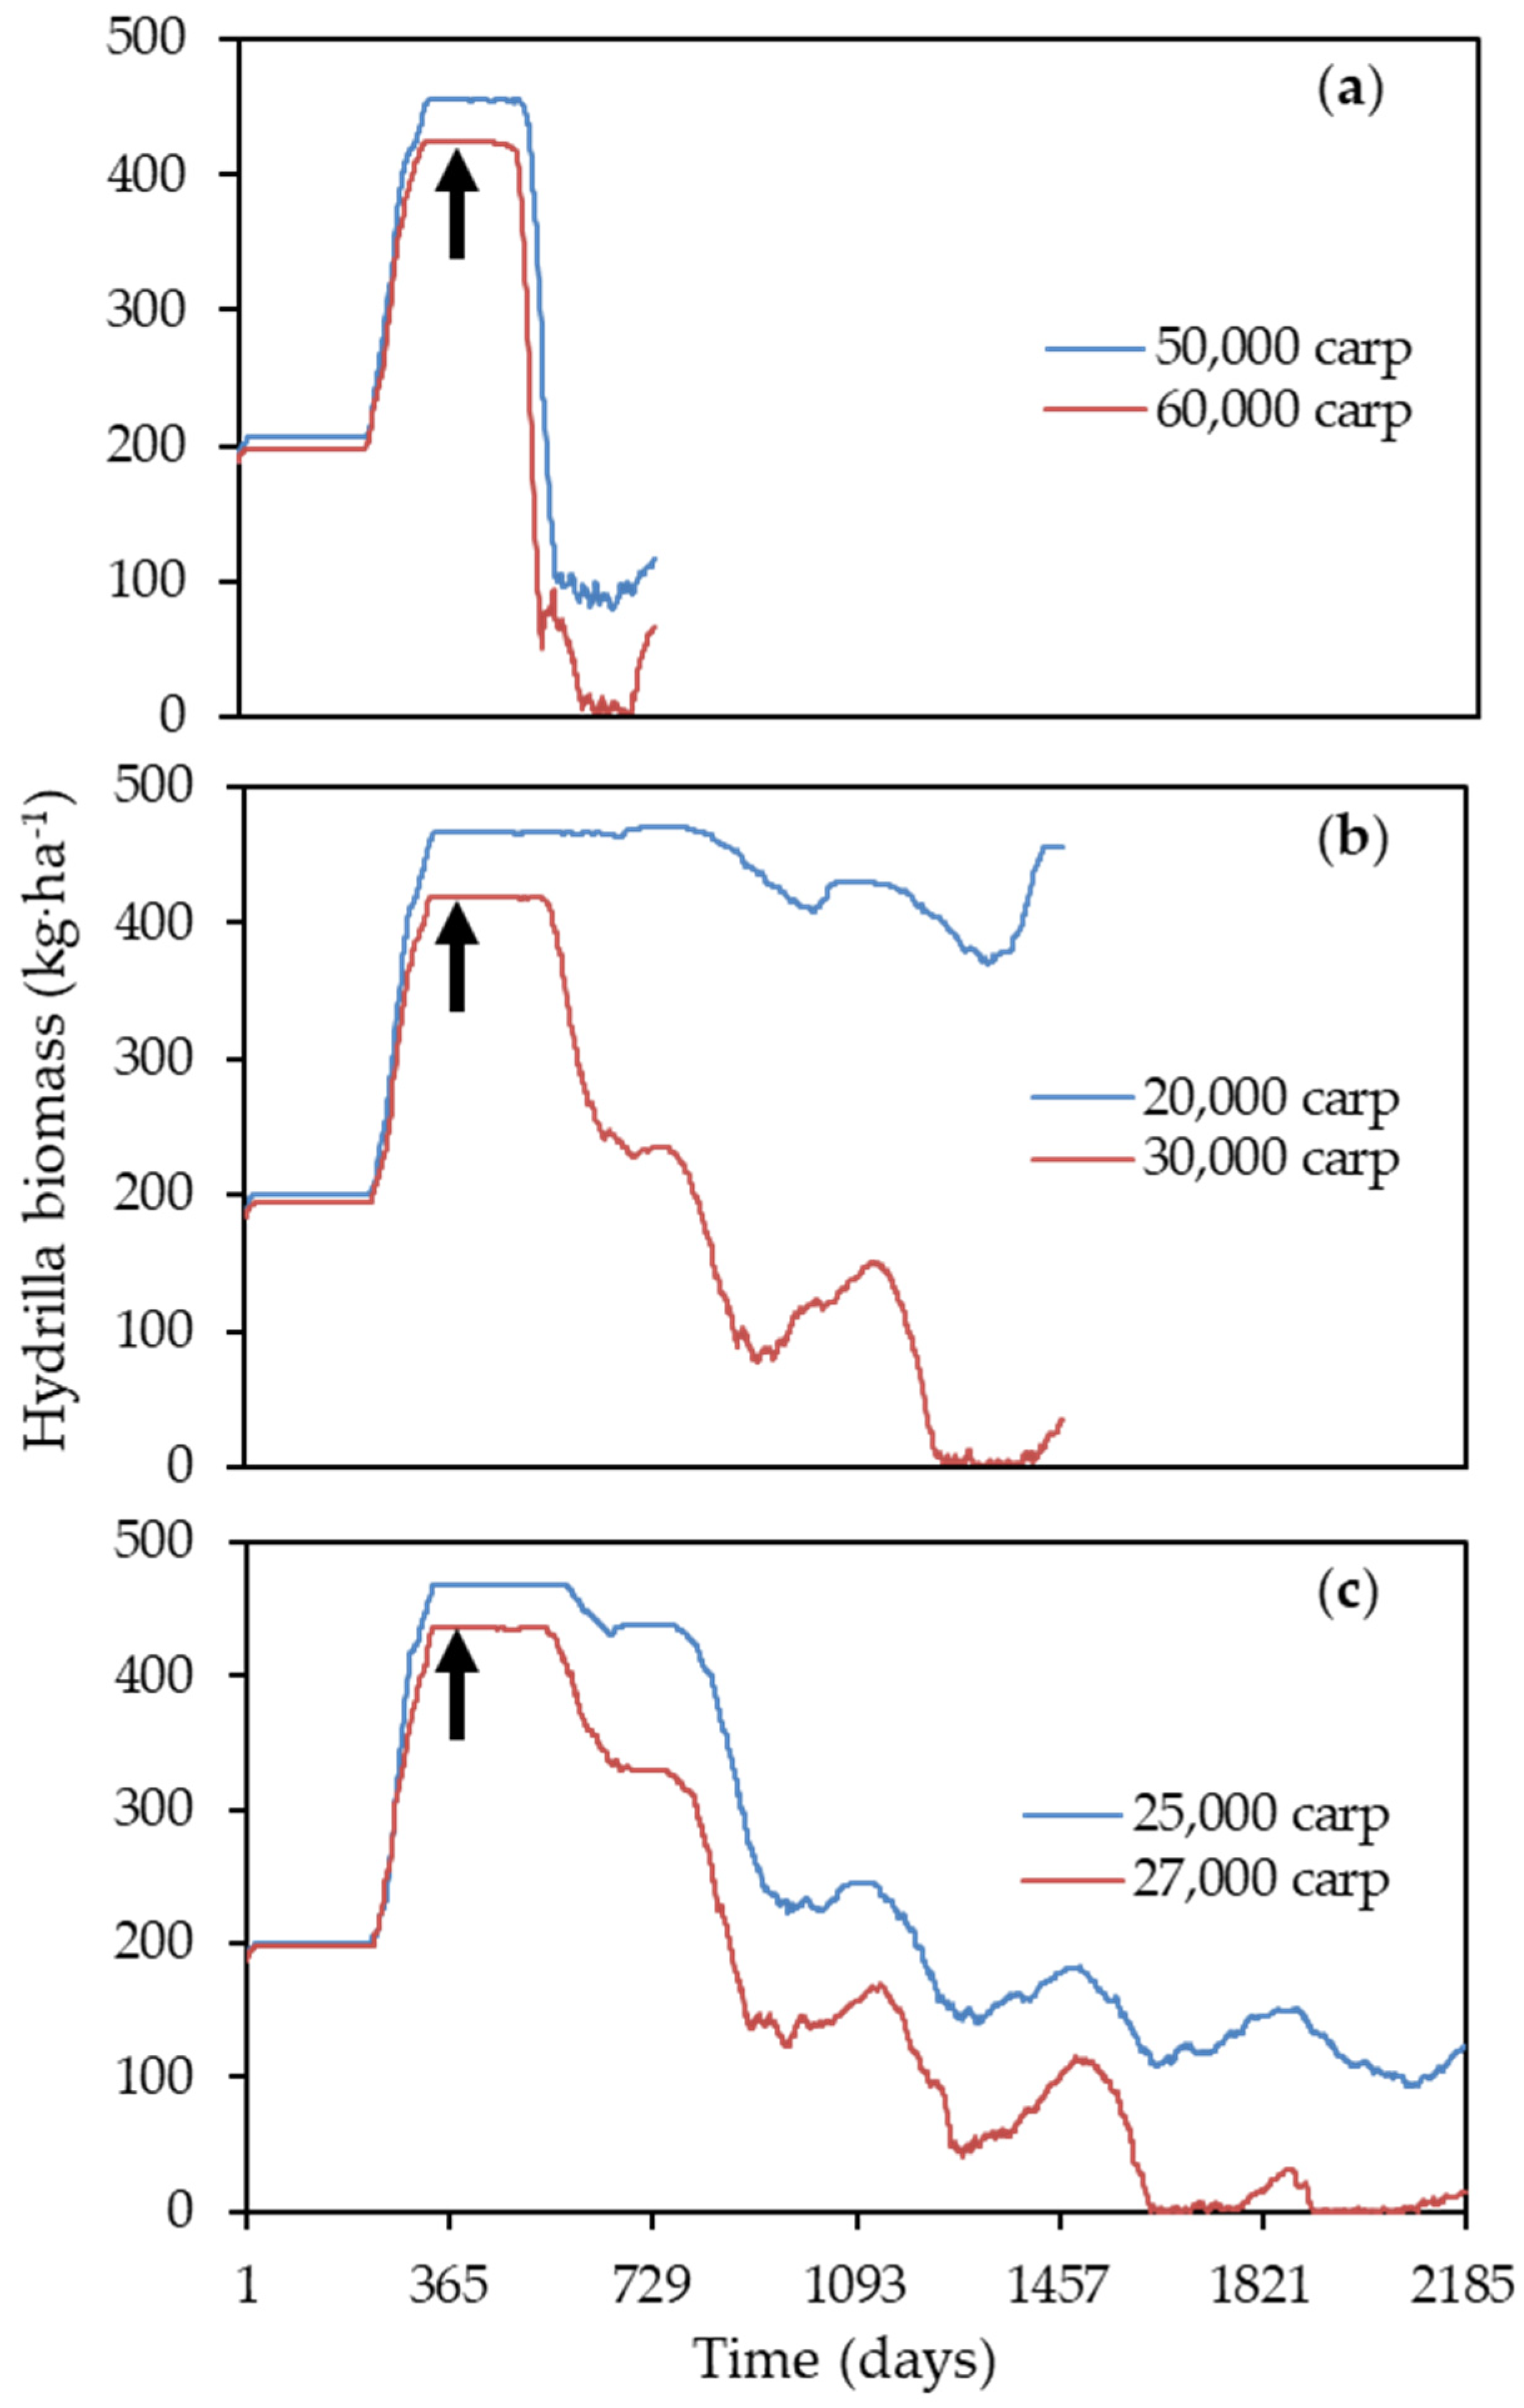
Simulated stocking densities needed to control Hydrilla increased as the lag time between initial invasion and grass carp stocking increased and decreased as the amount of time allowed to control the infestation increased. If grass carp were stocked six months, one year, or three years after the initial invasion, ≈23,000 (≈110 per vegetated hectare), ≈27,000 (≈66 per vegetated hectare), or ≈80,000 grass carp (≈56 per vegetated hectare), respectively, were needed to control the invasion within four years of stocking (Figure 7). Assuming stocking occurred one year after the invasion, if control was desired within one, three, or five years of stocking, ≈60,000 (≈141 per vegetated hectare) ≈30,000 (≈70 per vegetated hectare), or ≈27,000 grass carp (≈62 per vegetated hectare), respectively, were needed (Figure 8).
Results from both scenarios were modeled using a single stocking event in each simulation and represented immediate Hydrilla control; however, regrowth was experienced during some simulations after initial control was achieved. In order to achieve long-term Hydrilla control through the use of grass carp, additional grass carp stockings would likely be necessary due to grass carp mortality over time.

4. Discussion

Though the results described here are only applicable to the Hydrilla infestation at Lake Conroe, the adaptation of the model to suit other impoundments and vegetation types should be possible. All data used in the creation and evaluation of this model were easily obtained through open-access government websites and other readily available sources and produced realistic results. Thus, the model could provide a useful prototype for future aquatic plant invasion modeling, which might be utilized by lake managers, ecologists, state-level resource managers, and/or other stakeholders.
It is unknown why the 2006–2007 control efforts were not effective in reducing the amount of Hydrilla in Lake Conroe; however, it is plausible that mortality rates of grass carp during these stocking events were higher than rates listed in the report (annual mortality rate of 32%, or 2.7% per month) [28]. Although the actual cause is not known, increased mortality during stocking events or due to predation are both possible causes for the failure of grass carp to control the Hydrilla infestation. Stocking rates during the 2006–2007 control effort began at much lower rates than the recommended 74 fish per vegetated hectare and gradually increased with each stocking event. It is possible that predators living in the lake were able to eliminate large numbers of grass carp between stockings, drastically increasing the mortality rate and reducing the number of fish available to consume Hydrilla. While plausible, these potential causes remain speculative.
While results from our mortality simulations suggest nearly 100% grass carp mortality during the 2004 to 2006 control efforts, actual mortality rates may not have been so extreme. Other factors, in conjunction with an increased mortality rate, may have contributed to the observed pattern of Hydrilla growth. An increase in Hydrilla growth due to lake temperature changes or increased nutrients in the lake could have contributed to the unsuccessful control of the Hydrilla. This, of course, also remains speculative. Nonetheless, we believe these simulations could provide useful insight into recommendations for successful grass carp stocking in the future. One or two large stocking events, rather than multiple small stocking events, may lead to greater success in the control of AIP. If predation is indeed the main cause of fish mortality, larger stockings could overwhelm predators resulting in a lower overall mortality rate. If multiple smaller stocking events are preferred, however, managers would likely need to estimate a higher rate of grass carp mortality due to a lower predator-to-prey ratio.
The simulations described in this research demonstrated the basic use of the invasion model, which was parameterized to represent control of Hydrilla in Lake Conroe. However, the model may have the potential for use in a variety of other growth and management scenarios. Temperature is the main limiting factor for both plant and grass carp growth, as well as for grass carp consumption rates. Annual water temperature data could be manipulated to simulate extreme cold or warm years, as well as years with average temperatures, to determine the number of fish needed to control an infestation based on water temperatures in a given year. Another scenario could involve determining the number of fish needed to reduce the infestation without completely eliminating all vegetation. Managers or stakeholders may be reluctant to remove all aquatic vegetation due to the impact on fishing or other activities; thus, determining the density of fish needed to reduce but not eliminate vegetation could be useful. Additionally, various integrated pest management strategies could be simulated with the model. The use of herbicide treatment in conjunction with biological control or mechanical removal is often used to control AIP infestations; multiple control methods could be simulated to determine the combination that would be most effective.
Simulation models of aquatic plant invasion could be highly useful in testing various management techniques and in determining what technique, or combination of techniques, would be likely to produce the most effective AIP control. Management can be very costly, so the ability to simulate control techniques prior to the application could reduce expenses through decreased labor and a reduction in the total amount of control required. In addition, the model could be useful when interacting with managers or educating stakeholders on the importance of preventative measures. Visual representation of a potential infestation could be highly effective in conveying the importance of preventative actions and the serious consequences of an AIP infestation.
Future work in aquatic invasion modeling might include adapting the Lake Conroe Invasion Model for new geographic locations. Risk assessments that are modified for more specific geographical areas could have the potential to further increase accuracy by eliminating issues in categorization due to the inherent generality of data when the risk assessment is applied on a larger scale, as well as serve as a useful management tool for existing AIP.
The Lake Conroe Invasion Model also has the potential to be a useful tool if adapted for other water bodies and aquatic plant species. Managing large AIP infestations can be very costly, especially when testing various control options in the field to determine the most successful management strategy. Simulating aquatic plant invasion and management could be a more efficient method. Testing various control techniques prior to field application to determine the best course of action could reduce costs and result in more effective management in a shorter time period.
Finally, the future use of the invasion model could be useful as a preventive management tool. If the risk assessment was used to test non-native species in the area of interest, incipient invaders, or species that receive a “major invader” score in the risk assessment but currently exist in the area of interest only as adventive species, could be identified. Those incipient invaders could be simulated to reveal their potential growth patterns; varied environmental factors could result in invasive behavior not currently seen in the area of interest. Simulation results could help managers determine if preventative management efforts would be worthwhile to prevent a serious infestation in the future and, if so, determine the best course of action for effective management.
Managing aquatic plant invasions will be of increasing importance as the global trade of these plants grows and demands on the world’s freshwater resources increase. As the availability of non-native plants and the interest in water gardening and aquarium-keeping grows, so does the threat of new, potentially devastating invasions (Keller et al. 2007). Left unchecked, AIP will continue to grow and spread, disrupting ecosystems, decreasing biodiversity, limiting the amount of available freshwater, and increasing control costs. Adequate pre-entry screening could decrease costs from control efforts and loss of use of water bodies for commerce and recreation. Although the fight against AIP is daunting and, at times, can seem like fighting a losing battle, control of existing invasions coupled with proper pre-entry screening and the exclusion of potential new invasive species could be effective in stemming the tide of AIP.

Author Contributions

Conceptualization, E.E., H.-H.W., W.E.G. and M.M.; methodology, H.-H.W. and W.E.G.; software, H.-H.W. and W.E.G.; validation, E.E. and M.M.; formal analysis, E.E. and H.-H.W.; data curation, E.E.; writing—original draft preparation, E.E. and H.-H.W.; writing—review and editing, W.E.G. and M.M.; visualization, E.E. and H.-H.W. All authors have read and agreed to the published version of the manuscript.

Funding

Funding for this project was provided by the U.S. Geological Survey and the W.G. Mills Memorial Endowment through the grant number G11AP20108 to the Texas Water Resources Institute at Texas A&M AgriLife Research.

Institutional Review Board Statement

Not applicable.

Informed Consent Statement

Not applicable.

Data Availability Statement

The datasets generated and/or analyzed during the current study are available from the corresponding author on reasonable request.

Acknowledgments

Special thanks goes to the Texas Parks and Wildlife Department and the Lady Bird Johnson Wildflower Center for their help with study design and to the two anonymous reviewers for their time and effort.

Conflicts of Interest

The authors declare no conflict of interest.

References

  1. Simberloff, D.; Martin, J.-L.; Genovesi, P.; Maris, V.; Wardle, D.A.; Aronson, J.; Courchamp, F.; Galil, B.; García-Berthou, E.; Pascal, M. Impacts of biological invasions: What’s what and the way forward. Trends Ecol. Evol. 2013, 28, 58–66. [Google Scholar] [CrossRef] [PubMed] [Green Version]
  2. Chiou, C.-R.; Chen, Y.-J.; Wang, H.-H.; Grant, W.E. Predicted range expansion of the invasive plant Leucaena leucocephala in the Hengchun peninsula, Taiwan. Biol. Invasions 2016, 18, 381–394. [Google Scholar] [CrossRef]
  3. Wang, H.-H.; Koralewski, T.E.; McGrew, E.K.; Grant, W.E.; Byram, T.D. Species Distribution Model for Management of an Invasive Vine in Forestlands of Eastern Texas. Forests 2015, 6, 4374–4390. [Google Scholar] [CrossRef] [Green Version]
  4. Wang, H.-H.; Grant, W.E.; Teel, P.D.; Lohmeyer, K.H.; Pérez de León, A.A. Enhanced biosurveillance of high-consequence invasive pests: Southern cattle fever ticks, Rhipicephalus (Boophilus) microplus, on livestock and wildlife. Parasites Vectors 2020, 13, 487. [Google Scholar] [CrossRef]
  5. Luque, G.M.; Bellard, C.; Bertelsmeier, C.; Bonnaud, E.; Genovesi, P.; Simberloff, D.; Courchamp, F. The 100th of the world’s worst invasive alien species. Biol. Invasions 2014, 16, 981–985. [Google Scholar] [CrossRef]
  6. Zedler, J.B.; Kercher, S. Causes and consequences of invasive plants in wetlands: Opportunities, opportunists, and outcomes. Crit. Rev. Plant Sci. 2004, 23, 431–452. [Google Scholar] [CrossRef]
  7. Lovell, S.J.; Stone, S.F.; Fernandez, L. The economic impacts of aquatic invasive species: A review of the literature. Agric. Resour. Econ. Rev. 2006, 35, 195–208. [Google Scholar] [CrossRef] [Green Version]
  8. Pimentel, D.; Zuniga, R.; Morrison, D. Update on the environmental and economic costs associated with alien-invasive species in the United States. Ecol. Econ. 2005, 52, 273–288. [Google Scholar] [CrossRef]
  9. Eiswerth, M.E.; Donaldson, S.G.; Johnson, W.S. Potential environmental impacts and economic damages of Eurasian watermilfoil (Myriophyllum spicatum) in western Nevada and northeastern California. Weed Technol. 2000, 14, 511–518. [Google Scholar] [CrossRef]
  10. Adams, D.C.; Lee, D.J. Estimating the value of invasive aquatic plant control: A bioeconomic analysis of 13 public lakes in Florida. J. Agric. Appl. Econ. 2007, 39, 97–109. [Google Scholar] [CrossRef]
  11. Bianchini, I.; Cunha-Santino, M.B.d.; Milan, J.; Rodrigues, C.; Dias, J. Growth of Hydrilla verticillata (Lf) Royle under controlled conditions. Hydrobiologia 2010, 644, 301–312. [Google Scholar] [CrossRef]
  12. Owens, C.S.; Madsen, J.D.; Smart, R.M.; Stewart, R.M. Dispersal of native and nonnative aquatic plant species in the San Marcos River, Texas. J. Aquat. Plant Manag. 2001, 39, 75–79. [Google Scholar]
  13. Mony, C.; Koschnick, T.; Haller, W.; Muller, S. Competition between two invasive Hydrocharitaceae (Hydrilla verticillata (Lf)(Royle) and Egeria densa (Planch)) as influenced by sediment fertility and season. Aquat. Bot. 2007, 86, 236–242. [Google Scholar] [CrossRef]
  14. Thomaz, S.M.; Mormul, R.P.; Michelan, T.S. Propagule pressure, invasibility of freshwater ecosystems by macrophytes and their ecological impacts: A review of tropical freshwater ecosystems. Hydrobiologia 2015, 746, 39–59. [Google Scholar] [CrossRef]
  15. Anderson, L.G.; Dunn, A.M.; Rosewarne, P.J.; Stebbing, P.D. Invaders in hot water: A simple decontamination method to prevent the accidental spread of aquatic invasive non-native species. Biol. Invasions 2015, 17, 2287–2297. [Google Scholar] [CrossRef] [PubMed] [Green Version]
  16. Wang, H.-H.; Grant, W.E.; Swannack, T.M.; Gan, J.; Rogers, W.E.; Koralewski, T.E.; Miller, J.H.; Taylor, J.W. Predicted range expansion of Chinese tallow tree (Triadica sebifera) in forestlands of the southern United States. Divers. Distrib. 2011, 17, 552–565. [Google Scholar] [CrossRef]
  17. Wang, H.-H.; Grant, W.E.; Gan, J.; Rogers, W.E.; Swannack, T.M.; Koralewski, T.E.; Miller, J.H.; Taylor, J.W. Integrating spread dynamics and economics of timber production to manage Chinese tallow invasions in southern U.S. forestlands. PLoS ONE 2012, 7, e33877. [Google Scholar] [CrossRef] [Green Version]
  18. Wang, H.-H.; Grant, W.E.; Koralewski, T.E.; Elliott, N.C.; Brewer, M.J.; Westbrook, J.K. Where do all the aphids go? A series of thought experiments within the context of area-wide pest management. Agric. Syst. 2020, 185, 102957. [Google Scholar] [CrossRef]
  19. Wang, H.-H.; Grant, W.E.; Teel, P.D.; Lohmeyer, K.H.; Pérez de León, A.A. Simulated dynamics of southern cattle fever ticks (Rhipicephalus (Boophilus) microplus) in south Texas, USA: Investigating potential wildlife-mediated impacts on eradication efforts. Parasites Vectors 2021, 14, 231. [Google Scholar] [CrossRef]
  20. Van Nes, E.H.; Scheffer, M.; van den Berg, M.S.; Coops, H. Charisma: A spatial explicit simulation model of submerged macrophytes. Ecol. Model. 2003, 159, 103–116. [Google Scholar] [CrossRef]
  21. Santha, C.R.; Grant, W.; Neill, W.H.; Strawn, R.K. Biological control of aquatic vegetation using grass carp: Simulation of alternative strategies. Ecol. Model. 1991, 59, 229–245. [Google Scholar] [CrossRef]
  22. Sintes, T.; Moragues, E.; Traveset, A.; Rita, J. Clonal growth dynamics of the invasive Carpobrotus affine acinaciformis in Mediterranean coastal systems: A non-linear model. Ecol. Model. 2007, 206, 110–118. [Google Scholar] [CrossRef]
  23. Kelly, R.; Lundy, M.G.; Mineur, F.; Harrod, C.; Maggs, C.A.; Humphries, N.E.; Sims, D.W.; Reid, N. Historical data reveal power-law dispersal patterns of invasive aquatic species. Ecography 2014, 37, 581–590. [Google Scholar] [CrossRef] [Green Version]
  24. Jacobs, M.J.; Macisaac, H.J. Modelling spread of the invasive macrophyte Cabomba caroliniana. Freshw. Biol. 2009, 54, 296–305. [Google Scholar] [CrossRef] [Green Version]
  25. Van den Brink, P.J.; Baveco, J.M.; Verboom, J.; Heimbach, F. An individual-based approach to model spatial population dynamics of invertebrates in aquatic ecosystems after pesticide contamination. Environ. Toxicol. Chem. 2007, 26, 2226–2236. [Google Scholar] [CrossRef]
  26. Miller, J.K.; Roketenetz, L.; Garris, H. Modeling the interaction between the exotic invasive aquatic macrophyte Myriophyllum spicatum and the native biocontrol agent Euhrychiopsis lecontei to improve augmented management programs. BioControl 2011, 56, 935–945. [Google Scholar] [CrossRef]
  27. Herbert, M.E.; Gelwick, F.P.; Montgomery, W.L. Spatial variation of headwater fish assemblages explained by hydrologic variability and upstream effects of impoundment. Copeia 2003, 2003, 273–284. [Google Scholar] [CrossRef]
  28. Chilton, E.W.; Webb, M.A.; Ott, R.A. Hydrilla management in Lake Conroe, Texas: A case history. In Proceedings of the American Fisheries Society Symposium, Ottawa, ON, Canada, 18 August 2008; pp. 247–257. [Google Scholar]
  29. Smart, R.M.; Dick, G.; Doyle, R. Techniques for establishing native aquatic plants. J. Aquat. Plant Manag. 1998, 36, 44–49. [Google Scholar]
  30. Chadwell, T.B.; Engelhardt, K.A. Effects of pre-existing submersed vegetation and propagule pressure on the invasion success of Hydrilla verticillata. J. Appl. Ecol. 2008, 45, 515–523. [Google Scholar] [CrossRef]
  31. Barrat-Segretain, M.H. Biomass allocation in three macrophyte species in relation to the disturbance level of their habitat. Freshw. Biol. 2001, 46, 935–945. [Google Scholar] [CrossRef]
  32. Efremov, A.; Bolotova, Y.; Mesterházy, A.; Toma, C. Features of Distribution of Hydrilla verticillata (L. fil.) Royle (Hydrocharitaceae) in North Eurasia. J. Coast. Res. 2007, 34, 675–686. [Google Scholar] [CrossRef]
  33. EDDMapS. Hydrilla, Hydrilla verticillata (L. f.) Royle. In Early Detection & Distribution Mapping System; The University of Georgia: Athens, GA, USA, 2017; Available online: http://www.eddmaps.org/ (accessed on 30 July 2016).
  34. Michel, A.; Arias, R.S.; Scheffler, B.E.; Duke, S.O.; Netherland, M.; Dayan, F.E. Somatic mutation-mediated evolution of herbicide resistance in the nonindigenous invasive plant Hydrilla (Hydrilla verticillata). Mol. Ecol. 2004, 13, 3229–3237. [Google Scholar] [CrossRef] [PubMed]
  35. Dibble, E.D.; Kovalenko, K. Ecological impact of grass carp: A review of the available data. J. Aquat. Plant Manag. 2009, 47, 1–15. [Google Scholar]
  36. Chilton, E.W.; Muoneke, M.I. Biology and management of grass carp (Ctenopharyngodon idella, Cyprinidae) for vegetation control: A North American perspective. Rev. Fish Biol. Fish. 1992, 2, 283–320. [Google Scholar] [CrossRef]
  37. Cuda, J.; Charudattan, R.; Grodowitz, M.; Newman, R.; Shearer, J.; Tamayo, M.; Villegas, B. Recent advances in biological control of submersed aquatic weeds. J. Aquat. Plant Manag. 2008, 46, 15–32. [Google Scholar]
  38. Wilensky, U. NetLogo; Center for Connected Learning and Computer-Based Modeling, Northwestern University: Evanston, IL, USA, 1999; Available online: http://ccl.northwestern.edu/netlogo/ (accessed on 26 July 2016).
  39. TWDB. Volumetric Survey of Lake Conroe. Available online: http://www.twdb.texas.gov/hydro_survey/conroe/1996-04/ (accessed on 6 September 2016).
  40. USNO. Sun or Moon Rise/Set Table for One Year: U.S. Cities and Towns. Available online: http://aa.usno.navy.mil/data/index.php (accessed on 6 September 2016).
  41. Pipalova, I. A review of grass carp use for aquatic weed control and its impact on water bodies. J. Aquat. Plant Manag. 2006, 44, 1–12. [Google Scholar]
  42. Langeland, K.A. Hydrilla verticillata (LF) Royle (Hydrocharitaceae), “The Perfect Aquatic Weed”. Castanea 1996, 61, 293–304. [Google Scholar]
  43. Bowes, G.; Holaday, A.S.; Haller, W.T. Seasonal variation in the biomass, tuber density, and photosynthetic metabolism of Hydrilla in three Florida lakes. J. Aquat. Plant Manag. 1979, 17, 61–65. [Google Scholar]
  44. Bain, M.B.; Webb, D.H.; Tangedal, M.D.; Mangum, L.N. Movements and habitat use by grass carp in a large mainstream reservoir. Trans. Am. Fish. Soc. 1990, 119, 553–561. [Google Scholar] [CrossRef]
  45. Cassani, J.R.; Maloney, D. Grass carp movement in two morphologically diverse reservoirs. J. Aquat. Plant Manag. 1991, 29, 83–88. [Google Scholar]
  46. Klussmann, W.G.; Noble, R.L.; Martyn, R.D.; Clark, W.J.; Betsill, R.K.; Bettoli, P.W.; Cichra, M.F.; Campbell, J.M. Control of Aquatic Macrophytes by Grass Carp in Lake Conroe, Texas, and the Effects on the Reservoir Ecosystem; Texas Agricultural Experiment Station: College Station, TX, USA, 1983. [Google Scholar]
  47. Clapp, D.; Hestand, R., III; Thompson, B. Hauling and post-stocking mortality of triploid grass carp. J. Aquat. Plant Manag. 1994, 32, 41–43. [Google Scholar]
  48. Colle, D.E.; Shireman, J.V.; Rottmann, R.W. Food selection by grass carp fingerlings in a vegetated pond. Trans. Am. Fish. Soc. 1978, 107, 149–152. [Google Scholar] [CrossRef]
Figure 1. Conceptual model representing the growth and senescence of Hydrilla, the growth, and mortality of grass carp, and the consumption of Hydrilla by grass carp.
Diversity 14 01113 g001
Figure 2. Representation of Lake Conroe in the model within a 148 × 183 lattice of 27,084, 1-ha habitat patches.
Diversity 14 01113 g002
Figure 3. Diagrammatic representation of the two sets of simulations demonstrating use of the model. (a) Grass carp were stocked (1) six months, (2) one year, or (3) three years after invasion to determine the number that would be needed to eradicate Hydrilla within four years of stocking. (b) Grass carp were stocked one year after invasion to determine the number that would be needed to eradicate Hydrilla within (1) one, (2) three, or (3) five years after invasion.
Diversity 14 01113 g003
Figure 4. Comparison of biomass dynamics of Hydrilla simulated with the calibrated model to those observed in Lake Conroe from 1979 to 1983 [46].
Diversity 14 01113 g004
Figure 5. Comparison of simulated biomass dynamics of Hydrilla to those observed in Lake Conroe from 2004 to 2007 [46].
Diversity 14 01113 g005
Figure 6. Comparison of simulated biomass dynamics of Hydrilla in Lake Conroe assuming the indicated annual mortality rates for grass carp.
Diversity 14 01113 g006
Figure 7. Number of simulated grass carp needed to eradicate Hydrilla within four years of grass carp stocking, assuming stocking occurred (a) six months, (b) one year, or (c) three years after invasion. Black arrows denote when grass carp were stocked.
Diversity 14 01113 g007
Figure 8. Number of simulated grass carp needed to eradicate Hydrilla within (a) one, (b) three, or (c) five years after Hydrilla invasion, assuming stocking occurred one year after invasion. Black arrows denote when grass carp were stocked.
Diversity 14 01113 g008
Table 1. Equations used in the model to calculate daily rates of growth and senescence of Hydrilla, consumption of Hydrilla by grass carp, and growth of grass carp based on Santha et al. [21].
Growth of Hydrilla (Gh; kg fresh weight per ha per day):
G h = 0.03 × B h 1.07 × 10 6 × B h 2 × c
where Bh is the biomass of Hydrilla (kg fresh weight per ha), and c is a plant growth temperature coefficient:
c = 0.00004 × T 3 + 0.0016 × T 2 0.0127 × T 0.0127 when day length is increasing
c = 0.00008 × T 3 + 0.0043 × T 2 0.0303 × T 0.0378 when day length is decreasing
where T is the mean daily air temperature (°C).
Senescence of Hydrilla (Sh; kg fresh weight per ha per day):
S h = d × B h × e
where d is the degree–day senescence coefficient, and e is the senescence temperature coefficient:
d = 0.0090 when degree days accumulated since 1 April < 525
d = 0.0006 when degree days accumulated since 1 April ≥ 525
e = 0.00008 × T 3 + 0.0002 × T 2 0.2114 × T + 4.9429
Consumption (herbivory, H) of Hydrilla by grass carp (kg fresh weight of Hydrilla per grass carp per day):
H = 0.871 × W 0.27 × t c h × GC
where W is the live weight (kg) of an individual grass carp, GC is the number of grass carp in the system, and tch is an herbivory rate temperature coefficient:
t c h = 0.00016 × T 3 + 0.00802 × T 2 0.05481 × T 0.16066 when day length is increasing
t c h = 0.00005 × T 3 0.0008 × T 2 + 0.1444 × T 1.3646 when day length is decreasing
Growth (Gc) of grass carp (kg live weight per day):
G c = 0.013 × H when T ≥ 11 °C
G c = M when T < 11 °C
Where M is maintenance costs (kg live weight per day):
M = 0.0021 × W 0.645
Table 2. Summary of the scheme used to stock grass carp into Lake Conroe from March 2006 to November 2007, including the cumulative numbers stocked and the estimated cumulative stocking densities [28]. Numbers of fish surviving were calculated based on an estimated annual mortality rate of 32% [28].
DateNumber of Grass Carp StockedCumulative Number StockedNumber of
Surviving Fish
Stocking Rate (N/ha)
March 200643304330430022.5
August 2006931113,64113,06436.8
October 200613,80027,44126,16856.6
February 200710,00037,44133,37670.7
August 200723,38660,82754,98372.6
August 200725,36486,19171,73599.8
November 200715,575101,76681,564103.8
Publisher’s Note: MDPI stays neutral with regard to jurisdictional claims in published maps and institutional affiliations.