Article

Dietary Variation Is Driven by Landscape Heterogeneity in an Insular Omnivorous Endemic Lizard, Revealed by DNA Metabarcoding

by
Catarina Rato
1,2,*,
Thomas Dellinger
1,2,3 and
Miguel A. Carretero
1,2,4
1
CIBIO, Centro de Investigação em Biodiversidade e Recursos Genéticos, InBIO Laboratório Associado, Campus de Vairão, Universidade do Porto, 4485-661 Vairão, Portugal
2
BIOPOLIS Program in Genomics, Biodiversity and Land Planning, CIBIO, Campus de Vairão, 4485-661 Vairão, Portugal
3
Estação de Biologia Marinha do Funchal, Universidade da Madeira, 9000-003 Funchal, Portugal
4
Departamento de Biologia, Faculdade de Ciências, Universidade do Porto, 4099-002 Porto, Portugal
*
Author to whom correspondence should be addressed.
Diversity 2022, 14(12), 1078; https://doi.org/10.3390/d14121078
Submission received: 17 November 2022 / Revised: 2 December 2022 / Accepted: 4 December 2022 / Published: 6 December 2022
(This article belongs to the Section Biodiversity Conservation)

Abstract

:
Living on islands entails numerous challenges for animals, among which population density approaching the carrying capacity of trophic resources stands out. To overcome this limitation, many insular lizards can supplement their insectivorous diet with increasing portions of plant material. The Madeira wall lizard, Teira dugesii, is a medium-sized lacertid, endemic to the Madeira and Selvagens archipelagos. As common in this family, adults are sexually dimorphic with males being bigger than females. Previous dietary studies on morphological scatology identified a higher proportion of plant over animal prey items, changing according to the location and sex. Here, we used DNA metabarcoding to examine the diet of this lizard species quantifying it at a higher taxonomical resolution and enhancing the detection of soft-body prey that often go undetected in morphology-based studies. In a sample of 151 faecal samples from eight populations including different habitats and altitudes in Madeira, we identified 289 prey items belonging to eight animal and three plant Classes, encompassing 58 distinct orders and 140 families. Of these, 63 were identified up to the species level. The results support a strong trend towards herbivory in this species with plants representing almost 74% of the diet occurrences in contrast to the 26% of animal prey. Remarkably, the plant fraction of the diet remained stable across localities but varied with size and mass in males. As males grew bigger and heavier, they significantly increased their plant matter intake. Likely, larger bodies and abdomens allowed allocating longer and more complex digestive tracts harbouring intestinal flora to better decompose plant organic compounds. This allowed heavier animals to have a richer diet regime. However, diet richness and composition were not affected by either sex or size, while the locality had a significant effect on both diet components likely in response to local variation in prey availability. By including an increasing plant fraction into a primarily insectivorous diet, this insular lizard has not only enlarged its trophic niche but is also able to exploit more efficiently the highly variable resources provided by insular environments.

1. Introduction

Diet is a fundamental aspect of an organism’s biology, and the evolution of dietary strategies may have important consequences for both lineages and ecosystems [1,2,3,4,5]. Foraging ecology involves animals balancing the benefits of the acquisition of prey and energy (e.g., caloric value, water content, nutrients, secondary compounds), with the cost of obtaining it (e.g., predation risk, time for other activities, food digestibility) [6]. In primarily carnivorous species, consuming plant matter may represent a way for enlarging trophic niche when food resources are scarce, but at the cost of taking a long time to forage and digest these items with lower profitability than animal prey [7]. Additionally, many plants carry secondary compounds that are toxic for herbivores if in large amounts [8]. In this context, omnivorous lizard species within carnivorous lineages provide excellent model organisms for analysing the evolution and maintenance of herbivory.
Based on a literature survey of diets of over 450 lizard species, Cooper, Jr and Vitt [9] assessed the distribution and extent of herbivory in this animal group, its evolutionary history, and the ecological factors that may favour it. Plants occur in the diets of nearly over half of lizard species, but the greatest percentage of omnivorous lizard species (>10% plant diet) occur in Iguanidae, Corytophanidae, Gerrhosauridae, Agamidae, Xantusiidae, and Tropiduridae, while numerous other omnivores occur in the otherwise primarily carnivorous Lacertidae and Scincidae [9]. Regarding Lacertidae, large body size has long been associated with herbivory [10,11], likely since a large abdomen allows the allocation of a longer and more complex gut, enhancing cellulose decomposition by intestinal flora [2], and because digestive efficiency is low [11]. However, contrary to these expectations, variation in body length accounts very little for plant consumption at the species level. This is because the evolution of body size is complex, and surely derives through multiple historical and contemporary factors including phylogeny, sexual selection, fecundity, competition, and predation (but see [9]). In particular, conditions prevailing in islands when compared to continents, including the absence of competing species, high density of conspecifics, low pressure by terrestrial predators, and seasonally fluctuating and restricted invertebrate availability have apparently shifted the diets of many insular lizards towards herbivory [10].
Indeed, island life is enabled by an impressive array of adaptations [12], with insular taxa typically differentiated from their mainland ancestors in morphology, physiology, behaviour, and genetics, usually resulting from long-term evolutionary changes (e.g., [13,14]). Moreover, insular lizards attain high densities because of the lack of predators, but then are closer to the carrying capacity of the ecosystem [7]. To overcome dietary limitations, island populations can expand their feeding preferences and/or maximise energy acquisition [10,15,16]. In response to this food shortage, many lizards can supplement their insectivorous diet with increasing portions of plant material [7,10,17,18,19,20]. Because of the low predation pressure, they can afford to spend time eating and digesting plants. However, it seems this is not automatic. The first evolutionary step is consuming the reproductive organs of plants (i.e., seeds, flowers, pollen), and only later in the evolutionary time, leaves and stems are eaten. The first is associated with increasing gut length and the second with gut compartmentalisation (intestinal caeca and valves [21]). In both cases, this increases gut passage time [16]. Such morphological shifts are also accompanied by a diversification of the intestine helminth [22] and microbial communities [23,24] and by an increase in preferred temperatures [25,26]. However, increased plant consumption when prey availability is scarce is by no means restricted to islands (e.g., [27,28,29,30]), nor is it always dependent on arthropod abundance (e.g., [31]).
The Madeira wall lizard Teira dugesii (Milne-Edwards, 1829) is a medium-sized lacertid lizard, endemic to the Madeira and Selvagens archipelagos, where the common ancestor of the current populations may have arrived circa 2.8 million years ago [32]. According to IUCN is listed as Least Concern, and with a stable population trend [33]. It inhabits a wide array of habitats such as beaches, open lands, and woodland, ranging from the sea level to mountain tops in relatively high densities [34]. This species was also introduced during the XIX century to the Azores [35,36] and, more recently, to Continental Portugal (Lisbon [37], Porto [38]), and the Canary Islands [39,40].
The morphological analysis of the gut contents of endemic populations from Madeira, Porto Santo, and Selvagens, revealed that T. dugesii is omnivorous with a wide trophic niche [41]. They feed mainly on invertebrates, but plant matter can make up 40% of the total, reaching 60% in lizards from the Selvagens, and even 95% in some samples [41]. This study also detected in nearly all samples from Desertas, Porto Santo, and Selvagens substantial amounts of bird feathers. This was later confirmed by Matias et al. [42] documenting the Madeira wall lizard from Selvagens preying on seabird chicks. In Azores, the predation of storm petrels by T. dugesii has also been confirmed through direct observation [43] but also using stable isotopes and next-generation sequencing [44]. Teira dugesii is also the first reported lizard consuming plant nectar [45]. Furthermore, Sadek [41] also indicated that the degree of herbivory in T. dugesii from the Madeiran and Selvagens archipelagos was not only correlated with lizard sex (i.e., males consumed more plant matter than females) but that it increased with animal size. This same relationship between herbivory and size is also observed in the Canarian Gallotia sp. lizards [46,47,48]. The study from Sadek [41] also found distinct diet compositions regarding plants, among distinct geographical and habitat categories.
Nevertheless, diet studies based on morphological identification of prey items from the gut contents or scats suffer from several biases due to the different digestibly of prey items according to the size, hardness, and chemical composition [7,49]. Molecular scatology studies provide a better resolution regarding diet richness and composition [50,51], although, in all cases, high sample sizes are advisable due to the short timeframe of the diet analysis. As such, advances in high-throughput sequencing and DNA metabarcoding allow for the simultaneous analysis of the diet of hundreds of animals from low-quality/quantity eDNA in faecal or stomach contents [52,53,54]. This new molecular approach is particularly important in insular systems, where predator-prey networks might often include numerous species, many of which with soft bodies that often go undetected in morphology-based studies.
In this study, and under a DNA metabarcoding approach, we aim to: (1) characterise the diet of T. dugesii across Madeira Island; (2) assess the level of herbivory in the Madeira wall lizard; (3) test if herbivory in this lacertid species is actually affected by different abiotic factors, and/or reptile morphological traits; and finally (4) compare the richness and prey composition across different populations, and lizard morphological traits (i.e., sex, size, and weight).
We anticipate that T. dugesii is likely to have an herbivorous diet, consuming a significantly bigger amount of plant matter than animal prey. Moreover, we predict that lizard individuals with bigger body sizes will most likely consume more plant matter than smaller ones since they have a wider capacity to allocate longer and more complex gut, which enables them to better decompose plant complex compounds. Likewise, bigger animals are also expected to feed on a richer diet, as they have the capacity to accommodate more food in their gut. Finally, both richness and composition are expected to differ among populations, due to local floristic and faunistic availability.

2. Materials and Methods

2.1. Study Area

The Madeira archipelago is an autonomous region of Portugal located in the Atlantic Ocean, circa 650 km of North-western Africa (Figure 1), comprising the islands of Madeira, Porto Santo, Desertas, and Selvagens, all of volcanic origin, elevated 4.6, 14, 3.6 and 12 million years ago, respectively [55]. Madeira is the largest (750 km2), highest (1.862 m a.s.l.), and most heterogeneous island. Thus, its climate is conditioned by its complex relief, configuration, and east-west orientation, possessing a diverse spatial distribution of land use and landscape management, with several types of interleaved habitats in a short area [56]. On the south coast, below 1000 m, and on the lowlands of the north coast, the climate is mainly Mediterranean characterised by a long dry season during the summer months, while above 1000 m on both south and north coasts, the climate is temperate with precipitation throughout the year and without a dry season [57]. Ponta de São Lourenço, at the eastern-most tip of the island, is the driest and most sunny part of Madeira, characterised by its aridity, unique flora, geology, and extremely high mollusc endemicity (references in [58]). Consequently, Ponta de São Lourenço has mainly sparse vegetation, the Mediterranean areas are characterised by xerophilous forests or Mediterranean Laurisilva, whereas the temperate region of the island contains a diverse understorey (e.g., moist Laurisilva), and high-altitude scrubland dominated by Erica sp. [58].

2.2. Field Sampling

Fieldwork in Madeira Island was conducted during March 2022 (early reproductive season [59]) in eight localities (Figure 1), encompassing different habitats and altitudes, namely: Funchal, Porto Moniz, Santana, and São Vicente (Mediterranean habitats); Eira do Serrado, Lombo do Moleiro, and Paúl da Serra (temperate habitats); and Ponta de São Lourenço (xerophilous habitats).
Adult lizard faeces were collected after a gentle abdominal massage and preserved in 96% ethanol until DNA extraction was performed. We collected a total of 151 faecal samples of T. dugesii (81 males and 70 females, sexed on the basis of sexual secondary characters and hemipenises eversion [60]), 20 in each population, except at Paúl da Serra where only 11 individuals were possible to capture. The snout-vent length (SVL) of each individual was measured to the closest 0.01 mm using an electronic calliper, and the weight was obtained using a digital scale to the closest 0.01 g. After these procedures, all individuals were released in the same place of capture. Sampling permits and protocols were approved by the Madeiran delegation from the Instituto das Florestas e Conservação da Natureza, IP-RAM (IFCN), described in the acknowledgments section.

2.3. Molecular Analysis

DNA from approximately 200 mg of each faecal sample was extracted using the Stool DNA Isolation Kit (Norgen Biotek Corp., Thorold, ON, Canada) following the manufacturer’s guidelines. Two 50 μL elutions from each pellet, including seven extraction control samples, were obtained and stored at −20 °C in 96-well plates until amplification.
Two different DNA fragments were chosen to identify the distinct prey groups (plants, invertebrates, and vertebrates) that presumably compose the diet of the study species [41]. For plants, the g/h primers [61] were used targeting the short P6-loop of chloroplast trnL (UAA) intron (10–143 bp). For invertebrates and vertebrates, a short fragment (205 bp) of the mitochondrial cytochrome c oxidase subunit I (COI) was amplified by Polymerase Chain Reaction (PCR) using the FwhF2-R2n primers from Vamos et al. [62]. Both g/h and FwhF2-R2n primers were modified to include Illumina adaptors and a 0–5 bp shift made of Ns was added between the adaptor and the primer to increase sequencing diversity and quality. The different primer variations were then combined before PCR reactions, resulting in mixed forward and reverse primer single solutions. For both plant and animal sequence amplification, the PCR reaction was comprised of 5 μL of QUIAGEN Multiplex PCR Master Mix (Quiagen, Crawley, UK), 0.3 μL mix of forward primers, 0.3 μL mix of reverse primers, 3.4 μL of ultra-pure water, and 2.5 μL of DNA extract. To obtain as much information as possible from each scat, three PCR replicates were performed per faecal sample per primer pair. Cycling conditions for the COI fragment consisted in an initial denaturation step at 95 °C for 15 min, followed by 45 cycles of 95 °C denaturing for 30 s, annealing at 52 °C for 45 s, extension at 72 °C for 20 s, and a final extension at 60 °C for 5 min. Regarding the trnl amplification, we used an initial denaturing at 95 °C for 15 min, followed by 39 cycles of denaturing at 95 °C for 30 s, annealing at 45 °C for 30 s, and extension at 72 °C for 30 s, with a final extension at 72 °C for 10 min. The success of all amplifications was checked by running the PCR products in 2% agarose gels.
The library preparation started with an initial PCR clean-up using Agencourt AMPure XP beads (Beckman Coulter, Brea, CA, USA) to remove primer dimer, followed by an indexing PCR to properly identify each amplified product. Indexing PCR was performed using 2.8 μL of ultra-pure water, 7 μL of 2× Kapa HiFi, 0.7 μL of each Index (P7/P5), and 2.8 μL of cleaned PCR product. This was followed by the subsequent cycling conditions: initial denaturation of 95 °C for 3 min, following 9 cycles of 95 °C for 30 s, annealing at 55 °C for 30 s, extension at 72 °C for 30 s, and a final extension of 72 °C for 5 min. PCR products underwent a second bead clean-up to remove the remaining primer dimer, nucleotides, and enzymes that might interfere with the sequencing reaction. Succeeding the mentioned steps, all purified PCR products were quantified using Epoch, followed by normalisation to 20 nM and pool sampling. Purified and normalised PCR products were pooled per marker. These two libraries were then individually quantified using qPCR (KAPA Library Quant Kit qPCR Mix; Bio-Rad iCycler) and diluted to 4 nM. Finally, libraries were pooled equimolarly and sequenced using a 500 cycles v2 MiSeq kit (Illumina) for an expected average of 25,000 paired-end reads per sample-marker combination.

2.4. Analyses of DNA Sequence Data

Bioinformatic processing of sequencing reads was done separately for each molecular marker. First, paired-end reads were aligned using PEAR [63], where base pairs with q-scores lower than 26 were rejected (following [64,65]). Then, reads were assigned to samples, and primer sequences were removed using the ngsfilter command from OBITools [66], allowing a total of four mismatches to the expected primer sequence. Afterward, reads were de-replicated into unique sequences or exact sequence variants (ESVs) and singletons were removed, using the command obiuniq. Bibliographic information of each marker was used to discard ESVs shorter and/or longer than expected. This way, fragments with 202–208 bp for COI, and 30–120 bp were kept for trnL using the obigrep command. The command obiclean was then used to denoise the data by removing potentially spurious sequences with an ‘r’ level of one. This means that any ‘A’ ESV differing one base-pair from a ‘B’ ESV, with an absolute read count lower than ‘B’, and that was not found without the presence of ‘B’ in any PCR product, was removed as it was most likely a PCR or sequencing error. An Operational Taxonomic Unit (OTU) table was produced using the obiannotate command. Finally, the usearch_global command from VSEARCH [67] was used to build a match-list with all the internal matches of OTUs. The obtained OTU table and sequences were further cleaned using the R package LULU [68] to remove potential mtDNA nuclear copies, and persisting PCR and sequencing errors. We removed from each PCR product all ESVs that had a read count < 1% of the total number of reads of that PCR [69]. This should allow the removal of most PCR and sequencing errors that still passed the obiclean denoising step. Additionally, all reads identified in the extraction and PCR controls were subtracted from the corresponding sample batch [70].
Taxonomic assignment of OTUs was done using BOLDigger [71] followed by manual inspection and curation, along with manual BLAST of some sequences on NCBI when species-level assignments were not possible with BOLD. The sequences with less than 90% of similarity were determined only to the class level, the ones with a similarity between 90 and 95% were assigned to the family level, and sequences presenting more than 95% similarity were classified to the species or genus level. In case of a match with multiple genera or species, OTUs were assigned considering the species record in Madeira [58]. For ESVs not identified to the species level, we built a neighbour-joining tree in the software Geneious Prime [72], visually inspected the corresponding alignment, and checked for patterns of co-occurrence of similar ESVs in order to cluster (~98%) them into distinct taxa (e.g., Carabidae 1, Carabidae 2, and so on), also referred as molecular operational taxonomic units (MOTUs). After this step, we removed every taxon not belonging to either the Plantae or Animal kingdoms, including fungi (mainly Ascomycota and Zygomycota), bacteria, lizards (ESVs matching the Madeira wall lizard), mammals (human and pig), and internal parasites (phylum Nematoda).

2.5. Statistical Analyses

All statistical analyses were performed in R v4.1.2 (R Core Team [73]) to detect significant variation in estimates of dietary descriptors (i.e., diet richness and composition), between populations, sex, size, and weight of T. dugesii. Also, all figures were produced using the package ggplot2 v. 3.3.1 [74], unless stated otherwise.
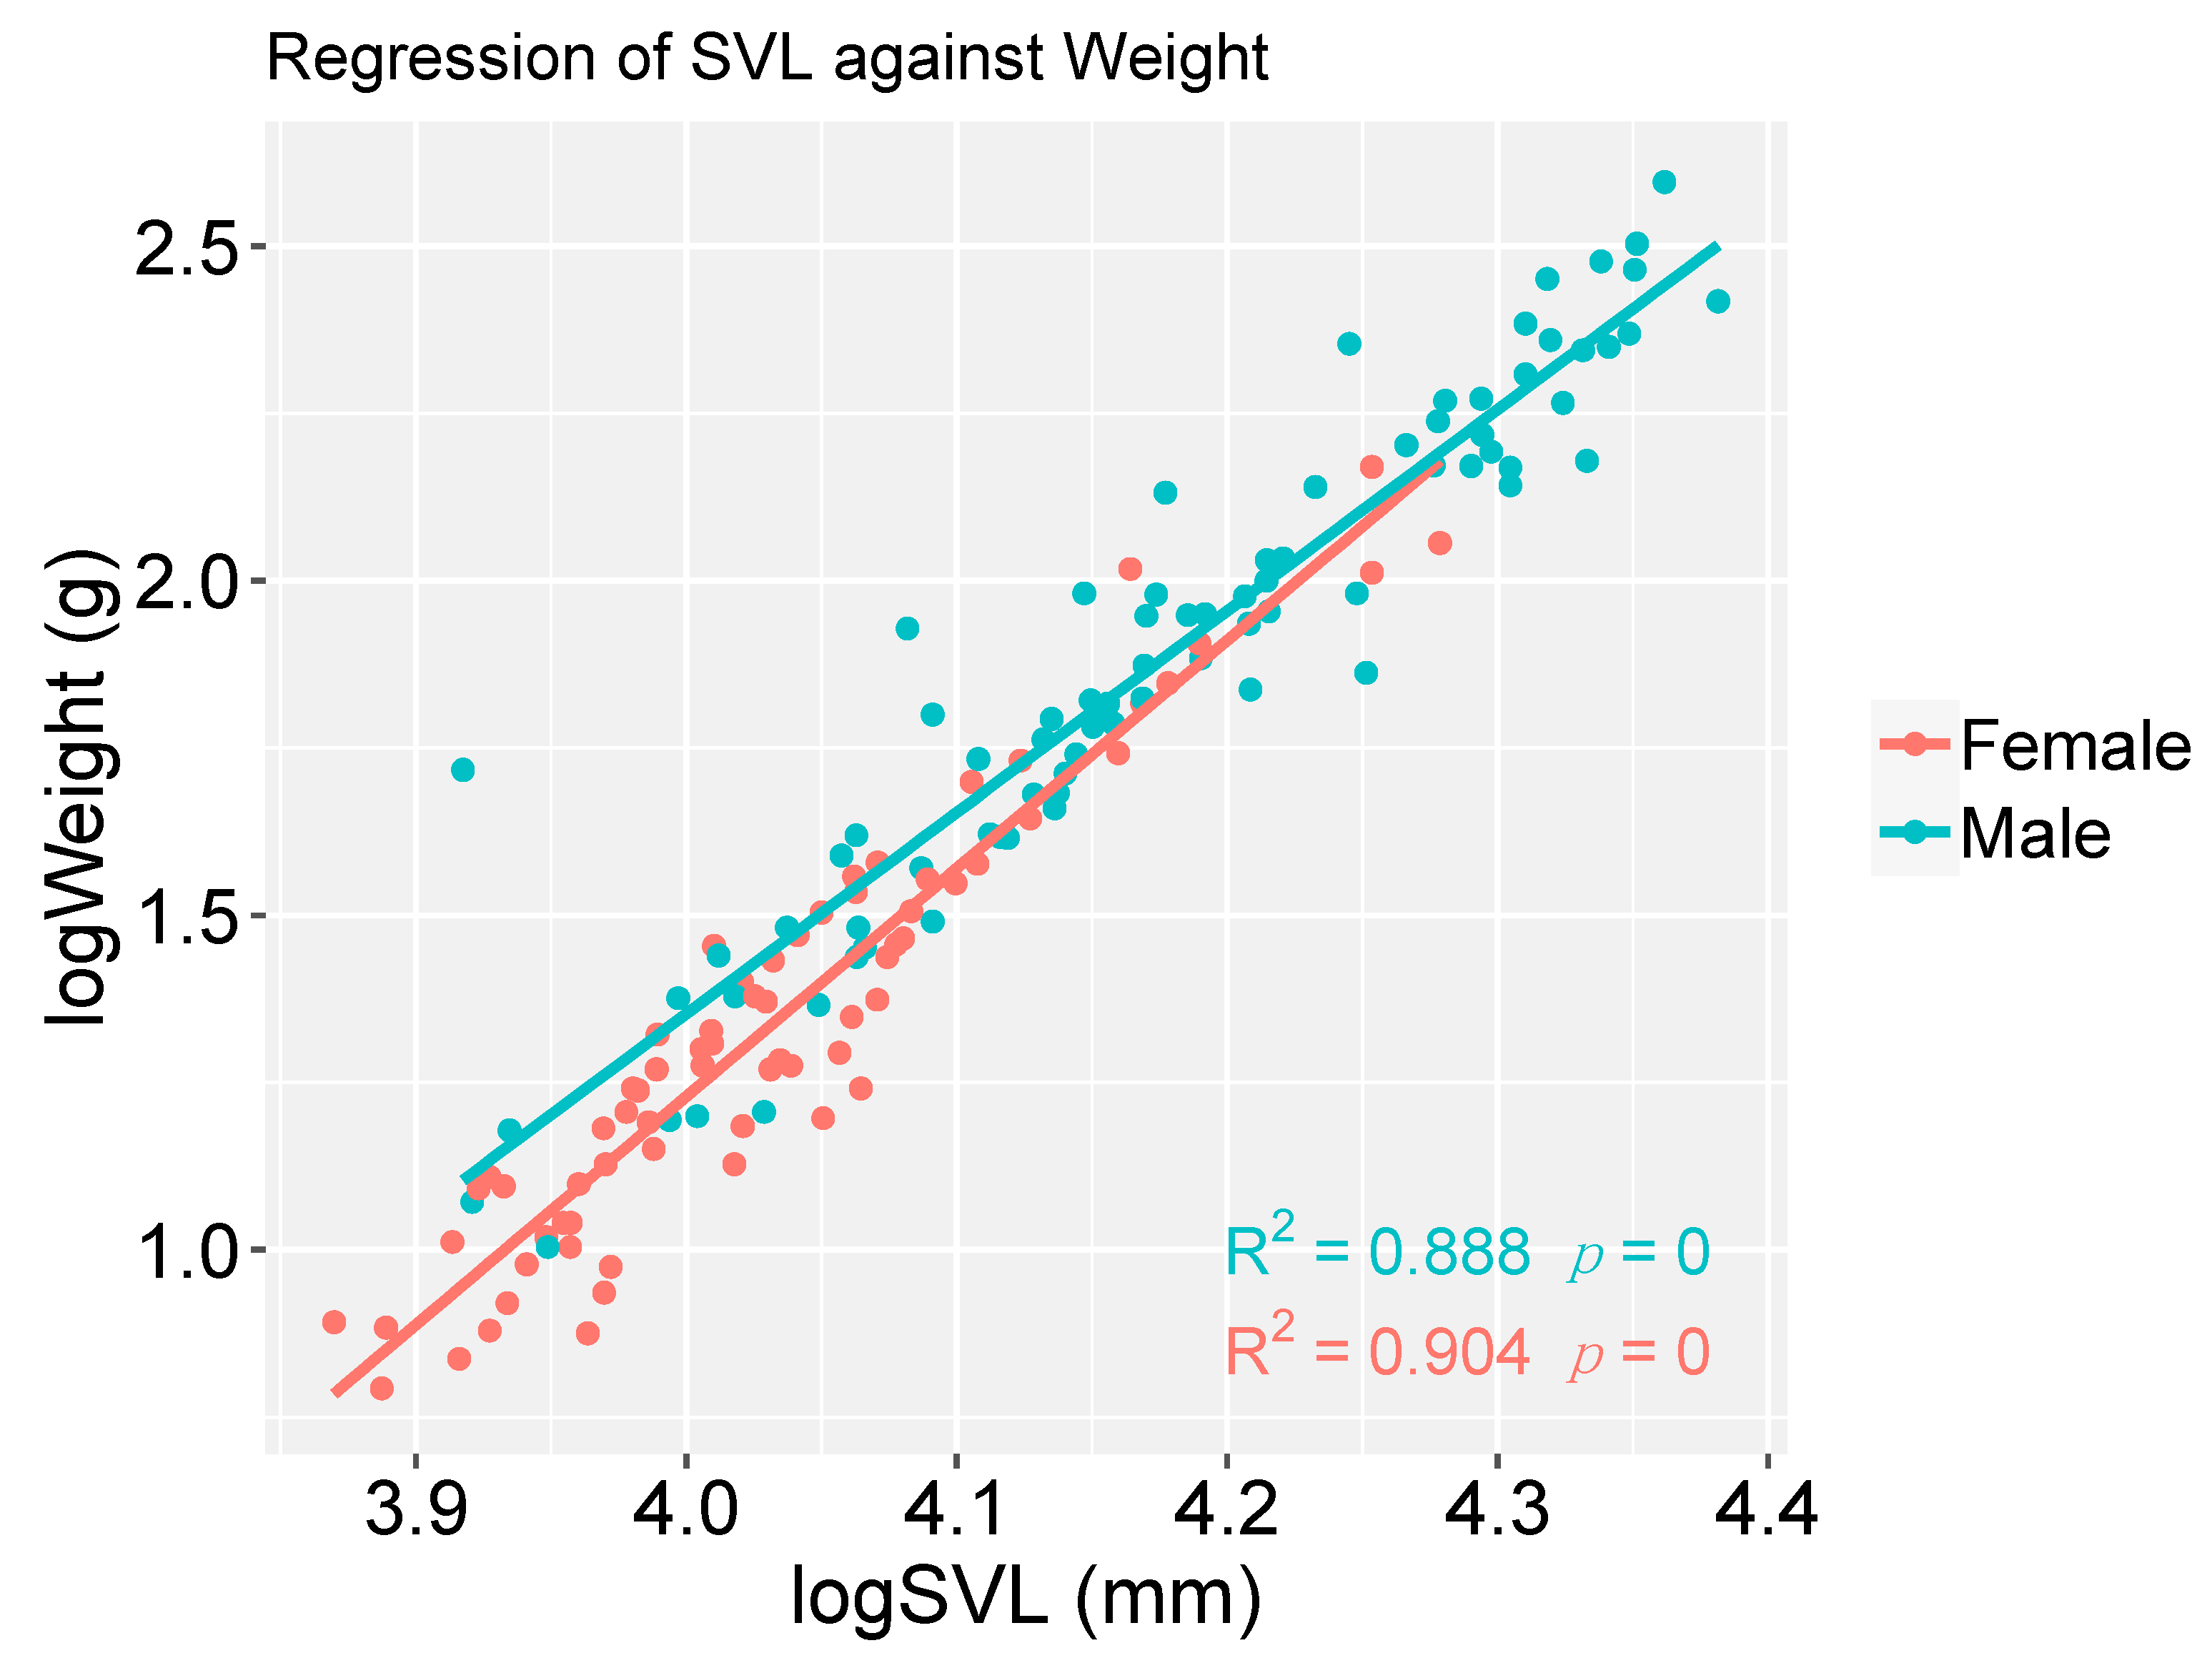
The log-transformed body size (SVL) and mass (weight) variation between sexes across localities, were summarised using boxplots. Body condition was assessed by investigating the relationship between body mass and body length in both males and females, through linear regression.
A two-way ANOVA (sex and population) was used to analyse sexual dimorphism in both size (SVL) and body mass (weight), using the function aov. Pairwise comparisons were performed with the function glht (Tukey test) from the package multcomp [75].
Dietary analysis was based on three different taxonomic levels: OTU (all taxonomic units identified to the most possibly resolved taxonomic level, even if the unit was classified only up to family or order level), family, and kingdom. We used OTUs as the most resolved taxonomy instead of species since many taxa could not be identified to that level due to gaps in reference databases. Excluding taxa identified only at higher taxonomic levels would have biased the results since reference collections are still highly unbalanced across taxonomic groups.
To assess the effects of different predictors on the average number of prey taxa detected per faecal sample (i.e., richness), several General Linear Models (GLMs) were conducted with distinct combinations of the predictors: population (Pop), Sex (adult females vs adult males), snout-vent length (SVL), and weight (see Table S3 with the different combinations), and their interaction. For that, we used the function glm and tested its significance with anova from the car package [76], fitting a Poisson error distribution into the GLMs. The GLMs were compared using Akaike’s Information Criterion corrected for small samples (AICc), implemented with the aictab function from the AICcmodavg R package [77]. The models were ranked using AICc weights, which can be interpreted as the probability that the model is the best among the set of candidate models (ΔAIC < 2 following [78]). Graphical representation of the relationships depicted from the GLMs’ results was performed using the effect function from the effects R package [79], where richness means and standard errors were derived from the model’s parameters estimates. Pairwise comparisons were performed with the function glht (Tukey test) from the package multcomp [75].
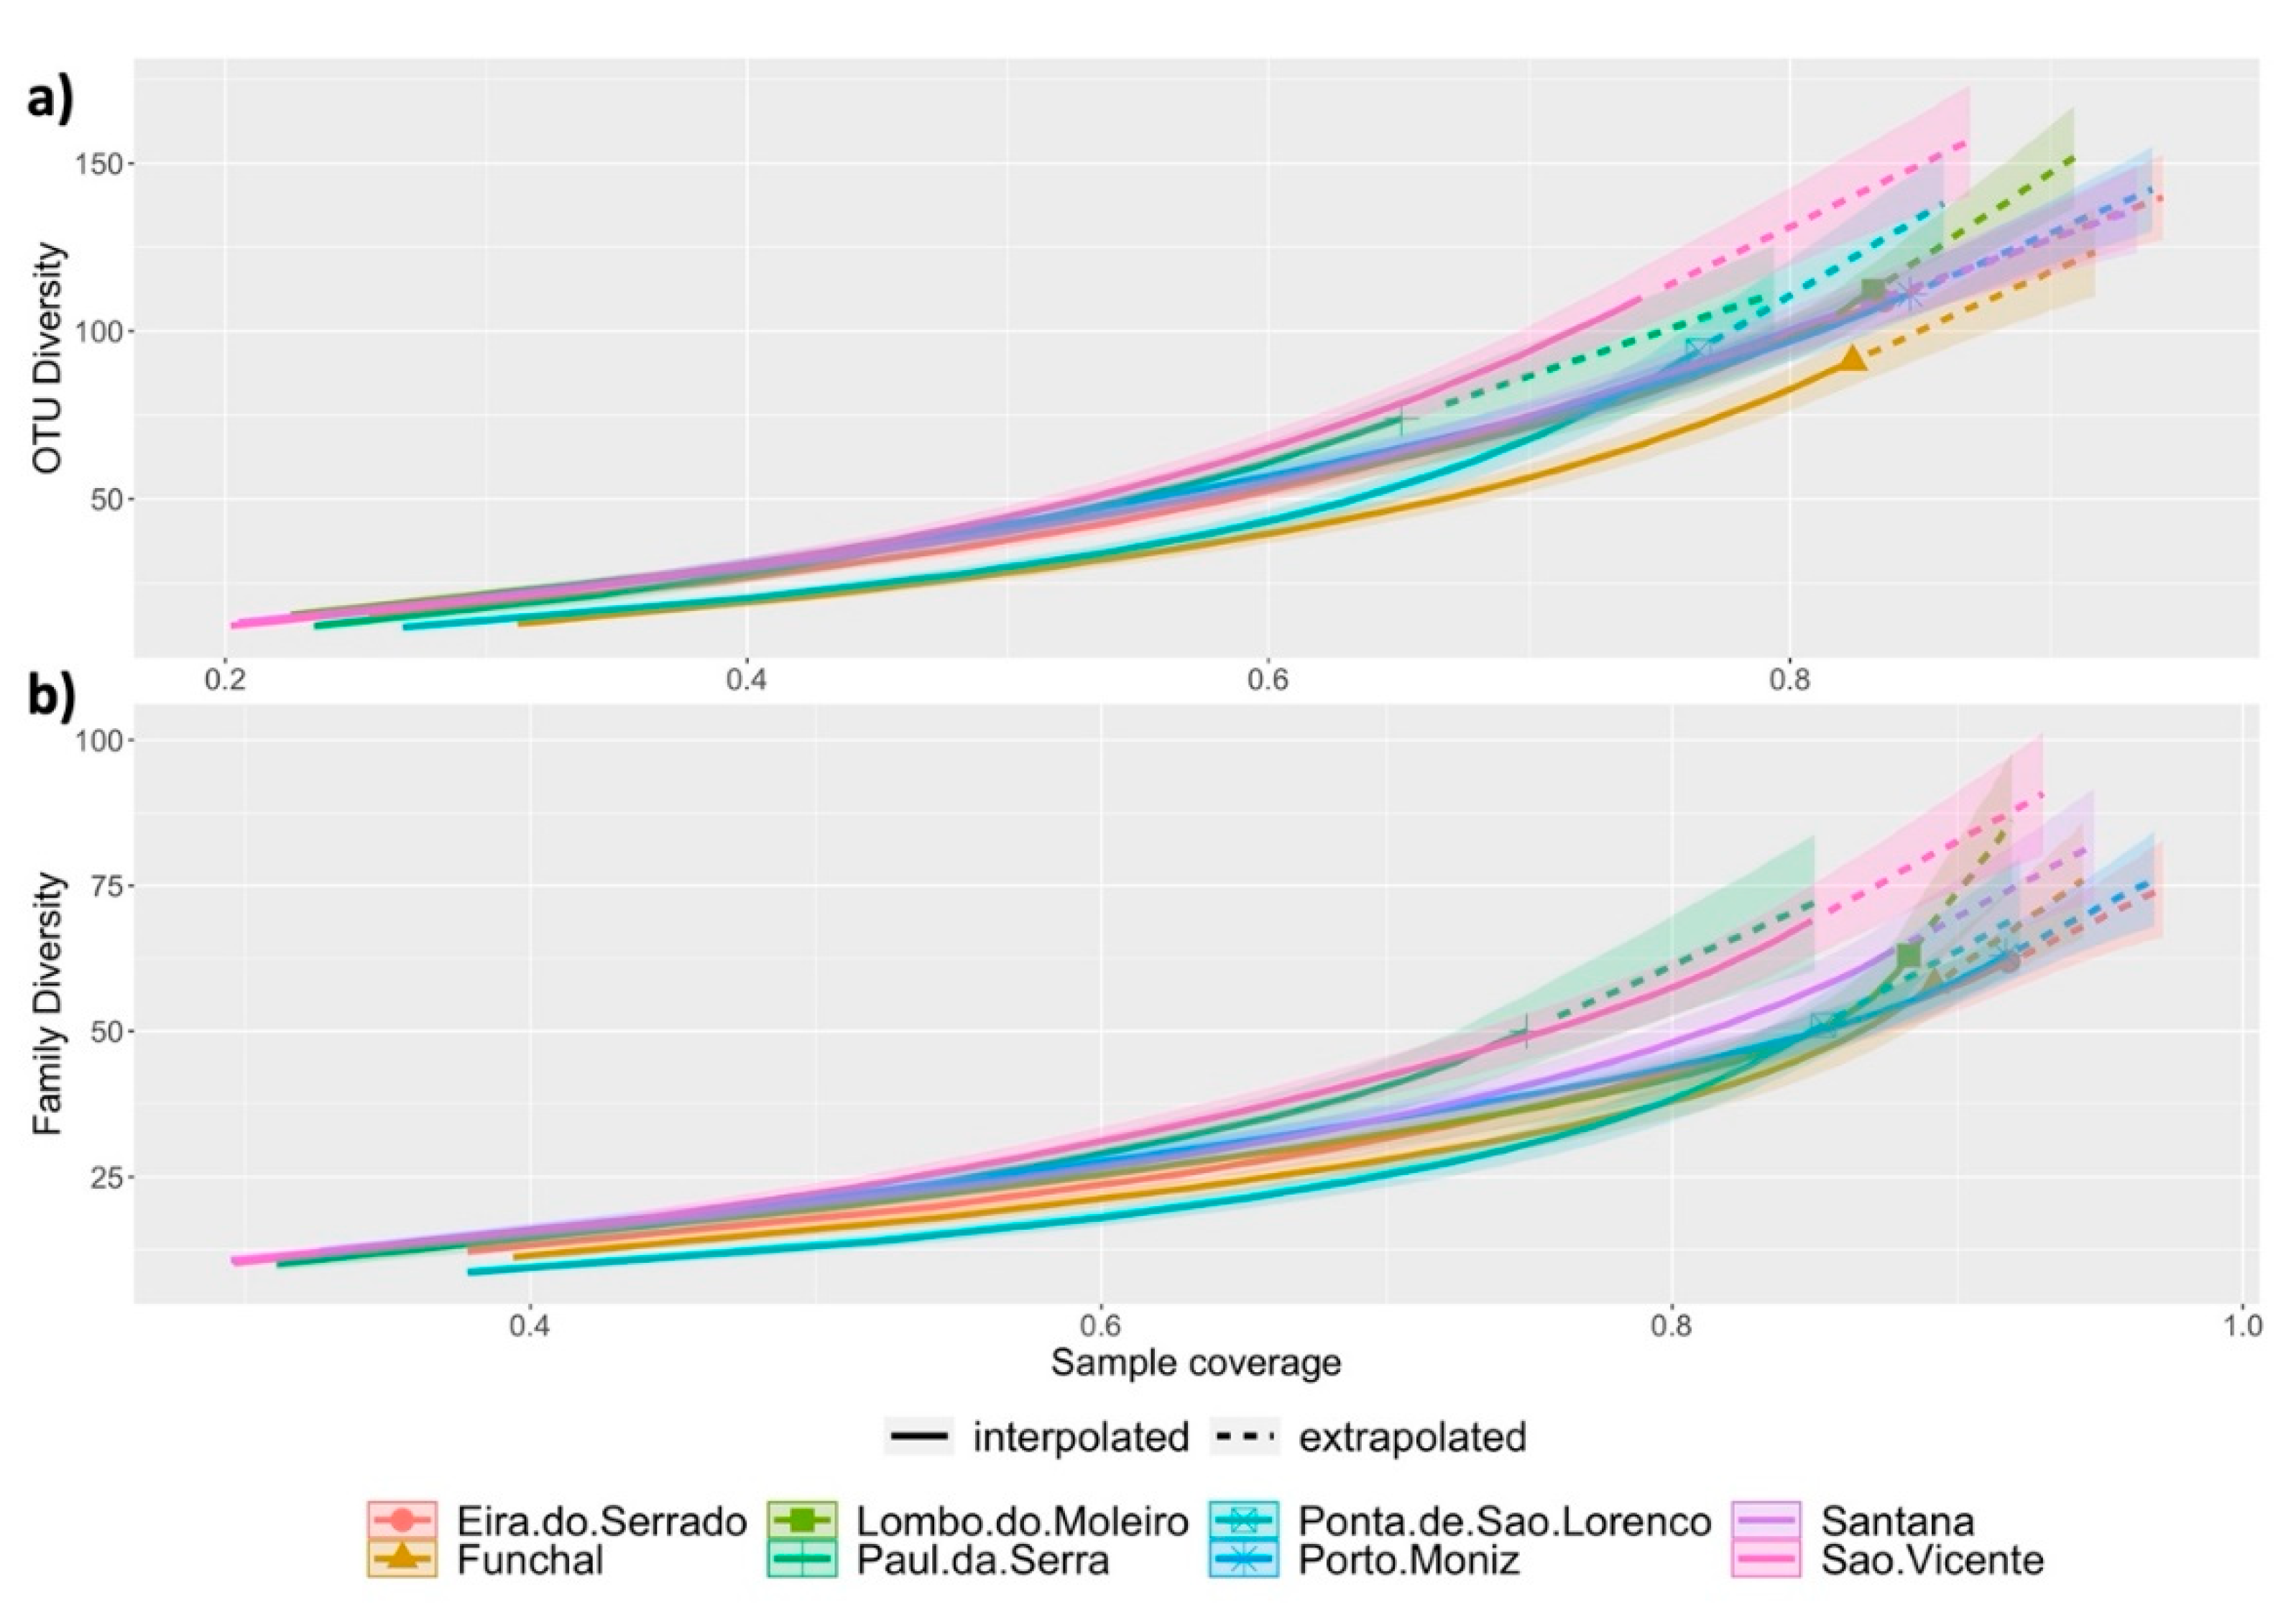
To calculate the dietary niche width among the different populations, prey rarefaction and extrapolation curves were built using the R package iNEXT v. 2.0.20 [80]. Analyses were conducted with incidence frequencies for prey taxa. We compared the estimated richness considering completeness (i.e., sample coverage) instead of sample size (i.e., number of samples), to avoid biases of communities with different levels of richness requiring different sampling efforts in order to be sufficiently characterised [81]. Considering that the 95% confidence interval is a very conservative approach, we assumed that differences were significant if the 84% confidence interval (a proxy for α = 0.05) of both estimates did not overlap [82].
Permutational multivariate analysis of variance (PerMANOVA) was used to compare the OTU and family diet composition between sexes, populations, SVL, and weight with the vegan R package (function adonis; [83]). This comparison was also performed at the kingdom level to test if the degree of herbivory is correlated with any of the considered predictors. The presence or absence of each prey item in each sample was used to build a Jaccard dissimilarity matrix using the vegdist function from the R package vegan [83]. A homogeneity of dispersion test (function betadisper) was also carried out to assess if the observed differences in PerMANOVA could be due to unequally dispersed values across the different groups [84].
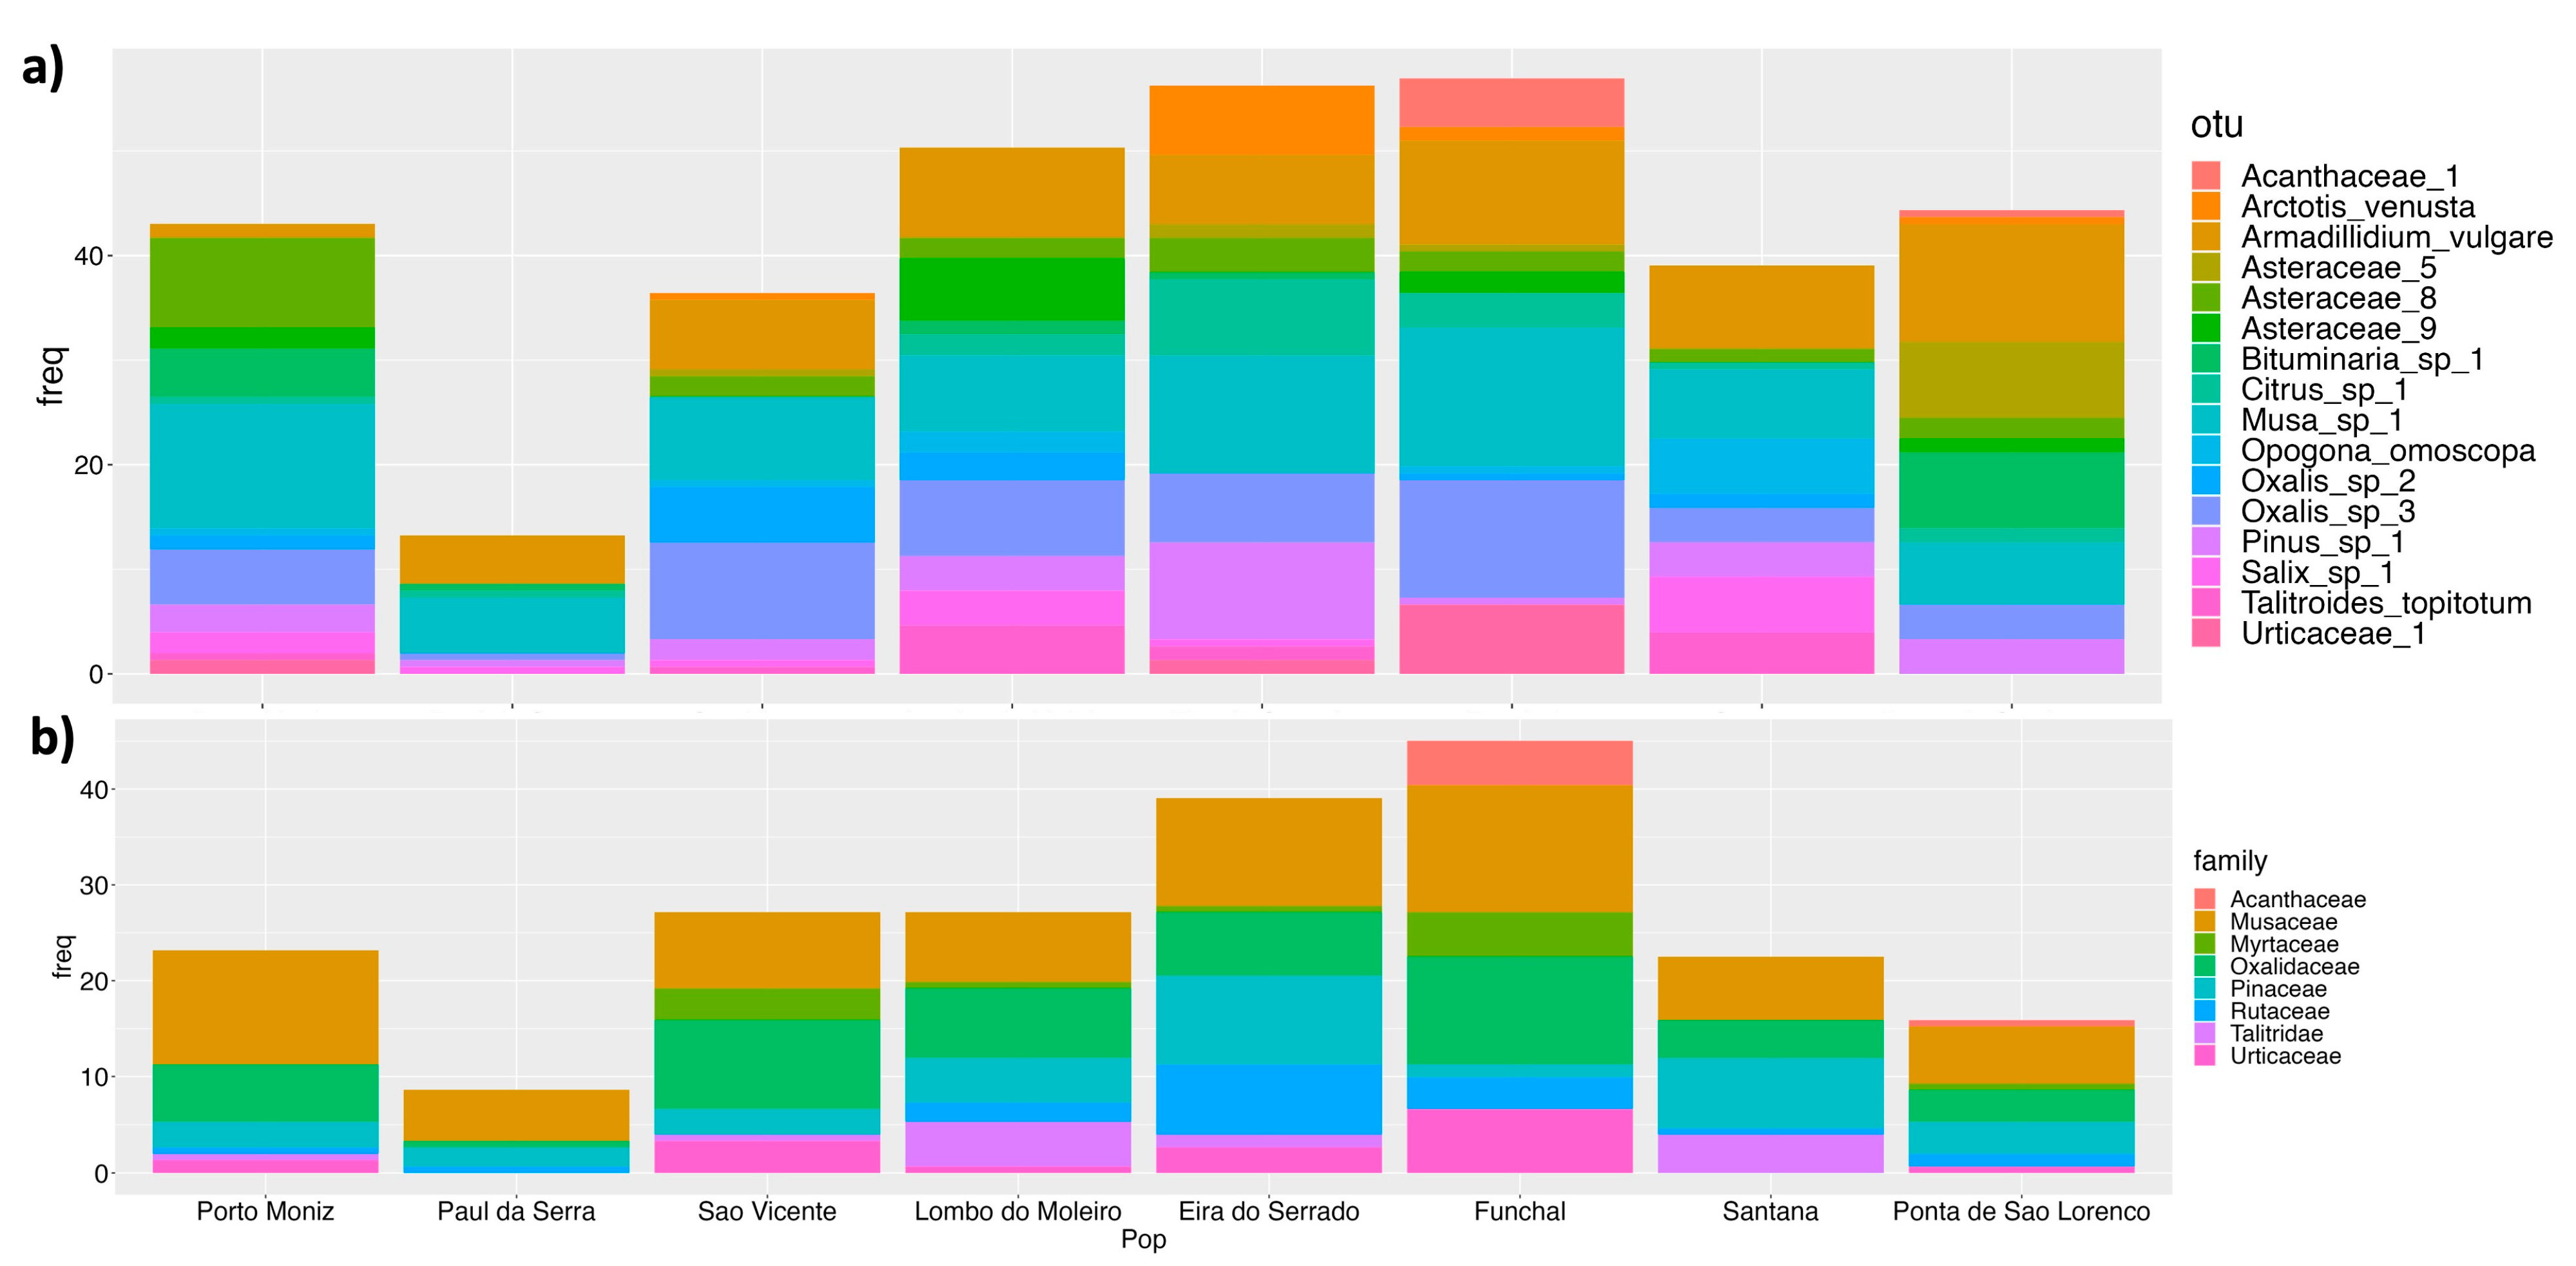
Finally, we also compared diet composition among populations by building a generalised linear model for multivariate abundance data with a binomial distribution. To assess that, we used the function manyglm from the package mvabund [85] and tested its significance with anova.manyglm of the same package. To further assess which prey items were responsible for differences in diet between the different groups, we looked at the p-values of univariate tests outputted by the function anova.manyglm. The frequencies of occurrence of these identified prey items were visualised in a stacked histogram.

3. Results

The libraries generated ca. 38 million raw sequence reads, which were reduced to 679,948 reads during the bioinformatic processing and to 872 OTUs (434 for COI and 438 for trnL). Non-target amplification from different sources was observed both in samples, extractions, and PCR negative controls representing 4% of the total reads. Fungi represented most of the non-target OTU diversity (44%). An expected amount of T. dugesii was observed as well, corresponding to 42% of the total read counts, and 1.5% belonged to unknown taxa. After negative controls, singletons, replicates, and taxa filtering, the lizards’ final diet consisted of 365,995 reads and 289 OTUs.
Teira dugesii is sexually dimorphic for both size and weight, with males being bigger and heavier than females in all populations (Figure S1). Females’ SVL varied between 47.93 and 72.14 mm (stdev: 8.10), and in weight from 2.21 to 8.76 g (stdev: 2.63); SVL in males varied between 50.27 and 79.96 mm (stdev: 8.15), and weight from 2.73 to 13.41 g (stded: 2.64) (Table S1). On average, Porto Moniz had the biggest and heaviest males, while Santana and Ponta de São Lourenço the smallest. Regarding the females, these were smaller in Eira do Serrado and bigger in São Vicente and Funchal (Figure S1). However, the closeness of male and female regression lines, indicates that growth trajectories of both sexes follow a common trend (Figure 2), and sexual dimorphism exists with males attaining bigger sizes and weights than females. The results from the two-way ANOVA (Table S2) indicated that size and mass varied among populations and between sexes, but there was no interaction indicating that sexual dimorphism for both size and body mass is uniform across populations. The pairwise comparisons, however, failed to detect significant differences between population pairs.
From a total of 289 prey items detected, six Classes of Arthropoda (Arachnida, Chilopoda, Collembola, Diplopoda, Insecta, and Malacostraca), one Class of Mollusca (Gastropoda), one class of Chordata (Reptilia), and three Classes of Streptophyta (Magnoliopsida, Pinopsida, and Polypodiopsida) were identified (Table S1). These encompassed 58 distinct Orders and 140 Families, of which 63 could be identified up to the species level.
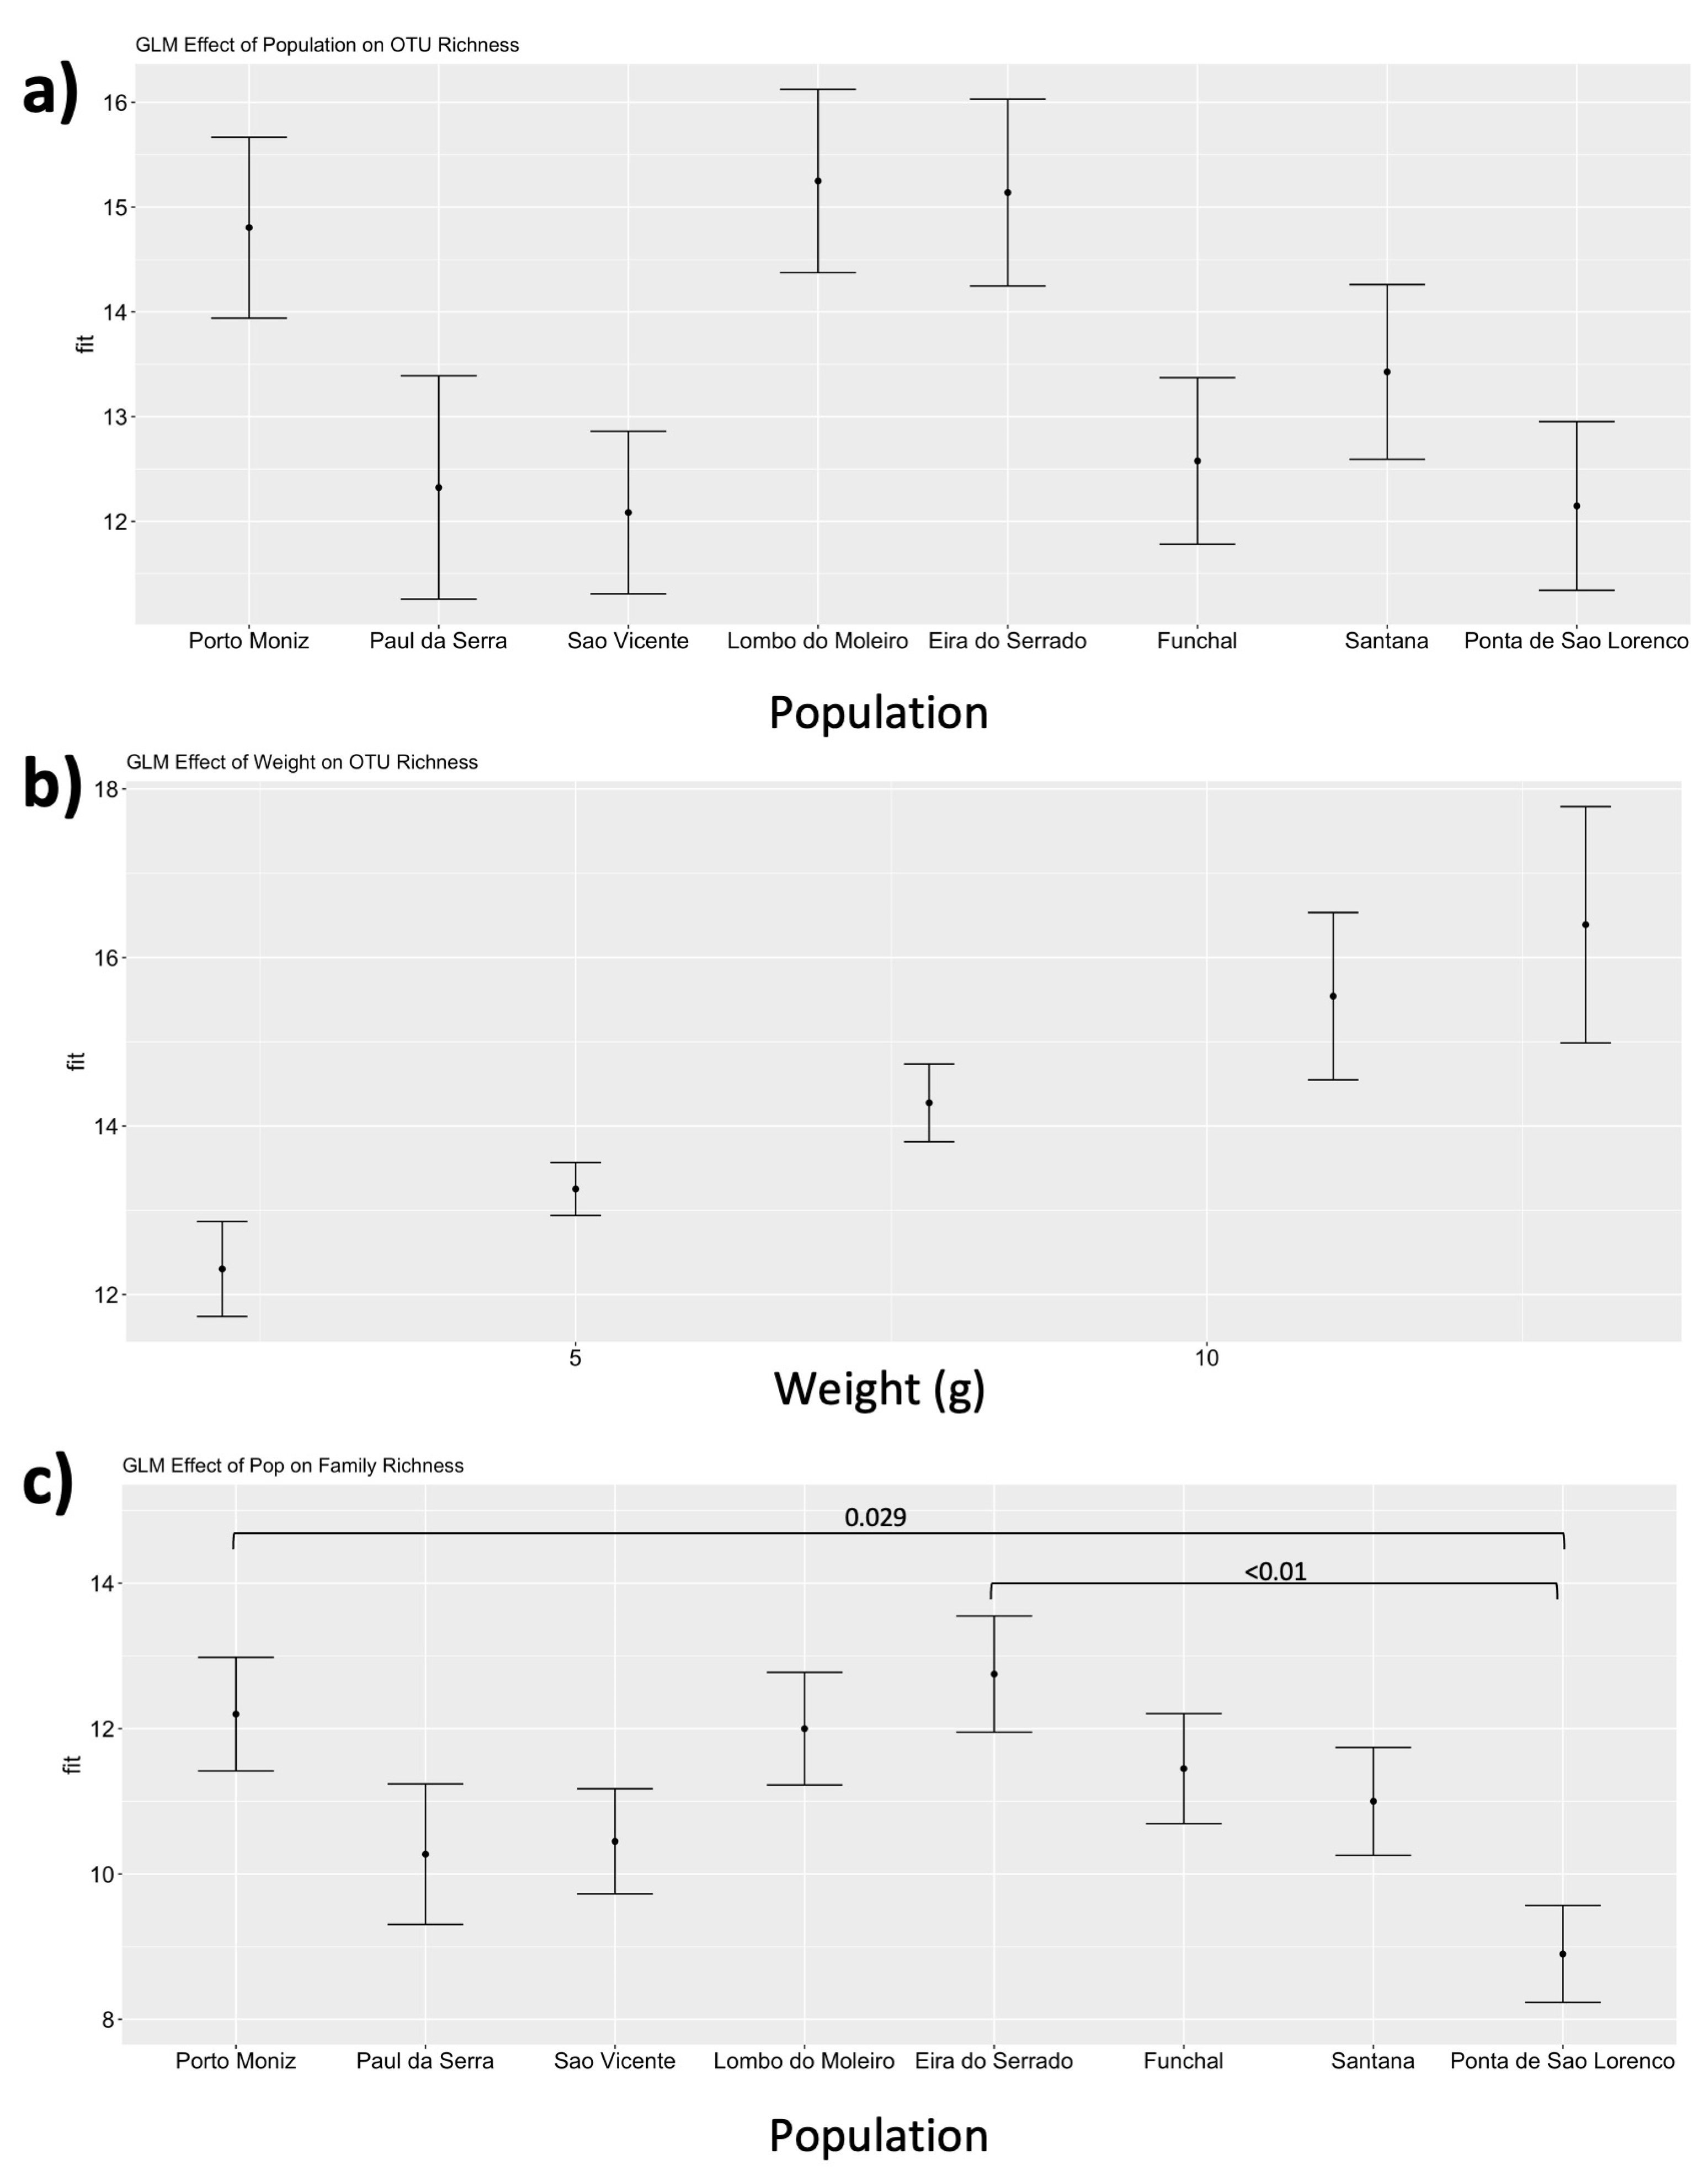
The results from the GLM model building (Table S3), suggested that the model “Pop+Sex+Weight” is the one that best explains the otu richness. We found statistically significant differences among populations and weight, but not sex, on the average number of prey items detected per sample (Pop: Deviance Residual = 21.2172; df = 143; Residual Deviance = 356.11; p-value = 0.003; Weight: Deviance Residual = 5.4404; df = 141; Residual Deviance = 350.58; p-value = 0.020; Sex: Deviance Residual = 0.0877; df = 142; Residual Deviance = 356.02; p-value = 0.767). Porto Moniz, Lombo do Moleiro, and Eira do Serrado presented the highest OTU richness, while São Vicente and Ponta de São Lourenço, had the lowest (Figure 3a). Nevertheless, the post hoc Tukey test did not detect significant differences between any of the populations’ pairwise comparisons. Also, the GLM indicated a positive correlation between weight and OTU richness, with heavier animals having a richer diet (Figure 3b). The population was the predictor that best explained the family richness (Pop: Deviance Residual = 19.198; df = 143; Residual Deviance = 250.5; p-value = 0.008). The distribution of family richness across populations was the same as that observed for OTU richness (Figure 3c). However, here, we obtained significant differences between Porto Moniz and Ponta de São Lourenço (Estimate = −0.31538; Std. Error = 0.09857; p-value = 0.029), and Eira do Serrado and Ponta de São Lourenço (Estimate = −0.35948; Std. Error = 0.09767; p-value = < 0.01).
The analysis based on sampling completeness indicated no niche overlap between some of the populations, at the OTU level (Figure 4a). Specifically, and with sample size correction, São Vicente presented the highest OTU richness overlapping only with Paúl da Serra and Ponta de São Lourenço. Nevertheless, the sample coverage for all these populations was low (<80%) in comparison to the other populations, especially Paúl da Serra (only 11 sampled individuals). All remaining populations had overlapping niches, and a sample coverage > 80%, with Funchal holding the lowest OTU richness. At the family level (Figure 4b), most of the populations overlapped with a sample coverage > 80%, except Paúl da Serra.
The perMANOVA for the OTU, family, and kingdom levels (Table S4) indicated that only population had a significant effect on both OTU and family diet compositions of T. dugesii. However, the dispersion test suggested this is due to a lack of homogeneity of group variances (p-value < 0.05). Moreover, the composition at the kingdom level (i.e., plants and animals) was affected only by the interactions Sex*SVL, and Sex*weight. The dispersion test indicated that the effect of both size and weight on the amount of plant and animal items ingested by T. dugesii is due to the heterogeneity of group variances. However, the analyses on the relationship between morphological traits and the amount of plant frequency (Figure 5), revealed a significant increase in plant intake only when males became bigger and heavier.
The main dietary items of T. dugesii belonged to the plant families Musaceae (Frequency of Occurrence: 69.54%), Poaceae (69.54%), Asteraceae (68.21%), and the isopod Armadillidiidae (64.90%) (Table S5). We also detected the presence of the gecko Tarentola mauritanica in 1.99% of the samples from Eira do Serrado, Paúl da Serra and Santana. There is, however, a prevalence of plant phyla in the diet of the Madeira lizard (100% of Streptophyta, 94.04% of Arthropoda, 1.99% of Chordata, and 39.07% of Mollusca). Overall, Plantae represented 73.75% of the diet item occurrences, in contrast to the 26.25% of Animalia prey (Wilcoxon test: W = 6916.5, p-value < 0.001; Table S6), and these proportions were not distinct across the different populations (Kruskal–Wallis test; Animalia: n statistic = 102, df = 9.42, p-value = 0.224; Plantae: n statistic = 203, df = 9.33, p-value = 0.229; but see Figure S3).
Regarding the multivariate abundance data analyses, we found significant differences among populations at both the OTU (Res. df = 143, Deviance = 2729, p = 0.001), and family levels (Res. df = 143, Deviance = 1430, p = 0.001).
The univariate tests showed that the differences among populations were due to 16 OTUs (13 plants and 3 arthropods), and 8 families (7 plants and 1 arthropod; Table S5). The diet item most important for compositional differences among populations was one unidentified Fabaceae species (Bituminaria_sp_1). This perennial herb genus was detected in 55% of the individuals from Ponta de São Lourenço, and 35% in Porto Moniz, while its frequency of occurrence among the other populations ranged from 0 to 10%. Still, at the OTU level, seven other taxa also displayed a significant contribution to the observed differences in diet composition among populations, namely six Asteraceae plants (Asteraceae_5, Arctotis venusta, Asteraceae_9), Urticaceae (Urticaceae_1), Oxalidaceae (Oxalis_sp_3), Musaceae (Musa_sp_1), and only a single arthropod (the isopod Armadillidium vulgare) consumed in a small percentage in Porto Moniz (10%), in comparison to the remaining populations. At the family level, the differences observed were due to the seven plant families Musaceae, Oxalidaceae, Urticaceae, Rutaceae, Acanthaceae, Myrtaceae, and Pinaceae, and a single invertebrate from the amphipod family Talitridae. Overall, Paúl da Serra showed the fewest number of diet items with very low frequencies of occurrence at both the OTU and family levels, in comparison to the remaining populations (Figure 6).

4. Discussion

This study provides the first metabarcoding assessment of the diet of T. dugesii in its native distribution. This high-resolution data revealed a highly flexible diet. The 289 prey items detected corresponded to eight different animals, and three plant classes of which 63 items could be identified up to the species level.
Although the GLMs identified the populations of Porto Moniz, Eira do Serrado, and Lombo do Moleiro as having the highest OTU and family richness, and Ponta de São Lourenço the smallest (Figure 3), when we correct for sampling size, São Vicente and Paúl da Serra appear as holding the broadest niche width (Figure 4). However, since in the latter populations, sampling coverage was clearly insufficient (< 80%), we will refrain from making further conclusions based on these results.
Clearly, both OTU and family richness vary across populations likely in response to the distinct faunistic and floristic characteristics of these localities (Figure 1; [58]), which in turn determine the prey items available that can potentially be consumed by T. dugesii. Nevertheless, previous studies on both herbivorous and omnivorous lizards have shown the contribution of prey selection to diet composition, mostly according to nutrient requirements and avoidance of plant toxic compounds (e.g., [7,86,87,88]). Water content was also reported as the most relevant factor for prey selection in the herbivorous lizard Liolaemus lutzae [89]. In Madeira Island, the dryness and predominance of winds in Ponta de São Lourenço are responsible for the typical and unique vegetation, consisting mainly of coastal xerophytic vascular plants, able to withstand dry climates and/or long periods of drought. The plants that stand out for their uniqueness are mainly species from the family Asteraceae [90], although this is not the most frequent family in the region, but the Amaranthaceae family instead [91]. We found Asteraceae reads in 90% of the samples from Ponta de São Lourenço, being the most consumed family in this population, and in a higher proportion relative to the other populations (Table S5). Indeed, the dietary predominance of Asteraceae plant items in the populations from Ponta de São Lourenço is unrelated to its abundance and availability, suggesting some sort of preference for this floral group.
Additionally, heavier lizards are feeding on a richer diet regime (Figure 3b). Considering the results obtained from the linear regression comparing size and weight (Figure 2), since males can reach bigger sizes, they can also attain heavier weights than females. Hence, we can infer that in fact, males of T. dugesii are feeding on a richer diet in comparison to females. Bigger body sizes imply a bigger space in the abdomen to accommodate a longer intestine [92], able to accumulate a higher amount of food [7].
While Teira dugesii in Madeira Island has an omnivorous regime, our results support a strong trend towards herbivory matching with the conclusions from Sadek [41] based on morphological identification of gut content. However, in the latter study, the percentage of herbivorous contents in this species was around 40% in Madeira (although strongly variable across localities), while our results indicate that it could go up to almost 74%. Indeed, this high contribution of plants in the overall diet agrees with previous studies on insular lizard species, where it was observed that an increment of plant matter ingestion is a way to overcome arthropod scarcity [7,10,17,18,19,20]. Therefore, it is not surprising that the main diet items of T. dugesii belong to three plant families (Musaceae, Poaceae, and Asteraceae), and to a single animal family (Armadillidiidae) (Table S5). It would be, however, important to compare these herbivory values with those from the introduced continental populations (Lisbon [37], and Porto [38]), to confirm the effect of insularity on diet richness and composition. In some lizard species, there seems to be an endogenous component, since herbivory remains in the continental introduced populations [49]. Perhaps long-term evolution in insularity also carries a behavioural component, with insular lizards recognising plant matter as potential diet items, contrary to continental species. Nevertheless, the percentage of herbivory obtained in our study is nowhere near what is observed in Gallotia sp. lizards, from the neighbouring Canary Islands. In these giant lacertids, plant matter intake can vary from 51.85% in G. atlantica [47], 82.13% in G. caesaris [48], to 93.3% in G. stehlini [93]. Also, the considerable size characteristic of most Gallotia species (mean male SVL ranges between 62 mm in G. a. mahoratae and 185 mm G. stehlini [94]), matches with the initial hypothesis that a large body was at least a prerequisite for herbivory [10,11]. The Madeira wall lizard seems to deviate from this trend, since this is a medium-sized lizard, with an SVL ranging from 47.93 mm (females’ minimum) to 79.96 mm (males’ maximum) (Table S1). Certainly, the evolution of body size is too complex and known to greatly influence many aspects of the morphology, physiology, and ecology of organisms, being often linked to speciation and extinction evolutionary rates (references in [95]).
Although animal items contributed to only 26% of prey occurrences in T. dugesii, we were able to identify 22 different orders and 56 families. This is not far from the ones identified in Sadek [41] (20), analysing stomach and intestine contents. However, our metabarcoding study provided higher taxonomic resolution, something unreachable by any morphology-based diet study. Unfortunately, those tend to underestimate soft-bodied prey incidence, since only partially undigested items can be detected [96], a limitation not affecting metabarcoding studies. Hence, the study from Sadek [41] was not able to assign any of the plant material to a taxonomical level, contrary to what we obtained here. Moreover, merging the results from stomach and intestine contents is also really not advisable [97]. This limitation of morphology-based scatology, sets apart our study from Sadek [41], which might also explain some of the mismatches regarding the predictors affecting diet composition. Our results confirm that the level of herbivory is not related to the geographic location (Table S4 and Figure S3), contrary to Sadek [41]’s conclusions. Indeed, the preference for the consumption of plant matter over animal prey remains stable in our sample. However, as in Sadek [41], we too observe that herbivory changes with sex, size, and mass (Table S4 and Figure 5). Specifically, as males grow bigger and heavier, they significantly increase their plant matter intake, while females do not. Larger bodies and abdomens allow for the allocation of a longer and more complex digestive system with compartmentalisation (intestinal caeca and valves [21]), able to better decompose cellulose and other complex compounds by the intestinal flora [2], as observed in both Gallotia and Teira dugesii. Teira dugesii is not strongly dimorphic (Figure 2) yet, males are longer and heavier than females (Figure S1; [98,99]). Since males attain larger sizes, they can also accommodate bigger weight values (Figure 5), which translates into longer guts and a higher capacity to digest plant matter in comparison to females. Moreover, because field sampling was carried out in March 2022 (early reproductive season [59]), and females were still not undergoing vitellogenesis, males could be selecting prey items that minimise foraging time (such as plants) to devote more effort to social interactions [100]. Though, this hypothesis seems more unlikely, since Sadek [41] obtained this same differential consumption of plant matter between the sexes from a sampling carried out during the reproductive season of T. dugesii (June–September [59]).
Among vertebrate prey, we were only able to detect the presence of the introduced gecko Tarentola mauritanica in almost 2% of the samples. Surprisingly, T. mauritanica was identified in the diet even in locations where this gecko species has not yet been recorded but is predicted to occur according to the species distribution model from Silva-Rocha et al. [101]. Moreover, we found no traces of seabirds, as observed in Matias, Rebelo, Granadeiro and Catry [42], and Sadek [41] in Desertas, Porto Santo, and Selvagens. Considering that this absence of seabirds in the diet was confirmed in the seashore populations of São Vicente and Porto Moniz, this could indicate that either T. dugesii from Madeira Island is not preying on these birds, or because sampling was performed before bird breeding season there were no chicks for the lizards to prey on (as documented in [42]). In fact, the study from Sadek [41] also failed to detect any feathers in the gut contents of lizards from Madeira Island. Though predation of birds by reptiles is apparently a common phenomenon (e.g., [102,103]), there are few documented cases of reptiles preying on seabirds, considering their relative frequency of co-occurrence in oceanic islands. This is especially true in Desertas and Selvagens, which concentrate the biggest bird colonies in the Madeira archipelago [104]. Hence, the predation of seabirds by T. dugesii in these islands, could just be a consequence of prey availability.
Moreover, our results do not reveal any effect of sex or size on both OTU and family composition (Table S4), contrarily to what was obtained in Sadek [41]. Since adult males are generally larger than females, this might hypothetically bestow the males with the capacity to produce stronger bite forces and to feed on larger and/or harder prey items [105]. However, the lack of a sex-related difference in diet composition beyond those deriving from body size might indicate that the observed phenotypic sexual dimorphism in T. dugesii is mostly associated with male-male antagonism and mate acquisition, a known driver of sexual selection in lizards (e.g., [106,107,108,109,110]). Indeed, lacertids rarely exert the maximal bite force when consuming prey and large individuals keep consuming small prey items all the same [7]. Although phylogenetically unrelated, this same pattern was also obtained in the lizard gecko Tarentola mauritanica from Madeira Island [64].
Instead, population is the most important driver for diet composition differences in T. dugesii (Table S4). Furthermore, the predominance of Musaceae, Poaceae, and Asteraceae in the diet composition (Table S5) can either indicate that these taxa are particularly abundant or maybe reflect a genuine preference for T. dugesii for these families compared to others. As far as we know, among the 139 families of vascular plants reported for the Madeira and Selvagens archipelagos, the families Poaceae, Asteraceae, and Fabaceae have the highest number of taxa and altogether amount to 32.5% of total taxa [58]. Hence, despite the indications of trophic selection, (e.g., between sexes) there is strong evidence that the availability and diversity of these plant groups in Madeira Island is related to their higher proportion in the diet of T. dugesii.
Nevertheless, the univariate tests of abundance data have shown that the differences in diet composition among populations were due to the plant families Musaceae, Oxalidaceae, Urticaceae, Rutaceae, Acanthaceae, Myrtaceae, and Pinaceae, and a single invertebrate from the amphipod family Talitridae (Table S5). Clearly, the individuals from Paúl da Serra present a smaller number of families, and in Ponta de São Lourenço almost all of them are represented but in very low frequencies (Figure 6b). In the case of Paúl da Serra, this is most likely related to the lower number of samples collected.
At the OTU level, deviance was higher in an unidentified species of Bituminaria sp. and Asteraceae sp., both appearing in very high frequencies in Ponta de São Lourenço, in comparison to the other habitats (Table S5). Clearly, and as explained before, the predominance of the Asteraceae family in samples from this locality seems to be related to its availability in the area. The plant genus Bituminaria are Fabaceae rupicolous and ruderal plants [111], which show preferences for well-nitrogenated, dry, stony, and basic soils [112], such as the ones we find in Ponta de São Lourenço. Importantly, Bituminaria bituminosa was one of the main species in the diet of the highly herbivorous Gallotia simonyi from the Canary Islands [113], known to be very rich in proteins, which could cover the deficit due to the scarcity of animal diet.

5. Conclusions

Like other insular lizard species, T. dugesii has an omnivorous diet with a high proportion of plant matter, increasing only in males as they get bigger. In fact, this consumption of plants over animal prey seems to be stable across all studied populations. However, neither the OTU and family richness nor the composition of the diet of T. dugesii are affected by sex in adult individuals, suggesting that the Madeiran lizard can attain its trophic requirements under a wide spectrum of environmental conditions. However, the species fulfils these requirements by consuming different species combinations, especially plants, according to what it finds available in each locality, matching with the floristic and faunistic heterogeneity of Madeira Island.

Supplementary Materials

The following supporting information can be downloaded at: https://www.mdpi.com/article/10.3390/d14121078/s1, Table S1: Dietary data from adult Teira dugesii in Madeira; Table S2: Two-way ANOVA results on the effect of population and sex on body size (SVL) and mass (weight); Table S3: Results from the comparison of the several General Linear Models considering distinct combinations of the predictors. Models were ranked according to Akaike’s Information Criterion corrected for small samples (AICc), with the best ones marked in bold (ΔAIC < 2 following Burnham & Andersen 2002). K denotes the number of estimated parameters. Predictors: Habitat, Pop (Population), Sex (females and males), SVL (snout-ventral length); and Weight; Table S4. PerMANOVA and Dispersion test results on the effect of several predictors in the diet composition of T. dugesii at the OTU, family, and kingdom levels. Significant p-values are highlighted in bold; Table S5: Frequency of occurrence (%) of each prey item among populations and univariate tests from the Generalised Linear Models for Multivariate Abundance Data. A—OTU level, B—family level. Significant values are in bold; Table S6: Percentage of animal and plant items, between sexes and among populations in the overall diet of T. dugesii. See Figure S3 for graphical representation; Figure S1: Summary of the log transformed SVL (a) and body mass (b) values between sexes across all populations; Figure S2: Distribution of the average OTU (a) and Family (b) richness across all populations; Figure S3: Frequency of Occurrence (%) of plant and animal items across all populations. See Table S5 for exact percentage values.

Author Contributions

Conceptualisation, C.R. and M.A.C.; Methodology, C.R.; Software, C.R.; Validation, C.R.; Formal analysis, C.R. and M.A.C.; Investigation, C.R., T.D. and M.A.C.; Resources, C.R., T.D. and M.A.C.; Writing—original draft, C.R. and M.A.C.; Writing—review and editing, C.R., T.D. and M.A.C.; Funding acquisition, C.R. All authors have read and agreed to the published version of the manuscript.

Funding

CR is supported by a postdoctoral contract from Foundation for Science and Technology (FCT), Portugal (DL57/2016/CP1440/CT0005). Field and lab work was co-funded via national funds through FCT and EU funds European Regional Development Fund (ERDF) under the projects PTDC/BIA-EVL/27958/2017—POCI-01-0145-FEDER-027958 (to CR) and PTDC/BIA-CBI/28014/2017, 2022.03391.PTDC (to MAC). Work co-funded by the project NORTE-01-0246-FEDER-000063, supported by Norte Portugal Regional Operational Programme (NORTE2020), under the PORTUGAL 2020 Partnership Agreement, through the European Regional Development Fund (ERDF).

Institutional Review Board Statement

Not applicable.

Data Availability Statement

Raw sequences used in this study were deposited in the European Nucleotide Archive as Project #PRJEB57335. Scripts used in the study are available upon request.

Acknowledgments

The authors would like to thank Ricardo Rocha, Prem Aguilar, Verónica Gomes, and Hélder Cabo for their help in the field. Specimens’ collection and scat samples transport were performed under the permits 03/IFCN/2022 and 01/IFCN/2022 provided by the Instituto das Florestas e Conservação da Natureza, IP-RAM (IFCN).

Conflicts of Interest

The authors declare no conflict of interest.

References

  1. Crawley, M.J. Herbivory. The Dynamics of Animal–Plant Interactions; Blackwell Scientific Publications: Hoboken, NJ, USA, 1983. [Google Scholar]
  2. King, G.M. Reptiles and Herbivory; University of California Press: Berkeley, CA, USA, 1996. [Google Scholar]
  3. Owen-Smith, R.N. Adaptive Herbivore Ecology: From Resources to Populations in Variable Environments; Cambridge University Press: Cambridge, UK, 2002. [Google Scholar]
  4. Pough, F.H.; Janis, C.M.; Heiser, J.B. Vertebrate Life; Prentice Hall: Upper Saddle River, NJ, USA, 1999. [Google Scholar]
  5. Sues, H.-D. Evolution of Herbivory in Terrestrial Vertebrates; Cambridge University Press: Cambridge, UK, 2000. [Google Scholar]
  6. Krebs, C.J. Ecological Methodology, 2nd ed.; Benjamin Cummings: Menlo Park, CA, USA, 1999. [Google Scholar]
  7. Carretero, M.A. From set menu to a la carte. Linking issues in trophic ecology of Mediterranean lacertids. Ital. J. Zool. 2004, 71, 121–133. [Google Scholar] [CrossRef] [Green Version]
  8. Tirado, C.; Cortés, A.; Miranda-Urbina, E.; Carretero, M. Trophic preferences in an assemblage of mammal herbivores from Andean Puna (Northern Chile). J. Arid Environ. 2012, 79, 8–12. [Google Scholar] [CrossRef]
  9. Cooper, W.E., Jr.; Vitt, L.J. Distribution, extent, and evolution of plant consumption by lizards. J. Zool. 2002, 257, 487–517. [Google Scholar] [CrossRef] [Green Version]
  10. Van Damme, R. Evolution of herbivory in lacertid lizards: Effects of insularity and body size. J. Herpetol. 1999, 33, 663–674. [Google Scholar] [CrossRef]
  11. Pough, F.H. Lizard energetics and diet. Ecology 1973, 54, 837–844. [Google Scholar] [CrossRef] [Green Version]
  12. Losos, J.B.; Ricklefs, R.E. Adaptation and diversification on islands. Nature 2009, 457, 830–836. [Google Scholar] [CrossRef]
  13. Hofman, C.A.; Rick, T.C.; Hawkins, M.T.; Funk, W.C.; Ralls, K.; Boser, C.L.; Collins, P.W.; Coonan, T.; King, J.L.; Morrison, S.A. Mitochondrial genomes suggest rapid evolution of dwarf California Channel Islands foxes (Urocyon littoralis). PLoS ONE 2015, 10, e0118240. [Google Scholar] [CrossRef] [Green Version]
  14. Buglione, M.; Petrelli, S.; Maselli, V.; Trapanese, M.; Salvemini, M.; Aceto, S.; Di Cosmo, A.; Fulgione, D. Fixation of genetic variation and optimization of gene expression: The speed of evolution in isolated lizard populations undergoing Reverse Island Syndrome. PLoS ONE 2019, 14, e0224607. [Google Scholar] [CrossRef] [Green Version]
  15. Brown, R.; Pérez-Mellado, V. Ecological energetics and food acquisition in dense Menorcan islet populations of the lizard Podarcis lilfordi. Funct. Ecol. 1994, 8, 427–434. [Google Scholar] [CrossRef]
  16. Pafilis, P.; Foufopoulos, J.; Poulakakis, N.; Lymberakis, P.; Valakos, E. Digestive performance in five Mediterranean lizard species: Effects of temperature and insularity. J. Comp. Physiol. B 2007, 177, 49–60. [Google Scholar] [CrossRef]
  17. Pérez-Mellado, V.; Corti, C. Dietary adaptations and herbivory in lacertid lizards of the genus Podarcis from western Mediterranean islands (Reptilia: Sauria). Bonn. Zool. Beitr 1993, 44, 193–220. [Google Scholar]
  18. Janzen, D.H. Sweep samples of tropical foliage insects: Effects of seasons, vegetation types, elevation, time of day, and insularity. Ecology 1973, 54, 687–708. [Google Scholar] [CrossRef]
  19. Olesen, J.M.; Valido, A. Lizards as pollinators and seed dispersers: An island phenomenon. Trends Ecol. Evol. 2003, 18, 177–181. [Google Scholar] [CrossRef]
  20. Perez-Cembranos, A.; Leon, A.; Perez-Mellado, V. Omnivory of an insular lizard: Sources of variation in the diet of Podarcis lilfordi (Squamata, Lacertidae). PLoS ONE 2016, 11, e0148947. [Google Scholar] [CrossRef] [PubMed]
  21. Herrel, A.; Vanhooydonck, B.; Van Damme, R. Omnivory in lacertid lizards: Adaptive evolution or constraint? J. Evol. Biol. 2004, 17, 974–984. [Google Scholar] [CrossRef]
  22. Roca, V. Relación entre las faunas endoparásitas de reptiles y su tipo de alimentación. Rev. Española De Herpetol. 1999, 13, 101–121. [Google Scholar]
  23. Buglione, M.; Ricca, E.; Petrelli, S.; Baccigalupi, L.; Troiano, C.; Saggese, A.; Rivieccio, E.; Fulgione, D. Gut microbiota plasticity in insular lizards under reversed island syndrome. Sci. Rep. 2022, 12, 12682. [Google Scholar] [CrossRef]
  24. Kohl, K.D.; Brun, A.; Magallanes, M.; Brinkerhoff, J.; Laspiur, A.; Acosta, J.C.; Bordenstein, S.R.; Caviedes-Vidal, E. Physiological and microbial adjustments to diet quality permit facultative herbivory in an omnivorous lizard. J. Exp. Biol. 2016, 219, 1903–1912. [Google Scholar] [CrossRef] [Green Version]
  25. Vitt, L.; Caldwell, J.; Sartorius, S.; Cooper, W., Jr.; Baird, T.; Baird, T.; Pérez-Mellado, V. Pushing the edge: Extended activity as an alternative to risky body temperatures in a herbivorous teiid lizard (Cnemidophorus murinus: Squamata). Funct. Ecol. 2005, 19, 152–158. [Google Scholar] [CrossRef]
  26. Sagonas, K.; Pafilis, P.; Valakos, E.D. Effects of insularity on digestion: Living on islands induces shifts in physiological and morphological traits in island reptiles. Sci. Nat. 2015, 102, 55. [Google Scholar] [CrossRef]
  27. Rocha, C.F.D. Ontogenetic shift in the rate of plant consumption in a tropical lizard (Liolaemus lutzae). J. Herpetol. 1998, 32, 274–279. [Google Scholar] [CrossRef]
  28. Fuentes, E.R.; Di Castri, F. Ensayo de Herbivoría Experimental en Especies de Liolaemus (Iguanidae) Chilenos. Anales del Museo de Historia Natural de Valparaíso (Chile) 2015, 8, 66–75. [Google Scholar]
  29. Schluter, D. Body size, prey size and herbivory in the Galapagos lava lizard, Tropidurus. Oikos 1984, 43, 291–300. [Google Scholar] [CrossRef]
  30. Cunningham, P.L. Notes on the diet, survival rate, and burrow specifics of Uromastyx aegyptius. Asiat. Herpetol. Res. 2001, 9, 30–33. [Google Scholar]
  31. Espinoza, R.E.; Wiens, J.J.; Tracy, C.R. Recurrent evolution of herbivory in small, cold-climate lizards: Breaking the ecophysiological rules of reptilian herbivory. Proc. Natl. Acad. Sci. USA 2004, 101, 16819–16824. [Google Scholar] [CrossRef] [Green Version]
  32. Brehm, A.; Jesus, J.; Spınola, H.; Alves, C.; Vicente, L.; Harris, D. Phylogeography of the Madeiran endemic lizard Lacerta dugesii inferred from mtDNA sequences. Mol. Phylogenetics Evol. 2003, 26, 222–230. [Google Scholar] [CrossRef]
  33. Paulo Sá-Sousa, P.; Sindaco, R. Teira dugesii (errata version published in 2017). In The IUCN Red List of Threatened Species 2009; 2009; e.T61521A121720531. Available online: https://www.iucnredlist.org/ (accessed on 17 November 2022).
  34. Jesus, J. Lacerta dugesii. In Atlas dos Anfíbios e Répteis de Portugal; Loureiro, A., Ferrand de Almeida, N., Carretero, M.A., Paulo, O.S., Eds.; Instituto de Conservação da Natureza e da Biodiversidade: Lisboa, Portugal, 2008; pp. 190–191. [Google Scholar]
  35. Ulfstrand, S. On the vertebrate fauna of the Azores. Bol. Mus. Munic. Funchal 1961, 14, 75–86. [Google Scholar]
  36. Malkmus, R. Zur Verbreitung von Rana perezi und Lacerta dugesii auf den Azoren. Nachr. Des Naturwissen. Mus. Aschaffenbg. 1985, 92, 37–69. [Google Scholar]
  37. Sá-Sousa, P. The introduced Madeiran lizard, Lacerta (Teira) dugesii in Lisbon. Amphib.-Reptil. 1995, 16, 211–214. [Google Scholar] [CrossRef]
  38. Ferreira, A.I.; Vasconcelos, D.S.; Harris, D.J. Origins of an introduced Teira dugesii (Lacertidae) population in Porto. Herpetol Notes, 2022; in press. [Google Scholar]
  39. Mateo, J.A.; Ayres, C.; López-Jurado, L.F. Los anfibios y reptiles naturalizados en España: Historia y evolución de una problemática creciente. Historia y evolución de una problemática creciente. Boletín Asoc. Herpetol. Esp. 2011, 22, 2–42. [Google Scholar]
  40. Santos, L.-D.; López-Jurado, L.F.; Hernández-Peñate, A.; Mateo, J.A. Una nueva población de lagartija (Teira dugesii) en Las Palmas de Gran Canaria. Boletín Asoc. Herpetol. Esp. 2013, 24, 102–103. [Google Scholar]
  41. Sadek, R.A. The diet of the Madeiran lizard Lacerta dugesii. Zool. J. Linn. Soc. 1981, 73, 313–341. [Google Scholar] [CrossRef]
  42. Matias, R.; Rebelo, R.; Granadeiro, J.; Catry, P. Predation by Madeiran wall lizards Teira dugesii on Cory’s shearwater Calonectris diomedea hatchlings at Selvagem Grande, North Atlantic. Waterbirds 2009, 32, 600–603. [Google Scholar] [CrossRef]
  43. Neves, V.C.; Nava, C.; Monteiro, E.V.; Monteiro, P.R.; Bried, J. Depredation of Monteiro’s Storm-petrel (Hydrobates monteiroi) chicks by Madeiran wall lizards (Lacerta dugesii). Waterbirds 2017, 40, 82–86. [Google Scholar] [CrossRef]
  44. Neves, V.; Rund, D.; Pinho, C.J.; Vasconcelos, R.; Bustamante, P.; Quillfeldt, P. Diet of the exotic Madeiran wall lizard: First insights into trophic interactions in an Atlantic seabird sanctuary. Herpetozoa 2022, 35, 107–113. [Google Scholar] [CrossRef]
  45. Elvers, I. Flower-visiting lizards on Madeira. Bot. Not. 1977, 130, 231–234. [Google Scholar]
  46. Lopez-Darias, M.; Vanhooydonck, B.; Cornette, R.; Herrel, A. Sex-specific differences in ecomorphological relationships in lizards of the genus Gallotia. Funct. Ecol. 2015, 29, 506–514. [Google Scholar] [CrossRef]
  47. Carretero, M.A.; Jorge, F.; Llorente, G.A.; Roca, V. Relationships between helminth communities and diet in Canarian lizards: The evidence from Gallotia atlantica (Squamata: Lacertidae). J. Nat. Hist. 2014, 48, 1199–1216. [Google Scholar] [CrossRef]
  48. Martin, J.; Llorente, G.; Roca, V.; Carretero, M.; Montori, A.; Santos, X.; Romeu, R. Relationship between diet and helminths in Gallotia caesaris (Sauria: Lacertidae). Zoology 2005, 108, 121–130. [Google Scholar] [CrossRef]
  49. Carretero, M.A.; Llorente, G.A.; Santos, X.; Montori, A. The diet of an introduced population of Podarcis pityusensis. ls herbivory fixed? In Mediterranean Basin Lacertid Lizards. A Biological Approach; Vicente, L., Crespo, E.G., Eds.; ICN: Lisboa, Portugal, 2001; pp. 113–124. [Google Scholar]
  50. Gil, V.; Pinho, C.J.; Aguiar, C.A.; Jardim, C.; Rebelo, R.; Vasconcelos, R. Questioning the proverb ‘more haste, less speed’: Classic versus metabarcoding approaches for the diet study of a remote island endemic gecko. PeerJ 2020, 8, e8084. [Google Scholar] [CrossRef] [PubMed] [Green Version]
  51. Tercel, M.P.T.G.; Symondson, W.O.C.; Cuff, J.P. The problem of omnivory: A synthesis on omnivory and DNA metabarcoding. Mol. Ecol. 2021, 30, 2199–2206. [Google Scholar] [CrossRef] [PubMed]
  52. Taberlet, P.; Coissac, E.; Pompanon, F.; Brochmann, C.; Willerslev, E. Towards next-generation biodiversity assessment using DNA metabarcoding. Mol. Ecol. 2012, 21, 2045–2050. [Google Scholar] [CrossRef] [PubMed]
  53. Alberdi, A.; Aizpurua, O.; Bohmann, K.; Gopalakrishnan, S.; Lynggaard, C.; Nielsen, M.; Gilbert, M.T.P. Promises and pitfalls of using high-throughput sequencing for diet analysis. Mol. Ecol. Resour. 2019, 19, 327–348. [Google Scholar] [CrossRef] [PubMed]
  54. Ando, H.; Mukai, H.; Komura, T.; Dewi, T.; Ando, M.; Isagi, Y. Methodological trends and perspectives of animal dietary studies by noninvasive fecal DNA metabarcoding. Environ. DNA 2020, 2, 391–406. [Google Scholar] [CrossRef]
  55. Geldmacher, J.; van den Bogaard, P.; Hoernle, K.; Schmincke, H.U. The 40Ar/39Ar age dating of the Madeira Archipelago and hotspot track (eastern North Atlantic). Geochem. Geophys. Geosyst. 2000, 1, 1008. [Google Scholar] [CrossRef] [Green Version]
  56. Santos, J.M.F. Análise e modelação espácio-temporal do mosquito vetor do dengue na ilha da Madeira. Master’s Thesis, University of Lisbon, Lisbon, Portugal, 2018. [Google Scholar]
  57. Capelo, J.; Menezes de Sequeira, M.; Jardim, R.; Mesquita, S. Biologia e ecologia das florestas das ilhas—Madeira. In Árvores e Florestas de Portugal, Açores e Madeira—A Floresta das Ilhas; Sande Silva, J., Ed.; Fundação Luso Americana para o Desenvolvimento, Público e Liga para a Protecção da Natureza: Lisbon, Portugal, 2007; Volume 6, pp. 81–134. [Google Scholar]
  58. Borges, P.A.V.; Abreu, C.; Aguiar, A.M.F.; Carvalho, P.; Jardim, R.; Melo, I.; Oliveira, P.; Sérgio, C.; Serrano, A.R.M.; Vieira, P. Listagem dos Fungos, Flora e Fauna Terrestres dos Arquipélagos da Madeira e Selvagens = A List of the Terrestrial Fungi, Flora and Fauna of Madeira and Selvagens Archipelagos; Secretaria Regional do Ambiente e dos Recursos Naturais do Governo Regional da Madeira: Funchal, Madeira, 2008; p. 438. [Google Scholar]
  59. Galán, P.; Vicente, L. Reproductive characteristics of the insular lacertid Teira dugesii. Herpetol. J. 2003, 13, 149–154. [Google Scholar]
  60. Báez, M. Observaciones sobre colorido y diseño de Podarcis dugesii en la isla de Madeira (Sauria, Lacertidae). Vieraea 1990, 18, 197–203. [Google Scholar]
  61. Taberlet, P.; Coissac, E.; Pompanon, F.; Gielly, L.; Miquel, C.; Valentini, A.; Vermat, T.; Corthier, G.; Brochmann, C.; Willerslev, E. Power and limitations of the chloroplast trn L (UAA) intron for plant DNA barcoding. Nucleic Acids Res. 2007, 35, e14. [Google Scholar] [CrossRef] [Green Version]
  62. Vamos, E.E.; Elbrecht, V.; Leese, F. Short COI markers for freshwater macroinvertebrate metabarcoding. Metabarcoding Metagenomics 2017, e14625. [Google Scholar] [CrossRef] [Green Version]
  63. Zhang, J.; Kobert, K.; Flouri, T.; Stamatakis, A. PEAR: A fast and accurate Illumina Paired-End reAd mergeR. Bioinformatics 2014, 30, 614–620. [Google Scholar] [CrossRef] [PubMed] [Green Version]
  64. Martins, B.; Silva-Rocha, I.; Rocha, R.; Mata, V.A.; Gonçalves, Y.; Rato, C. Trophic interactions of an invasive gecko in an endemic-rich oceanic island: Insights using DNA metabarcoding. Front. Ecol. Evol. 2022; in press. [Google Scholar] [CrossRef]
  65. Andújar, C.; Arribas, P.; Gray, C.; Bruce, C.; Woodward, G.; Yu, D.W.; Vogler, A.P. Metabarcoding of freshwater invertebrates to detect the effects of a pesticide spill. Mol. Ecol. 2018, 27, 146–166. [Google Scholar] [CrossRef] [PubMed] [Green Version]
  66. Boyer, F.; Mercier, C.; Bonin, A.; Le Bras, Y.; Taberlet, P.; Coissac, E. obitools: A unix-inspired software package for DNA metabarcoding. Mol. Ecol. Resour. 2016, 16, 176–182. [Google Scholar] [CrossRef]
  67. Rognes, T.; Flouri, T.; Nichols, B.; Quince, C.; Mahé, F. VSEARCH: A versatile open source tool for metagenomics. PeerJ 2016, 4, e2584. [Google Scholar] [CrossRef] [PubMed] [Green Version]
  68. Frøslev, T.G.; Kjøller, R.; Bruun, H.H.; Ejrnæs, R.; Brunbjerg, A.K.; Pietroni, C.; Hansen, A.J. Algorithm for post-clustering curation of DNA amplicon data yields reliable biodiversity estimates. Nat. Commun. 2017, 8, 1188. [Google Scholar] [CrossRef] [Green Version]
  69. Mata, V.A.; Amorim, F.; Corley, M.F.; McCracken, G.F.; Rebelo, H.; Beja, P. Female dietary bias towards large migratory moths in the European free-tailed bat (Tadarida teniotis). Biol. Lett. 2016, 12, 20150988. [Google Scholar] [CrossRef] [Green Version]
  70. Evans, H.K.; Bunch, A.J.; Schmitt, J.D.; Hoogakker, F.J.; Carlson, K.B. High-throughput sequencing outperforms traditional morphological methods in Blue Catfish diet analysis and reveals novel insights into diet ecology. Ecol. Evol. 2021, 11, 5584–5597. [Google Scholar] [CrossRef]
  71. Buchner, D.; Leese, F. BOLDigger–a Python package to identify and organise sequences with the Barcode of Life Data systems. Metabarcoding Metagenomics 2020, 4, e53535. [Google Scholar] [CrossRef]
  72. Drummond, A.J.; Ashton, B.; Buxton, S.; Cheung, M.; Cooper, A.; Duran, C.; Field, M.; Heled, J.; Kearse, M.; Markowitz, S.; et al. Geneious [Computer Software]. 2010. Available online: http://www.geneious.com/ (accessed on 17 November 2022).
  73. R Core Team. R: A Language and Environment for Statistical Computing; R Foundation for Statistical Computing: Vienna, Austria, 2022; Available online: https://www.R-project.org/ (accessed on 17 November 2022).
  74. Wickham, H. ggplot2: Elegant Graphics for Data Analysis; Springer-Verlag: New York, NY, USA, 2016; Available online: https://ggplot2.tidyverse.org (accessed on 17 November 2022).
  75. Hothorn, T.; Bretz, F.; Westfall, P. Simultaneous inference in general parametric models. Biom. J. J. Math. Methods Biosci. 2008, 50, 346–363. [Google Scholar] [CrossRef] [Green Version]
  76. Fox, J.; Weisberg, S. An R Companion to Applied Regression, 3rd ed.; Sage: Thousand Oaks CA, USA, 2019. [Google Scholar]
  77. Mazerolle, M.J. AICcmodavg: Model Selection and Multimodel Inference Based on (Q)AIC(c). R Package Version 2.3-1. 2020. Available online: https://cran.r-project.org/package=AICcmodavg (accessed on 17 November 2022).
  78. Burnham, K.P.; Andersen, D.R. Model Selection and Multi-Model Inference: A Practical Information-Theoretic Approach; Springer-Verlag: Heidelberg, Germany, 2002. [Google Scholar]
  79. Fox, J. Effect Displays in R for Generalised Linear Models. J. Stat. Softw. 2003, 8, 1–27. [Google Scholar] [CrossRef] [Green Version]
  80. Hsieh, T.; Ma, K.; Chao, A. iNEXT: An R package for rarefaction and extrapolation of species diversity (H ill numbers). Methods Ecol. Evol. 2016, 7, 1451–1456. [Google Scholar] [CrossRef]
  81. Chao, A.; Jost, L. Coverage-based rarefaction and extrapolation: Standardizing samples by completeness rather than size. Ecology 2012, 93, 2533–2547. [Google Scholar] [CrossRef]
  82. MacGregor-Fors, I.; Payton, M.E. Contrasting diversity values: Statistical inferences based on overlapping confidence intervals. PLoS ONE 2013, 8, e56794. [Google Scholar] [CrossRef] [PubMed] [Green Version]
  83. Oksanen, J.; Blanchet, F.G.; Kindt, R.; Legendre, P.; Minchin, P.; O’hara, R.; Simpson, G.; Solymos, P.; Stevens, M.H.H.; Wagner, H. Vegan: Community ecology package. R Package Version 2013, 2, 321–326. [Google Scholar]
  84. Anderson, M.J. Distance-based tests for homogeneity of multivariate dispersions. Biometrics 2006, 62, 245–253. [Google Scholar] [CrossRef] [PubMed]
  85. Wang, Y.; Naumann, U.; Eddelbuettel, D.; Wilshire, J.; Warton, D.; Byrnes, J.; dos Santos Silva, R.; Niku, J.; Renner, I.; Wright, S. mvabund: Statistical Methods for Analysing Multivariate Abundance Data. R package version 4.2.1. Available online: https://CRAN.R-project.org/package=mvabund (accessed on 17 November 2022).
  86. Mella, J.; Tirado, C.; Cortés, A.; Carretero, M. Seasonal variation of prey consumption by Liolaemus barbarae, a highland lizard endemic to Northern Chile. Anim. Biol. 2010, 60, 413–421. [Google Scholar]
  87. Dearing, M.D.; Schall, J.J. Testing models of optimal diet assembly by the generalist herbivorous lizard Cnemidophorus murinus. Ecology 1992, 73, 845–858. [Google Scholar] [CrossRef]
  88. Stamps, J.; Tanaka, S.; Krishnan, V. The relationship between selectivity and food abundance in a juvenile lizard. Ecology 1981, 62, 1079–1092. [Google Scholar] [CrossRef]
  89. Rocha, C.F. Selectivity in plant food consumption in the lizard Liolaemus lutzae from southeastern Brazil. Stud. Neotrop. Fauna Environ. 2000, 35, 14–18. [Google Scholar] [CrossRef] [PubMed]
  90. Região Autónoma da Madeira. Ponta de S. Lourenço; Secretaria Regional do Ambiente e dos Recursos Naturais; Serviço do Parque Natural da Madeira: Madeira, Portugal, 2010. [Google Scholar]
  91. Nóbrega, H.; Freitas, G.; Zavattieri, M.; Ragonezi, C.; de Carvalho, M.Â.P. Structure and floristic composition associated with an endangered species Beta patula Aiton (Amaranthaceae) in the Islands of Madeira Archipelago. Biodivers. Data J. 2021, 9, e61091. [Google Scholar] [CrossRef] [PubMed]
  92. Camacho, R.A.P. Influência de Diferentes Dietas em Teira dugesii (Milne-Edwards, 1829); Universidade da Madeira: Funchal, Madeira, 2002. [Google Scholar]
  93. Carretero, M.A.; Roca, V.; Martín, J.E.; Llorente, G.A.; Montori, A.; Santos, X.; Mateos, J. Diet and helminth parasites in the Gran Canaria giant lizard, Gallotia stehlini. Rev. Esp. Herpetol. 2006, 20, 105–117. [Google Scholar]
  94. Molina-Borja, M.; Rodríguez-Domínguez, M. Evolution of biometric and life-history traits in lizards (Gallotia) from the Canary Islands. J. Zool. Syst. Evol. Res. 2004, 42, 44–53. [Google Scholar] [CrossRef]
  95. Meiri, S. Evolution and ecology of lizard body sizes. Glob. Ecol. Biogeogr. 2008, 17, 724–734. [Google Scholar] [CrossRef]
  96. Ingerson-Mahar, J. Relating diet and morphology in adult carabid beetles. In The Agroecology of Carabid Beetles; Holland, J.M., Ed.; Intercept Limited: Andover, UK, 2002; pp. 111–136. [Google Scholar]
  97. Carretero, M.; Llorente, G. What are they really eating? Stomach versus intestine as sources of diet information in lacertids. In Mediterranean Basin Lacertid Lizards: A Biological Approach; Vicente, L., Crespo, E.G., Eds.; ICN: Lisboa, Portugal, 2001; pp. 105–112. [Google Scholar]
  98. Cook, L. Variation in the Madeiran lizard Lacerta dugesii. J. Zool. 1979, 187, 327–340. [Google Scholar] [CrossRef]
  99. Crisp, M.; Cook, L.; Hereward, F. Color and heat balance in the lizard Lacerta dugesii. Copeia 1979, 1979, 250–257. [Google Scholar] [CrossRef]
  100. Díaz, J.A.; Carrascal, L.M. Prey size and food selection of Psammodromus algirus (Lacertidae) in central Spain. J. Herpetol. 1990, 24, 342–347. [Google Scholar] [CrossRef] [Green Version]
  101. Silva-Rocha, I.; Santos, J.M.; Rocha, R.; Rato, C. Bioclimatic and local drivers modulating the expansion of an introduced temperate reptile in a subtropical island. Glob. Ecol. Conserv. 2022, 37, e02164. [Google Scholar] [CrossRef]
  102. Guarino, F. Diet of a large carnivorous lizard, Varanus varius. Wildl. Res. 2001, 28, 627–630. [Google Scholar] [CrossRef] [Green Version]
  103. Weatherhead, P.J.; Blouin-Demers, G. Understanding avian nest predation: Why ornithologists should study snakes. J. Avian Biol. 2004, 35, 185–190. [Google Scholar] [CrossRef]
  104. SRA. Estratégia Marinha para a subdivisão da Madeira. Diretiva Quadro Estratégia Marinha; Secretaria Regional do Ambiente e dos Recursos Naturais: Lisbon, Portugal, 2014.
  105. Kaliontzopoulou, A.; Adams, D.C.; van der Meijden, A.; Perera, A.; Carretero, M.A. Relationships between head morphology, bite performance and ecology in two species of Podarcis wall lizards. Evol. Ecol. 2012, 26, 825–845. [Google Scholar] [CrossRef]
  106. Husak, J.F.; Fox, S.F. Field use of maximal sprint speed by collared lizards (Crotaphytus collaris): Compensation and sexual selection. Evolution 2006, 60, 1888–1895. [Google Scholar]
  107. Lappin, A.K.; Husak, J.F. Weapon performance, not size, determines mating success and potential reproductive output in the collared lizard (Crotaphytus collaris). Am. Nat. 2005, 166, 426–436. [Google Scholar] [CrossRef] [PubMed]
  108. Herrel, A.; Aerts, P.; Fret, J.; De Vree, F. Morphology of the feeding system in agamid lizards: Ecological correlates. Anat. Rec. Off. Publ. Am. Assoc. Anat. 1999, 254, 496–507. [Google Scholar] [CrossRef]
  109. Herrel, A.; Spithoven, L.; Van Damme, R.; De Vree, F. Sexual dimorphism of head size in Gallotia galloti: Testing the niche divergence hypothesis by functional analyses. Funct. Ecol. 1999, 13, 289–297. [Google Scholar] [CrossRef] [Green Version]
  110. Husak, J.F.; Lappin, A.K.; Van Den Bussche, R.A. The fitness advantage of a high-performance weapon. Biol. J. Linn. Soc. 2009, 96, 840–845. [Google Scholar] [CrossRef]
  111. Jardim Botânico UTAD. Espécie Bituminaria bituminosa. Available online: https://jb.utad.pt (accessed on 17 November 2022).
  112. Flora-On|Flora de Portugal. Bituminaria bituminosa. Available online: https://flora-on.pt (accessed on 17 November 2022).
  113. Pérez-Mellado, V.; Romero-Beviá, M.; Ortega, F.; Martín-García, S.; Perera, A.; López-Vicente, M.; Galache, C. El uso de los recursos troficos en Gallotia simonyi (Sauria, Lacertidae) de la isla de El Hierro (Islas Canarias). Monogr. Herpetológicas 1999, 4, 63–83. [Google Scholar]
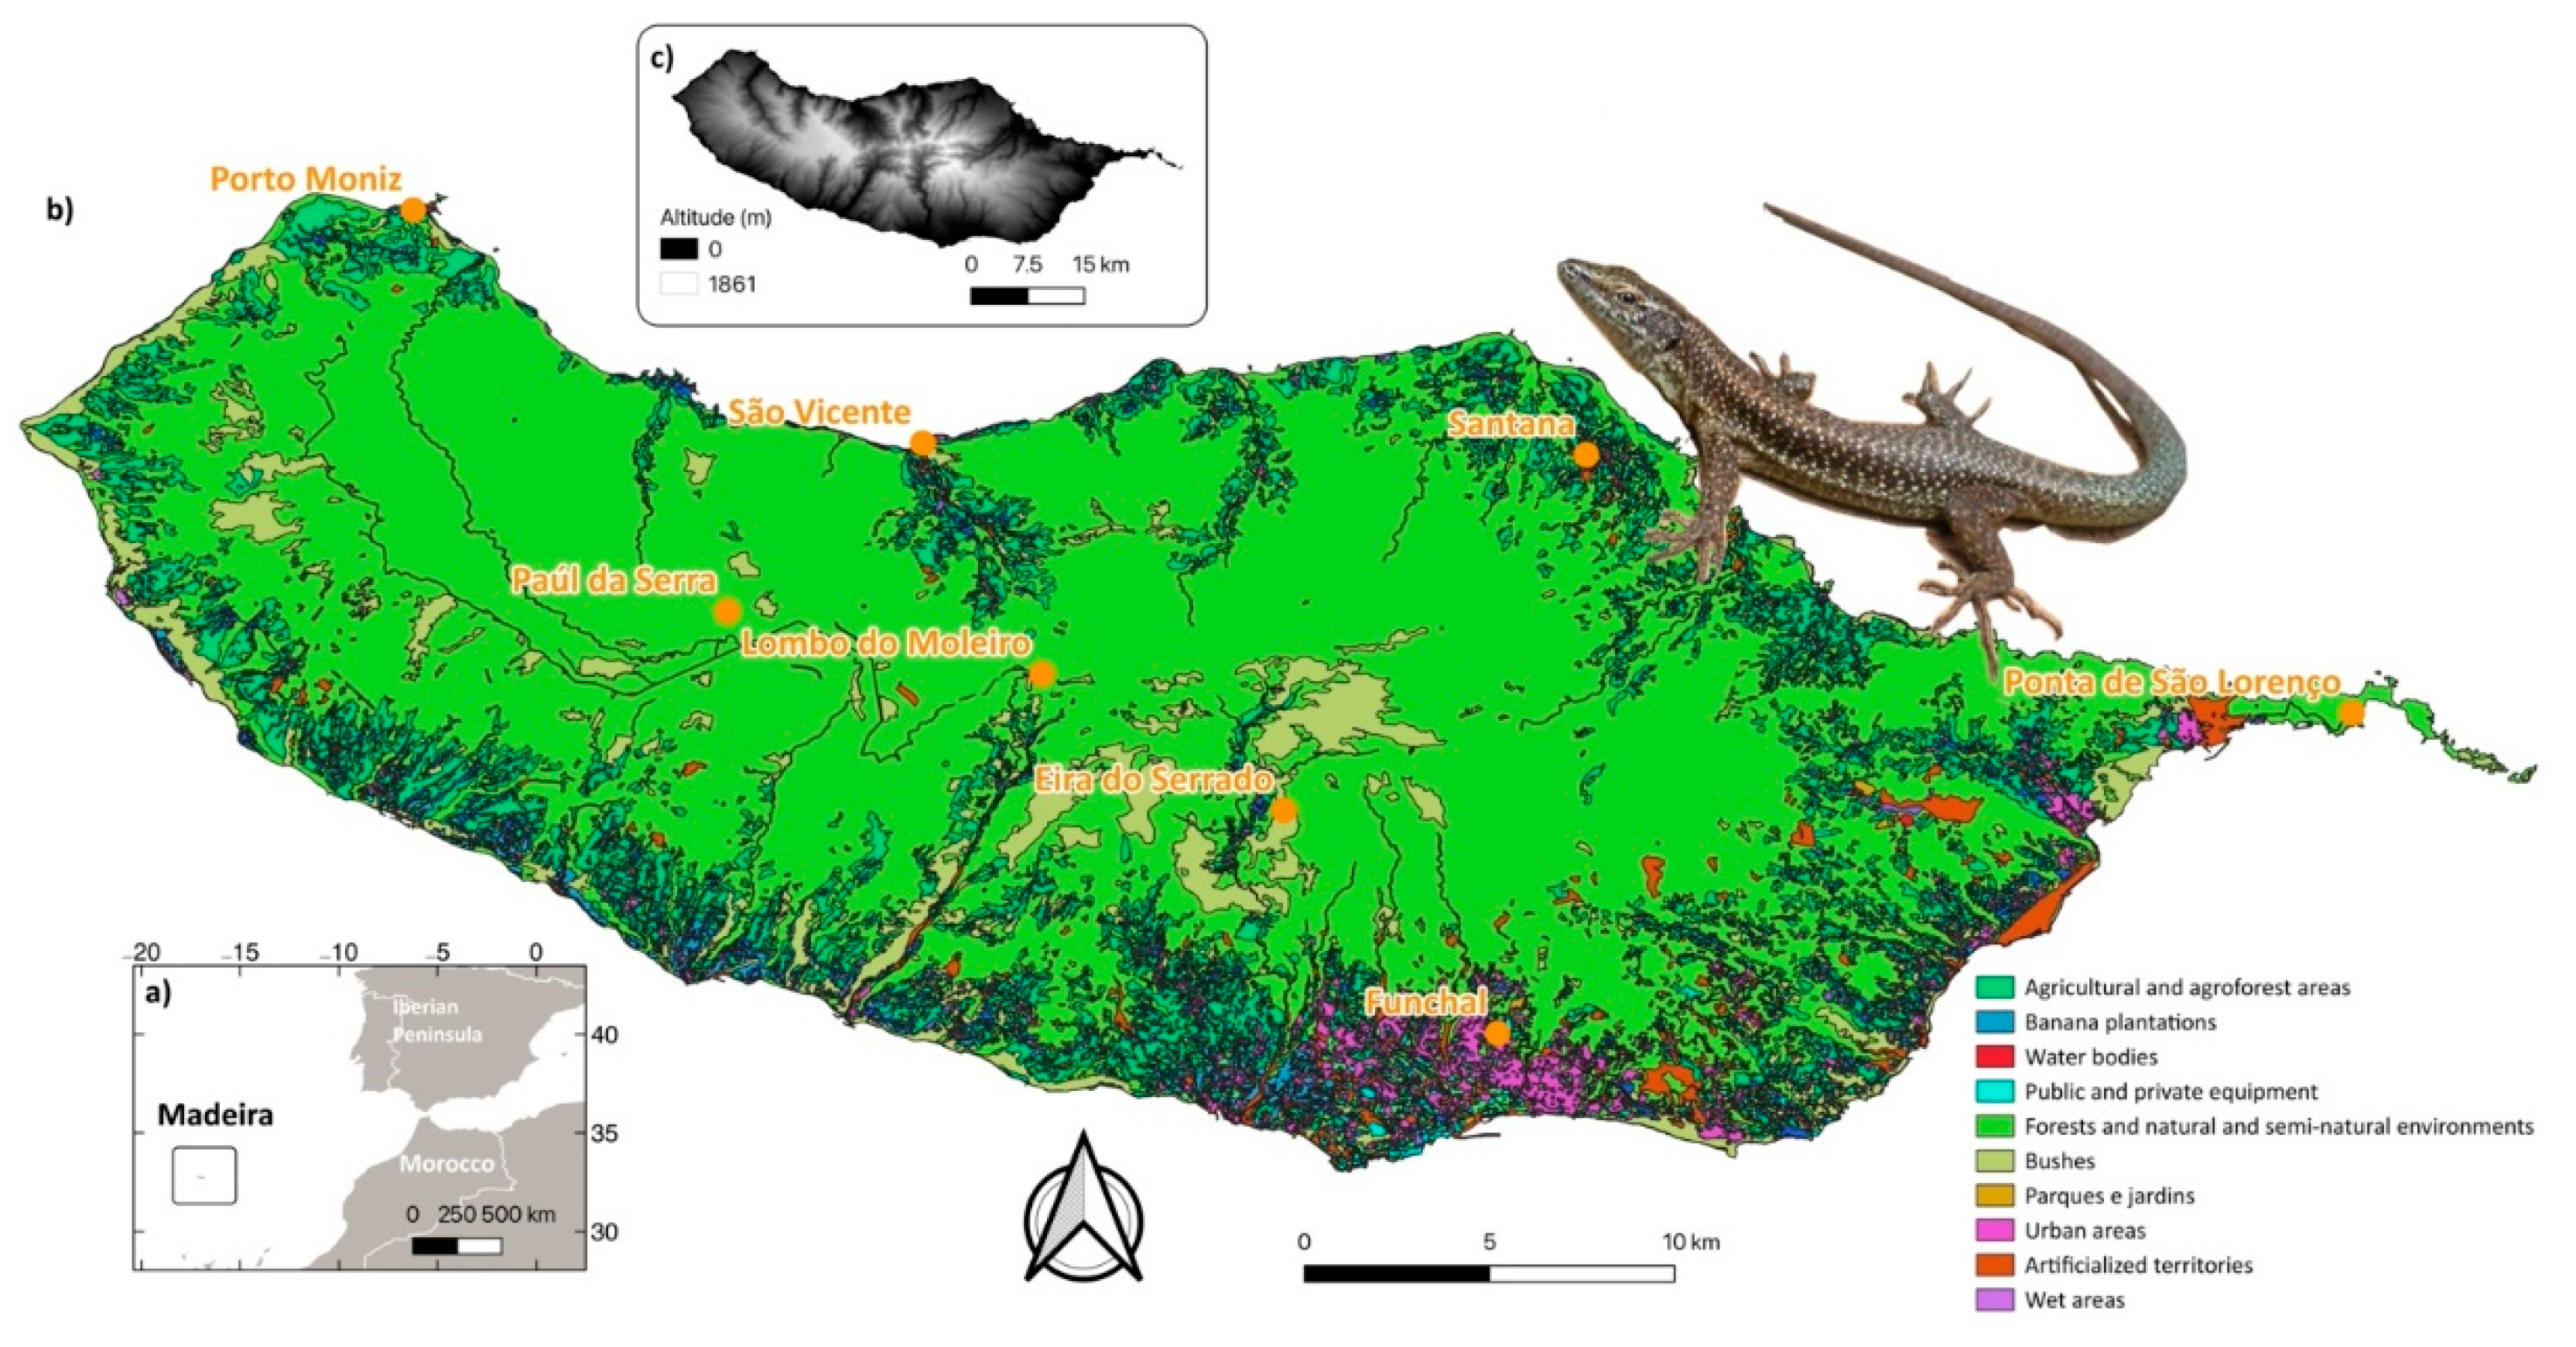
Figure 1. Map depicting the geographic location of Madeira Island (a), and the eight sampled populations across different habitats (b): Funchal (311 m.s.l.), Eira do Serrado (1051 m.s.l.), Lombo do Moleiro (1000 m.s.l.), Paúl da Serra (1446 m.s.l.), Ponta de São Lourenço (61 m.s.l.), Porto Moniz (38 m.s.l.), Santana (420 m.s.l.), and São Vicente (1 m.s.l.). A topographical map is also represented (c).
Diversity 14 01078 g001
Figure 2. Linear regression of SVL logarithm (logSVL) against body mass logarithm (logWeight) in both males and females of Teira dugesii from Madeira Island.
Diversity 14 01078 g002
Figure 3. Graphical representation of the General Linear Models results denoting the statistically significant relationships between population, and weight with OTU richness (a,b), and population towards family richness (c). Regarding the latter, the p-values of the significant pairwise relationships between populations, are depicted. The y-axis represents the fitted values of the model, i.e., the sum of the estimated fixed effect coefficient and the predicted random intercept (see text for exact p-values).
Diversity 14 01078 g003
Figure 4. Rarefaction curves for population at the OTU (a) and family (b) levels, showing the observed (full line) and estimated (dashed line) richness, until double the reference sample size, and respective 84% confidence interval by sample coverage.
Diversity 14 01078 g004
Figure 5. Linear regression of SVL (a) and weight (b) against plant frequency of occurrence in of both female and male adults of Teira dugesii.
Diversity 14 01078 g005
Figure 6. Stacked histogram representing the frequency of occurrence of the OTU (a) and family (b) diet items ingested by T. dugesii in significant proportions, according to the univariate tests. See Table S4 for details.
Diversity 14 01078 g006
Publisher’s Note: MDPI stays neutral with regard to jurisdictional claims in published maps and institutional affiliations.