Article

Effects of David Deer Grazing on Soil Bacterial and Fungal Communities in an Eastern Coastal Wetland of China

1
College of Biology and the Environment, Nanjing Forestry University, Nanjing 210037, China
2
Collaborative Innovation Center of Sustainable Forestry in Southern China of Jiangsu Province, Nanjing 210037, China
3
Yancheng Milu Institute, Yancheng 224136, China
*
Author to whom correspondence should be addressed.
Diversity 2022, 14(11), 976; https://doi.org/10.3390/d14110976
Submission received: 17 October 2022 / Revised: 30 October 2022 / Accepted: 11 November 2022 / Published: 13 November 2022

Abstract

:
The grazing activity of animals has a significant role on the environmental modification of land. In the coastal wetlands of eastern China, long-term David deer (Elaphurus davidianus) grazing has caused the degradation of various ecological elements in the area. Still, few studies have been reported concerning the effects of David deer grazing on the soil microorganisms of their habitats. We analyzed the community structure of soil bacteria and fungi in an area of continuous annual grazing and another area without traces of David deer grazing so as to learn about the effects of deer grazing on the soil microbial community structure in a spatial instead of temporal way, in preparation for improving the environment for deer survival. David deer grazing drastically changed the physicochemical characteristics of the soil, accelerating the alkalinization process and inhibiting the buildup of nutrients. There were differences in the microbial community structure between the grazed and the control areas, with bacteria predominating. The control had a higher level of bacterial and fungal alpha-diversity than the grazed area. The makeup of the soil’s microbial community was also influenced, except for the dominant microbial at the phylum level. In addition to the establishment of numerous complex fungal functional types, David deer grazing increased the number of bacterial functional types linked to the carbon cycle. The impacts of soil pH and urease activity on bacterial and fungi populations were highlighted using the redundancy analysis. This study demonstrates that David deer grazing changes and complicates microbial functional kinds of composition, as well as modifies the composition of the soil’s microbial community, improving the soil nutrient cycling process, mainly the carbon element.

1. Introduction

Grazing is a form of human land use, and ungulates’ feeding and trampling behavior affect plants and soils. Most studies on the effects of grazing animals on grounds have focused on soil physical and chemical properties [1,2], with few data on biological features such as soil microbes, which are related to soil quality [3]. With the development of second-generation sequencing technologies such as high-throughput sequencing, soil microbial communities are gradually gaining attention in studies on grazing [4,5]. Bacteria have an essential role in soil nutrient and material cycling, and fungi can decompose plant and animal residues, exist as plant and animal pathogens, and form symbioses with plants in the soil [6]. The size of soil microbial communities has shrunk due to changes in the soil environment caused by grazing [7]. Overgrazing induces changes in the structure and diversity of soil microbial communities, but the patterns are inconsistent. Wang et al. [8] found that the diversity of soil microbial communities increased with long-term grazing. In a summer pasture, Zhang et al. [9] found a decline in soil fungal community diversity. Grazing alters the relative abundance of certain microorganisms in the soil microbial community [10] and the functional composition of microorganisms. For example, Ma et al. [11] found that light grazing caused significant changes in several microbial functional gene families.
The above effects of grazing operations on soil microbial communities were centered on inland grasslands, while there were few studies on grazing in coastal mudflat wetlands. Coastal mudflat wetlands are unique ecotones between ocean and terrestrial ecosystems, which play an important role in biodiversity conservation, with significant economic importance for humans, despite their limited size. Coastal wetlands are resistant to external perturbations because of their high biodiversity ecosystem [12]; however, they could be destroyed by severe disruptions such as a high animal population density.
In 1986, 39 David deer (Elaphurus davidianus) were reintroduced to the mudflat wetlands of Dafeng in Jiangsu Province, China. The Jiangsu Dafeng Milu Reserve was also meanwhile established, which was upgraded to a national nature reserve (after this, referred to as the reserve) in 1997. By 2022, the deer population had reached 7033, far exceeding the capacity of the reserve, which put serious pressure on the deer habitat [13], leading to soil degradation accompanied by the significant loss of a variety of native vegetation [14]. The simplification of native vegetation and soil degradation caused by huge grazing pressure will affect the sustainability development of the David deer population. The impact of lying, feeding, and trampling by David deer on the land is equivalent to grazing. The reserve is located on the shores of the Yellow Sea and is a typical coastal mudflat wetland. The soil features a high pH and salinity, and the urine legacy of grazing animals raises the soil pH [15] and increases soil alkalinity. Soil microorganisms are more influenced by the physical and chemical properties of the soil than plants. Soil pH influences soil microbial communities by changing their diversity [16,17]. High salinity accumulated in the soil affects soil microbial growth by limiting microbial access to water [18].
In order to assess the variations in the soil microbial community structure between different treatments and to examine the impacts of David deer grazing on the soil microbial community structure, this paper examined two sites: grazed and control areas. The grazed area was grazed year-round, while David deer activity was undetectable in the control area. In the present study, the two primary questions we attempt to answer are (1) how David deer grazing impacts the richness and composition of the soil microbial community, and (2) what are the variations in the functions of the soil microbial community between grazed and control regions. The research could serve as a resource for providing David deer restoration initiatives in the reserve.

2. Materials and Methods
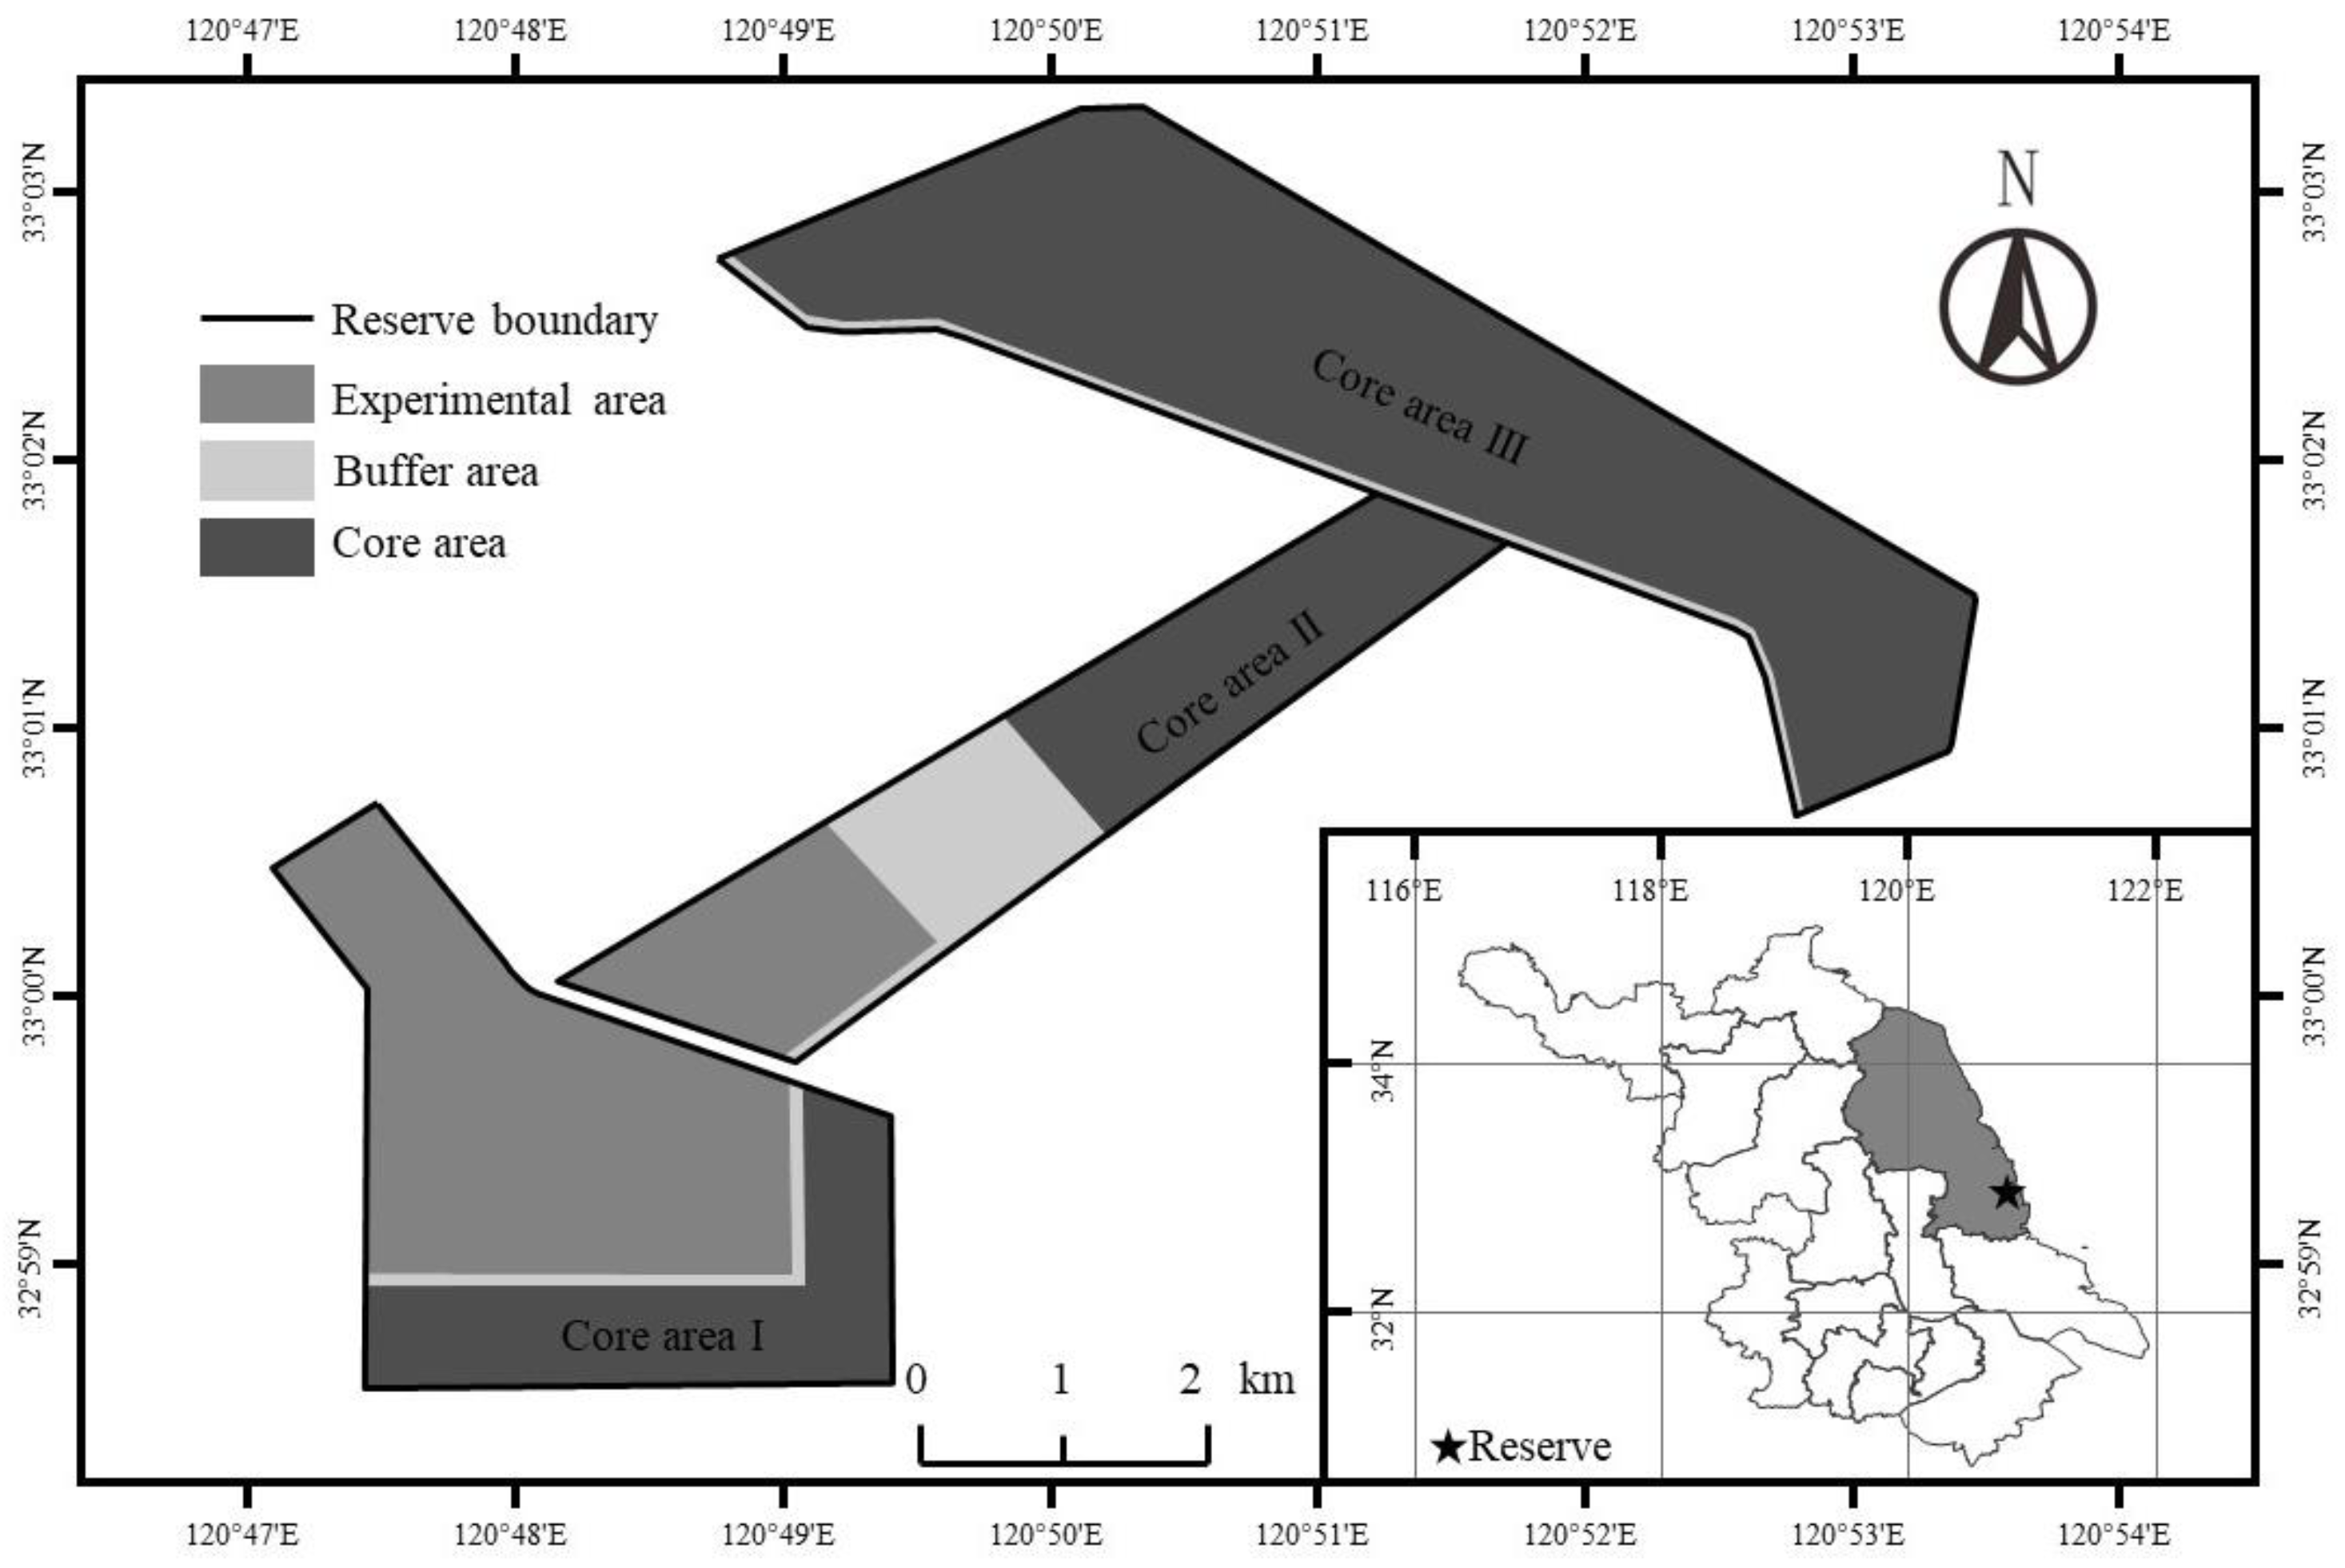
2.1. Study Area

We conducted this research in Dafeng Milu National Nature Reserve in Jiangsu Province, China, which is located in 32.59′–33.03′N, 120.47′–120.53′;E. The 2677 hm2 total area is divided into experimental areas, buffer areas, and core areas (core area I: 479 hm2, core area II: 578 hm2, and core area III: 1620 hm2, respectively) (Figure 1). The study region for this paper was in core III, and the vegetation type is primarily herbaceous, with Spartina alterniflora, Cynodon dactylon, and Imperata cylindrica, in that order, from along the sea to the seawall. The land type of core III is primarily mudflats, and the soil is chalky sandy. The topography is level with an average elevation of 2 m. It is in a transition zone between a marine and monsoon climate, the year-round frost-free period is 299d, annual sunshine duration is 2325.4 h, mean temperature is 13.7~14.5 °C, and the average annual precipitation is 980–1100 mm.

2.2. Experimental Design

The cohort was divided into grazed zones and control areas based on the amount of faucal residual and the density of the hoofprints [19]. The grazed area had no vegetative cover and had been grazed continuously since 2018. S. alterniflora was present in the control areas and there were no feces or hoofprints. Details about the regions are presented in Table 1.
The sampling was finished in October 2020. Three large 10 m × 10 m squares, each 150–200 m apart, were set up inside both the grazed and control areas. There were five 1 m × 1 m courts set in the corners and center of each large sample square to gather samples from the top 0–20 cm of soil. A total of 30 samples were collected. Two bags were created out of each component, for lab analysis of the soil environmental factor and microbial community sequencing by Shanghai Majorbio Bio-pharm Technology Co., Ltd., respectively.

2.3. Determination of Soil Environmental Factors

Soil samples for soil environmental factor testing were air-dried and sieved in a cool location after being cleared of visible stones and plant residues, then the following parameters were measured: soil bulk density (BD), water content (SWC), pH, Na+ concentration (Na+), soil organic carbon (SOC), total nitrogen (TN), total phosphorus (TP), and total potassium (TK), as well as the catalase (CAT), urease (URE), and sucrase (SUC) enzyme activity. BD was determined using the cutting ring method; the soil water content was determined by oven drying (oven 105 °C to constant weight); pH was determined using a pH meter (OHAUS STARTER 3100) with a water/soil ratio of 5:1; the Na+ concentration was determined using the flame photometric method. The H2SO4-K2Cr2O7 oxidation-external heating method was used to calculate the SOC. Elemental analysis was used to calculate the TN (PE-2400, USA). TP content was determined by NaOH melting-molybdenum antimony anti spectrophotometry. The NaOH melting-flame photometry was used to calculate the TK. CAT was calculated via titration with potassium permanganate. URE was calculated using colorimetry with indophenol blue. A 3,5-dinitrosalicylic acid-based colorimetric technique was used to determine the SUC.

2.4. Soil Microbial Community DNA Extraction and Amplification and Sequencing

A FastDNA® SPIN Kit for Soil (FastDNA® SPIN Kit for Soil, Norcross, MP, USA) was used to extract the total DNA from the samples, and NanoDrop2000 was used for DNA concentration and purity testing. The PCR primers used for bacterial and fungal amplification were: 338F (5′-ACTCCTACGGGAGGCAGCAG-3′), 806R (5′-GGACTACHVGGGTWTCTAAT-3′) [20] and ITS1F (5′-CTTGGTCATTTAGAGGAAGTAA-3′), ITS2R (5′-GCTGCGTTCTTCATCGATGC-3′) [21]. The PCR amplification system was 20 μL: 5×FastPfu Buffer 4 μL; 2.5 mM dNTPs 2 μL; forward primer (5 μM) 0.8 μL; reverse primer (5 μM) 0.8 μL; polymerase (bacterial: Fast Pfu polymerase 0.4 μL; fungal: rTaq polymerase 0.2 μL); BSA 0.2 μL; Template DNA. The amplification procedure was as follows: 95 °C pre-denaturation for 3 min, 27 (bacterial)/35 (fungal) cycles (denaturation at 95 °C for 30 s, annealing at 55 °C for 30 s, extension at 72 °C for 45 s), final extension at 72 °C for 10 min and termination at 10 °C using an ABI GeneAmp® 9700 PCR instrument. The PCR products were detected by gel electrophoresis, selecting bands with a primary band between 500–750 bp, and the PCR products were recovered using the AxyPrepDNA Gel Recovery Kit (AXYGEN). Quantification was carried out using QuantiFluor™-ST (Promega, USA). Purified amplicons were used to construct PE 2*300 libraries according to the Illumina MiSeq platform (Illumina, San Diego, CA, USA) standard protocols. Raw sequencing data were uploaded to the GSA database using Illumina’s Miseq PE300 platform. The raw sequenced sequences were quantitatively controlled using Trimmomatic software and spliced using FLASH software.

2.5. Data Processing and Analysis

Based on whether the data conformed to the normal distribution and the homogeneity of variance, we decided to test the significant difference of the data by one-way ANOVA or nonparametric tests. The above analysis was completed in SPSS 25.0.
Mothur was used to analyze the alpha diversity indices of the bacterial and fungal communities at the OUT level (97% similarity), including the Shannon, Simpson, Chao, and Ace indexes. Qiime calculated the beta diversity distance matrix for bacterial and fungal communities between different treatments, and the R vegan package performed the NMDS analysis and mapping. The bacterial and fungal community composition was mapped using R. Bacterial community function predictions depended on the FAPROTAX database, while fungal community were carried out using FUNGuild. LEfSe analysis was used to identify communities that had a significant differential impact on treatment delineation, based on http://huttenhower.sph.harvard.edu/galaxy/root?tool_id=lefse_upload (accessed on 13 May 2022). The relationship between soil physicochemical properties and microbial communities was analyzed using RDA, and the analysis and mapping were done using the R language vegan package. The above analysis process involving microbial community data was completed on the online analysis platform provided by Shanghai Majorbio Bio-pharm Technology Co., Ltd.

3. Results

3.1. Effect of Grazing on Soil Properties

Significant differences existed between the grazed and control areas in terms of soil properties, indicating changes in soil properties due to grazing (Table 2). The pH was significantly higher in the grazed than the control area (p < 0.01). SOC, TN, and TP were substantially lower in the grazed area (p < 0.01), and TK was considerably lower in the grazed compared with the control area (p < 0.05). Grazing also affected the soil enzyme activities, with URE and SUC varying significantly between treatments, and caused a significant reduction in URE and SUC (p < 0.01).

3.2. Diversity of Soil Bacterial and Fungal Communities

3.2.1. Soil Bacterial and Fungal Communities Alpha Diversity

The bacterial community alpha diversity indices of the OTUs are displayed in Table 3. The sequencing of the bacterial communities had a high coverage of 99% or higher. The Shannon, Simpson, Ace, and Chao datasets were chosen to represent the quantity and variety of soil microbial communities in the grazed and control areas. The Shannon was substantially lower (p < 0.05) and the Simpson was significantly greater (p < 0.01) in the bacterial community diversity indices in the grazed, indicating that grazing decreased the variety of bacterial community in the soil.
The Shannon and Simpson indexes were not significantly different in the fungal community diversity indexes, while the Ace and Chao in the grazed were significantly lower (p < 0.01), showing that grazing reduced the quantity of the soil fungal communities.

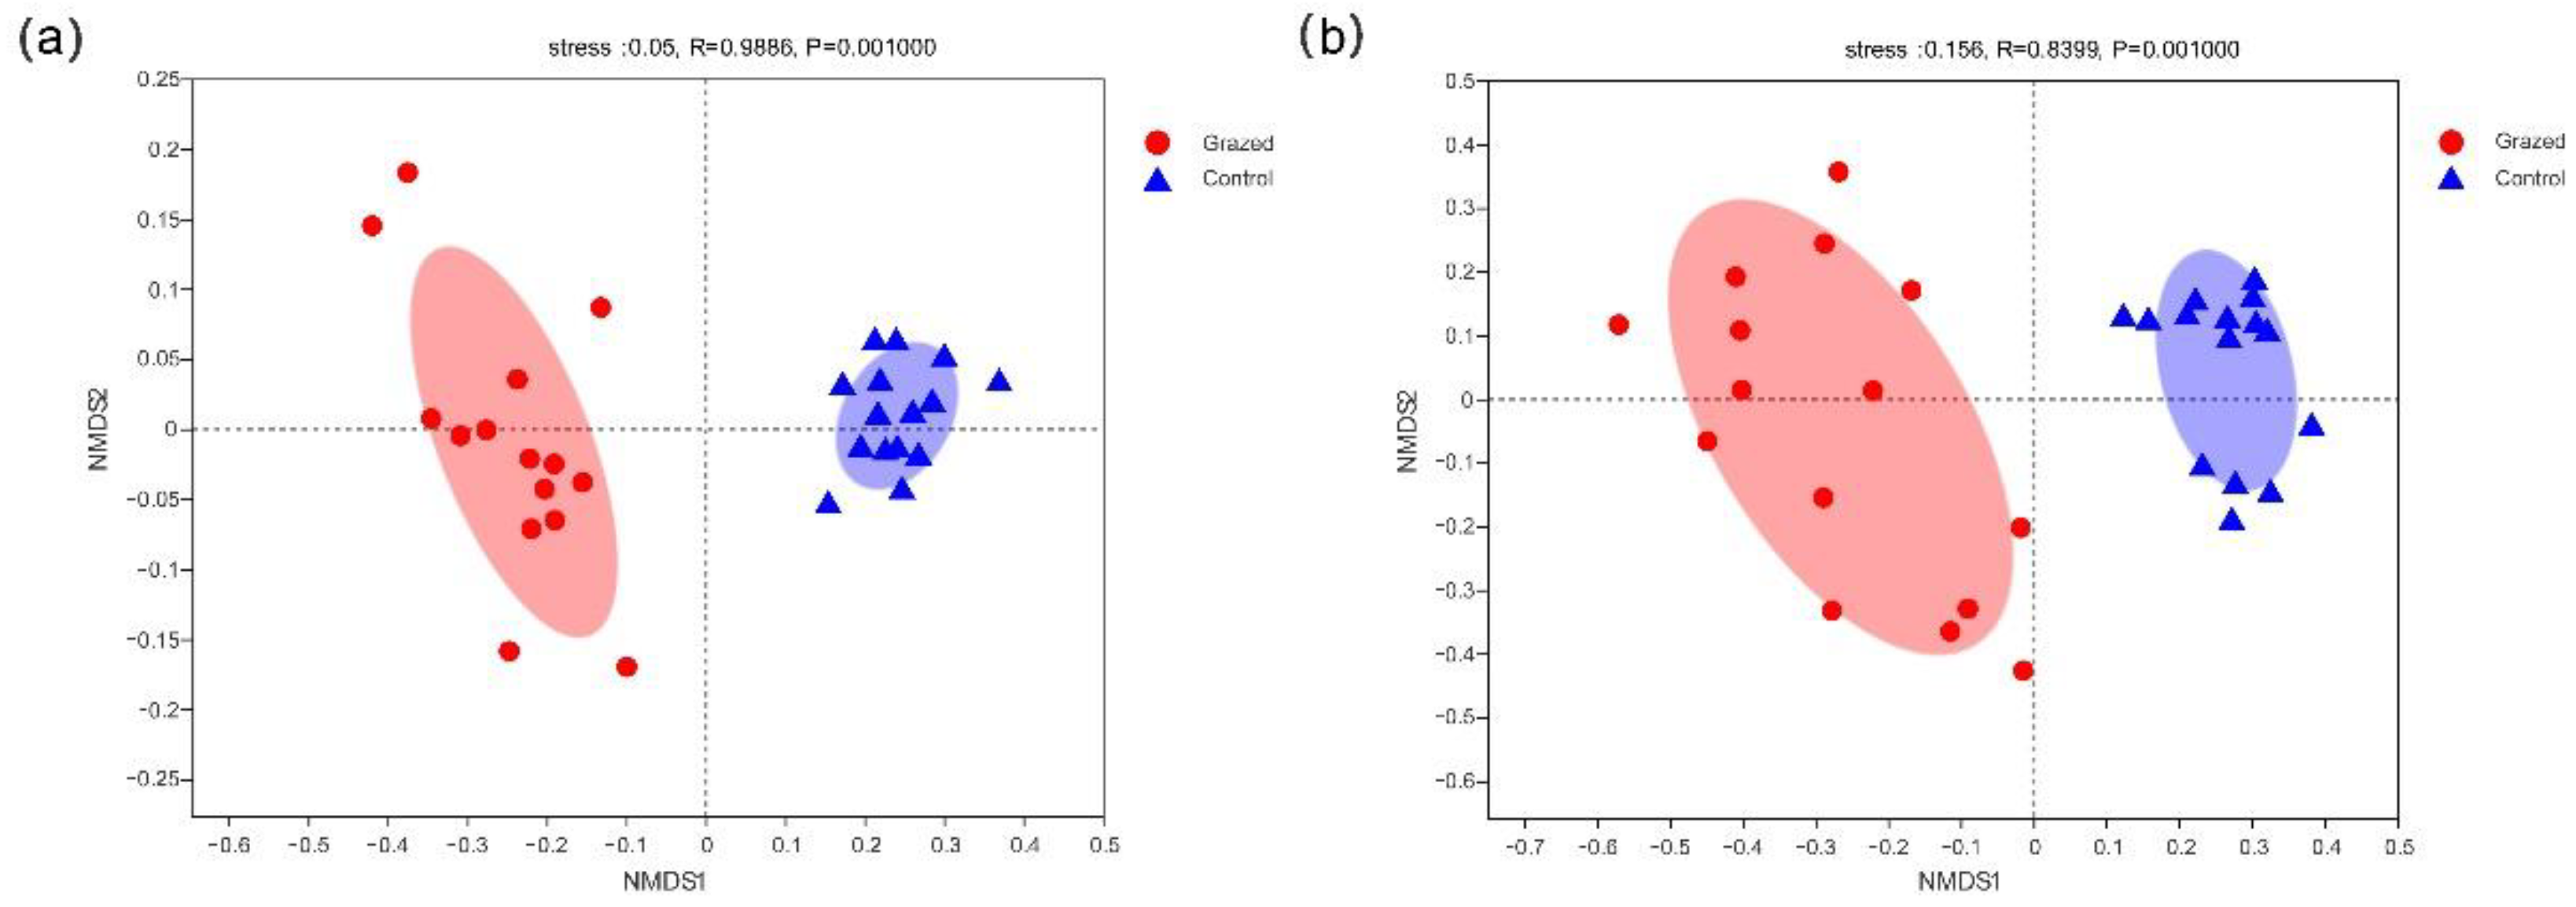
3.2.2. Soil Bacterial and Fungal Communities Beta Diversity

Differences in bacterial and fungal communities were examined at the OTU level for grazing using Bray–Curtis distances (Figure 2). The NMDS analysis ranking had some relevance, as can be seen from the figure, where the stress coefficients for the bacterial and fungal communities were both less than 0.2, 0.05, and 0.156, respectively. Between the grazed and control areas, the bacterial and fungal communities of the soil were considerably different, indicating that grazing had a major impact on soil microbial communities (p < 0.01).

3.3. Soil Microbial Community Composition

In Figure 3a, the dominant phylum of the bacterial community composition was Proteobacteria. A total of 18 bacterial phyla were detected, and a relative abundance of less than 1% was combined. The top five bacterial phyla, in relative abundance, were Proteobacteria, Chloroflexi, Acidobacteriota, Actinobacteriota, and Desulfobacterota, with the sum of the relative abundance being more significant than 50%. The relative abundance of Proteobacteria was 31.86% in the grazed area, which was significantly better than that in the control (p < 0.01). The relative abundance of Acidobacteriota was 11.41% in the grazed and 6.64% in the control area, with a highly significant difference between the two areas (p < 0.01). The relative abundance of Chloroflexi, Actinobacteriota, and Desulfobacterota was lower in the grazed than control area, with the relative abundance of Chloroflexi being significantly lower (p < 0.01) and Desulfobacterota being significantly lower (p < 0.05).
As shown in Figure 3b, Ascomycota was the dominant phylum in the fungal community. Except for unclassified fungi, the fungal community at the phylum level consisted of Ascomycota, Basidiomycota, Mortierellomycota, and Rozellomycota. The relative abundance of Ascomycota in the grazed area was 61.47%, 12.17% lower than that in the control area. In comparison, the relative abundance of Basidiomycota in the grazed area was 28.82%, 8.91% higher than the control area. The relative abundance of Mortierellomycota in the grazed area was more elevated than the control, with a difference of 2.65%. The relative abundance of Rozellomycota in the grazed area was only 0.02%, which was significantly lower than the control area (p < 0.01), with a difference of 1.69% between areas.

3.4. Predicting the Function of Soil Bacteria and Fungi

In Figure 4a, the top 20 functional taxa annotated for relative abundance were selected and analyzed for differences in bacterial function between the grazed and control areas. In the set of bacteria with functional predictions, chemoheterotrophy and aerobic chemoheterotrophy were dominant, and were superior in the grazed area. The phototrophy, nitrate reduction, and photoheterotrophy varied significantly between the two areas. Phototrophy and photoheterotrophy were considerably higher in the grazed than control (p < 0.01) areas, and nitrate reduction was significantly higher in the grazed area (p < 0.05).
Figure 4b showed the predicted soil fungal communities functions for the grazed and control areas. In the figure, the fungal functional types were predominantly saprophytic. The proportion of annotated fungal functions was more significant than 40%, and fungal functional types with a relative abundance of less than 1% were combined. In addition to the unannotated fungal functional types, undefined saprotroph had the highest abundance. Dung saprotroph-plant saprotroph, wood saprotroph, and fungal parasite-undefined saprotroph were lower in the grazed area, while endophyte-litter saprotroph-soil saprotroph-undefined saprotroph were higher. Animal pathogen was detected in the grazed area with a relative abundance of 7.23%.

3.5. Soil Microbial Community LEfSe Analysis

The differences in soil bacterial and fungal communities within the grazed and control areas were analyzed using an LDA threshold of 4 (Figure 5). The indicators of micro-bes for bacteria within the grazed area were Proteobacteria (including Pseudomonadales, Nitrosococcales and Tistrellales), Chloroflexi (including S085), Desulfobacterota (including order-norank which belongs to Desulfuromonadia), Methylomirabilota (including Methylomirabilales), Planctomycetota and Acidobacteriota while for fungi they were Ascomycota (including Sordariales and Monosporascus) and Basidiomycota (including Trichosporonales). The indicator microbes for bacteria in the control were Proteobacteria (including B2M28 and Rhizobiales), Chloroflexi (including SBR1031), and Desulfobacterota (including _Desulfobacterales and Desulfobulbales) for fungi were Ascomycota (including order-unclassifiedwhich belongs to Sordariomycetes, Phaeosphaeriaceae and Hypocreales_fam_Incertae_sedis and Lulworthia), Basidiomycota (Polyporales), and Rozellomycota.

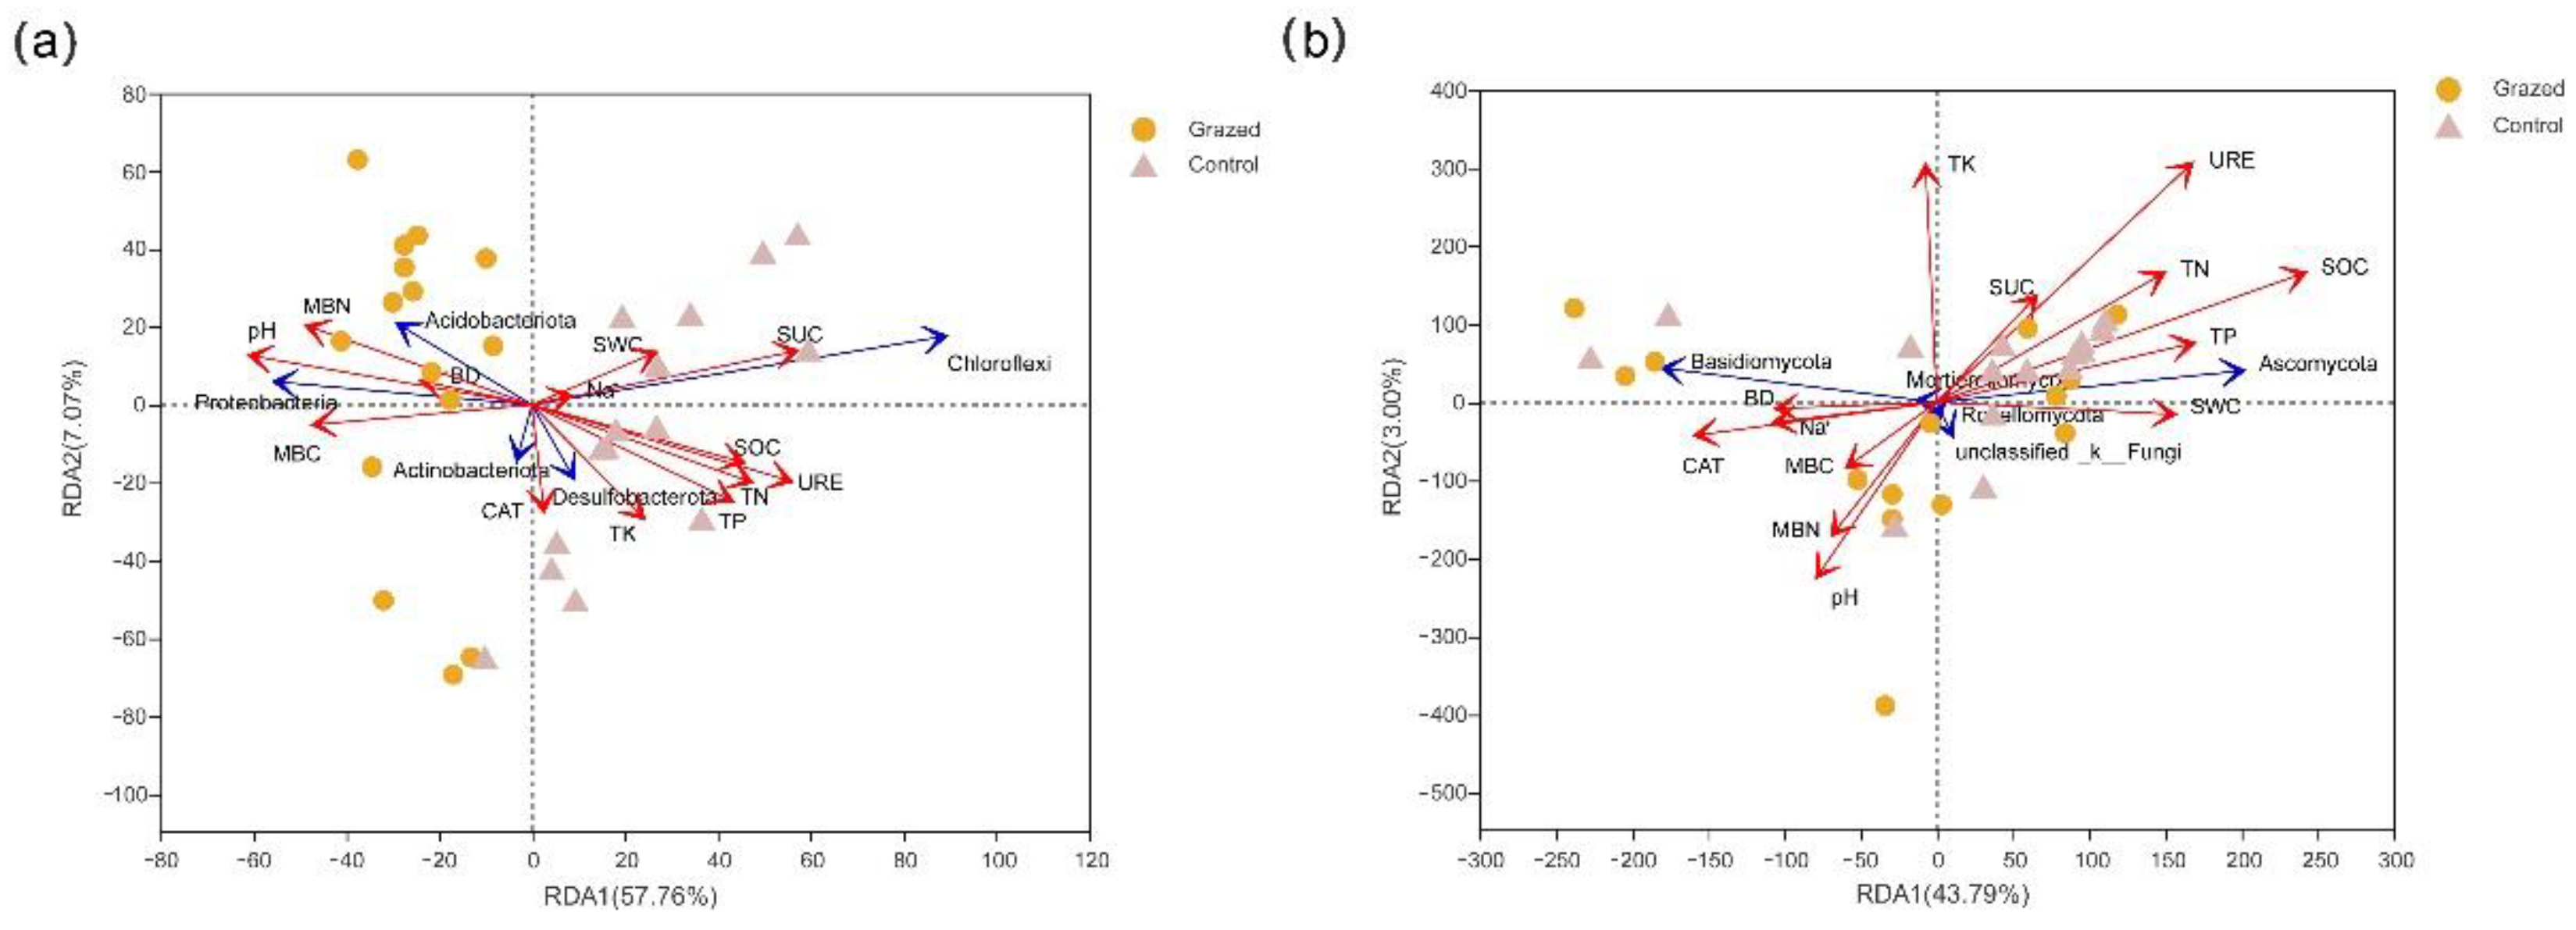
3.6. RDA Analysis of Soil Microbial Community and Soil Environmental Factors

As shown in Figure 6, the differences in the relationships between dominant soil microorganisms and soil environmental factors at the phylum level emerged. Axis 1 and axis 2 of the RDA analysis explained 64.83% and 46.79% of the total variance in the bacterial and fungal communities, respectively. Combined with the results of the biological significance analysis of the RDA analysis in Table 4, pH, SOC, TN, TP, URE, and SUC showed significant impacts on the bacterial community, and URE was the environmental factor that most affected the fungal community. These results indicated that environmental factors influence bacteria more than fungi. Among the top five bacterial phyla in relative abundance, Proteobacteria and Acidobacteriota were significantly and positively correlated with pH, while Actinobacteriota, Desulfobacterota, and Chloroflexi were the most correlated with URE and were significantly and positively correlated. In Figure 6b, the sample points of the grazed and control areas were complexly distributed in each quadrant with insignificant regional boundaries. URE was the main factor affecting the fungal community structure, and Ascomycota significantly correlated with URE.

4. Discussion

The present study shows that the diversity and richness of the soil microbial communities in the grazed areas were lower than those in the control areas (Table 3), which is consistent with the results of Chen et al. [4]. Long-term disturbances in the grazed area by David deer (such as trampling, foraging, and lying) increased soil bulk density and soil water evaporation; decreased vegetation cover, which is unfavorable to the growth of aerobic microorganisms; and resulted in a lower α-diversity of soil bacteria and fungi in the grazed area. The β-diversity of the microbial community evolved along with major changes in the alpha diversity of the soil microorganisms. Figure 2 shows distinct bacterial and fungal community borders between regions, and a dramatic change in community structure. Soil bacterial diversity increases when land-use patterns change [22] in the region, suggesting that land cover directly affects the diversity of the soil microbial community. Human interference mode such as grazing is an indirect factor affecting the soil microbial community.
Different compositions of the bacterial community were found between the grazed and control sites. Similar to the findings of previous studies [23,24], Figure 3a displays the bacterial community composition and significance analysis results in the grazed and control areas. In the grazed area, Proteobacteria were more prevalent compared to with the control area. According to studies, Proteobacteria are relatively more prevalent in habitats with high nutrient levels (high rates of carbon mineralization) [25]. The addition of nutrients to the soil through manure and urine from grazing animals results in soil nutrient enrichment [26,27] and makes soil more conducive to Proteobacteria-dominated bacterial life. The multi-year colonization of S. alterniflora has led to an increase in soil carbon stocks [28]. A large number of Chloroflexi were found in riverbank sediments and have an essential role in the carbon cycle [29]. The soil microrelief in the control was suitable for the survival of Chloroflexi. Acidobacteriota are generally more likely to be detected in environments with a low pH [30]. Nevertheless, in this paper, grazing caused a significant increase in the relative abundance of Acidobacteriota. The growth of Acidobacteriota is highly influenced by the carbon content of the soil [31], the organic carbon content of the grazed area was lower than the control, which may have led to the increase in the relative abundance of Acidobacteriota. Proteobacteria are the fast-growing bacteria among the phyla of relatively abundant bacteria mentioned above, while Acidobacteriota and Chloroflexi are slow-growing bacteria [32], suggesting that grazing caused a change in the soil bacterial community towards fast-growing types.
The functional makeup of the bacteria changed along with the composition of the soil bacterial population because of grazing. Chemoheterotrophy and aerobic chemoheterotrophy were among the top two relative abundances in the bacterial community’s functional annotation (Figure 4a). It is understood that chemoheterotrophy is a crucial bacterial function in carbon cycling [33], and the relative abundance of chemoheterotrophy increased in the grazed area, where the legacy of David deer droppings in the area input exogenous carbon and promotes soil carbon cycling processes.
Following the administration of synthetic sheep urine, Rooney et al. [34] discovered that the soil pH increased from 5.4 to 6.4, indicating that grazing animal urine was a contributing component to an increase in pH. Due to the proximity of the studied region to the ocean, the baseline soil pH is alkaline, and under the influence of David deer urine, the soil pH of the grazed area shifts towards alkalinity.
According to the RDA analysis, pH was the main environmental factor influencing the bacterial community, which was in line with the findings of previous studies [35]. Contrary to the findings that Proteobacteria were found in high nutrient settings, the Proteobacteria were strongly positively linked with pH instead of nutrient contents such as SOC, which calls for further research. The distribution of large amounts of S. alterniflora in the control increased the soil nitrogen storage [28], and the Actinobacteriota and Chloroflexi were relatively abundant in the control and were significantly and positively correlated with urease activity, which is primarily involved in the decomposition of nitrogen [36]. A high urease activity indicates a rapid conversion rate of the soil nitrogen element, which is beneficial to microbial growth.
Figure 3b shows that the sum of the relative abundance of Ascomycota and Basidiomycota within the areas were more than 90%, with Ascomycota dominating, with 98% of terrestrial fungi now known to belong to Ascomycota and Basidiomycota, with Ascomycota being dominant in fungal community [37]. Table 2 shows that the control had higher levels of soil organic carbon, total nitrogen, total phosphorus, and total potassium, while Figure 4 suggests that the relative abundance of Ascomycota increased. Chen et al. [38] found that the relative abundance of Ascomycota was the key difference in soil fungal communities from desert to normal grassland, and considered that Ascomycota may be adapted for nutrient-poor conditions. The results of this paper contradicted the conclusion as coastal mudflats do not fall into any of the foregoing categories, and the features of invasive plants do not appear to have been considered. Ascomycota, an important phylum of saprophytic fungi, tend to grow well in moist environments compared with Basidiomycota [39], and the siltation-promoting beaching effect of S. alterniflora increases the soil water content of the invaded sites, a property reflected in the regional differences in soil water content in Table 2, while the decomposition of the S. alterniflora residues increases the nutrient return to soil. Several fungi are predominantly saprophytic and nutrient-dependent [40]. The functional annotation results of the fungal community in this paper (Figure 4b) are consistent with this. Only 50% of fungal functional types were annotated when functional predictions were made for fungal communities. Fungal functional types were divided into three trophic types, saprophytic, symbiotic, and pathotrophic, while multiple complex trophic types were also found. In combination with Figure 6b, fungi were less affected by soil environmental factors than bacteria, indicating that fungi are more resistant to external disturbances than bacteria. The presence of multiple complex trophic types of fungi in the functional annotation may be an adaptation by fungi to resist external disturbances. Similarly, URE was the environmental factor that most affects the fungal community.

5. Conclusions

The soil microbial community, including the functional composition and bacterial and fungal community composition, presented significant changes within the grazed region. Deer excrement led to the enrichment of functional bacteria associated with the carbon cycle as a microbiological response to grazing. The grazing evolved into a complex of fungal functions, the majority of which were saprophytic. According to the RDA analysis, soil pH and URE had the greatest impact on the bacterial and fungal communities, respectively. In short, soil characteristics are the primary direct factors affecting the structure of the soil microbial community, and grazing activities, which introduce exogenous elements into the soil, are the primary indirect factors.

Author Contributions

Y.Z. and Y.W. participated in the conception and design of the study. Y.Z. and Y.A. contributed to the collection of samples. Y.Z., Y.W. and Y.A. analyzed the data and drafting the manuscript. All authors have read and agreed to the published version of the manuscript.

Funding

This research was funded by the Jiangsu Forestry Science and Technology Innovation Project (approval number: LYKJ[2022]02), Jiangsu Science and Technology Project (approval number: BE2022306) and the National Key Research and Development Program of China (approval number: 2016YFC0502704).

Institutional Review Board Statement

Not applicable.

Data Availability Statement

Data are available from the China National Center for Bioinformation (GSA number: CRA008232 and CRA008229) that are publicly accessible at https://ngdc.cncb.ac.cn/gsa (accessed on 21 September 2022). Any further data required can be requested from the corresponding author.

Acknowledgments

We are grateful to the anonymous referees for their valuable comments, constructive suggestions, and editorial assistance, which have greatly improved the paper.

Conflicts of Interest

The authors declare that the research was conducted in the absence of any commercial or financial relationships that could be construed as a potential conflict of interest.

References

  1. Khan, R.W.A.; Shaheen, H.; Mehmood, A.; Awan, S.N. Grazing intensity impacts on soil carbon stocks of Western Himalayan Alpine paddocks. Carbon Manag. 2019, 10, 533–540. [Google Scholar] [CrossRef]
  2. Fenetahun, Y.; Yuan, Y.; Xu, X.W.; Fentahun, T.; Nzabarinda, V.; Wang, Y.D. Impact of Grazing Intensity on Soil Properties in Teltele Rangeland, Ethiopia. Front. Environ. 2021, 9, 664104. [Google Scholar] [CrossRef]
  3. Doran, J.W.; Zeiss, M.R. Soil health and sustainability: Managing the biotic component of soil quality. Appl. Soil Ecol. 2000, 15, 3–11. [Google Scholar] [CrossRef] [Green Version]
  4. Chen, L.L.; Saixi, Y.L.; Yi, R.; Baoyin, T. Characterization of soil microbes associated with a grazing-tolerant grass species, Stipa breviflora, in the Inner Mongolian desert steppe. Ecol. Evol. 2020, 10, 10607–10618. [Google Scholar] [CrossRef]
  5. Lienhard, P.; Terrat, S.; Prevost-Boure, N.C.; Nowak, V.; Regnier, T.; Sayphoummie, S.; Panyasiri, K.; Tivet, F.; Mathieu, O.; Leveque, J.; et al. Pyrosequencing evidences the impact of cropping on soil bacterial and fungal diversity in Laos tropical grassland. Agron. Sustain. Dev. 2014, 34, 525–533. [Google Scholar] [CrossRef]
  6. Zeilinger, S.; Gupta, V.K.; Dahms, T.E.S.; Silva, R.N.; Singh, H.B.; Upadhyay, R.S.; Gomes, E.V.; Tsui, C.K.M.; Nayak, S.C.; van der Meer, J.R. Friends or foes? Emerging insights from fungal interactions with plants. FEMS Microbiol. Rev. 2016, 40, 182–207. [Google Scholar] [CrossRef] [Green Version]
  7. Zhao, F.Z.; Ren, C.J.; Shelton, S.; Wang, Z.T.; Pang, G.W.; Chen, J.; Wang, J. Grazing intensity influence soil microbial communities and their implications for soil respiration. Agric. Ecosyst. Environ. 2017, 249, 50–56. [Google Scholar] [CrossRef]
  8. Wang, Z.; Zhang, Q.; Staley, C.; Gao, H.L.; Ishii, S.; Wei, X.R.; Liu, J.; Cheng, J.M.; Hao, M.D.; Sadowsky, M.J. Impact of long-term grazing exclusion on soil microbial community composition and nutrient availability. Biol. Fert. Soils 2019, 55, 121–134. [Google Scholar] [CrossRef]
  9. Zhang, H.R.; Fu, G. Responses of plant, soil bacterial and fungal communities to grazing vary with pasture seasons and grassland types, northern Tibet. Land Degrad. Dev. 2021, 32, 1821–1832. [Google Scholar] [CrossRef]
  10. Yang, F.; Niu, K.C.; Collins, C.G.; Yan, X.B.; Ji, Y.G.; Ling, N.; Zhou, X.H.; Du, G.Z.; Guo, H.; Hu, S.J. Grazing practices affect the soil microbial community composition in a Tibetan alpine meadow. Land Degrad. Dev. 2019, 30, 49–59. [Google Scholar] [CrossRef]
  11. Ma, X.Y.; Zhang, Q.T.; Zheng, M.M.; Gao, Y.; Yuan, T.; Hale, L.; Van Nostrand, J.D.; Zhou, J.Z.; Wan, S.Q.; Yang, Y.F. Microbial functional traits are sensitive indicators of mild disturbance by lamb grazing. ISME J. 2019, 13, 1370–1373. [Google Scholar] [CrossRef] [Green Version]
  12. Hijuelos, A.C.; Dijkstra, J.T.; Carruthers, T.J.B.; Heynert, K.; Reed, D.J.; van Wesenbeeck, B.K. Linking management planning for coastal wetlands to potential future wave attenuation under a range of relative sea-level rise scenarios. PLoS ONE 2019, 14, e0216695. [Google Scholar] [CrossRef] [PubMed] [Green Version]
  13. An, Y.T.; Liu, B.; Wang, L.B.; Xie, S.B.; Xue, D.D.; Wu, Y.B. Effects of Père David deer (Elaphurus davidianus) grazing on soil physicochemical properties. Acta Ecol. Sin. 2020, 40, 3571–3578. [Google Scholar]
  14. Liu, J.G.; Xue, J.H.; Wang, L.; Ding, J.J.; Ma, W.L.; Liu, C.G.; Rong, Y. Habitat degradation features of Père David’s Deer Natural Reserve in Dafeng of Jiangsu Province, East China. Chin. J. Ecol. 2011, 30, 1793–1798. [Google Scholar]
  15. Nunan, N.; Singh, B.; Reid, E.; Ord, B.; Papert, A.; Squires, J.; Prosser, J.I.; Wheatley, R.E.; McNicol, J.; Millard, P. Sheep-urine-induced changes in soil microbial community structure. FEMS Microbiol. Ecol. 2006, 56, 310–320. [Google Scholar] [CrossRef] [Green Version]
  16. Siciliano, S.D.; Palmer, A.S.; Winsley, T.; Lamb, E.; Bissett, A.; Brown, M.V.; van Dorst, J.; Ji, M.K.; Ferrari, B.C.; Grogan, P.; et al. Soil fertility is associated with fungal and bacterial richness, whereas pH is associated with community composition in polar soil microbial communities. Soil Biol. Biochem. 2014, 78, 10–20. [Google Scholar] [CrossRef]
  17. Ramirez, P.B.; Fuentes-Alburquenque, S.; Diez, B.; Vargas, I.; Bonilla, C.A. Soil microbial community responses to labile organic carbon fractions in relation to soil type and land use along a climate gradient. Soil Biol. Biochem. 2020, 141, 107692. [Google Scholar] [CrossRef]
  18. Zhang, G.L.; Bai, J.H.; Tebbe, C.C.; Zhao, Q.Q.; Jia, J.; Wang, W.; Wang, X.; Yu, L. Salinity controls soil microbial community structure and function in coastal estuarine wetlands. Environ. Microbiol. 2021, 23, 1020–1037. [Google Scholar] [CrossRef]
  19. Shezi, T.A.; O’Connor, T.G.; Witkowski, E.T.F. Impact of livestock grazing intensity on plant diversity of montane grassland in the northern Drakensberg, South Africa. Afr. J. Range For. Sci. 2021, 38, 67–79. [Google Scholar] [CrossRef]
  20. Xu, N.; Tan, G.C.; Wang, H.Y.; Gai, X.P. Effect of biochar additions to soil on nitrogen leaching, microbial biomass and bacterial community structure. Eur. J. Soil Biol. 2016, 74, 1–8. [Google Scholar] [CrossRef]
  21. Chen, B.S.; Du, K.Q.; Sun, C.; Vimalanathan, A.; Liang, X.L.; Li, Y.; Wang, B.H.; Lu, X.M.; Li, L.J.; Shao, Y.Q. Gut bacterial and fungal communities of the domesticated silkworm (Bombyx mori) and wild mulberry-feeding relatives. ISME J. 2018, 12, 2252–2262. [Google Scholar] [CrossRef] [Green Version]
  22. Rodrigues, J.L.M.; Pellizari, V.H.; Mueller, R.; Baek, K.; Jesus, E.D.; Paula, F.S.; Mirza, B.; Hamaoui, G.S.; Tsai, S.M.; Feigl, B.; et al. Conversion of the Amazon rainforest to agriculture results in biotic homogenization of soil bacterial communities. Proc. Natl. Acad. Sci. USA 2013, 110, 988–993. [Google Scholar] [CrossRef] [PubMed]
  23. Deng, J.J.; Yin, Y.; Zhu, W.X.; Zhou, Y.B. Variations in Soil Bacterial Community Diversity and Structures among Different Revegetation Types in the Baishilazi Nature Reserve. Front. Microbiol. 2018, 9, 2874. [Google Scholar] [CrossRef] [PubMed] [Green Version]
  24. Zeng, Q.C.; Dong, Y.H.; An, S.S. Bacterial Community Responses to Soils along a Latitudinal and Vegetation Gradient on the Loess Plateau, China. PLoS ONE 2016, 11, e0152894. [Google Scholar] [CrossRef] [PubMed] [Green Version]
  25. Fierer, N.; Bradford, M.A.; Jackson, R.B. Toward an ecological classification of soil bacteria. Ecology 2007, 88, 1354–1364. [Google Scholar] [CrossRef]
  26. Lesschen, J.P.; van den Berg, M.; Westhoek, H.J.; Witzke, H.P.; Oenema, O. Greenhouse gas emission profiles of European livestock sectors. Anim. Feed Sci. Technol. 2011, 166–167, 16–28. [Google Scholar] [CrossRef]
  27. Yoshitake, S.; Soutome, H.; Koizumi, H. Deposition and decomposition of cattle dung and its impact on soil properties and plant growth in a cool-temperate pasture. Ecol. Res. 2014, 29, 673–684. [Google Scholar] [CrossRef]
  28. Liao, C.Z.; Luo, Y.Q.; Jiang, L.F.; Zhou, X.H.; Wu, X.W.; Fang, C.M.; Chen, J.K.; Li, B. Invasion of Spartina alterniflora enhanced ecosystem carbon and nitrogen stocks in the Yangtze Estuary, China. Ecosystems 2007, 10, 1351–1361. [Google Scholar] [CrossRef]
  29. Hug, L.A.; Castelle, C.J.; Wrighton, K.C.; Thomas, B.C.; Sharon, I.; Frischkorn, K.R.; Williams, K.H.; Tringe, S.G.; Banfield, J.F. Community genomic analyses constrain the distribution of metabolic traits across the Chloroflexi phylum and indicate roles in sediment carbon cycling. Microbiome 2013, 1, 22. [Google Scholar] [CrossRef] [Green Version]
  30. Xiong, J.B.; Liu, Y.Q.; Lin, X.G.; Zhang, H.Y.; Zeng, J.; Hou, J.Z.; Yang, Y.P.; Yao, T.D.; Knight, R.; Chu, H.Y. Geographic distance and pH drive bacterial distribution in alkaline lake sediments across Tibetan Plateau. Environ. Microbiol. 2012, 14, 2457–2466. [Google Scholar] [CrossRef] [Green Version]
  31. Eichorst, S.A.; Kuske, C.R.; Schmidt, T.M. Influence of Plant Polymers on the Distribution and Cultivation of Bacteria in the Phylum Acidobacteria. Appl. Environ. Microb. 2011, 77, 586–596. [Google Scholar] [CrossRef] [Green Version]
  32. Davis, K.E.R.; Sangwan, P.; Janssen, P.H. Acidobacteria, Rubrobacteridae and Chloroflexi are abundant among very slow-growing and mini-colony-forming soil bacteria. Environ. Microbiol. 2011, 13, 798–805. [Google Scholar] [CrossRef] [PubMed]
  33. Zhang, X.Y.; Hu, B.X.; Ren, H.J.; Zhang, J. Composition and functional diversity of microbial community across a mangrove-inhabited mudflat as revealed by 16S rDNA gene sequences. Sci. Total Environ. 2018, 633, 518–528. [Google Scholar] [CrossRef] [PubMed]
  34. Rooney, D.; Kennedy, N.; Deering, L.; Gleeson, D.; Clipson, N. Effect of sheep urine deposition on the bacterial community structure in an acidic upland grassland soil. Appl. Environ. Microb. 2006, 72, 7231–7237. [Google Scholar] [CrossRef] [PubMed] [Green Version]
  35. Wang, C.Y.; Zhou, X.; Guo, D.; Zhao, J.H.; Yan, L.; Feng, G.Z.; Gao, Q.; Yu, H.; Zhao, L.P. Soil pH is the primary factor driving the distribution and function of microorganisms in farmland soils in northeastern China. Ann. Microbiol. 2019, 69, 1461–1473. [Google Scholar] [CrossRef] [Green Version]
  36. Huang, L.; Gao, X.; Liu, M.; Du, G.; Guo, J.S.; Ntakirutimana, T. Correlation among soil microorganisms, soil enzyme activities, and removal rates of pollutants in three constructed wetlands purifying micro-polluted river water. Ecol. Eng. 2012, 46, 98–106. [Google Scholar] [CrossRef]
  37. Wang, H.Y.; Guo, S.Y.; Huang, M.R.; Thorsten, L.H.; Wei, J.C. Ascomycota has a faster evolutionary rate and higher species diversity than Basidiomycota. Sci. China Life Sci. 2010, 53, 1163–1169. [Google Scholar] [CrossRef] [PubMed]
  38. Chen, Y.L.; Xu, T.L.; Veresoglou, S.D.; Hu, H.W.; Hao, Z.P.; Hu, Y.J.; Liu, L.; Deng, Y.; Rillig, M.C.; Chen, B.D. Plant diversity represents the prevalent determinant of soil fungal community structure across temperate grasslands in northern China. Soil Biol. Biochem. 2017, 110, 12–21. [Google Scholar] [CrossRef]
  39. Treseder, K.K.; Maltz, M.R.; Hawkins, B.A.; Fierer, N.; Stajich, J.E.; McGuire, K.L. Evolutionary histories of soil fungi are reflected in their large-scale biogeography. Ecol. Lett. 2014, 17, 1086–1093. [Google Scholar] [CrossRef] [Green Version]
  40. Yelle, D.J.; Ralph, J.; Lu, F.C.; Hammel, K.E. Evidence for cleavage of lignin by a brownrot basidiomycete. Environ. Microbiol. 2008, 10, 1844–1849. [Google Scholar] [CrossRef]
Figure 1. Location map of the study site.
Diversity 14 00976 g001
Figure 2. NMDS analysis of soil microbial community structure of grazed and control areas: (a) bacterial community and (b) fungal community.
Diversity 14 00976 g002
Figure 3. Composition of the soil microbial communities in the grazed and control areas. The vertical and horizontal coordinates are the group names and proportion of species in the group, respectively. The columns with different colors represent different species, and the length of the columns represents the proportion of the species. * 0.01 < p ≤ 0.05, ** 0.001 < p ≤ 0.01, *** p ≤ 0.001. (a) Bacterial community and (b) fungal community.
Diversity 14 00976 g003
Figure 4. Prediction of soil microbial community function of grazed and control areas. * 0.01 < p ≤ 0.05, ** 0.001 < p ≤ 0.01, *** p ≤ 0.001. (a) Bacterial community. The horizontal and vertical coordinates are the group names and the function names respectively. The change of abundance of the different functions in the sample is shown by the color gradient of the color block, with the values represented by the color gradient on the right-hand side of the graph. (b) fungal community. The horizontal axis showed the abundance proportion of Guild in different groups, and the vertical axis showed different groups.
Diversity 14 00976 g004
Figure 5. LEfSe analysis of soil microbial communities in grazed and control areas. Different color nodes represented microbial groups that were significantly enriched in the corresponding groups and had a significant impact on the differences between groups; pale yellow nodes represented microbial groups that had no significant difference in different groups, or had no significant impact on differences between groups. (a) Bacterial community and (b) fungal community.
Diversity 14 00976 g005
Figure 6. RDA analysis of dominant microorganisms and soil environmental factors. BD: soil bulk density, SWC: water content, pH: pH, Na+: Na+ concentration, SOC: soil organic carbon, TN: total nitrogen, TP: total phosphorus, TK: total potassium, CAT: catalase enzyme activity, URE: urease enzyme activity, and SUC: sucrase enzyme activity. (a) Bacterial community and (b) fungal community.
Diversity 14 00976 g006
Table 1. Information of sample points from the grazed and control areas.
AreasSamplesHoofprint Density/pcs/m2Fecal Residue/pcs/m2Vegetation Coverage/%Dominant Plant
GrazedG167890--
G252730--
G371980--
ControlC10080S. alterniflora
C20075S. alterniflora
C30079S. alterniflora
Table 2. Differences in soil physicochemical properties in the grazed and control areas.
PropertiesTreats
GrazedControl
BD/(g/cm3)1.7034 ± 0.101651.6421 ± 0.14977
SWC/(%)13.6527 ± 3.2763715.3944 ± 5.1625
pH9.2907 ± 0.12256 A8.8247 ± 0.11122 B
Na+/(g/kg)0.2677 ± 0.140460.2901 ± 0.03025
SOC/(g/kg)2.2074 ± 0.76054 B7.1627 ± 2.72498 A
TN/(g/kg)0.2063 ± 0.03146 B0.6987 ± 0.25665 A
TP/(g/kg)1.2186 ± 0.4882 B1.8456 ± 0.2672 A
TK/(g/kg)7.3589 ± 0.61162 b7.8083 ± 0.28175 a
CAT/(mg/g)8.1981 ± 3.292218.077 ± 2.06997
URE/(mg/g)36.5701 ± 10.35941 B82.3233 ± 13.19902 A
SUC/(mg/g)0.1181 ± 0.03546 B0.4468 ± 0.26713 A
The data in the table are mean ± standard deviation. The different letters after the data in the table represent significant differences between treatments, which were based on whether the data belongs to the normal distribution and whether the variance was calculated neatly (one-way ANOVA or nonparametric tests). Different capital letters after the data indicate a significant difference (p < 0.01), other small letters indicate a significant difference (p < 0.05), and unmarked letters indicate no significant difference (p > 0.05). BD: soil bulk density, SWC: water content, pH: pH, Na+: Na+ concentration, SOC: soil organic carbon, TN: total nitrogen, TP: total phosphorus, TK: total potassium, CAT: catalase enzyme activity, URE: urease enzyme activity, and SUC: sucrase enzyme activity.
Table 3. Diversity indexes of the soil microbial community at the OTU level.
SamplesShannonSimpsonAceChao
BacteriaGrazed6.12 ± 0.36 b0.01 ± 0.006 A3145.96 ± 632.273122.43 ± 625.61
Control6.38 ± 0.22 a0.005 ± 0.001 B3286.51 ± 432.993270.72 ± 431.40
FungiGrazed1.83 ± 0.980.36 ± 0.2852.01 ± 20.92 B48.36 ± 20.91 B
Control2.03 ± 0.810.31 ± 0.24299.92 ± 122.27 A294.23 ± 124.18 A
The data in the table are mean ± standard deviation. The different letters after the data in the table represent the significant differences of data between different treatments calculated based on wilcoxon rank sum test. Different capital letters after the data indicate a significant difference (p < 0.01), and other small letters indicate a significant difference (p < 0.05).
Table 4. Environmental factors for RDA analysis of bacterial and fungal communities.
IndexesBacteriaFungi
RDA1RDA2r2p ValuesRDA1RDA2r2p Values
BD−0.98770.15630.10190.251−0.99930.03810.02620.727
SWC0.94780.31890.14730.1390.99210.12540.05980.491
pH−0.99150.130.70760.001−0.31010.95070.12230.172
Na+0.98480.17350.010.883−0.98490.17320.02780.703
SOC0.9771−0.21280.40810.0010.8539−0.52050.19680.055
TN0.9653−0.26130.46120.0020.6885−0.72520.110.203
TP0.9387−0.34480.41460.0010.9307−0.36580.07940.318
TK0.8061−0.59180.19810.05−0.0851−0.99640.21130.044
CAT0.1707−0.98530.08730.27−0.97840.20650.06330.44
URE0.9729−0.23120.63080.0010.4821−0.87610.2660.014
SUC0.98820.1530.6250.0010.4275−0.9040.04750.541
Publisher’s Note: MDPI stays neutral with regard to jurisdictional claims in published maps and institutional affiliations.

