Article

Composition and Structural Characteristics of Rhizosphere Microorganisms of Polygonum sibiricum (Laxm.) Tzvelev in the Yellow River Delta

School of Biological and Environmental Engineering, Binzhou University, Binzhou 256600, China
*
Authors to whom correspondence should be addressed.
Diversity 2022, 14(11), 965; https://doi.org/10.3390/d14110965
Submission received: 5 October 2022 / Revised: 6 November 2022 / Accepted: 7 November 2022 / Published: 10 November 2022
(This article belongs to the Special Issue Plant-Soil-Microorganism: Diversity and Interactions)

Abstract

:
The Polygonum sibiricum (Laxm.) Tzvelev, an important herbal species used to protect seawalls, has a solid resistance to salinity and alkali and can grow on alkali spots in saline–alkali soils. So far, the composition, population, and characteristics of its rhizosphere biological community related to the adaptation salt–alkali environment were still unknown. In the present study, rhizosphere and non-rhizosphere soil samples from the P. sibiricum on Chenier Island were collected. High-throughput sequencing was conducted to obtain the structural diversity of rhizosphere microbial communities. Our results showed that the dominant bacteria groups in the rhizosphere and non-rhizosphere were Proteobacteria, Actinobacteriota, Gemmatimonadota, and Actinobacteriota. The dominant fungi groups in the rhizosphere and non-rhizosphere soil samples were Ascomycota, Basidiomycota, Chytridiomycota, and Mortierellomycota. The results of the ASVs (amplicon sequence variants) showed that fungi have more ASVs in common. The PERMANOVA analysis showed that the bacteria among different groups were significantly different. The PCoA (principal coordinates analysis) study also showed that the structures of the bacterial and fungal communities between the rhizosphere and non-rhizosphere were distinct. Function results showed that the relative abundance in COG (Clusters of Orthologous Groups of proteins) functional annotation was significantly different between the two groups. In addition to the general function prediction and carbohydrate transport and metabolism, the COG of the non-rhizosphere was higher than that of the rhizosphere. Our findings benefited the knowledge for studying and conserving the molecule-level adaptive mechanisms of P. sibiricum.

1. Introduction

Polygonum sibiricum (Laxm.), a perennial herb belonging to the Polygonaceae family, is widely distributed in Siberia, Mongolia, China, and other regions. Due to its propagation through rhizomes and seeds, it spreads quickly and has solid ecological adaptability. It has a strong resistance to salinity and alkali, and can grow on alkali spots in saline–alkali soils [1].
The soil environment is vital in interacting with rhizosphere microorganisms and plants [2]. The properties of the soil determine the characteristics of the original microbial community in the soil. As the “second genome” of plants, the microorganisms intensively participate in the “plant growth-soil ecology” [3]. Rhizosphere microorganisms are located in a special micro-ecosystem, and their community composition diversity and functional diversity are significantly different from those of non-rhizosphere microbial communities [4]. Plants and their symbiotic microorganisms can be considered superorganisms [5]. Plants can rely on rhizosphere microbial communities to obtain specific functional properties. The rhizosphere microenvironment is a bridge for communication between plants and soil [6]. Rhizosphere microorganisms would affect plants’ growth and development, nutrient acquisition, and disease defense. At the same time, plants also affect the shaping and functions of the rhizosphere microbial community. Studies have shown that in plant growth, the root system will continuously produce tissue exfoliation and root exudates and affect microorganisms in the surrounding natural soil, constantly attracting beneficial microbial groups that promote plant growth and relieve ecological pressure [7].
Chenier Island, developed from silty coasts, is a special landform that is mainly composed of shells and minerals [8]. In detail, yellowish-brown fine and medium sand are the major components of the soils, with a fraction of 85% to 90%. Constrained by the ecological environment, perennial herbs dominated in this special ecosystem. Phragmites australis, Messerschmidia sibirica, and Artemisia mongolica are common species on this island. Besides, bark willow and Tamarix (Tamarix Chinensis) can grow well. On the shell embankment, the associated species are reed, jujube, madder (Rubia cordifolia), and so on.
During the field investigation, it was found that P. sibiricum distributes wildly along the coast of Chengkou Shell Embankment, Shandong Province, and grows as a single dominant population in the high tide line area. This provided a valuable opportunity to investigate the composition, population, and characteristics of the rhizosphere biological community of P. sibiricum adapting to the salt–alkali environment of shell dykes. The rhizosphere microbial community can help plants obtain nutrients [9], promote plant growth, and improve plant stress resistance by regulating plant hormone levels [10]. The rhizosphere’s microbial community structure is closely related to soil health. The structural imbalance of the rhizosphere soil microbial community is an important cause of plant diseases [11]. Therefore, understanding the rhizosphere soil microbial community structure can provide a necessary reference for maintaining the relative stability of the plant-soil microbial ecosystem [12]. The rhizosphere microbial composition of plants in the particular soil environment of the shell dike may present some novel patterns. Thus, we obtained the characteristics of the micro-organism’s community in the P. sibiricum rhizosphere and explored the roles and functions of microorganisms in the saline–alkali adaptation of P. sibiricum.

2. Materials and Methods

2.1. Site Description

The study area is Chenier Island, which is located in the Yellow River Delta. Chenier Island has a warm temperate continental monsoon semi-humid climate, with an average annual precipitation of 550 mm. The average yearly temperature is 12–36 °C. The groundwater depth is shallow, with an average depth of about 1–2.5 m. The soil is mainly shell sandy soil, and the parent material is composed of calcareous shells and aeolian soil. The content of shell matter is almost 90%, and the thickness of the sand layer formed of shell debris, shell sand, and complete shells reaches 2.5~5 m.

2.2. Sample Collection

The quadrat was set as 1 m × 1 m, and the spacing between the quadrat is about 30 m. Three quadrats for each invasion degree were set and one plant was collected at the east, south, west, north, and middle part of each quadrat. A soil drill with an inner diameter of 10 cm was used to collect samples from the 0 to 30 cm soil layer and fine roots with a diameter of 0.1–0.5 cm were collected. Soil sieve was used to obtain rhizosphere soil samples by shaking method. Meanwhile, 0~30 cm of soil on the bare ground on the offshore side was also collected. The soil of the P. sibiricum root was named as XRS groups, and the bulk soil was marked as JSS groups.

2.3. Soil Index Determination

The pH of the soil was measured by the pH meter (Sartorius PB-10, Gottingen, Germany). Electrical conductivity (EC) was measured using a conductivity meter with a dry soil-to-water ratio of 1:5 (Hanna HI98192, Italy). The content of soil total organic carbon (TOC) was determined by direct potentiometric titration.

2.4. High-Throughput Sequencing of Soil Microbe

The DNA was extracted from the root and bulk soil samples using the E.Z.N.A.® Soil DNA Kit (D4015, Omega, Inc., Norcross, GA, USA). The 16S ribosomal RNA gene V3–V4 region with the primers 341F(5′-CCTACGGGNGGCWGCAG-3′) and 805R (5′-GACTACHVGGGTATCTAATCC-3′) was used for bacteria [13]. The ITS region was amplified using the primers ITS1(5′-GTGARTCATCGAATCTTTG-3′) and ITS2(5′-TCCTCCGCTTATTGATATGC-3′) for the fungal [14]. The PCR reaction mixture (25 µL) consisted of 12.5 µL Phusion Hot 2X Master Mix, 2.5 µL of each primer, and 50 ng of template DNA. After amplification, the presence of PCR products was verified with 2% agarose gel electrophoresis. The raw data were obtained from the Illumina Novaseq 6000 platform.

2.5. Statistical Analysis

The Dada2 [15] method in QIIME2 2020.6 software [16] was used for denoising and removing chimeric sequences to obtain the final compelling data (non-chimeric Reads). The SILVA v132 database was used to classify for taxonomic annotation of feature sequences. The species abundance was generated by using the QIIME2 software. Furthermore, The QIIME2 software was also used to calculate the Alpha diversity indices (AEC, Chao1, Shannon, and Simpson indices) and beta diversity [10]. The t-test evaluated the Alpha diversity index among treatments. Venn diagrams were constructed to show the shared and unique ASVs between the P. sibiricum rhizosphere and the surrounding environment. The difference in the microbial community structure between the P. sibiricum rhizosphere and surrounding sediment was visualized by the principal coordinate analysis (PCoA) based on the Bray-Curtis distance. The Heat explored the relationship between soil physicochemical properties and microbial community composition. All figures were constructed using R v3.4.4 [11] and the R package for Microbiome Census Data [17]. The differences in soil physicochemical properties and soil alpha diversity indices were tested by Student’s t-test using SPSS 23.0 (IBM SPSS Inc., Chicago, IL, USA) with n = 12. The difference in microbial community structure was tested using permutational multivariate analysis of variance (PERMANOVA) [18]. The raw data has been uploaded to the NCBI database. The generated serial number is PRJNA885525 and PRJNA885528.

3. Results

3.1. Soil Physicochemical Parameters

The EC, TOC, and pH of all the samples from different groups were presented in Figure 1. Our results showed that the EC was significantly higher in the JSS group than in the XRS group (p < 0.01). We speculated that the JSS group was closer to the sea and was more intensively affected by seawater (Figure 1a). The soil pH of the JSS group was significantly lower than that of the XRS group (p < 0.05) (Figure 1b), whereas TOC did not differ significantly (p > 0.05) between the JSS and XRS groups (Figure 1c).

3.2. Microbial Community Structure Analysis

For bacteria, 868,411 raw reads were obtained; for fungi, 708,134 raw reads were obtained in the present study. According to the species annotation results, the top 10 species at the phylum level with the greatest abundance of P. sibiricum rhizosphere and non-rhizosphere soil microorganisms were selected to generate species. At the phylum level, the dominant bacteria in the JSS groups were Proteobacteria, Chloroflexi, Acidobacterota, Gemmatimonadota, Methylomirabilota, Actinobacteriota, and Bacteroidota (Figure 2a). Moreover, the predominant bacteria in the XRD samples were Proteobacteria, Actinobacteriota, Acidobacteriota, and Gemmatimonadota (Figure 2a). We found that rhizosphere and non-rhizosphere fungal compositions were similar (Figure 2b). The dominant fungi in the rhizosphere and non-rhizosphere soil samples were Ascomycota, Basidiomycota, Chytridiomycota, and Mortierellomycota (Figure 2b). At the genus level, except for the unclassified species, the dominant bacteria in the rhizosphere soil of P. sibiricum samples were wb_A12, and the predominant bacteria in the non-rhizosphere soil samples were Enterococcus (Figure 2c). For fungal, the dominant fungal in the rhizosphere and non-rhizosphere soil of P. sibiricum samples were Ustilago, Neoascochyta, Alternaria, Fusarium, Cladosporium, and Epicoccum (Figure 2d).

3.3. Alpha Diversity Index Difference Analysis among Different Groups

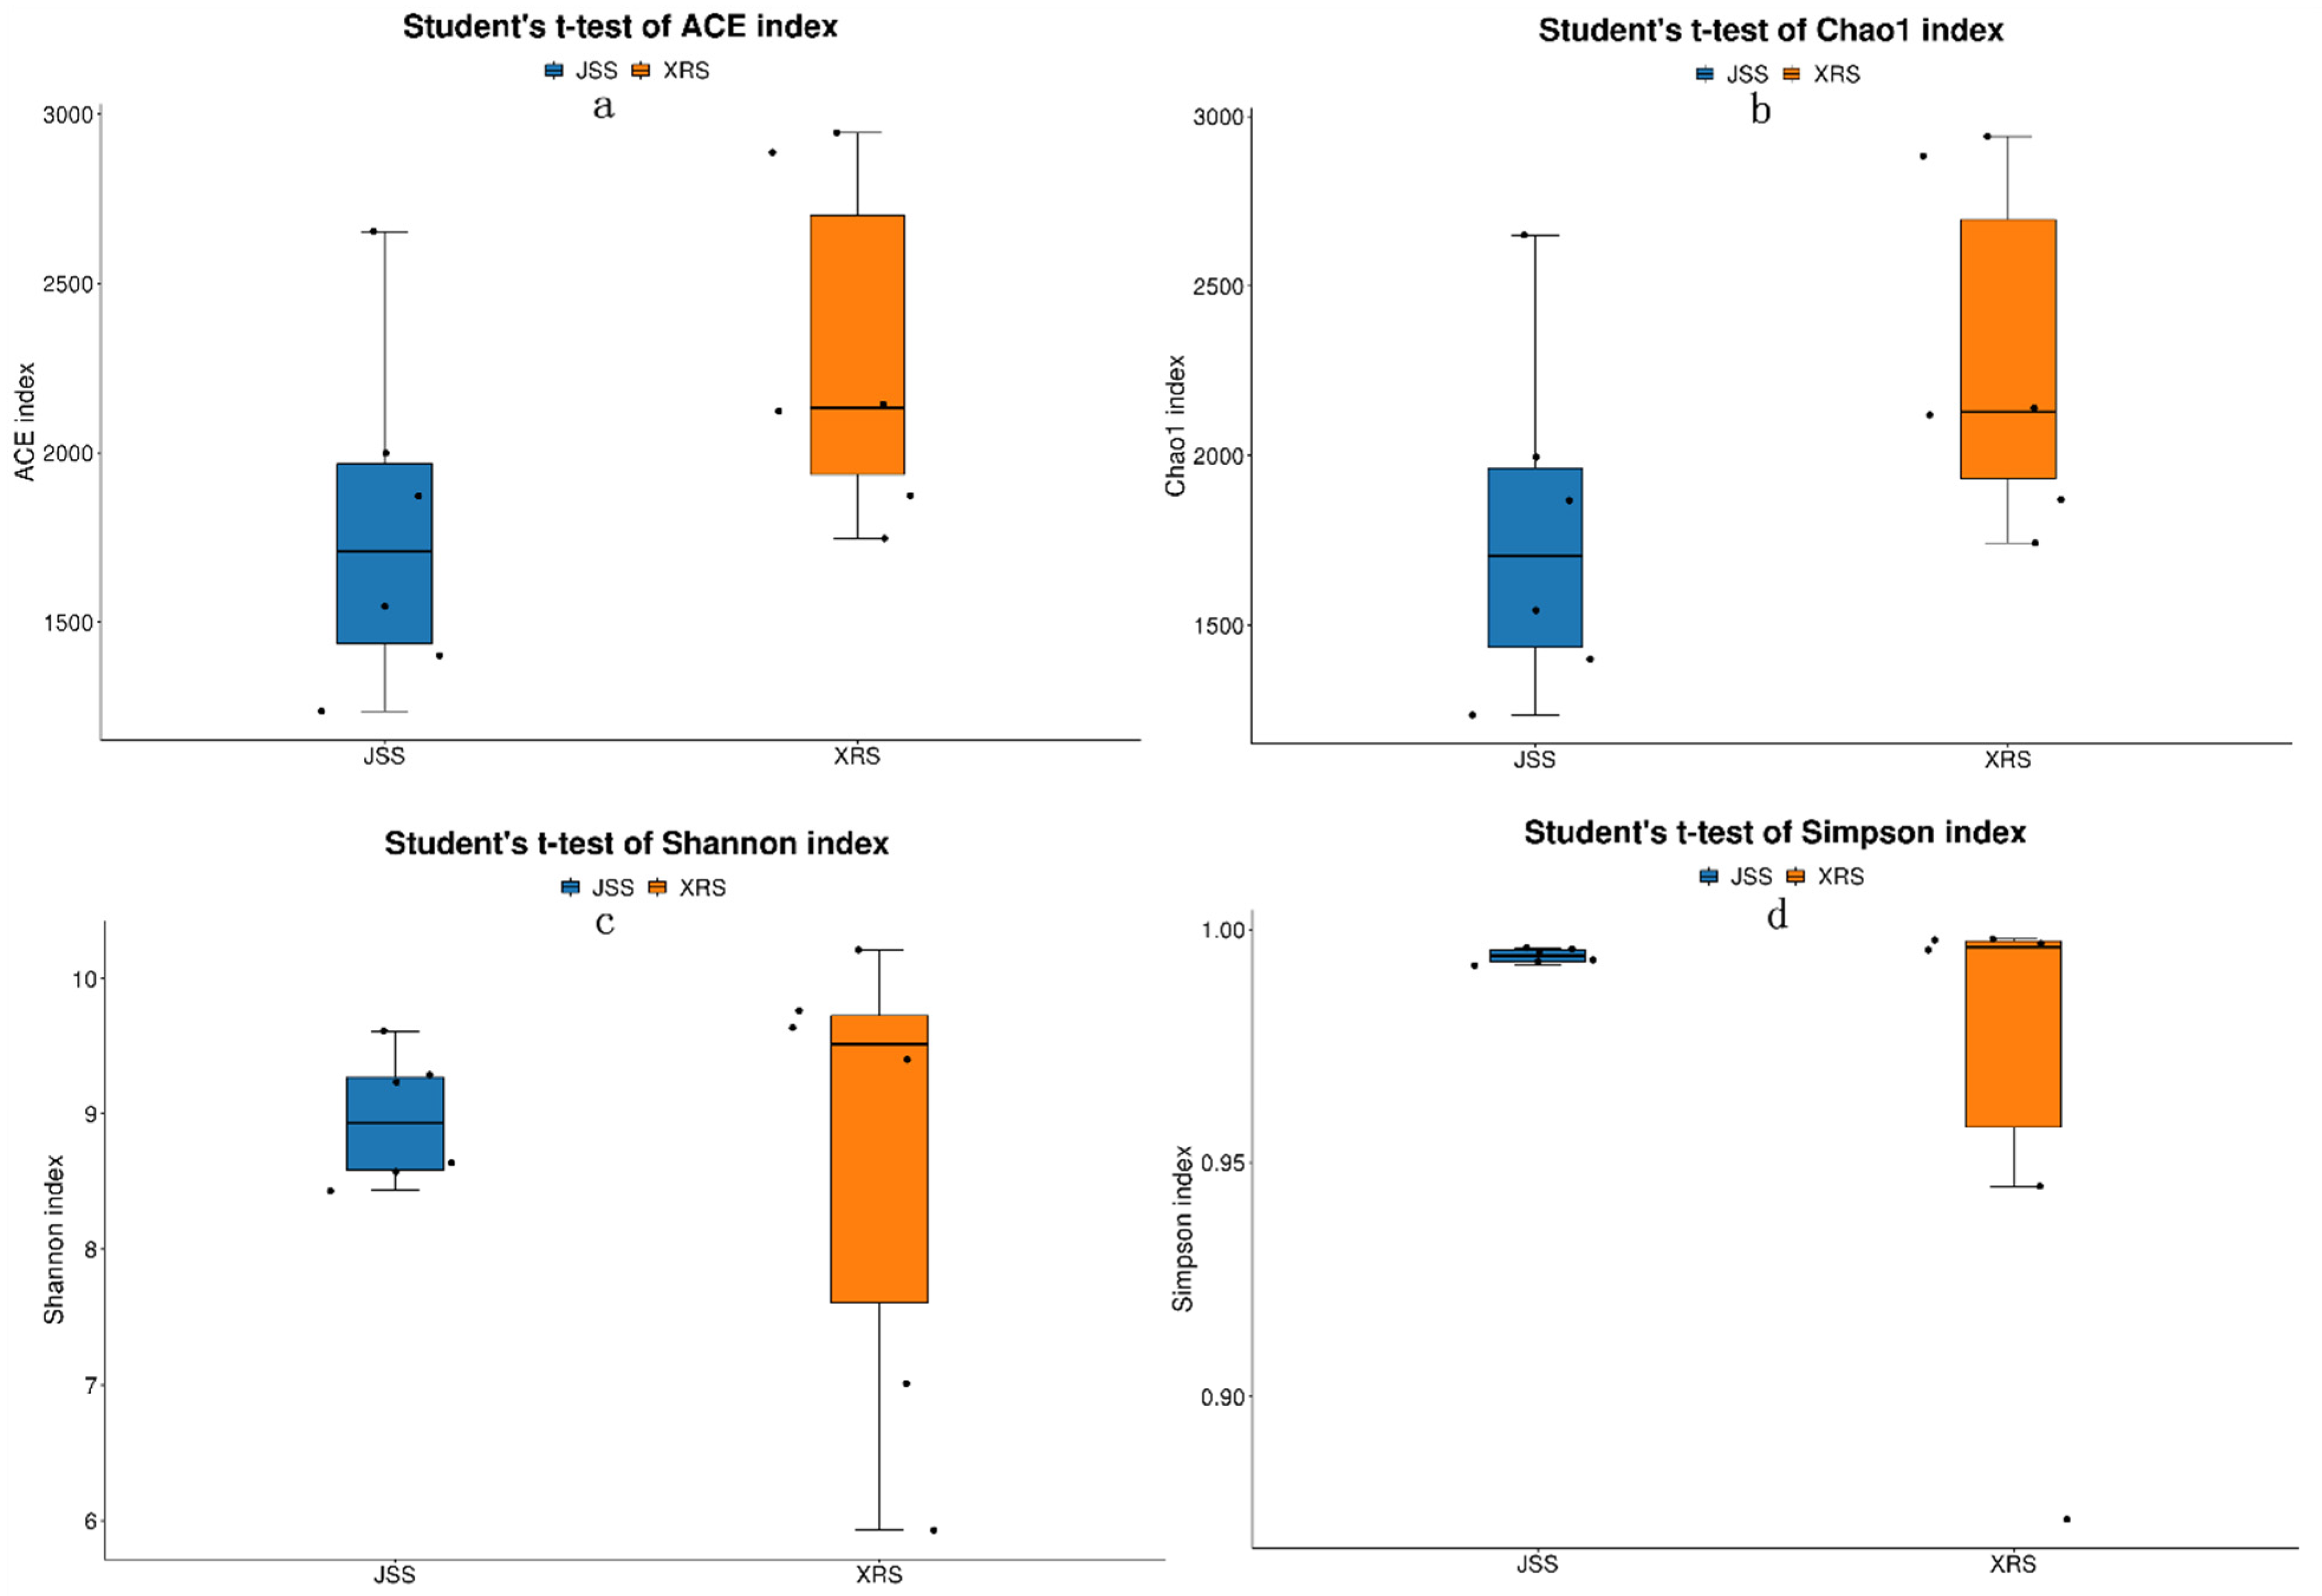
The Chao1 and Ace indices measure species abundance as the number of species. Shannon and Simpson’s indices are used to measure species diversity, which is affected by species abundance and community evenness in the sample community. Our results showed that the Simpson index (Figure 3d) (0.994) and Shannon index (Figure 3c) (8.96) of the JSS are higher than those of the XRS (Simpson index = 0.968 and Shannon index = 8.65). The community diversity is higher than that of soil bacteria. The Chao1 (Figure 3b) index (1781.65) and ACE (Figure 3a) index (1784) of the JSS groups are lower than those of the XRS. It indicated that the abundance of rhizosphere soil bacteria was higher than that of soil bacteria.
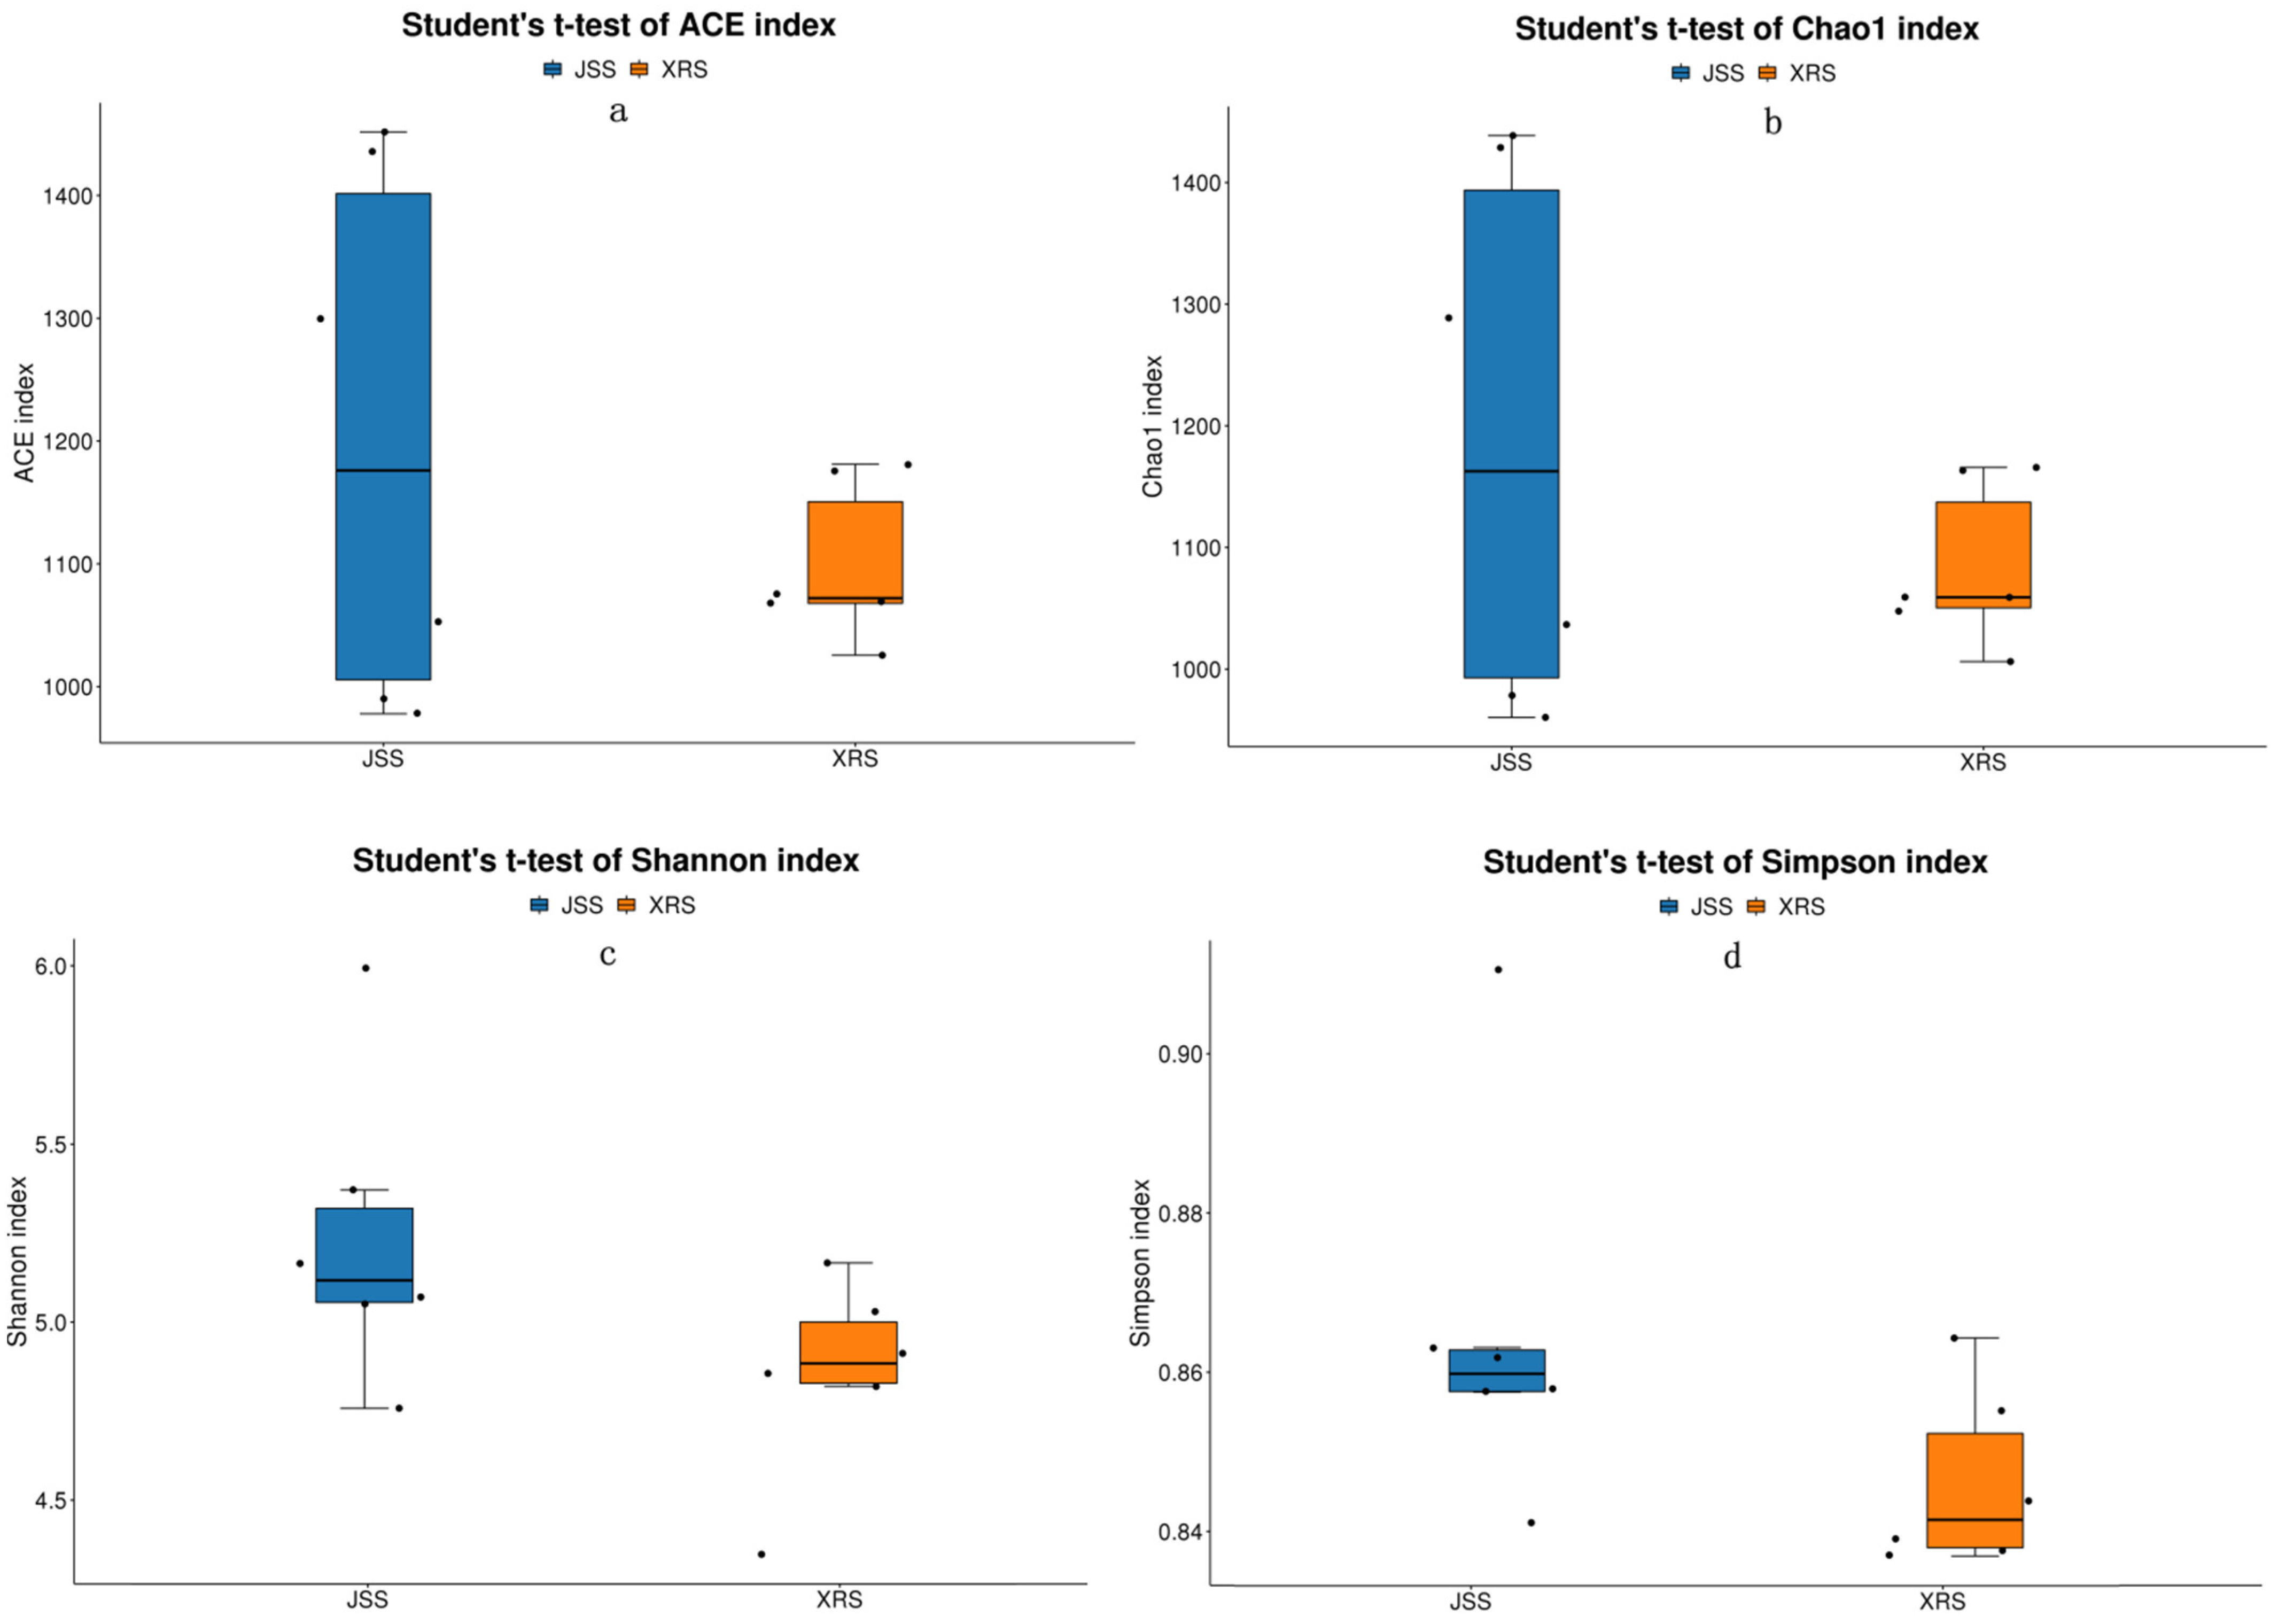
For fungi, the Shannon index (Figure 4c), ACE index (Figure 4a), and Chao1 (Figure 4b) index of non-rhizosphere soil fungi are lower than those of rhizosphere soil fungi, which indicates that the abundance of fungi in the rhizosphere soil is higher than that in the non-rhizosphere soil. The Simpson (Figure 4d) index of non-rhizosphere soil fungi was higher than that of rhizosphere soil fungi. The coverage ratios of all samples were significantly higher than 0.99, meaning the sequences of the pieces were detected, indicating that the sequencing results could reflect the actual condition of the selection.
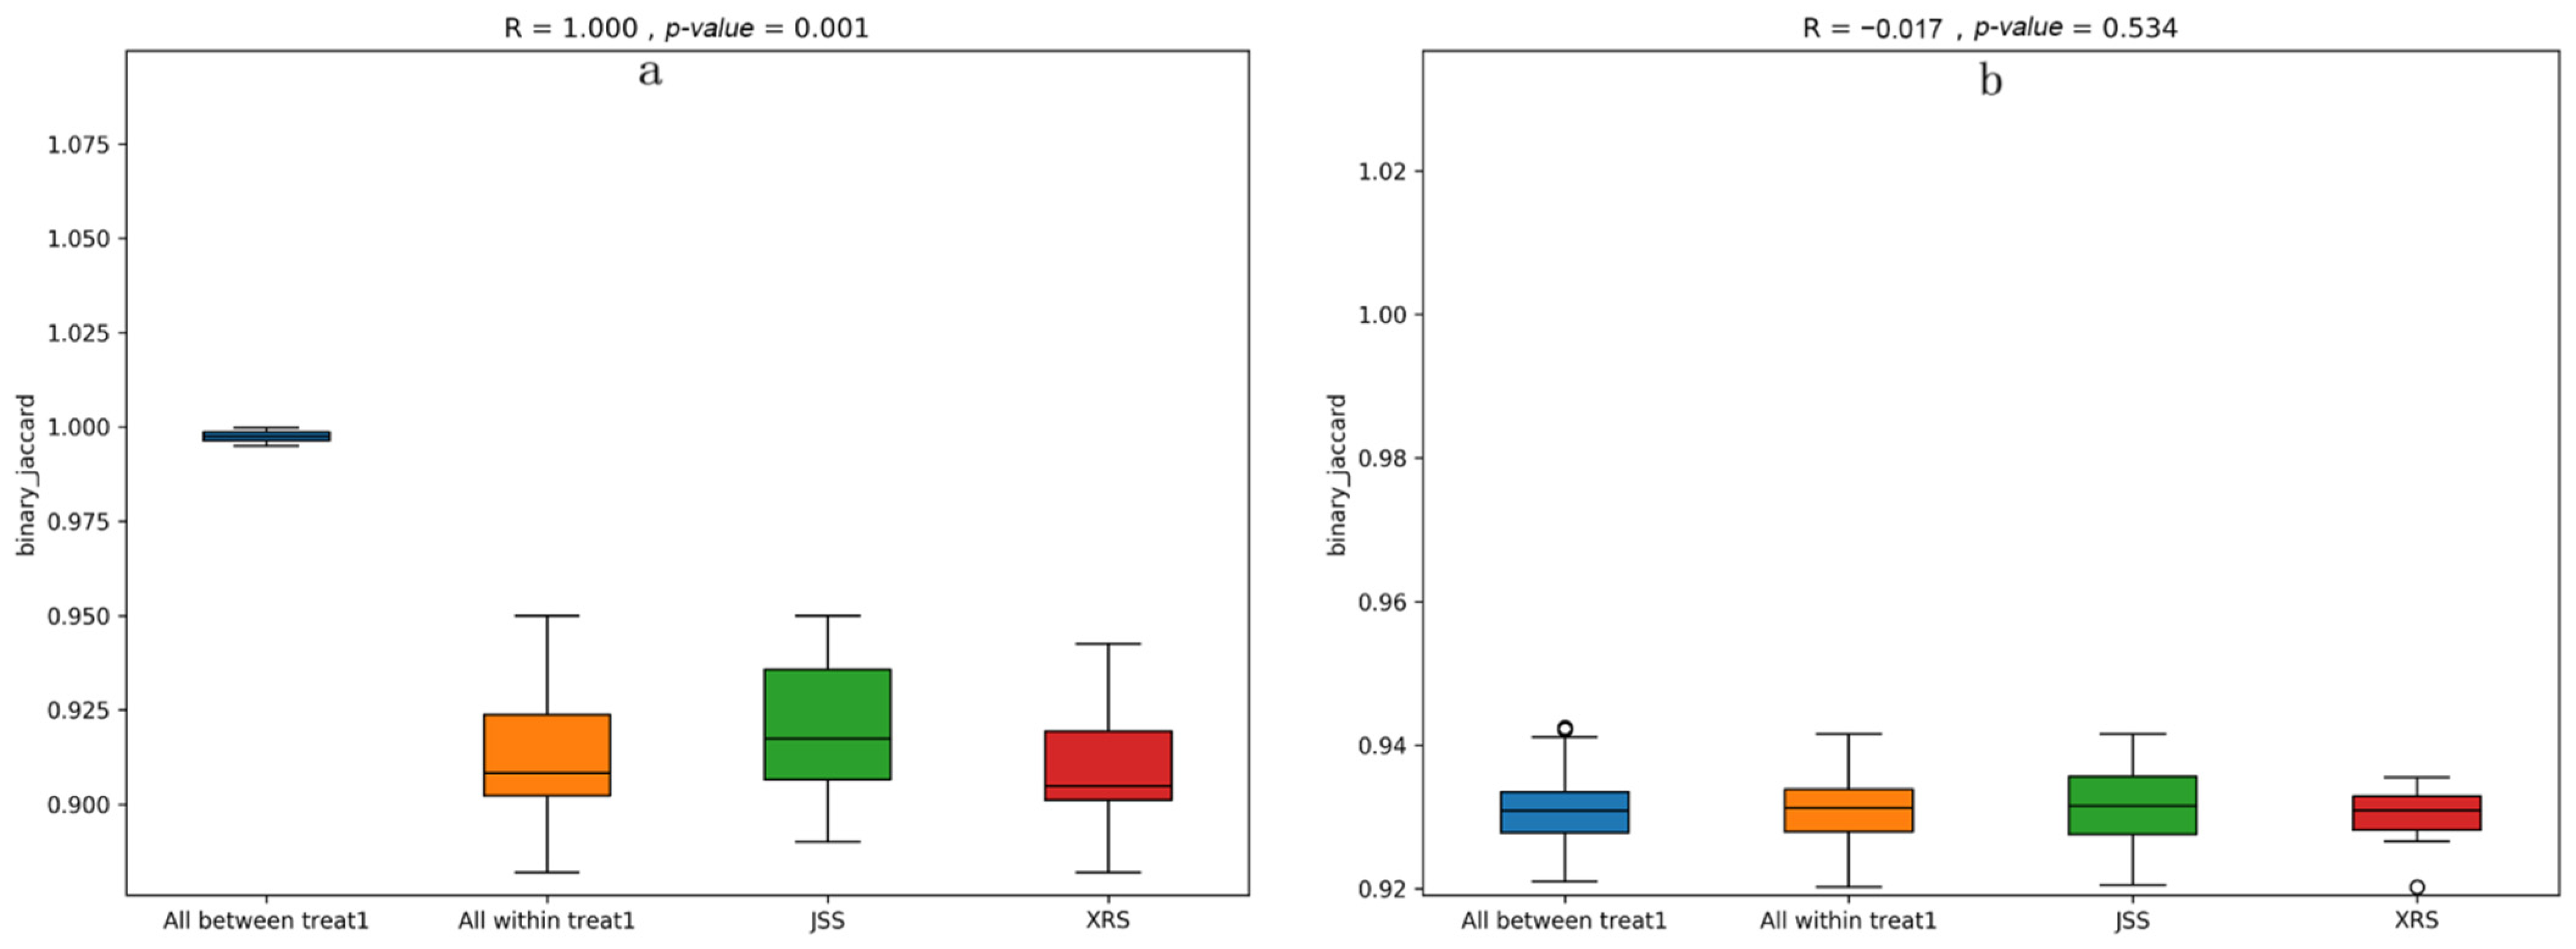
R2, obtained by PERMANOVA analysis, represents the degree of explanation of sample differences between different groups. A larger R2 indicates a higher resolution of differences between groups, indicating a more significant group difference. For bacteria, the R2 was 0.177 (p-value = 0.008), meaning there significant differences between groups (Figure 5a). For fungi, the R2 was 0.091 (p-value = 0.442), indicating no significant difference between groups (Figure 5b).

3.4. ASVs Abundance Analysisp

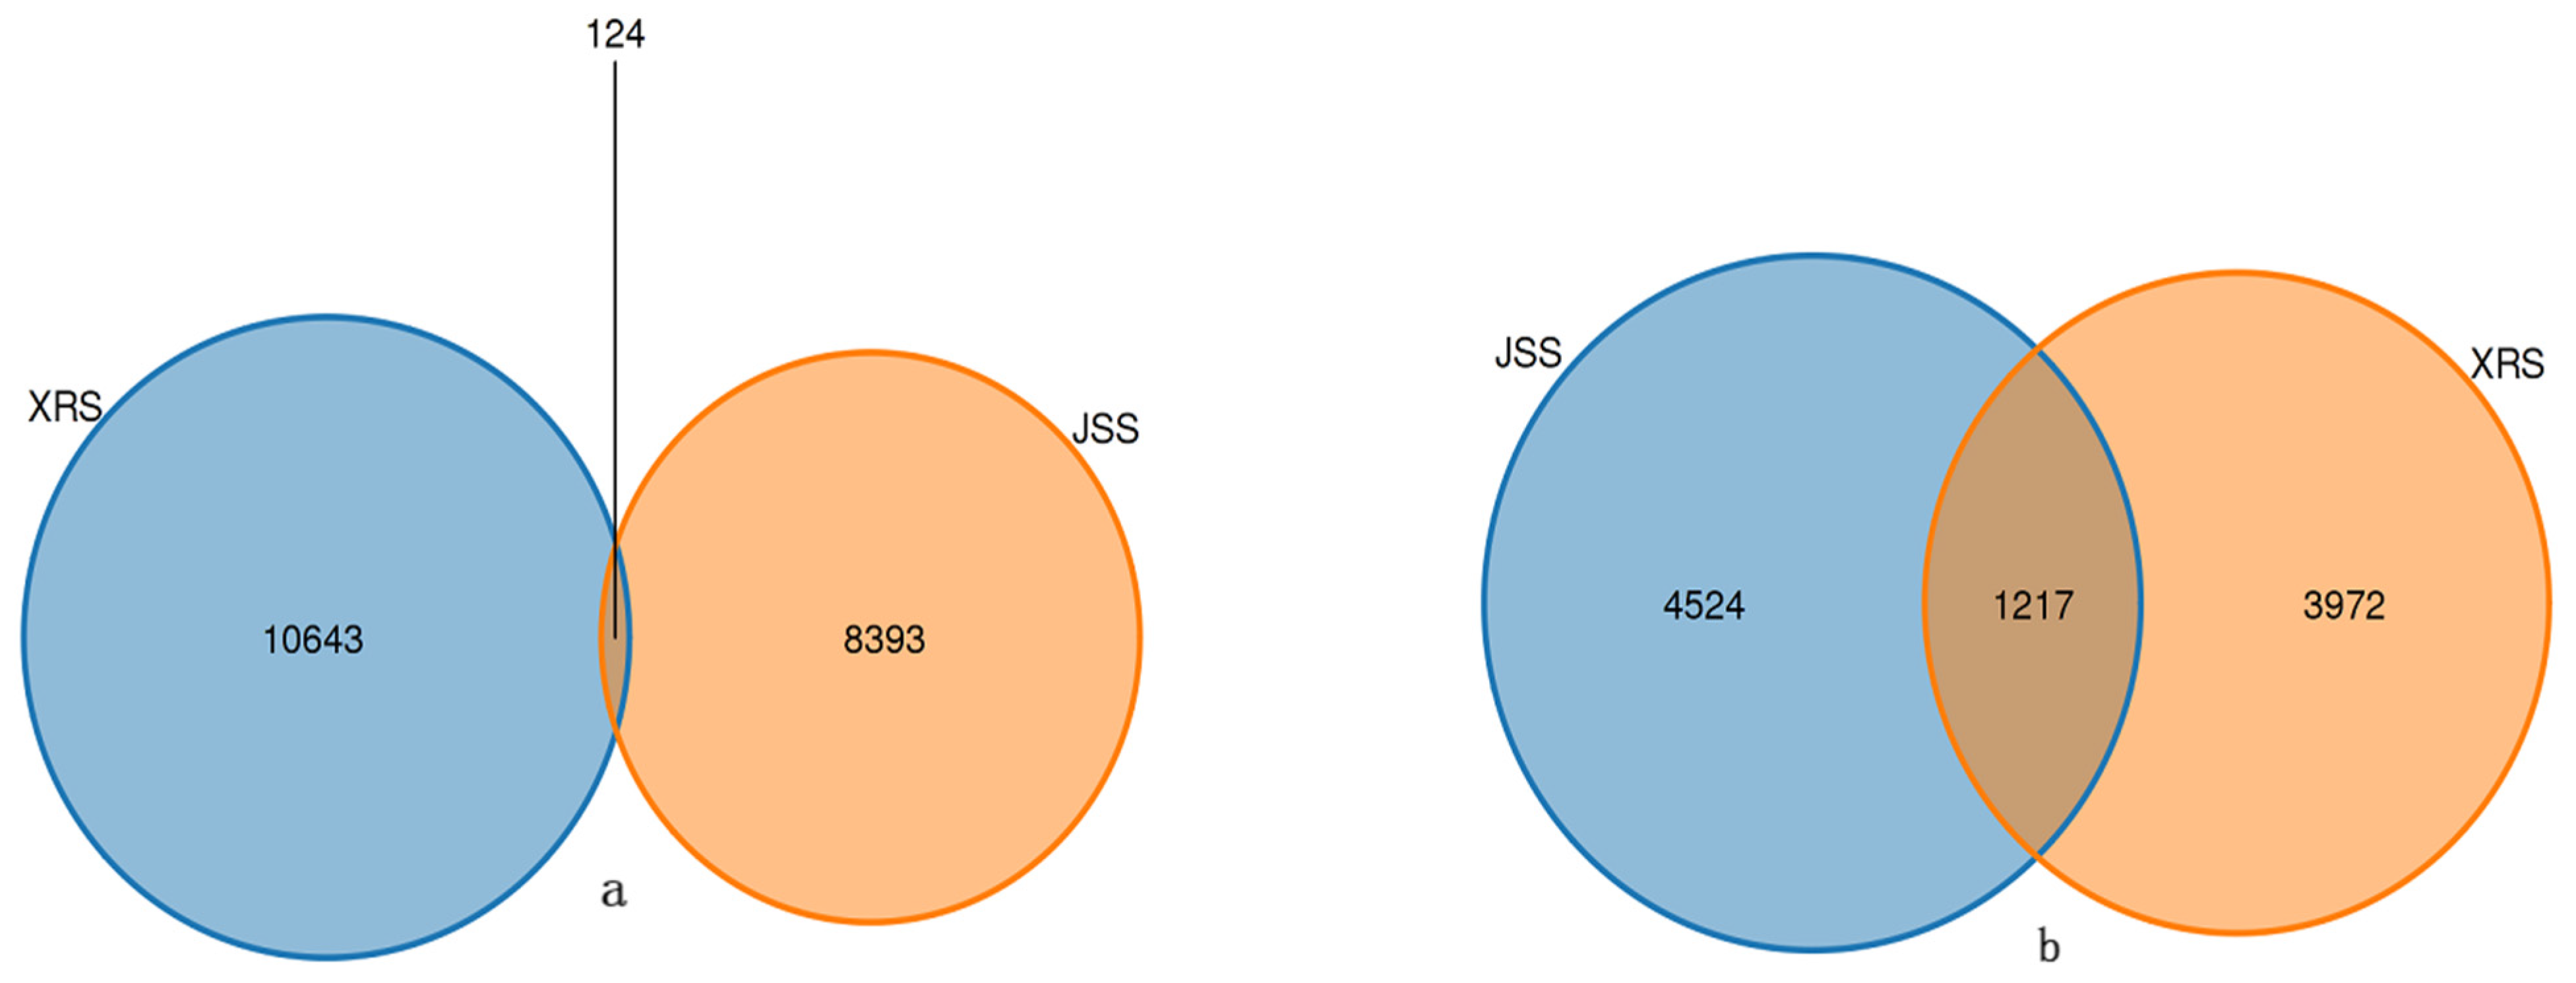
In the present study, the total number of bacterial ASVs obtained from different groups was 19,160, and the number of ASVs shared by them was 124. The number of ASVs specific to rhizosphere soil bacteria was higher than that of non-rhizosphere soil bacteria (Figure 6a). The number of ASVs was significant, indicating more bacterial species in the rhizosphere soil. The total number of fungal ASVs obtained from the two samples was 9713, and the number of their shared ASVs (1217) was significantly smaller than the number of their unique ASVs (Figure 6b), indicating the rhizosphere soil and non-rhizosphere fungi were similar in composition.

3.5. PCoA Analysis

PCoA analysis can intuitively reflect the differences or similarities among different groups. For bacteria (Figure 7a), our results showed that the contribution rates of PC1 and PC2 were 17.77% and 9.15%, respectively. The bacterial communities were relatively close to the groups, indicating their similar community composition. The comparison shows that the distribution distances of and communities are quite different, meaning significant differences in the design of the rhizosphere and non-rhizosphere soil bacterial communities of P. sibiricum. In the PCA analysis results of fungal community composition, the contribution rates of PC1 and PC2 were 9.58% and 9.46% (Figure 7b), respectively. The rhizosphere and non-rhizosphere soil fungal community distributions of P. sibiricum are relatively scattered. Furthermore, the differences between groups are significant, indicating that the rhizosphere and non-rhizosphere soil fungal community compositions are very different. So, whether it is bacterial community structure or fungal community structure, there are significant differences between the rhizosphere and non-rhizosphere soils of P. sibiricum.

3.6. Correlation between Soil Microbiological Compositions and Soil Physicochemical Properties

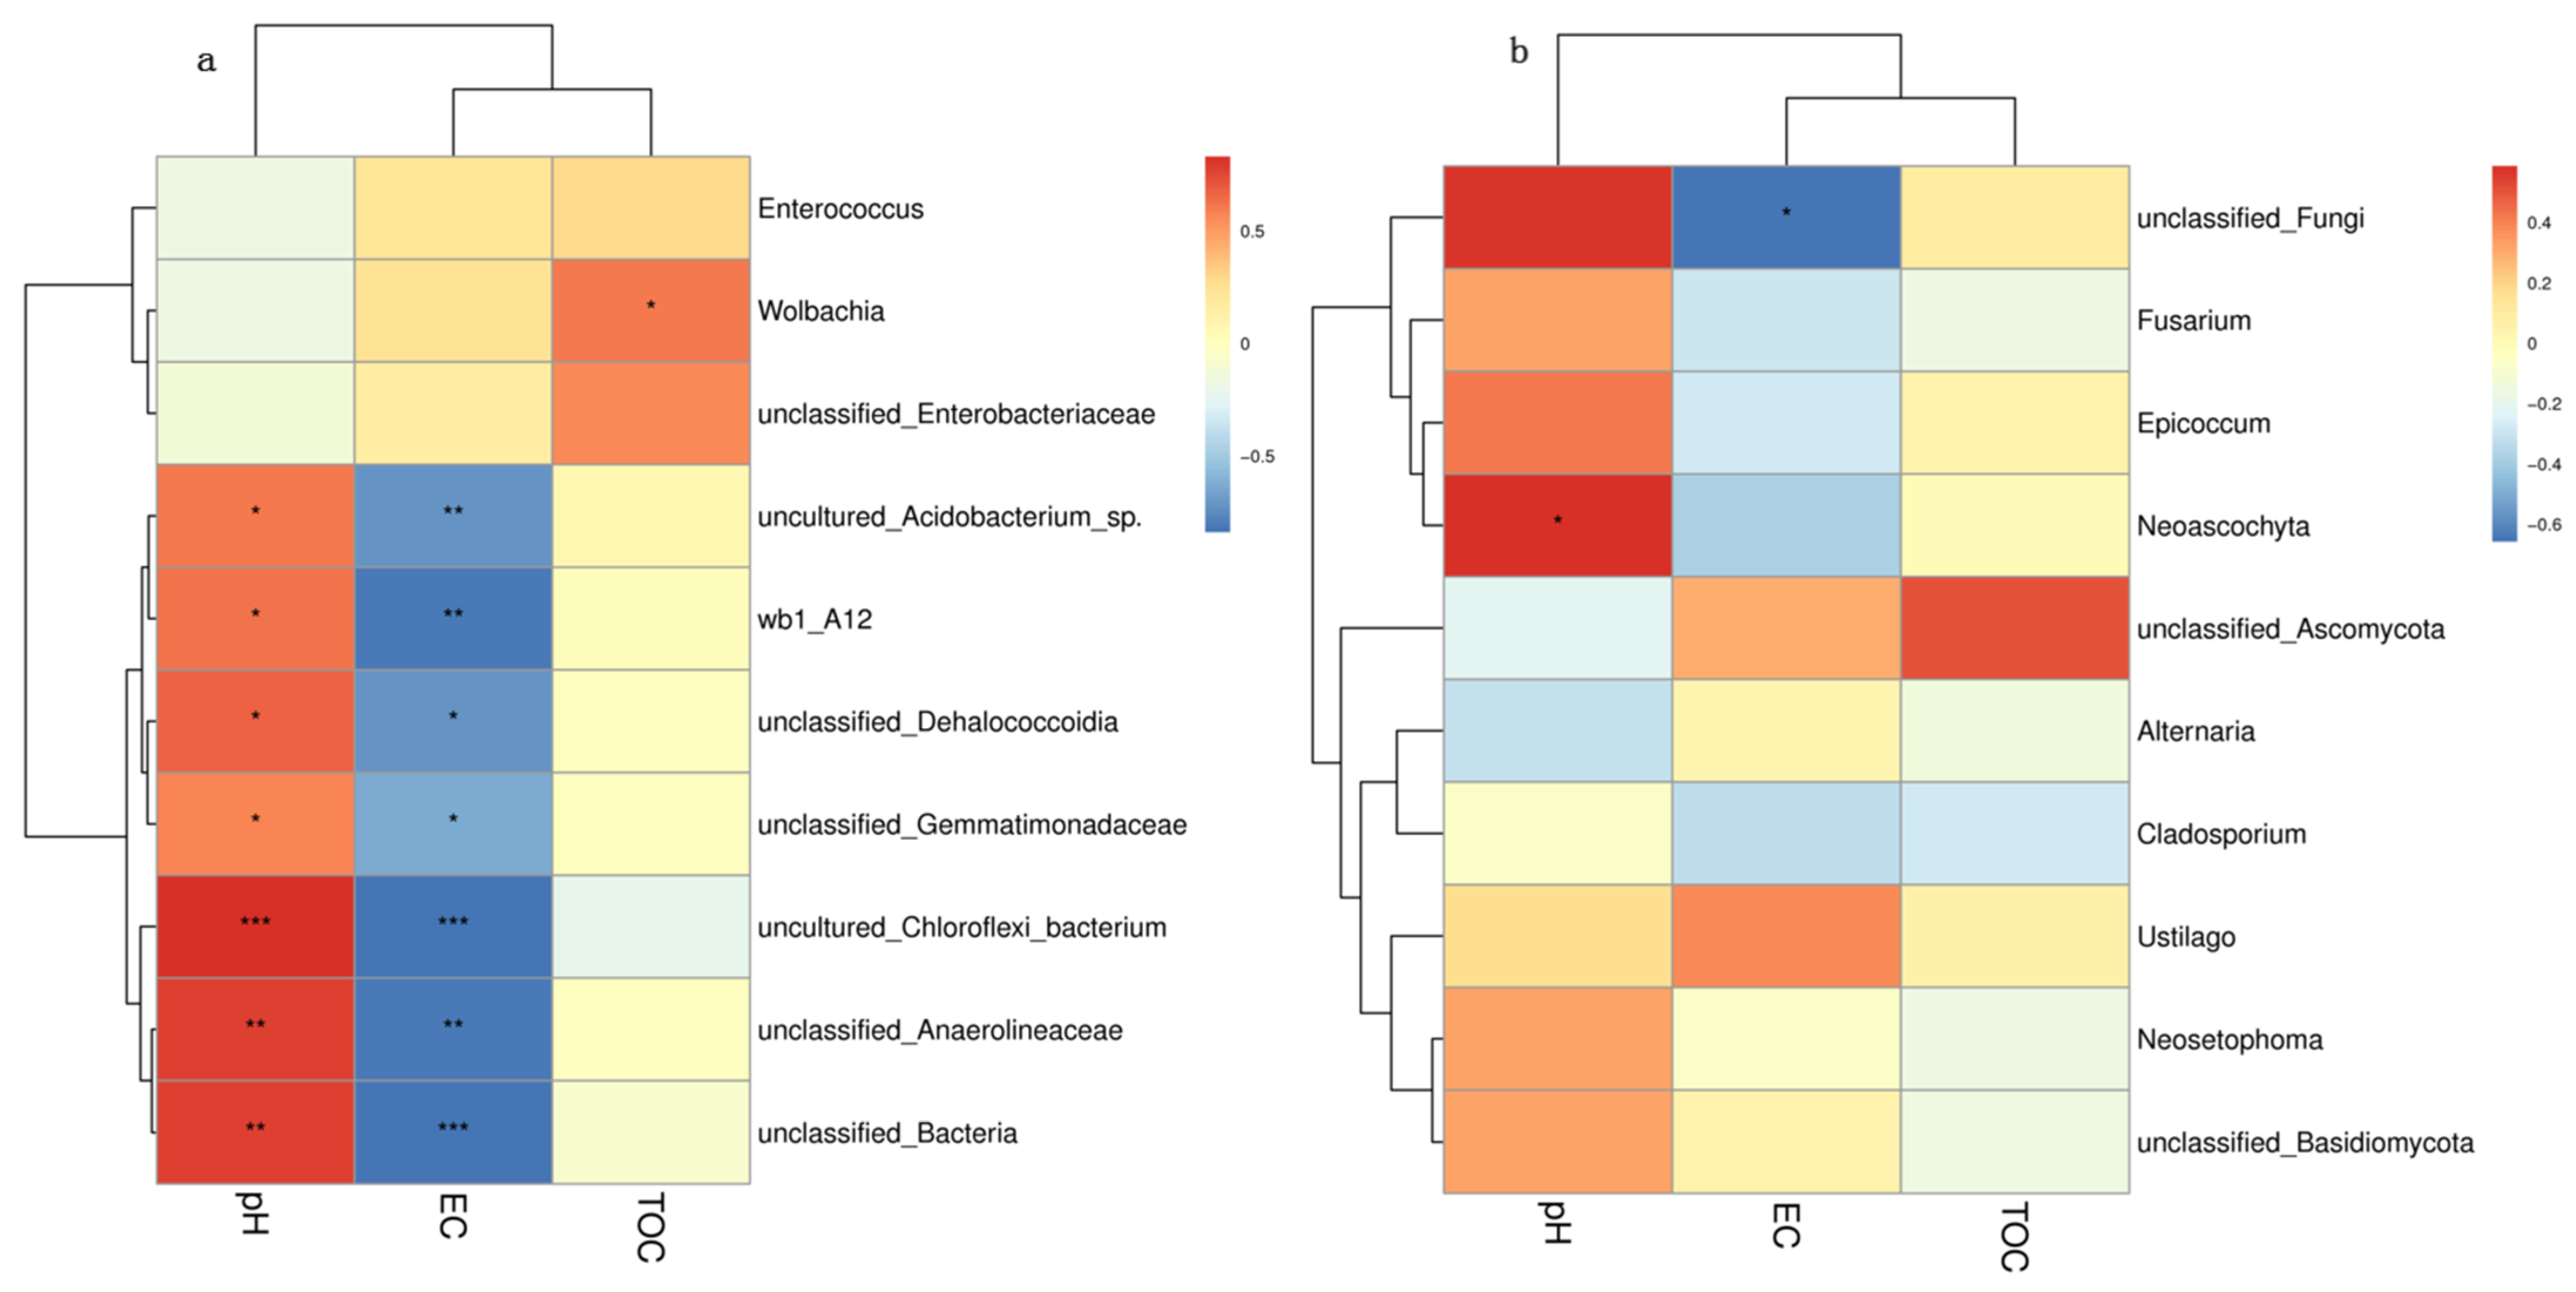
The obtained numerical matrix is displayed in the heatmap diagram (Figure 8a). The results showed that for bacteria, the pH was significantly positively correlated with the Wb1_A12; the EC was significantly negatively correlated with the Wb1_A12, and the TOC was significantly positively correlated with Wolbachia. For fungi, the pH had a significant correlation with Neoascochyta, and the EC had a significant negative correlation with unclassified fungi (Figure 8b).

4. Discussion

Microorganisms are crucial to material transfer and transformation in the rhizosphere environment. Soil microorganisms are a vital part of the soil, and their diversity and abundance can indirectly reflect soil quality and fertility [19]. Compared with microorganisms living in other environments, microorganisms in soil habitats tend to have higher species richness and more complex community composition. However, rhizosphere soils are often distinguished from non-rhizosphere soils [20]. In the present study, the Shannon index, Chao1 index, and ACE index of rhizosphere soil bacteria are higher than those of non-rhizosphere soil bacteria. Compared with a non-rhizosphere environment, the rhizosphere microenvironment is relatively complicated. There is a richer microbial diversity in the rhizosphere, similar to previous research results [21]. The bacterial community diversity in the rhizosphere and of P. sibiricum was significantly higher than in the non-rhizosphere. Moreover, fungal community diversity in the rhizosphere and non-rhizosphere of P. sibiricum was similar. The similarity might be due to the proximity of the rhizosphere and non-rhizosphere [22].
In the present study, we found that the pH of the rhizosphere was higher than that of the non-rhizosphere. The non-rhizosphere area is close to the sea, being exposed to the effects of seawater for more time, and has a low pH. At the same time, we found that EC was more significant in the non-rhizosphere, which was because the non-rhizosphere area was located on the offshore side, washed by seawater, and had a higher salinity. The pH value in the JSS group decreased significantly compared to the XRS group, which may explain the lower diversity of the bacterial community.
The ASVs results showed that, compared with bacteria, fungi have more ASVs in common. The PERMANOVA analysis also represents that the fungi community between the rhizosphere and non-rhizosphere was not significantly different; the bacteria community between the rhizosphere and non-rhizosphere was significantly different. Compared to the bacteria community, the fungi are more similar in the two groups. The PCoA analysis also showed that the bacterial and fungal community structures between the rhizosphere and non-rhizosphere were distinct enough that the structure clustered significantly separately.
Our results showed that the Proteobacteria, Actinobacteriota, Gemmatimonadota, and Actinobacteriota were dominant in the two groups. A previous study found that Proteobacteria and Actinobacteria were prevalent in the semi-arid floodplain [23]. The Proteobacteria were essential in responding to low-molecular-weight substrates [24]. These results were similar to the previous study. The Gemmatimonadota was reported to be a plant richness and soil nutrients (carbon, nitrogen, phosphorus, and sulfur) cycle, which play a crucial role in plant ecosystems [25]. Thus, the Gemmatimonadota might also be essential for P. sibiricum physiological activity. The dominant fungi in the rhizosphere and non-rhizosphere soil samples were Ascomycota, Basidiomycota, Chytridiomycota, and Mortierellomycota, consistent with a previous study [26].
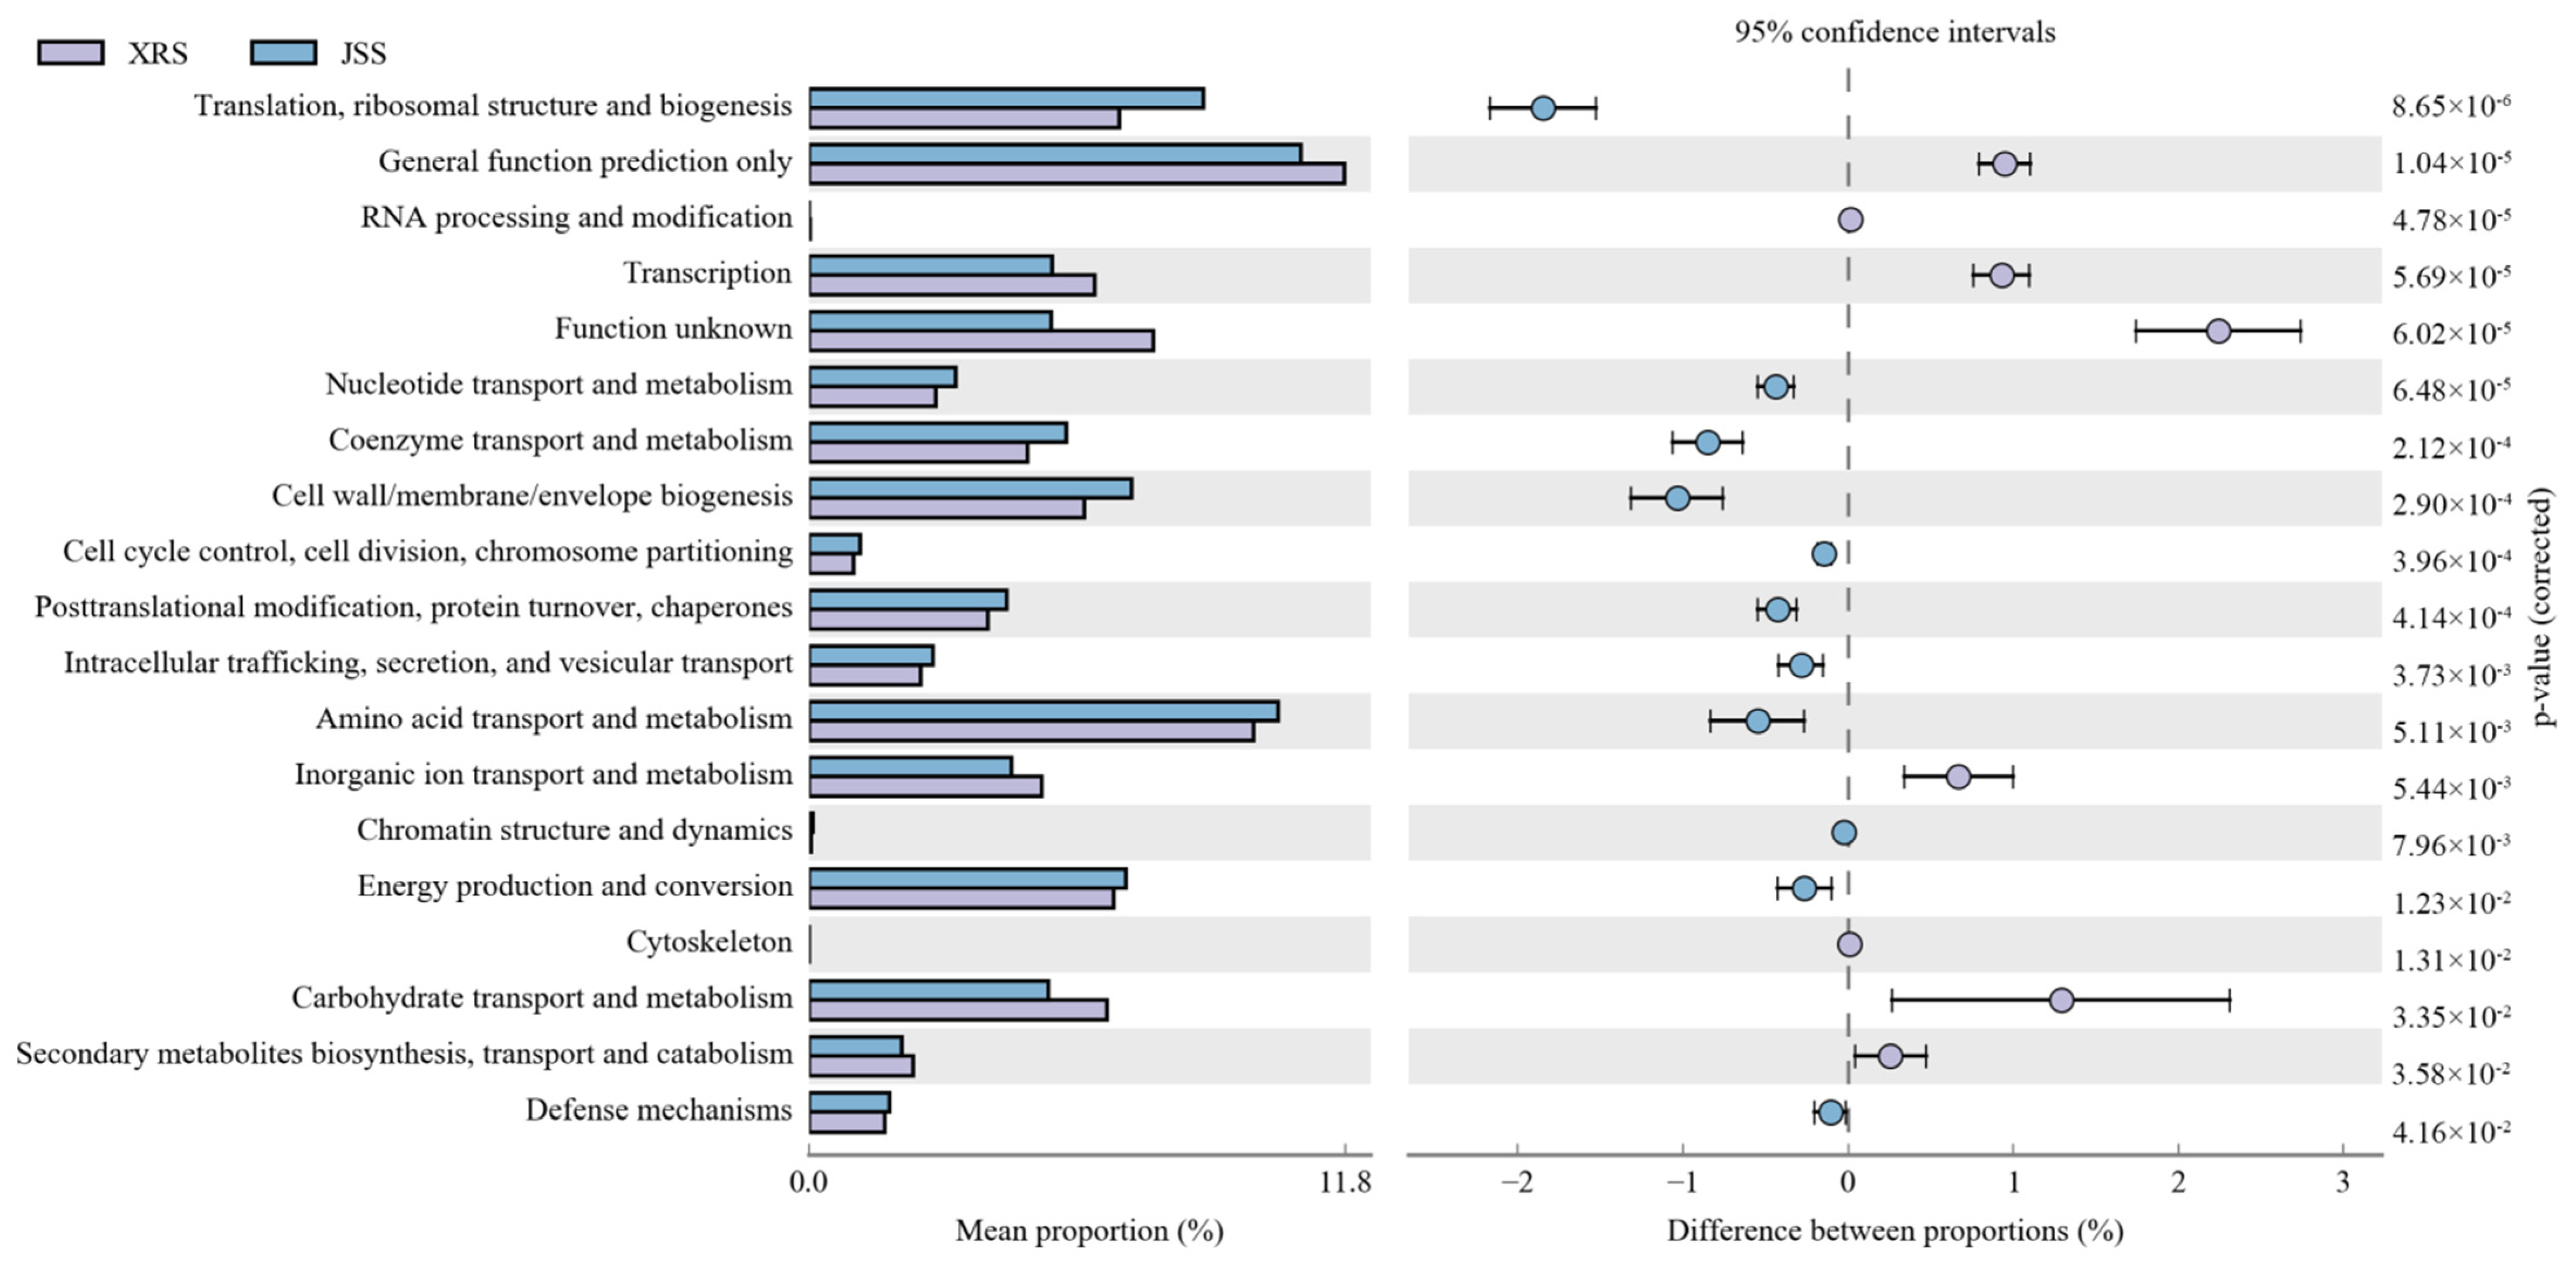
For bacteria, the top five gene families with high relative abundance in COG functional annotation were poorly characterized (general function prediction), metabolism (amino acid transport, energy production and conversion, carbohydrate transport, and metabolism), information storage and processing (translation, ribosome structure, and biosynthesis), cellular processes, and signaling (cell wall/membrane/envelope biosynthesis). In this study, the relative abundance in COG functional annotation showed significant differences between groups (Figure 9). In addition to general function prediction and carbohydrate transport and metabolism, the non-rhizosphere was higher than the rhizosphere.

5. Conclusions

In conclusion, the Proteobacteria, Actinobacteriota, Gemmatimonadota, and Actinobacteriota were dominant in the rhizosphere and non-rhizosphere of P. sibiricum. The predominant fungi groups in the rhizosphere and non-rhizosphere of P. sibiricum were Ascomycota, Basidiomycota, Chytridiomycota, and Mortierellomycota. There are still some differences in composition between the rhizosphere and non-rhizosphere of P. sibiricum, according to the PCoA results.

Author Contributions

Conceptualization, L.Z.; methodology, L.Z.; software, L.Z.; validation, L.Z., S.S. and D.S.; formal analysis, H.X.; writing—original draft preparation, L.Z. and S.S.; writing—review and editing, L.Z., S.S. and J.W. All authors have read and agreed to the published version of the manuscript.

Funding

This work was supported by the Natural Science Foundation of Shandong Province (ZR2021QDO82), the Scientific and technological innovation policy guiding project of the Binzhou Agricultural community (2022SHFZ001).

Institutional Review Board Statement

Not applicable.

Data Availability Statement

The generated serial number is PRJNA885525 and PRJNA885528.

Conflicts of Interest

The authors declare no conflict of interest.

References

  1. Qu, C.P.; Xu, Z.R.; Liu, G.J.; Liu, C.; Li, Y.; Wei, Z.G.; Liu, G.F. Differential Expression of Copper-Zinc Superoxide Dismutase Gene of Polygonum sibiricum Leaves, Stems and Underground Stems, Subjected to High-Salt Stress. Int. J. Mol. Sci. 2010, 11, 5234–5245. [Google Scholar] [CrossRef] [PubMed] [Green Version]
  2. De Cesare, F.; Di Mattia, E.; Macagnano, A. Nanorhizosphere: A new approach to study the interactions between plant and soil microorganisms—The effect of pollutants. In Proceedings of the Egu General Assembly Conference, Vienna, Austria, 23–28 April 2017. [Google Scholar]
  3. Volpiano, C.G.; Lisboa, B.B.; Jose, J.; Beneduzi, A.; Granada, C.E.; Vargas, L.K. Soil-plant-microbiota interactions to enhance plant growth. Rev. Bras. De Cienc. Do Solo 2022, 46, e0210098. [Google Scholar] [CrossRef]
  4. Zhang, B.H.; Hong, J.P.; Zhang, Q.; Jin, D.S.; Gao, C.H. Contrast in soil microbial metabolic functional diversity to fertilization and crop rotation under rhizosphere and non-rhizosphere in the coal gangue landfill reclamation area of Loess Hills. PLoS ONE 2020, 15, e0229341. [Google Scholar] [CrossRef]
  5. Pantigoso, H.A.; Newberger, D.; Vivanco, J.M. The rhizosphere microbiome: Plant-microbial interactions for resource acquisition. J. Appl. Microbiol. 2022, 133, 2864–2876. [Google Scholar] [CrossRef]
  6. Cúcio, C.; Engelen, A.H.; Costa, R.; Muyzer, G. Rhizosphere Microbiomes of European Seagrasses Are Selected by the Plant, but Are Not Species Specific. Front. Microbiol. 2016, 7, 440. [Google Scholar] [CrossRef] [PubMed] [Green Version]
  7. Kong, H.G.; Song, G.C.; Ryu, C.M. Inheritance of seed and rhizosphere microbial communities through plant-soil feedback and soil memory. Environ. Microbiol. Rep. 2019, 11, 479–486. [Google Scholar] [CrossRef] [PubMed]
  8. Liu, Z.; Zhuang, Z.; Han, D.; Qi, X. The sedimentary characteristics and formation mechanism of shell ridges along the southwest coast of Bohai Bay. J. Ocean. Univ. China 2005, 4, 124–130. [Google Scholar] [CrossRef]
  9. Podile, A.R.; Kishore, G.K. Plant growth-promoting rhizobacteria. In Plant-Associated Bacteria; Gnanamanickam, S.S., Ed.; Springer: Dordrecht, The Netherlands, 2006; pp. 195–230. [Google Scholar]
  10. Xu, J.; Wang, W.Y.; Sun, J.H.; Zhang, Y.; Ge, Q.; Du, L.G.; Yin, H.X.; Liu, X.J. Involvement of auxin and nitric oxide in plant Cd-stress responses. Plant Soil 2011, 346, 107–119. [Google Scholar] [CrossRef]
  11. Jia, X.; Li, X.D.; Zhao, Y.H.; Wang, L.; Zhang, C.Y. Soil microbial community structure in the rhizosphere of Robinia pseudoacacia L. seedlings exposed to elevated air temperature and cadmium-contaminated soils for 4 years. Sci. Total Environ. 2019, 650, 2355–2363. [Google Scholar] [CrossRef]
  12. Garbeva, P.; van Elsas, J.D.; van Veen, J.A. Rhizosphere microbial community and its response to plant species and soil history. Plant Soil 2008, 302, 19–32. [Google Scholar] [CrossRef]
  13. Logue, J.B.; Stedmon, C.A.; Kellerman, A.M.; Nielsen, N.J.; Andersson, A.F.; Laudon, H.; Lindstrom, E.S.; Kritzberg, E.S. Experimental insights into the importance of aquatic bacterial community composition to the degradation of dissolved organic matter. ISME J. 2016, 10, 533–545. [Google Scholar] [CrossRef] [PubMed] [Green Version]
  14. Shang, S.; Hu, S.X.; Liu, X.X.; Zang, Y.; Chen, J.; Gao, N.; Li, L.Y.; Wang, J.; Liu, L.X.; Xu, J.K.; et al. Effects of Spartina alterniflora invasion on the community structure and diversity of wetland soil bacteria in the Yellow River Delta. Ecol. Evol. 2022, 12, e8905. [Google Scholar] [CrossRef]
  15. Callahan, B.J.; McMurdie, P.J.; Rosen, M.J.; Han, A.W.; Johnson, A.J.A.; Holmes, S.P. DADA2: High-resolution sample inference from Illumina amplicon data. Nat. Methods 2016, 13, 581–583. [Google Scholar] [CrossRef] [Green Version]
  16. Telatin, A. Qiime Artifact eXtractor (qax): A Fast and Versatile Tool to Interact with Qiime2 Archives. Biotech 2021, 10, 5. [Google Scholar] [CrossRef]
  17. McMurdie, P.J.; Holmes, S. phyloseq: An R Package for Reproducible Interactive Analysis and Graphics of Microbiome Census Data. PLoS ONE 2013, 8, e61217. [Google Scholar] [CrossRef] [PubMed] [Green Version]
  18. Chen, J.; Zhang, X.Y. D-MANOVA: Fast distance-based multivariate analysis of variance for large-scale microbiome association studies. Bioinformatics 2022, 38, 286–288. [Google Scholar] [CrossRef] [PubMed]
  19. Mousavi, S.M.; Motesharezadeh, B.; Hosseini, H.M.; Alikhani, H.; Zolfaghari, A.A. Root-induced changes of Zn and Pb dynamics in the rhizosphere of sunflower with different plant growth promoting treatments in a heavily contaminated soil. Ecotoxicol. Environ. Saf. 2018, 147, 206–216. [Google Scholar] [CrossRef]
  20. Li, Z.G.; Zu, C.; Wang, C.; Yang, J.F.; Yu, H.; Wu, H.S. Different responses of rhizosphere and non-rhizosphere soil microbial communities to consecutive Piper nigrum L. monoculture. Sci. Rep. 2016, 6, 35825. [Google Scholar] [CrossRef] [Green Version]
  21. Patkowska, E. Effect of Bio-Products on Bean Yield and Bacterial and Fungal Communities in the Rhizosphere and Non-Rhizosphere. Pol. J. Environ. Stud. 2009, 18, 255–263. [Google Scholar]
  22. Ugarelli, K.; Laas, P.; Stingl, U. The Microbial Communities of Leaves and Roots Associated with Turtle Grass (Thalassia testudinum) and Manatee Grass (Syringodium filliforme) are Distinct from Seawater and Sediment Communities, but Are Similar between Species and Sampling Sites. Microorganisms 2019, 7, 4. [Google Scholar] [CrossRef] [Green Version]
  23. Kobayashi, T.; Ralph, T.J.; Sharma, P.; Mitrovic, S.M. Influence of historical inundation frequency on soil microbes (Cyanobacteria, Proteobacteria, Actinobacteria) in semi-arid floodplain wetlands. Mar. Freshw. Res. 2020, 71, 617–625. [Google Scholar] [CrossRef]
  24. Goldfarb, K.C.; Karaoz, U.; Hanson, C.A.; Santee, C.A.; Bradford, M.A.; Treseder, K.K.; Wallenstein, M.D.; Brodie, E.L. Differential growth responses of soil bacterial taxa to carbon substrates of varying chemical recalcitrance. Front. Microbiol. 2011, 2, 94. [Google Scholar] [CrossRef] [PubMed] [Green Version]
  25. Mujakic, I.; Piwosz, K.; Koblizek, M. Phylum Gemmatimonadota and Its Role in the Environment. Microorganisms 2022, 10, 151. [Google Scholar] [CrossRef] [PubMed]
  26. Liu, X.; Wang, Y.Z.; Liu, Y.H.; Chen, H.; Hu, Y.L. Response of Bacterial and Fungal Soil Communities to Chinese Fir (Cunninghamia lanceolate) Long-Term Monoculture Plantations. Front. Microbiol. 2020, 11, 181. [Google Scholar] [CrossRef]
Figure 1. Soil physicochemical parameters. (a) Electrical conductivity (EC); (b) pH; (c) total organic carbon (TOC). One asterisk (*) represents significant difference (p < 0.05) and two asterisks (**) represent highly significant difference (p < 0.01) between treatments. JSS: the bulk soil sample; XRS: soil of the P. sibiricum rhizosphere.
Diversity 14 00965 g001
Figure 2. Microbial community structure of different groups. Different colors means different phylum or genus. And different community structure of JSS and XRS were shown above. Bacterial community composition at the phylum (a) and genus level (c); fungal community composition at the phylum (b) and genus level (d). JSS: the bulk soil sample; XRS: soil of the P. sibiricum rhizosphere.
Diversity 14 00965 g002
Figure 3. Alpha diversity Index of bacteria among different groups. (a) ACE; (b) Chao1; (c) Shannon; (d) Simpson. One dot represents significant difference (p < 0.05) and two dots represent highly significant difference (p < 0.01) between treatments. JSS: the bulk soil sample; XRS: soil of the P. sibiricum rhizosphere.
Diversity 14 00965 g003
Figure 4. Alpha diversity index of fungi among different groups. (a) ACE; (b) Chao1; (c) Shannon; (d) Simpson. One dot represents significant difference (p < 0.05) and two dots represent highly significant difference (p < 0.01) between treatments. JSS: the bulk soil sample; XRS: soil of the P. sibiricum rhizosphere.
Diversity 14 00965 g004
Figure 5. PERMANOVA analysis between different groups. (a) The permanova analysis of bacteria; (b) the permanova analysis of fungi. JSS: the bulk soil sample; XRS: soil of the P. sibiricum rhizosphere.
Diversity 14 00965 g005
Figure 6. Venn diagrams depicting the number of shared and unique (a) bacterial and (b) fungal ASVs among treatments. 124 common ASVs were identified at bacterial; 1217 common ASVs were identified at fungal. Each circle represents sampled compartments. JSS: the bulk soil sample; XRS: soil of the P. sibiricum rhizosphere.
Diversity 14 00965 g006
Figure 7. PCoA analysis from different groups, (a) bacterial community composition; (b) fungal community composition. Different colors represent different treatments. JSS: the bulk soil sample; XRS: soil of the P. sibiricum rhizosphere.
Diversity 14 00965 g007
Figure 8. Correlation between soil bacterial species and soil physicochemical properties. The relationship between the soil physicochemical properties and bacterial (a) and fungal (b) genera. The color changes represent the degree of correlation, which reflects the degree of adaptation of species groups to the rhizosphere and non-rhizosphere soil. Different colors mean different correlation. JSS: the bulk soil sample; XRS: soil of the P. sibiricum rhizosphere. *, ** and *** represent a statistical significance at p ≤ 0.05, p ≤ 0.01, and p ≤ 0.001, respectively.
Diversity 14 00965 g008
Figure 9. High relative abundance in COG functional annotation. Different colors mean different groups. Different functional parts were shown in the figure. JSS: the bulk soil sample; XRS: soil of the P. sibiricum rhizosphere.
Diversity 14 00965 g009
Publisher’s Note: MDPI stays neutral with regard to jurisdictional claims in published maps and institutional affiliations.