Abstract
The Wuyi Mountains in China are one of the largest and most complete subtropical forest ecosystems at the same latitude in the world. However, our limited understanding of the function of this distinctive ecosystem means that the interrelationship between species diversity and ecosystem functioning needs to be investigated if evergreen broadleaf forests (EBLFs) are to be protected. Here, we calculated species richness, the Shannon–Wiener index, and the Pielou index in large-, medium-, and small-scale (20 m × 20 m, 10 m × 10 m, and 5 m × 5 m) forest dynamics plots (FDPs). We also investigated the interrelationships between species diversity and aboveground biomass (AGB)/productivity in FDPs at the different scales using the generalized linear regression model. The results showed that species diversity and AGB positively interrelated with each other, whereas there was no species diversity-productivity interrelationship in the subtropical BLF on the Wuyi Mountains. The structural equation model (SEM) showed that elevation was a key factor directly affecting AGB. These findings lead to the conclusion that productivity is not solely correlated with species diversity and that abiotic factors probably mediate the positive interrelationship between species diversity and ecosystem functioning. This study provides theoretical basis that can be used to protect EBLFs in subtropical areas and the results can be used to improve the construction of artificial forest communities and vegetation restoration at the same latitude.
1. Introduction
The unreasonable development and utilization of terrestrial resources have caused serious ecological problems, such as soil erosion, greenhouse effects, and global warming, which have adversely affected the stable development of the global ecosystem [1]. Ecosystem functioning and biodiversity are two basic attributes of an ecosystem and the relationship between them has always been a key topic in ecology [2]. As the most important resource pool for terrestrial biodiversity and the largest terrestrial ecosystem on earth, forests are vital regulators of the global carbon cycle and climate mitigation [3,4]. Therefore, determining how forest ecosystem functioning relates to species diversity is key to understanding the mechanisms behind biodiversity maintenance and carbon cycling. The evergreen broadleaf forests (EBLFs) on the Wuyi Mountains are rich in biological resources and are of considerable significance to biodiversity conservation in southeastern China [5]. Therefore, it is important to understand the regulation mechanism underlying aboveground biomass (AGB)/productivity because it supports the scientific and rational protection and utilization of plant resources on the Wuyi Mountains.
Species diversity, as a measurable indicator of community, reflects the basic characteristics of ecosystems and is the result of competition or coordinated coexistence among various species [6]. Species diversity provides the material basis and supporting conditions for the operation and maintenance of ecosystem functioning [6,7]. The AGB within a forest community is representative of the total organic matter accumulated by the community over a certain period of time and it reflects the stability of ecosystem structure and functioning [8]. Understanding and exploring how species diversity and AGB interrelate with each other allows researchers to elucidate how ecosystem functioning is leveraged by species diversity. The quality of the AGB is affected by the traits of the community itself (species composition, assembly, and species richness, etc.) and by the living environment factors (temperature, humidity, topography, landform, and soil, etc.) on which the community depends [9,10]. Biological productivity refers to the material production capacity of organisms and their populations, including ecosystems and biospheres [11]. It changes with the environment and, thus, becomes an indicator of environmental change and the health of the global ecosystem [12,13]. Species diversity was the most commonly used indicator of biodiversity in early research on the interrelationship between biodiversity and productivity [14,15,16]. Species diversity is an indispensable evaluator of ecosystem structure [2]. If species changes alter ecosystem productivity in a certain area under natural conditions, then the system is healthy. If they do not, then the system is in chaos [6]. Therefore, specifying how species diversity relates to productivity in the community is of great significance when attempting to elaborate the role of species diversity in ecosystem functioning.
Previous control experiments, meta-analyses, observational studies, and studies on the mechanisms underlying the interrelationships among species diversity and productivity showed that such relationships are mainly manifested as unimodal, positive, negative, unrelated, or “U”-shaped relationships [17,18,19]. However, there is no consensus among many researchers on the basic mechanism underlying the relationships [18,20,21]. Furthermore, the relationships between species diversity and productivity and their intrinsic mechanisms are highly dependent on scale [22]. In recent years, widespread attention has been paid to the “hump” relationship, positive correlations, and no correlations between biodiversity and productivity [19]. The basis for explaining the “hump” model is mainly the competitive exclusion hypothesis [23]. The competitive exclusion hypothesis states that when productivity is low, productivity increases with species richness because resource scarcity and stress lead to lower numbers of individual species [11,24]. However, when productivity is high, species richness is correspondingly reduced due to competitive exclusion. Putative results based on the biomass ratio suggest that the abundance and traits of the most dominant species affect biomass [23,25,26]. In a community, the direct regulation of primary production is proportional to input and largely depends on the functional diversity of the dominant plants while the species richness of associated species does not play a decisive role [27]. However, associated species have transition effects and may play a foundational role.
The EBLF on the Wuyi Mountains is a natural forest with multiple species and individual combinations of differently aged plants. It has the characteristics of mixed forest and unevenly aged forest [5]. In this study, how the diversity index relates to the forest AGB and productivity were analysed using a linear model to find a theory that could explain the relationship between ecosystem function and species diversity in the EBLF on the Wuyi Mountains. Generalized linear models (GLMs) were used to test whether species diversity relates to productivity and to compare whether the same relationship existed at different scales.
To date, there have been few studies on how species diversity interferes with AGB and productivity in subtropical EBLFs across China. We established a 9.6 ha forest dynamics plot (FDP) on the Wuyi Mountains. This plot was then divided into plots that were 5 m × 5 m, 10 m × 10 m, or 20 m × 20 m in size to represent different scales. Statistical analyses were undertaken to investigate how species diversity relates to productivity and AGB. The following issues were addressed: (1) how species diversity relates to the productivity and AGB in the subtropical EBLF on the Wuyi Mountains; (2) whether there was a scale effect that affects these relationships; and (3) how biotic and abiotic factors affect species diversity and ecosystem functioning. The results from this study will improve understanding about the main factors affecting the AGB and productivity of the subtropical EBLF on the Wuyi Mountains and provide information that can be used to determine how we should approach the relationship between natural forest species diversity and ecosystem functioning.
2. Materials and Methods
2.1. Study Site
The Wuyi Mountains have been listed as an internationally designated biosphere reserve and a World Heritage Site with cultural, natural, and biodiversity value. The study site consisted of a 9.6 ha FDP, which was a subtropical EBLF on the Wuyi Mountains, in Fujian Province on the south-east coast of China (27°35’24.23” N and 117°45’54.53” E, elevation: 454–577 m) (Figure S1) [5]. At this site, the annual average temperature is 17.0–18.4 °C, with an average of 19.2 °C in July (the hottest month) and 10.5 °C in January (the coldest month). Additionally, the average annual rainfall and the annual sunshine hours are 1800 mm and 1910.2 h, respectively [5]. An FDP offers a platform for observing biodiversity in subtropical EBLFs in China. The FDP used in this study was established in the summer of 2013 and a census was conducted in 2018.
2.2. Community Survey and Species Diversity Measuring
In 2013, according to the field protocol used by the Centre for Tropical Forest Science (CTFS), the whole FDP was divided into 240 quadrats (20 m × 20 m), which were then divided into 16 small quadrats (5 m × 5 m). All trees and shrubs with a diameter at breast height (DBH, 1.3 m above ground) ≥ 1 cm in each quadrat were identified to the species level, measured, and mapped. Four topographic variables, namely, mean elevation, slope, aspect, and convexity, were quantified for each 20 m × 20 m quadrat based on the elevation data using the algorithm adopted by the CTFS [28,29]. A re-census was performed in 2018.
Based on the re-census data in 2018, four species diversity indexes [Species richness, the Shannon–Wiener (S-W) index, S-W diversity, and the Pielou index) were calculated using the “vegan” package [30] as follows [6]:
Species richness:
where S is the species richness in plots of different scales, and n is the number of tree species with a diameter at breast height ≥ 1 cm.
Shannon–Wiener index:
where pi is the relative abundance of species i, pi = Ni/N0, Ni is the abundance of the i species, and N0 is the sum of the abundances of all species.
Shannon–Wiener diversity:
where H is the Shannon–Wiener index of quarters, H’ is the Shannon–Wiener diversity.
Pielou index:
where H is the Shannon–Wiener index, S is the tree richness.
2.3. Measuring Above-Ground Biomass and Productivity
The tree height and under-branch height were obtained by visual observation and the two independent surveys were far apart in terms of time. This meant that the tree heights measured by the two measurements were quite different, and there might be a large error in the AGB estimation. Therefore, this study only used allometric equations based on DBH to calculate the AGB per tree and shrub. The allometric equations are based on 701 woody species determined within 24 large-scale FDPs (Forest Global Earth Observatory, ForestGEO) and are used to estimate the AGB of species in different tropical ecosystems, especially subtropical EBLFs [31]. Each equation is given a weight, which is based on sample-size, climate, and taxonomy [31]. In this study, the relative change in AGB in each quadrat was used to express the productivity of the community [15]. The calculation method is as follows:
where P is the productivity of the quadrat, Biomass2014 is the sum of the AGBs in plots with different scales in 2013, Biomass2018 is the sum of the AGBs in plots with different scales in 2018, and t is time interval between 2013 and 2018.
2.4. Data Analysis
A GLM with gamma errors and a log/inverse link function was adopted to show how species diversity relates to AGB at different scales. We chose a model with a smaller AIC value. The optimal equation between the diversity index and AGB/productivity at the same scale was determined using the AIC value. A smaller AIC value represents a better corresponding model. The optimal equation between species diversity and AGB/productivity at the same scale was determined using the p value, which was used to measure whether the model was significant. If the p-value was <0.05, then the model was significant.
We also investigated the causal relationships among species diversity, topographic factors, AGB, and productivity at the 20 m × 20 m scale using a structural equation model (SEM). First, we built a meta-model based on various assumptions and the theoretical relationships among species diversity, topographic factors, AGB, and productivity using the piecewiseSEM package (version: 2.2; Figure S2) [32]. Secondly, d-separation was used to test the fit of the model and Fisher’s C > 0.05 indicated a good fit. All the data analyses were undertaken using R version 4.1.1.
3. Results
3.1. Relationships between Species Diversity and Biomass/Productivity
Table 1 illustrates that at each scale, the GLM with gamma errors and log link function fitting between the three species diversity indexes and AGB had low AIC values for the three species diversity indexes and AGB.

Table 1.
Optimal model assessment between species diversity and ABG at the different scales. Bold font indicates that the model fitted a linear regression.
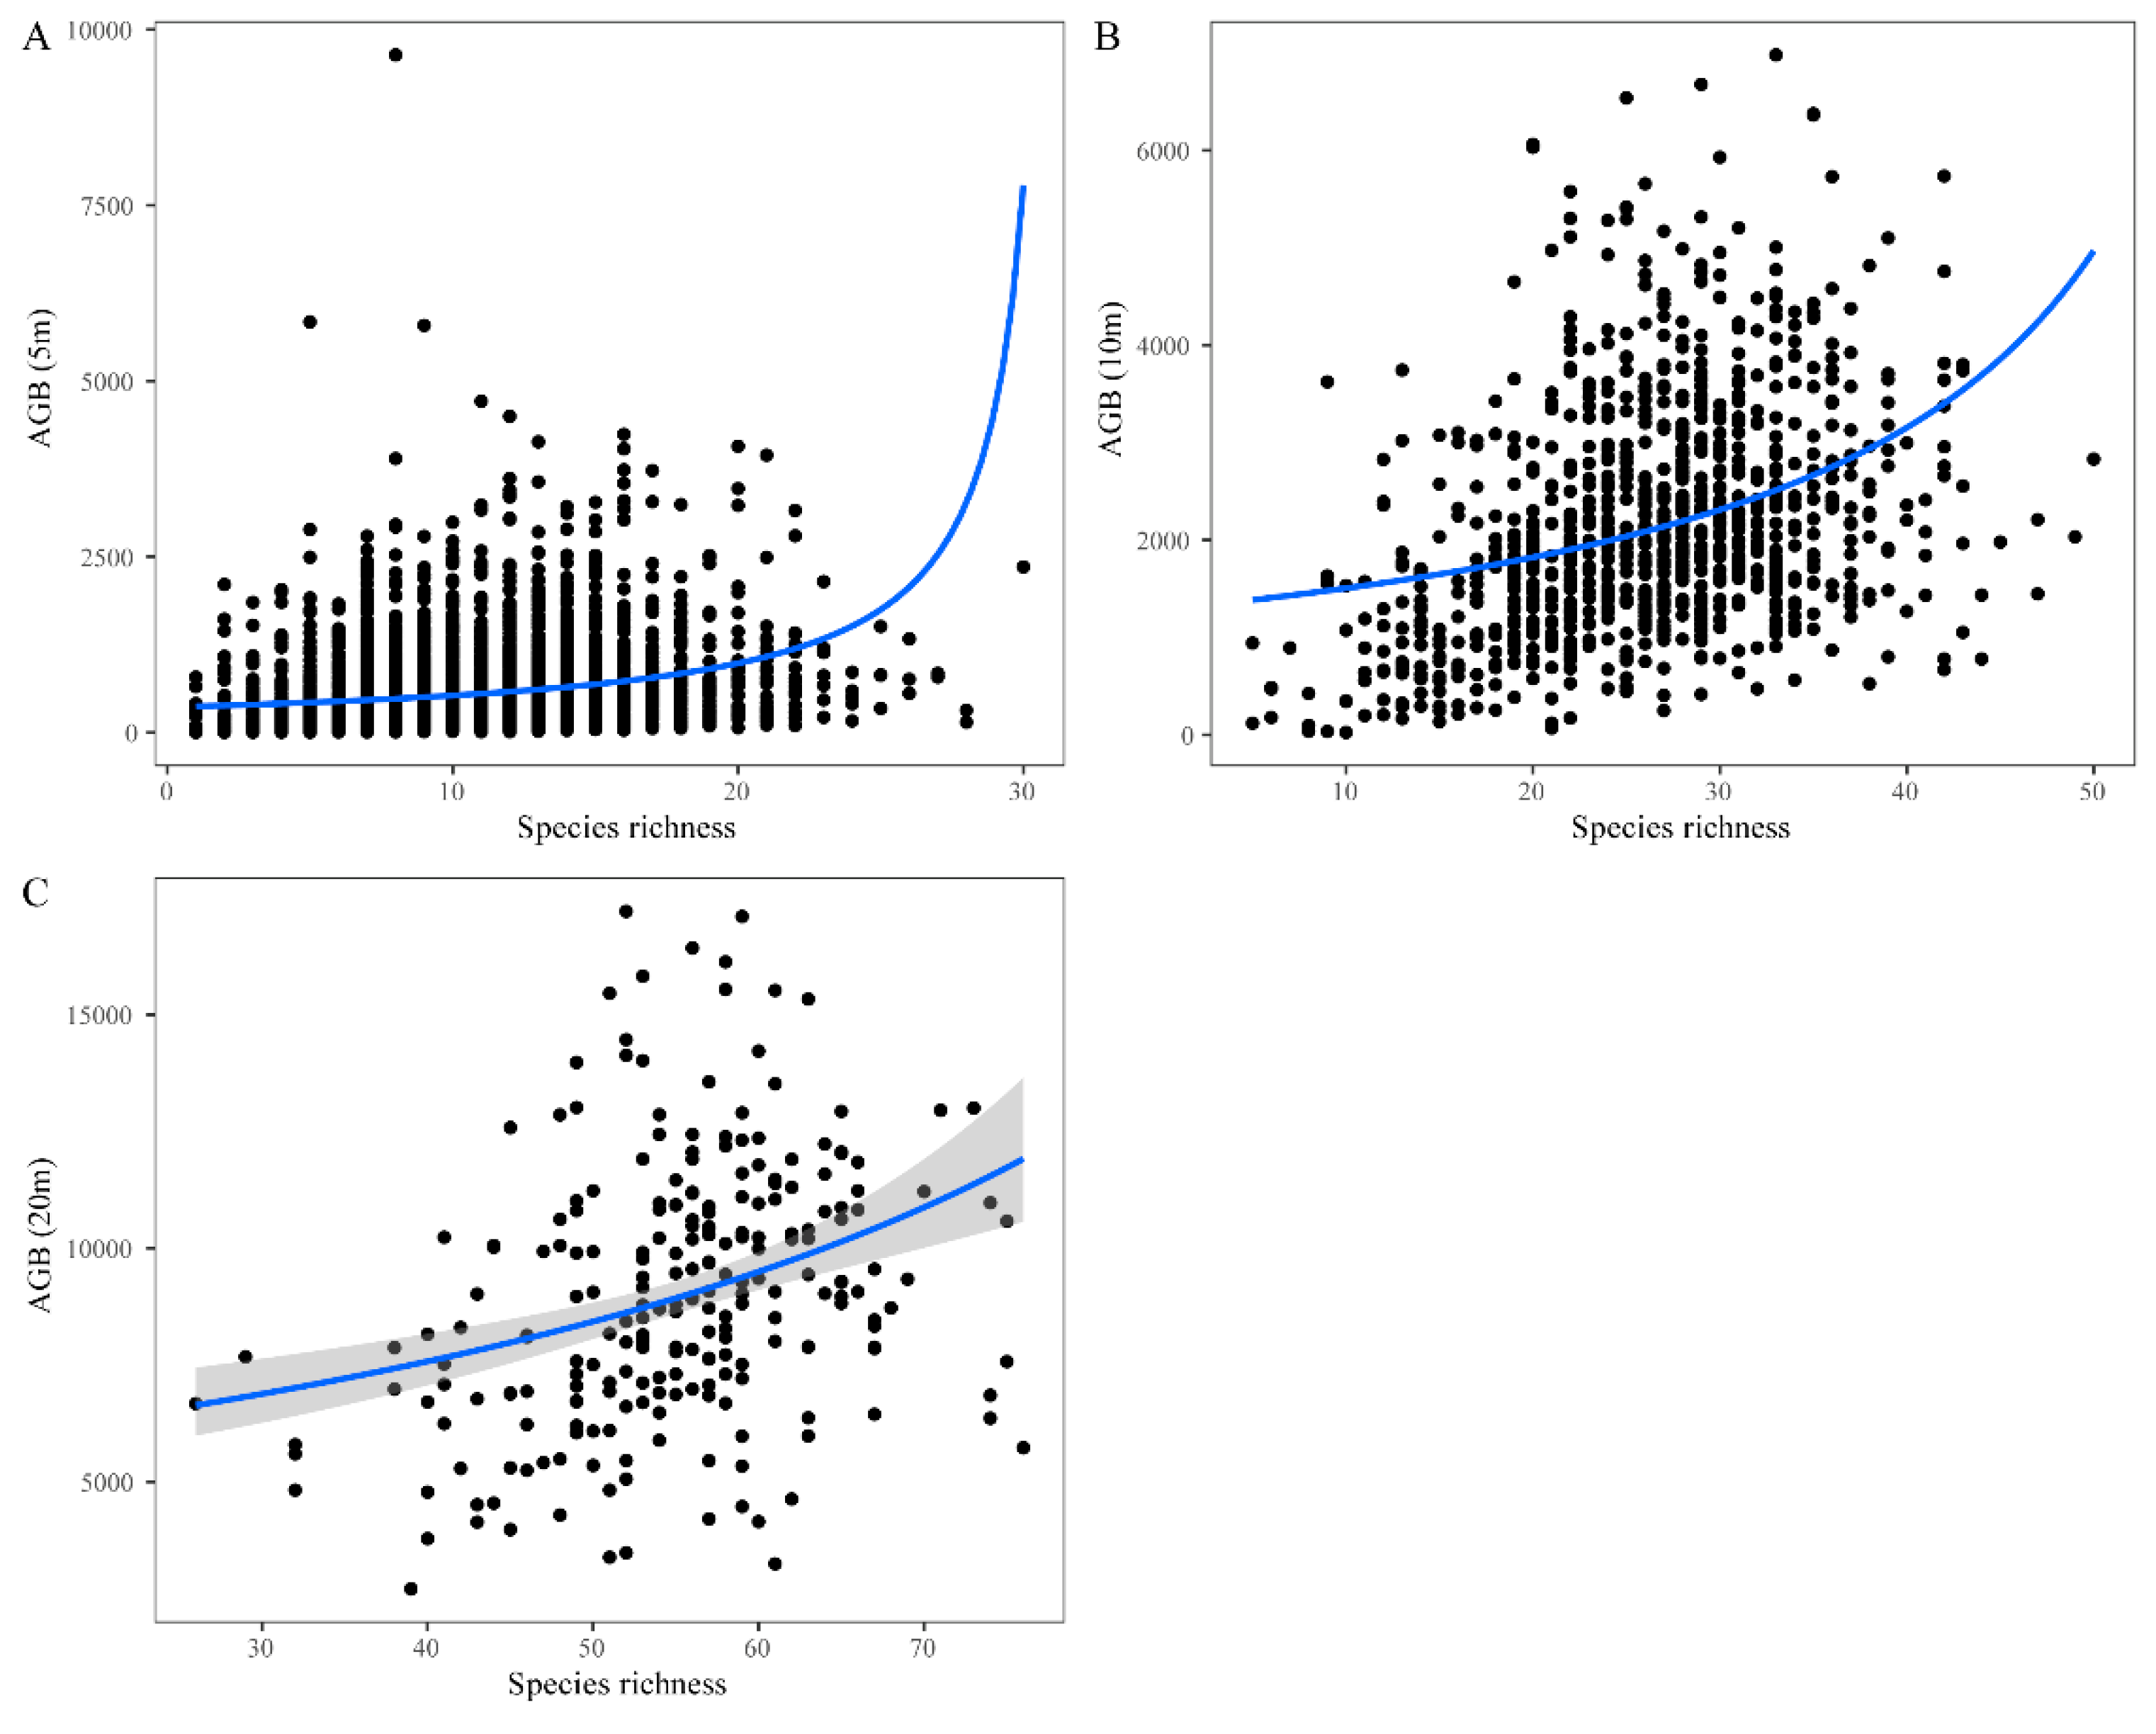
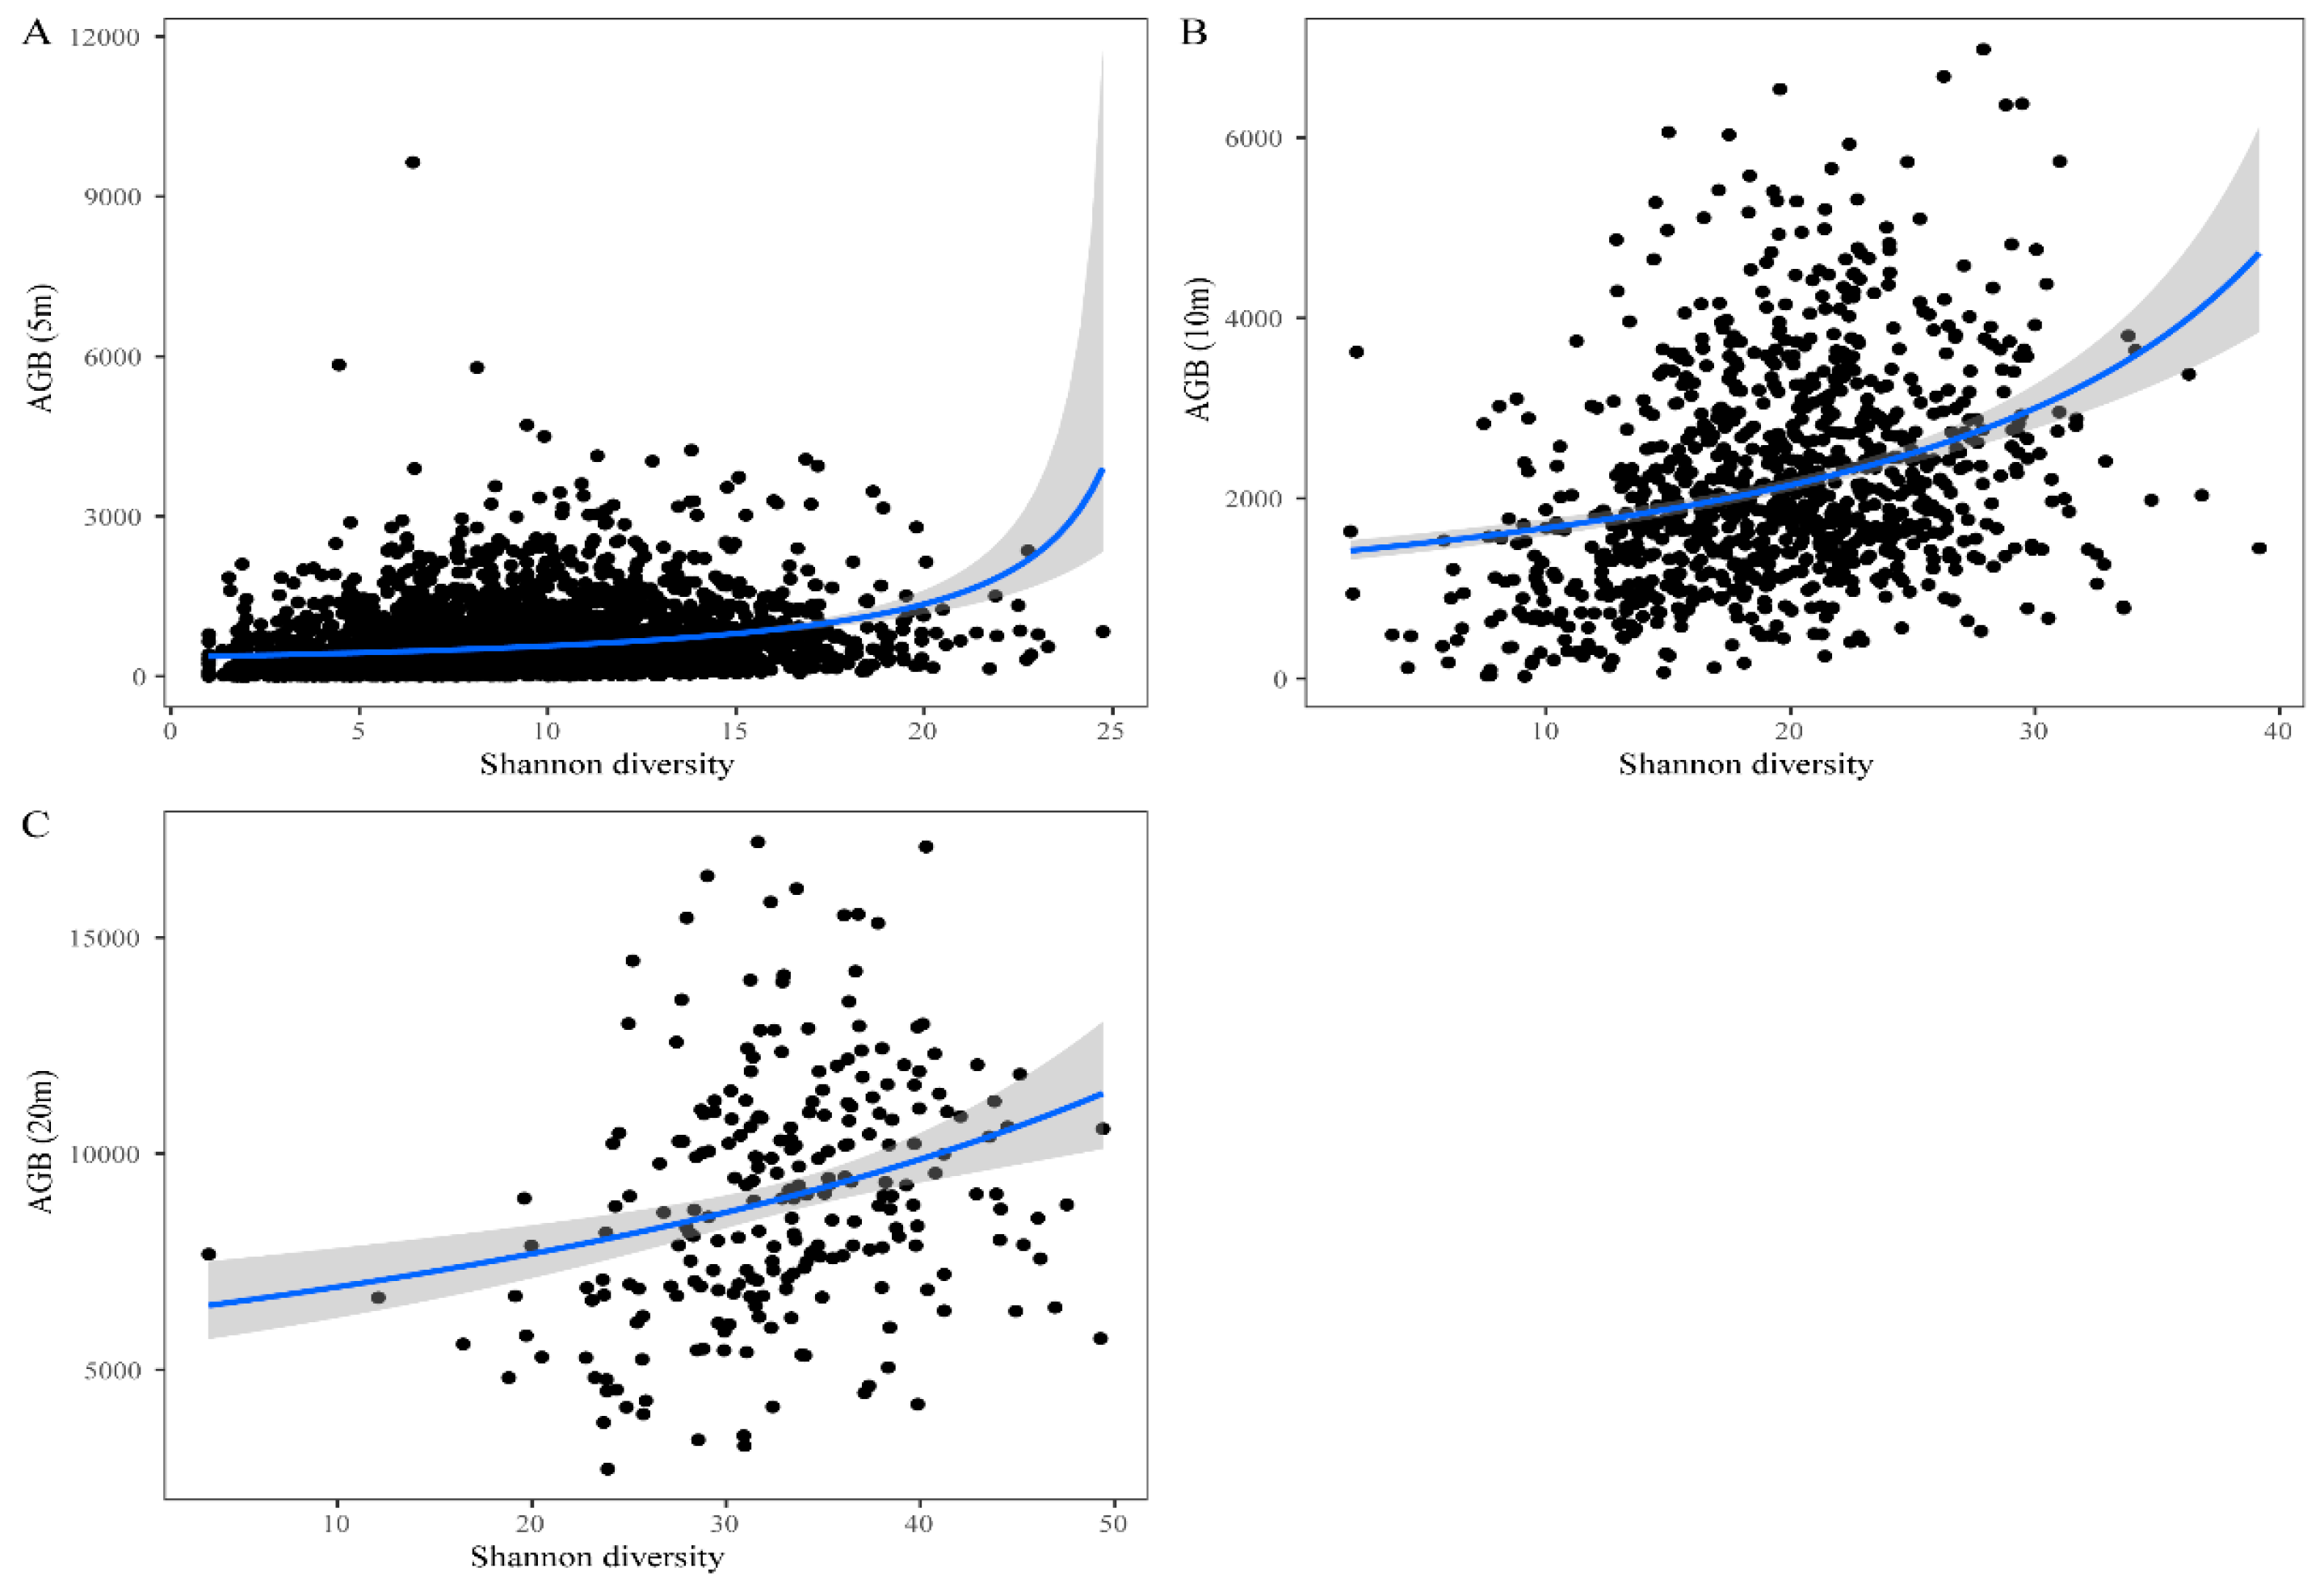
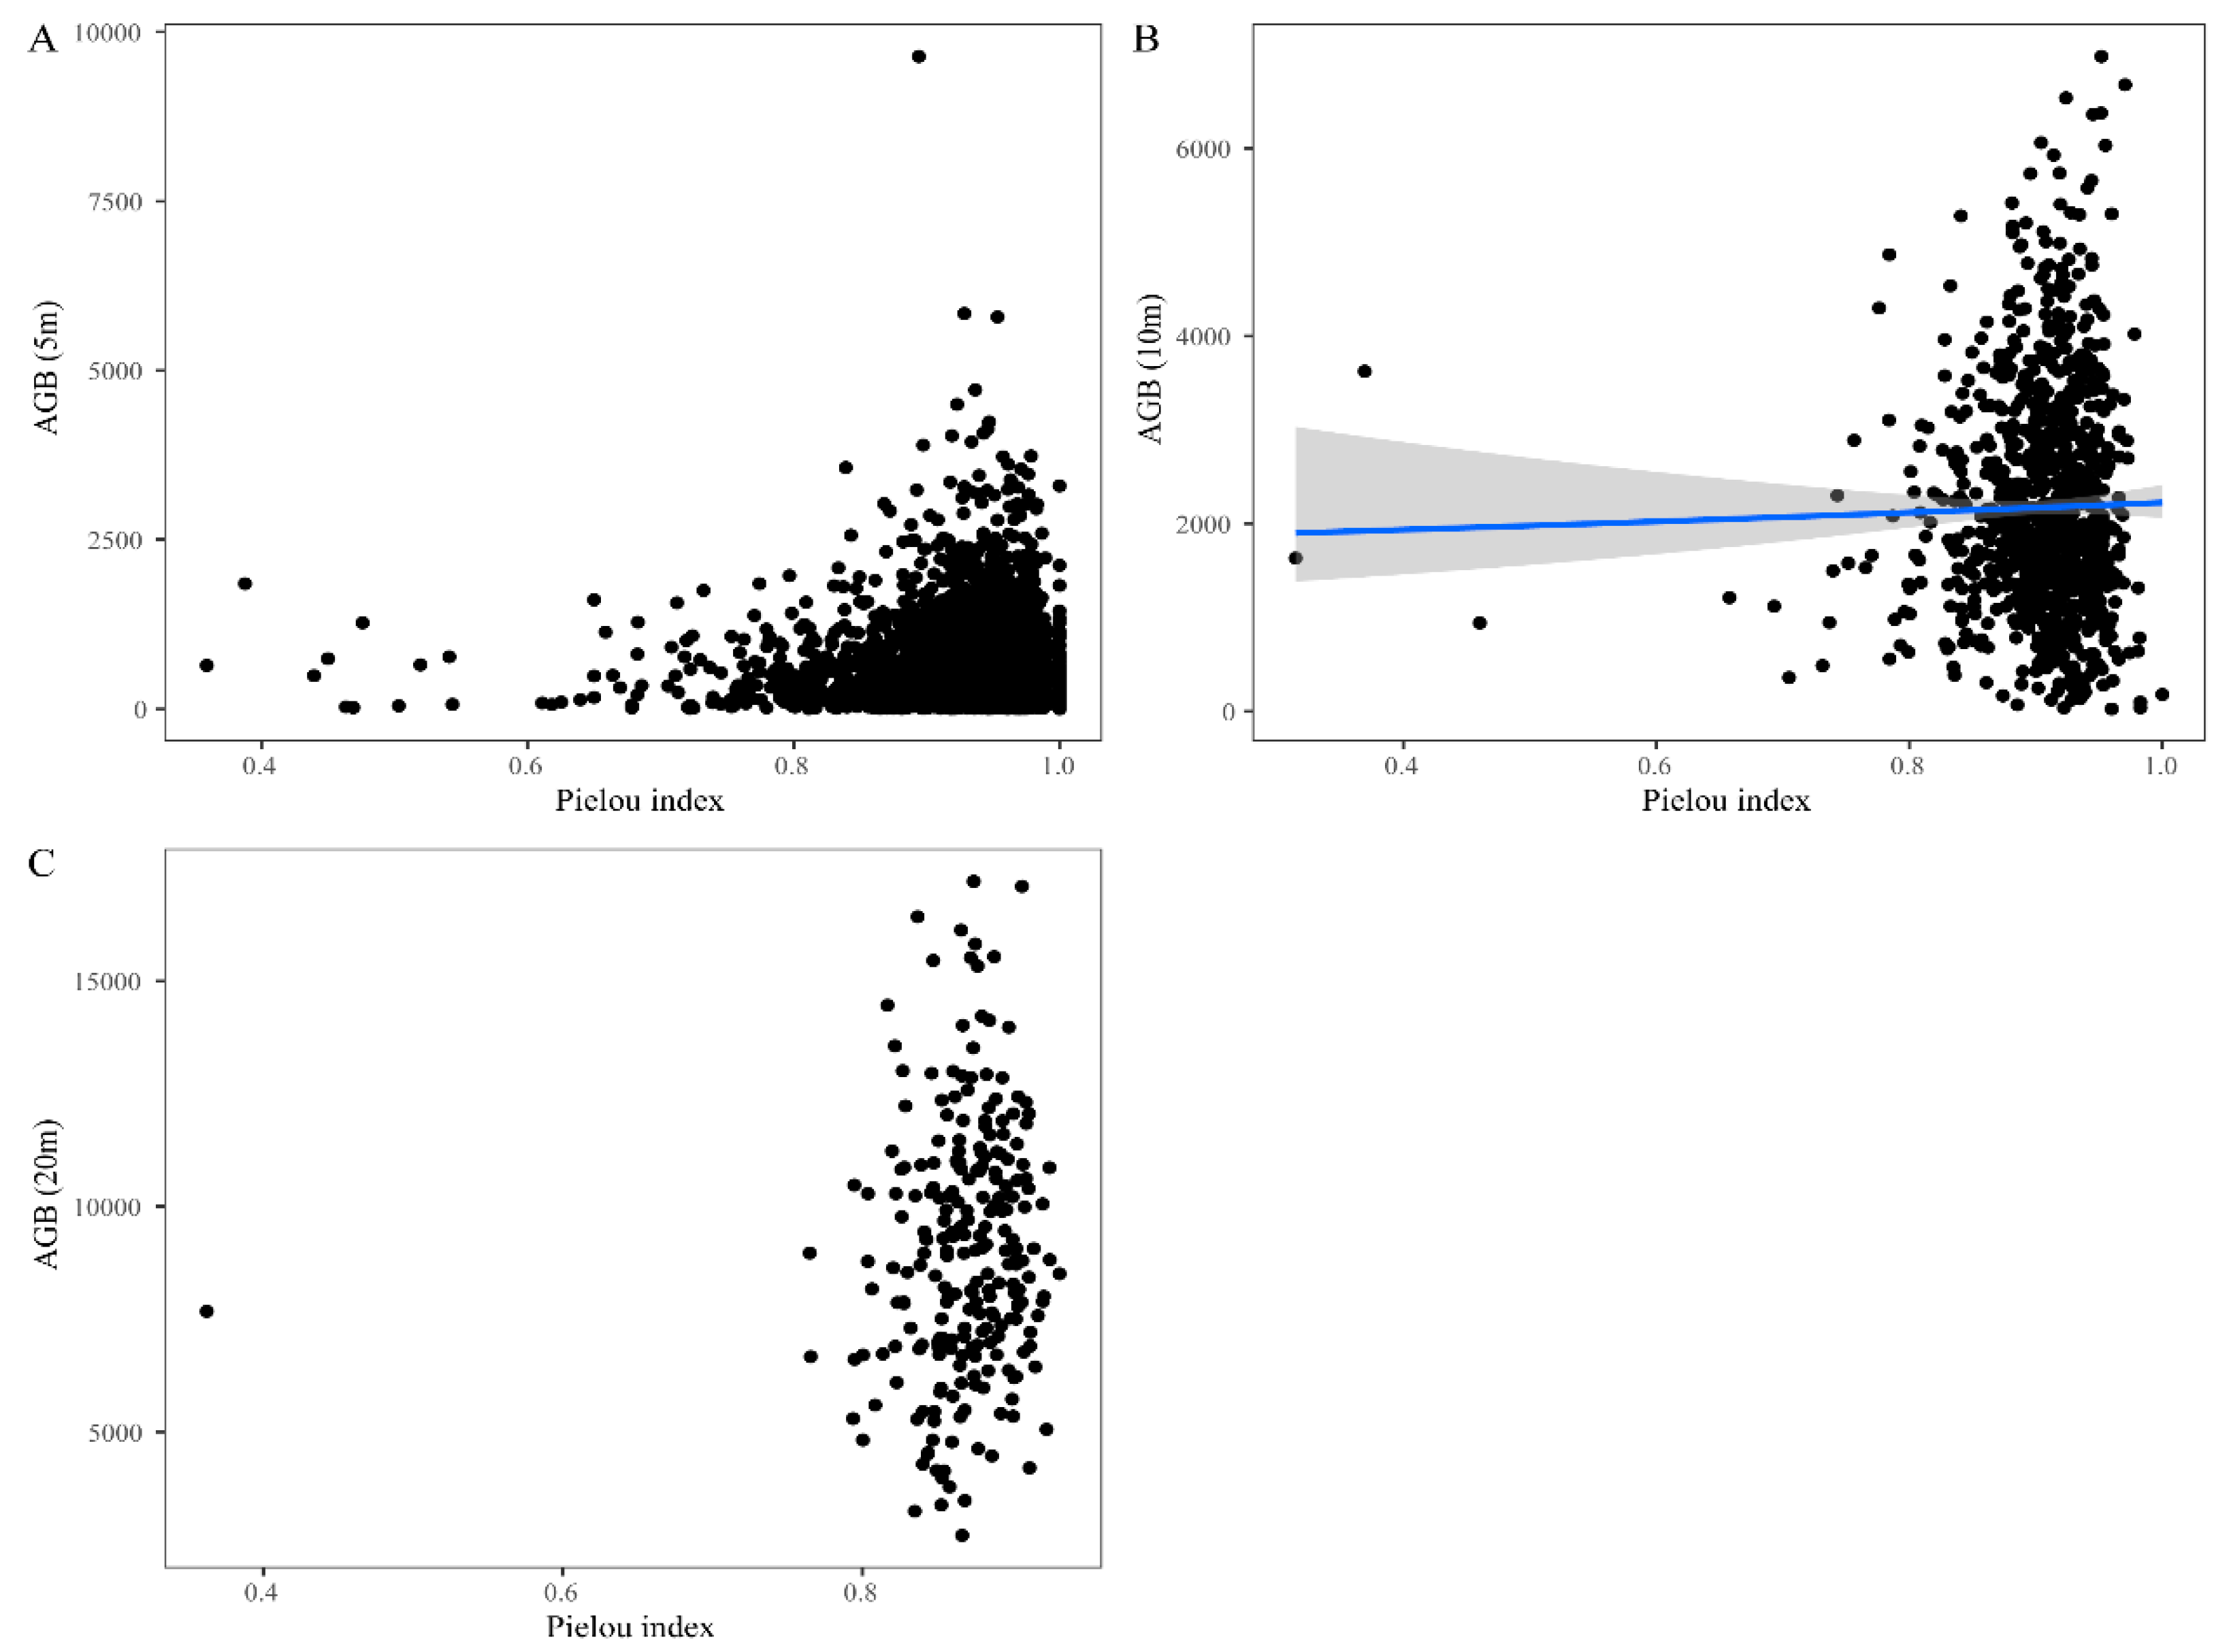
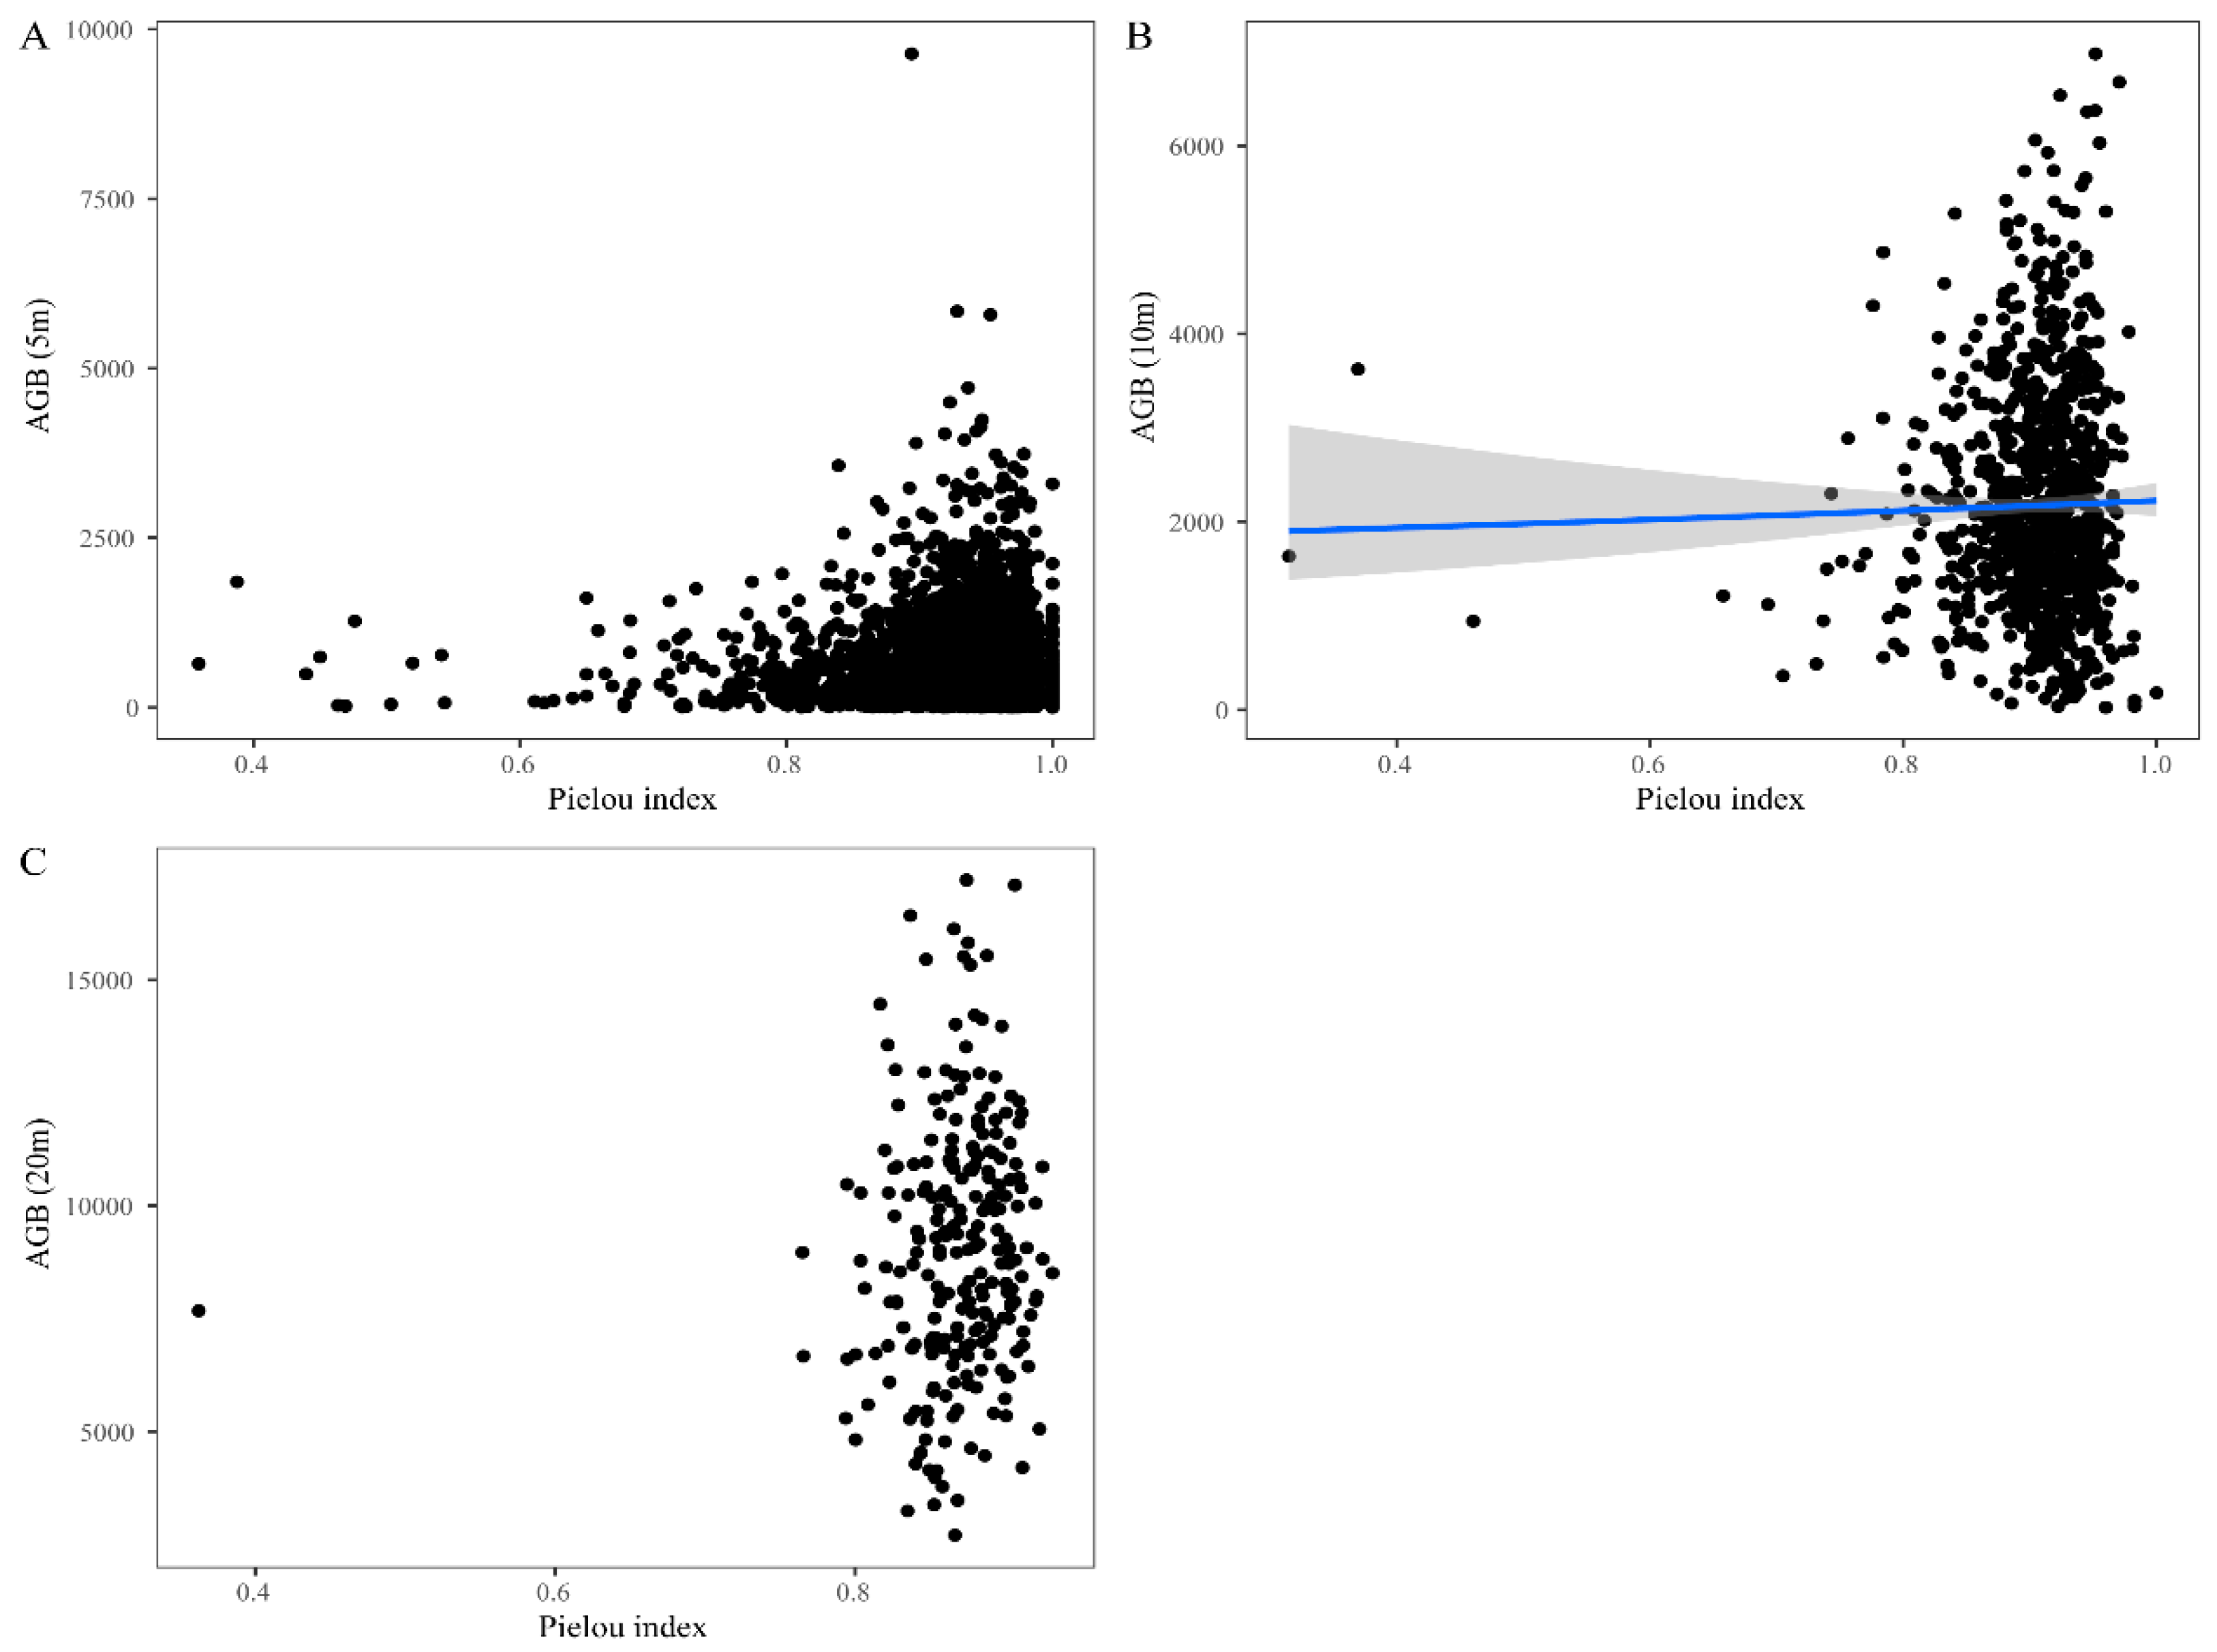
Species richness at the three scales was calculated separately. The small scale (5 m × 5 m) species richness values ranged from 1–30, the medium scale (10 m × 10 m) species richness values ranged from 5 to 50, and the large scale (20 m × 20 m) species richness values ranged from 26 to 76. There was a positive association between AGB and richness (Table 1; Figure 1). Shannon diversity at the three scales was calculated separately. Shannon diversity was 1–24.74 at the small scale, 1.99–39.16 at the medium scale, and 3.39–49.39 at the large scale. We found a positive relationship between AGB and S-M diversity (Table 1; Figure 2), but there was no relationship between AGB and the Pielou index at the small and large scales (Figure 3a,b). The Pielou index was 0.36–0.9 at the small scale, 0.31–0.98 at the medium scale, and 0.36–0.93 at the large scale.
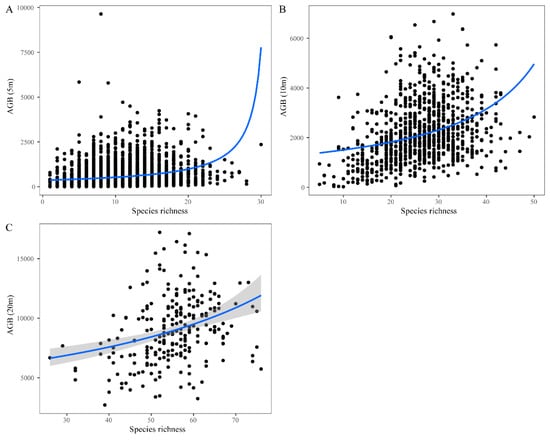
Figure 1.
Interrelationships between species richness and AGB at the 5 m × 5 m (A), 10 m × 10 m (B), and 20 m × 20 m (C) scales.
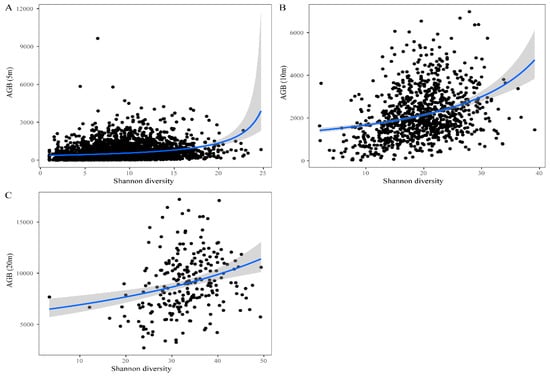
Figure 2.
Interrelationships between Shannon diversity and AGB at the 5 m × 5 m (A), 10 m × 10 m (B), and 20 m × 20 m scales (C).
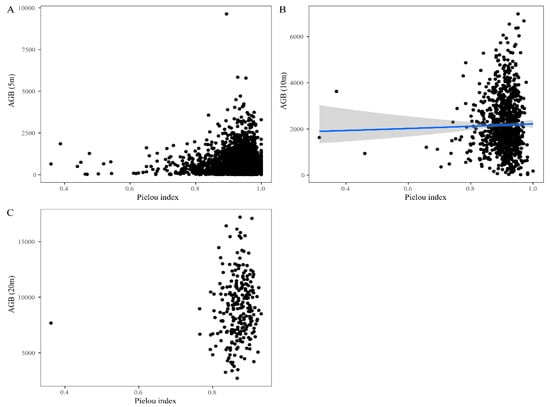
Figure 3.
Relationships between the Pielou index and AGB at the 5 m × 5 m (A), 10 m × 10 m (B), and 20 m × 20 m scales (C).
Table 2 shows that there were no interrelationships between species diversity and productivity at the different scales (p > 0.05) (Table 2; Figures S3–S5).

Table 2.
Optimal model assessment between species diversity and productivity at the different scales. p values for a Poisson distribution with log link indicate whether the model is significant. Bold font indicates that the model fits a linear regression.
3.2. Key Factors Affecting Above-Ground Biomass and Productivity
The SEM model (Figure 4) shows that there were variations of 2% and 24% in productivity and AGB, respectively. It also indicates that elevation positively affected AGB and productivity in direct and indirect manners, respectively, but negatively influenced the number of individuals in a quadrat. Species richness positively affected AGB and productivity in an indirect way, whereas slope and aspect had no effect on species diversity, AGB, or productivity (Figure 4). The Fisher C value for the whole model was 15.13, indicating that the model was a good fit (p = 0.37).
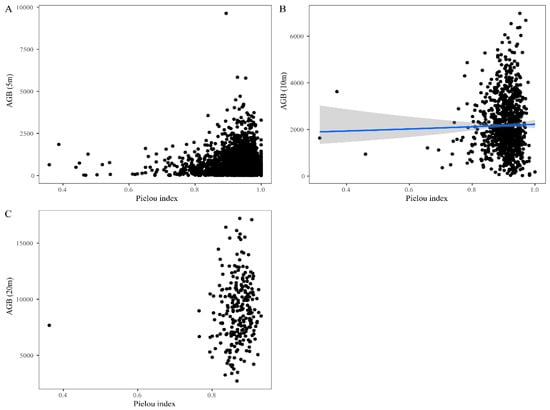
Figure 4.
Structural equation model depicting the impact of topographic factors and species diversity on productivity and AGB. Solid and dotted lines represent significant and non-significant relationships, respectively. PRO, productivity; BIO, AGB; SR, species richness; IND, number of individuals in the 20 m × 20 m quadrats; ELE, elevation; CON, convexity; SLO, slope; and ASP, aspect.
4. Discussion
The FDP area in the Wuyi Mountains is divided into natural forests with multiple species and different aged plants. It has the characteristics of mixed forests and unevenly aged forests. The results of the re-census of the 9.6 ha FDP on the Wuyi Mountains in 2018 were used to determine how species diversity was related to AGB/productivity after statistically analysing 127 woody plants with DBH ≥ 1 cm out of 71,565 plants (including 3196 plants after the re-census) in the plots. This analysis showed that the relationships between species diversity and ecosystem functioning were consistent, but the response of AGB/productivity to species diversity differed at the different scales. The interrelation between AGB and species diversity can be explained by the niche complementarity hypothesis, whereas the interrelation between productivity and species diversity is more strongly related to sampling effects, which indicates that the two mechanisms are not mutually exclusive but mutually reinforcing. This shows that productivity and AGB are closely related but different and that different indicators of ecosystem function might be required to obtain the different relationships between biodiversity and ecosystem functioning. The patterns and potential mechanisms underlying how the ecosystem affects species diversity are discussed below.
4.1. Positive Relationships Found between Species Diversity and Biomass/Productivity
When other environmental factors were not considered, there were significant positive relationships among species richness, Shannon species diversity, and AGB at the different scales (Figure 1 and Figure 2). This result indicated that AGB gradually increased with species richness and Shannon diversity in the EBLF. At a certain scale, DBH and the tree height of the species have impacts on the ABG [33]. Biomass accumulation gradually rises as the basal area of the tree species and the tree height increase, resulting in an increase in tree biomass [34]. However, an incremental rise in the proportion of individuals in a community increases biodiversity, which also contributes to an increase in biomass [34,35]. More species make greater use of available niche opportunities in the environment, leading to increased resource utilization [36]. In recent years, many studies on plant diversity have also shown that the biomass of the community relies on the richness of the community to a great extent, which might be dominated by the niche complementarity hypothesis [37,38,39]. Therefore, in order to maintain high growth, it is necessary to protect species richness in the Wuyi Mountains.
There was a positive association between the Pielou index and AGB at the medium scale (10 m × 10 m) (Figure 3b). However, at the small (5 m × 5 m) and large scales (20 m × 20 m) (Figure 3a,c), there was no correlation between the Pielou index and AGB. This shows that species had scale-dependent effects on AGB. In the divided quadrats, there are more trees with higher DBHs, such as Castanopsis carlesii, Castanopsis eyrei, and Engelhardtia fenzlii, and the AGB was much higher than that in the quadrats that contained larger numbers of smaller DBH tree species [5]. The AGB amount at small scales in areas affected by natural disasters, such as landslides, is significantly smaller than that at a large scale. As the sample area gradually increases, the influence of these interference factors gradually decreases and a positive correlation between the Pielou index and AGB begins to appear [9]. At a large scale, quadrats may contain highly productive species that are major contributors to ecosystem functioning [40]. Sampling effects dominate the community assembly, resulting in no relationship between the Pielou index and AGB [41,42]. Therefore, when studying species diversity patterns, sampling area is a factor that must be considered.
Interestingly, associations between species diversity and productivity were not detectable at the different scales (Figures S3–S5). There are potentially two reasons for these results. [1] The productivity in the community is mainly determined by the species dominating the community and has little to do with the distribution of plants [43,44] and [2] productivity is also affected by some abiotic factors and the differences in habitat and plant composition have a more obvious effect on productivity [43,44].
4.2. Influences of Environmental Factors on Species Diversity and Ecosystem Functioning
Productivity and AGB have different associations with species diversity. Therefore, it is important to explore the effects of biotic and abiotic factors on productivity and AGB. Elevation has a direct effect on AGB and indirectly exerts this effect through the number of individuals. One possible explanation is that the increase in elevation makes any species niche differences more obvious and space resources are better utilized, which increases AGB in the community [20]. The results also showed that neither biological factors nor topographic factors explained the productivity results. This appears to be the main reason for the lack of an observable interrelationship between productivity and species diversity. Complex topographic factors lead to differences in the availability of soil nutrients, light, water, and other resources between different habitats [40,43,44]. However, in our study, only the effect of topographic factors on AGB/productivity was explored.
5. Conclusions
This study found that the interrelationship between species diversity and AGB was positive, but species diversity and productivity were mismatched. No scale-independent effects were found in this study. Furthermore, biotic factors directly affected AGB and productivity while abiotic factors indirectly affected biomass and productivity by affecting the number of individuals. This study provides a theoretical basis for the protection and maintenance of species diversity in subtropical evergreen and deciduous BLFs.
Supplementary Materials
The following supporting information can be downloaded at: https://www.mdpi.com/article/10.3390/d14110952/s1, Figure S1: Contour map of the Wuyi Mountains Forest dynamics plot; Figure S2: Meta structural equation modelling depicting the influence of topography factors and species diversity on productivity and biomass. Solid line and dotted line represent significant and no significant relationships, respectively. PRO: productivity; BIO: Biomass; SR: species richness; IND: Number of individuals in 20m × 20m subplots; ELE: elevation; CON: convexity; SLO: slope; ASP: aspect; Figure S3: Relationships between species richness and productivity at different scales. (A) 5 m × 5 m; (B) (20 m × 20 m); (C) 40 m × 40 m; Figure S4: Relationships between Shannon diversity and productivity at different scales. (A) 5 m × 5 m; (B) (20 m × 20 m); (C) 40 m × 40 m; Figure S5: Relationships between Pielou index and productivity at different scales. (A) 5 m × 5 m (B) (20 m × 20 m); (C) 40 m × 40 m.
Author Contributions
Conceptualization, S.C.; methodology, L.X. and S.C.; software, L.X.; investigation, H.C., X.X., S.J., M.Z., Y.P., X.C., Y.D., L.C. and X.L.; data curation, W.Z.; writing—original draft preparation, L.X. and S.C.; writing—review and editing, H.D. and Y.F.; project administration, H.D. and Y.F.; funding acquisition, H.D. and Y.F. All authors have read and agreed to the published version of the manuscript.
Funding
This research was funded by “Special Foundation for National Science and Technology Basic Re-sources Investigation of China, grant number 2019FY202300”, “the Basic Scientific Research Funds Programs in the National Public Welfare Research Institutes of China, grant number GYZX200203, 210503” and “Major Biodiversity Conservation Project of the Ministry of Ecology and Environment, grant number ZDGC2019-007-04”.
Institutional Review Board Statement
Not applicable.
Data Availability Statement
https://figshare.com/articles/dataset/Relationships_between_ecosystem_functioning_and_species_diversity/19128167 (accessed on 7 February 2020).
Acknowledgments
We thank all reviewers who provided valuable comments for this paper. We are grateful to other teachers and classmates who participated in the second survey.
Conflicts of Interest
The authors declare no conflict of interest.
References
- Chen, G.K.; Wang, X.; Ma, K.P. Red list of China’s forest ecosystems: A conservation assessment and protected area gap analysis. Biol. Conserv. 2020, 248, 108636. [Google Scholar] [CrossRef]
- Huang, X.; Lang, X.; Li, S.; Liu, W.; Su, J. Indicator selection and driving factors of ecosystem multifunctionality: Research status and perspectives. Biodivers. Sci. 2021, 29, 1673. [Google Scholar] [CrossRef]
- Kurz, W.A.; Apps, M.J. Contribution of northern forests to the global C cycle: Canada as a case study. In Terrestrial Biospheric Carbon Fluxes Quantification of Sinks and Sources of CO2; Springer: Berlin/Heidelberg, Germany, 1993; pp. 163–176. [Google Scholar]
- Waring, R.H.; Running, S.W. Forest Ecosystems: Analysis at Multiple Scales; Elsevier: Amsterdam, The Netherlands, 2010. [Google Scholar]
- Ding, H.; Fang, Y.; Yang, Q.; Chen, X.; Yuan, F.; Xu, H.; He, L.; Yan, J.; Chen, T.; Yu, C.; et al. Community characteristics of a mid-subtropical evergreen broad-leaved forest plot in the Wuyi Mountains, Fujian Province, southeastern China. Biodivers. Sci. 2015, 23, 479–492. [Google Scholar] [CrossRef]
- Magurran, A.E. Ecological Diversity and Its Measurement; Princeton University Press: Princeton, NJ, USA, 1988. [Google Scholar]
- Jing, X.; Prager, C.M.; Classen, A.T.; Maestre, F.T.; He, J.; Sanders, N.J. Variation in the methods leads to variation in the interpretation of biodiversity-ecosystem multifunctionality relationships. J. Plant Ecol. 2020, 13, 431–441. [Google Scholar] [CrossRef]
- Zhang, G.; Wang, D.; Chai z Zhang, C.; Liu, W.; Zhang, S. Distribution Characteristics of Two Typical Natural Forest Spatial Structure Parameters in Xiaolongshan. For. Res. 2015, 28, 531. [Google Scholar]
- Ma, W.; He, J.S.; Yang, Y.; Wang, X.; Liang, C.; Anwar, M.; Zeng, H.; Fang, J.; Schmid, B. Environmental factors covary with plant diversity–productivity relationships among Chinese grassland sites. Glob. Ecol. Biogeogr. 2010, 19, 233–243. [Google Scholar] [CrossRef]
- Mokany, K.; Ash, J.; Roxburgh, S. Functional identity is more important than diversity in influencing ecosystem processes in a temperate native grassland. J. Ecol. 2008, 96, 884–893. [Google Scholar] [CrossRef]
- Tilman, D.; Lehman, C.L.; Thomson, K.T. Plant diversity and ecosystem productivity: Theoretical considerations. Proc. Natl. Acad. Sci. USA 1997, 94, 1857–1861. [Google Scholar] [CrossRef]
- Zhang, Q.; Zhang, D. Biodiversity and ecosystem functioning: Recent advances and controversies. Biodivers. Sci. 2002, 10, 49–60. [Google Scholar]
- Zhang, Q.; Zhang, D. Biodiversity and ecosystem functioning: Recent advances and trends. Biodivers. Sci. 2003, 11, 351–363. [Google Scholar]
- Luo, W.; Liang, J.; Cazzolla Gatti, R.; Zhao, X.; Zhang, C. Parameterization of biodiversity–productivity relationship and its scale dependency using georeferenced tree-level data. J. Ecol. 2019, 107, 1106–1119. [Google Scholar] [CrossRef]
- Lasky, J.R.; Uriarte, M.; Boukili, V.K.; Erickson, D.L.; John Kress, W.; Chazdon, R.L. The relationship between tree biodiversity and biomass dynamics changes with tropical forest succession. Ecol. Lett. 2014, 17, 1158–1167. [Google Scholar] [CrossRef] [PubMed]
- Zhang, Q.; Niu, J.; Buyantuyev, A.; Zhang, J.; Ding, Y.; Dong, J. Productivity–species richness relationship changes from unimodal to positive linear with increasing spatial scale in the Inner Mongolia steppe. Ecol. Res. 2011, 26, 649–658. [Google Scholar] [CrossRef]
- Waide, R.B.; Willig, M.R.; Steiner, C.F.; Mittelbach, G.; Gough, L.; Dodson, S.I.; Juday, G.P.; Parmenter, R. The relationship between productivity and species richness. Annu. Rev. Ecol. Syst. 1999, 30, 257–300. [Google Scholar] [CrossRef]
- Mittelbach, G.G.; Steiner, C.F.; Scheiner, S.M.; Gross, K.L.; Reynolds, H.L.; Waide, R.B.; Willig, M.R.; Dodson, S.I.; Gough, L. What is the observed relationship between species richness and productivity? Ecology 2001, 82, 2381–2396. [Google Scholar] [CrossRef]
- Gillman, L.N.; Wright, S.D. The influence of productivity on the species richness of plants: A critical assessment. Ecology 2006, 87, 1234–1243. [Google Scholar] [CrossRef]
- Grace, J.B.; Anderson, T.M.; Seabloom, E.W.; Borer, E.T.; Adler, P.B.; Harpole, W.S.; Hautier, Y.; Hillebrand, H.; Lind, E.M.; Pärtel, M.; et al. Integrative modelling reveals mechanisms linking productivity and plant species richness. Nature 2016, 529, 390–393. [Google Scholar] [CrossRef]
- Adler, P.B.; Seabloom, E.W.; Borer, E.T.; Hillebrand, H.; Hautier, Y.; Hector, A.; Harpole, W.S.; O’Halloran, L.R.; Grace, J.B.; Anderson, T.M. Productivity is a poor predictor of plant species richness. Science 2011, 333, 1750–1753. [Google Scholar] [CrossRef]
- Hagan, J.G.; Vanschoenwinkel, B.; Gamfeldt, L. We should not necessarily expect positive relationships between biodiversity and ecosystem functioning in observational field data. Ecol. Lett. 2021, 24, 2537–2548. [Google Scholar] [CrossRef]
- Zhao, F.; Xu, M. Research Progress on the Relationship between Productivity and Biodiversity. J. Nat. Resour. 2018, 33, 2046–2056. [Google Scholar]
- Cavanaugh, K.C.; Gosnell, J.S.; Davis, S.L.; Ahumada, J.; Boundja, P.; Clark, D.B.; Mugerwa, B.; Jansen, P.A.; O’Brien, T.G.; Rovero, F.; et al. Biodiversity and aboveground carbon storage. Glob. Ecol. Biogeogr. 2014, 23, 563–573. [Google Scholar] [CrossRef]
- Rosenzweig, M.L. Species Diversity Gradients: We Know More and Less Than We Thought. J. Mammal. 1992, 73, 715–730. [Google Scholar] [CrossRef]
- Rosenzweig, M.L.; Abramsky, Z. How are Diversity and Productivity Related?: Species Diversity in Ecological Communities: Historical and Geographical Perspectives. Madroño Is Q. Publ. Calif. Bot. Soc. 1993, 42, 523–525. [Google Scholar]
- Grime, J. Benefits of plant diversity to ecosystems: Immediate, filter and founder effects. J. Ecol. 1998, 86, 902–910. [Google Scholar] [CrossRef]
- Harms, K.E.; Condit, R.; Hubbell, S.P.; Foster, R.B. Habitat associations of trees and shrubs in a 50-ha neotropical forest plot. J. Ecol. 2001, 89, 947–959. [Google Scholar] [CrossRef]
- Xie, L.; Chen, S.; Feng, Y.; Li, Y.; Wang, L.; He, L.; Huang, L.; Wu, J.; Guo, K.; Ding, H.; et al. Mismatch Between Specific and Genetic Diversity in an Evergreen Broadleaf Forest in Southeast China: A Study Case of 10.24 ha Forest Dynamics Plot of Huangshan. Front. Plant Sci. 2022, 12, 706006. [Google Scholar] [CrossRef]
- Vegan: Community Ecology Package. R Package Version 2.4-4. 2017, pp. 631–637. Available online: https://cran.r-project.org/web/packages/vegan/index.html (accessed on 16 September 2022).
- Gonzalez-Akre, E.; Piponiot, C.; Lepore, M.; Herrmann, V.; Lutz, J.A.; Baltzer, J.L.; Dick, C.W.; Gilbert, G.S.; He, F.; Heym, M.; et al. allodb: An R package for biomass estimation at globally distributed extratropical forest plots. Methods Ecol. Evol. 2021, 13, 330–338. [Google Scholar] [CrossRef]
- Lefcheck, J.S. piecewiseSEM: Piecewise structural equation modelling in r for ecology, evolution, and systematics. Methods Ecol. Evol. 2016, 7, 573–579. [Google Scholar] [CrossRef]
- Chave, J.; Andalo, C.; Brown, S.; Cairns, M.A.; Chambers, J.Q.; Eamus, D.; Fölster, H.; Fromard, F.; Higuchi, N.; Kira, T.; et al. Tree allometry and improved estimation of carbon stocks and balance in tropical forests. Oecologia 2005, 145, 87–99. [Google Scholar] [CrossRef]
- Vile, D.; Shipley, B.; Garnier, E. Ecosystem productivity can be predicted from potential relative growth rate and species abundance. Ecol. Lett. 2006, 9, 1061–1067. [Google Scholar] [CrossRef]
- Nakagawa, S.; Johnson, P.C.D.; Schielzeth, H. The coefficient of determination R-2 and intra-class correlation coefficient from generalized linear mixed-effects models revisited and expanded. J. R. Soc. Interface 2017, 14, 20170213. [Google Scholar] [CrossRef]
- Lin, D.; Lai, J.; Muller-Landau, H.C.; Mi, X.; Ma, K. Topographic variation in aboveground biomass in a subtropical evergreen broad-leaved forest in China. PLoS ONE 2012, 7, e48244. [Google Scholar] [CrossRef] [PubMed]
- Liu, H.; Xue, D.; Sang, W. Effect of topographic factors on the relationship between species richness and aboveground biomass in a warm temperate forest. Ecol. Environ. Sci. 2012, 21, 1403–1407. [Google Scholar]
- Wu, C.; Han, W.; Jiang, B.; Liu, B.; Yuan, W.; Shen, A.; Huang, Y.; Zhu, J. Relationships between species richness and biomass/productivity depend on environmental factors in secondary forests of Dinghai, Zhejiang Province. Biodivers. Sci. 2018, 26, 545. [Google Scholar] [CrossRef]
- Wen, C.; Jin, G. Effects of functional diversity on productivity in a typical mixed broadleaved-Korean pine forest. Chin. J. Plant Ecol. 2019, 43, 94–106. [Google Scholar]
- Li, Y.; Bao, W.; Bongers, F.; Chen, B.; Chen, G.; Guo, K.; Jiang, M.; Lai, J.; Lin, D.; Liu, C.; et al. Drivers of tree carbon storage in subtropical forests. Sci. Total Environ. 2019, 654, 684–693. [Google Scholar] [CrossRef]
- Poorter, L.; van der Sande, M.T.; Thompson, J.; Arets, E.J.; Alarcón, A.; Álvarez-Sánchez, J.; Ascarrunz, N.; Balvanera, P.; Barajas-Guzmán, G.; Boit, A.; et al. Diversity enhances carbon storage in tropical forests. Glob. Ecol. Biogeogr. 2015, 24, 1314–1328. [Google Scholar] [CrossRef]
- Carreno-Rocabado, G.; Pena-Claros, M.; Bongers, F.; Alarcon, A.; Licona, J.C.; Poorter, L. Effects of disturbance intensity on species and functional diversity in a tropical forest. J. Ecol. 2012, 100, 1453–1463. [Google Scholar] [CrossRef]
- Chisholm, R.A.; Muller-Landau, H.C.; Abdul Rahman, K.; Bebber, D.P.; Bin, Y.; Bohlman, S.A.; Bourg, N.A.; Brinks, J.; Bunyavejchewin, S.; Butt, N.; et al. Scale-dependent relationships between tree species richness and ecosystem function in forests. J. Ecol. 2013, 101, 1214–1224. [Google Scholar] [CrossRef]
- Anderson, T.M.; McNaughton, S.J.; Ritchie, M.E. Scale-dependent relationships between the spatial distribution of a limiting resource and plant species diversity in an African grassland ecosystem. Oecologia 2004, 139, 277–287. [Google Scholar] [CrossRef]
Publisher’s Note: MDPI stays neutral with regard to jurisdictional claims in published maps and institutional affiliations. |
© 2022 by the authors. Licensee MDPI, Basel, Switzerland. This article is an open access article distributed under the terms and conditions of the Creative Commons Attribution (CC BY) license (https://creativecommons.org/licenses/by/4.0/).

