

Efficacy of Killing Large Carnivores to Enhance Moose Harvests: New Insights from a Long-Term View

Abstract
1. Introduction
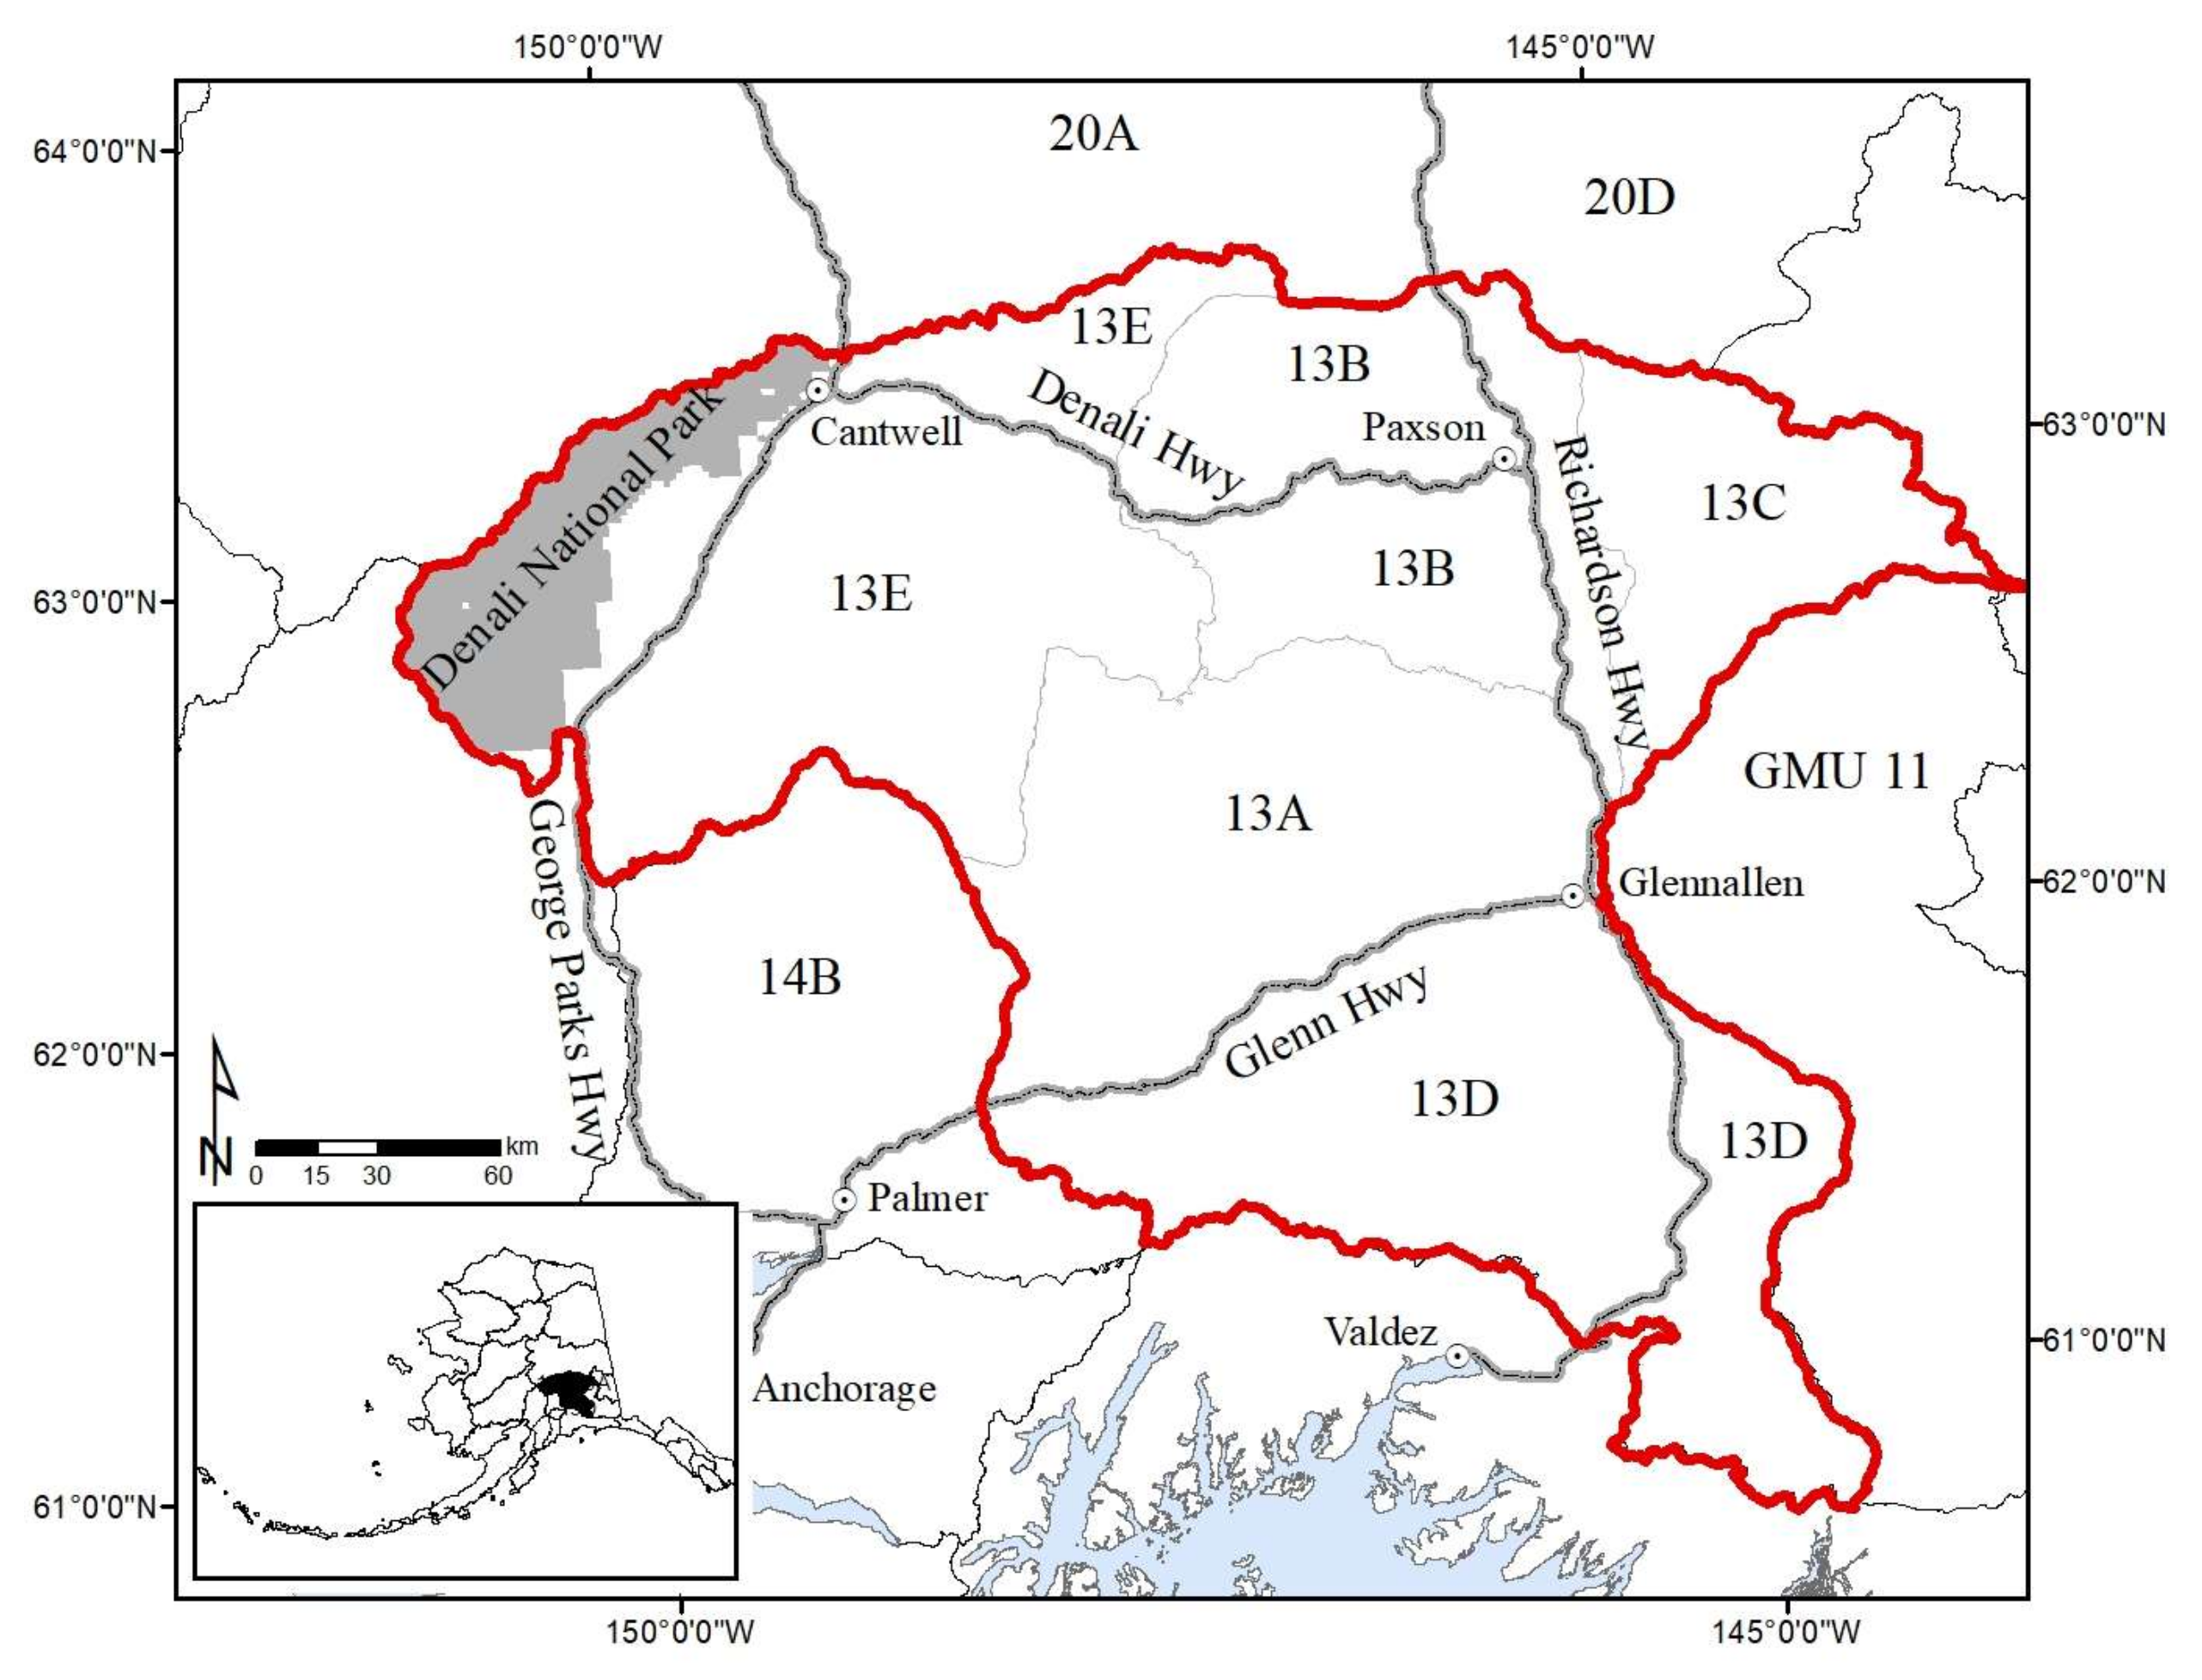
2. Study Area
3. Materials and Methods
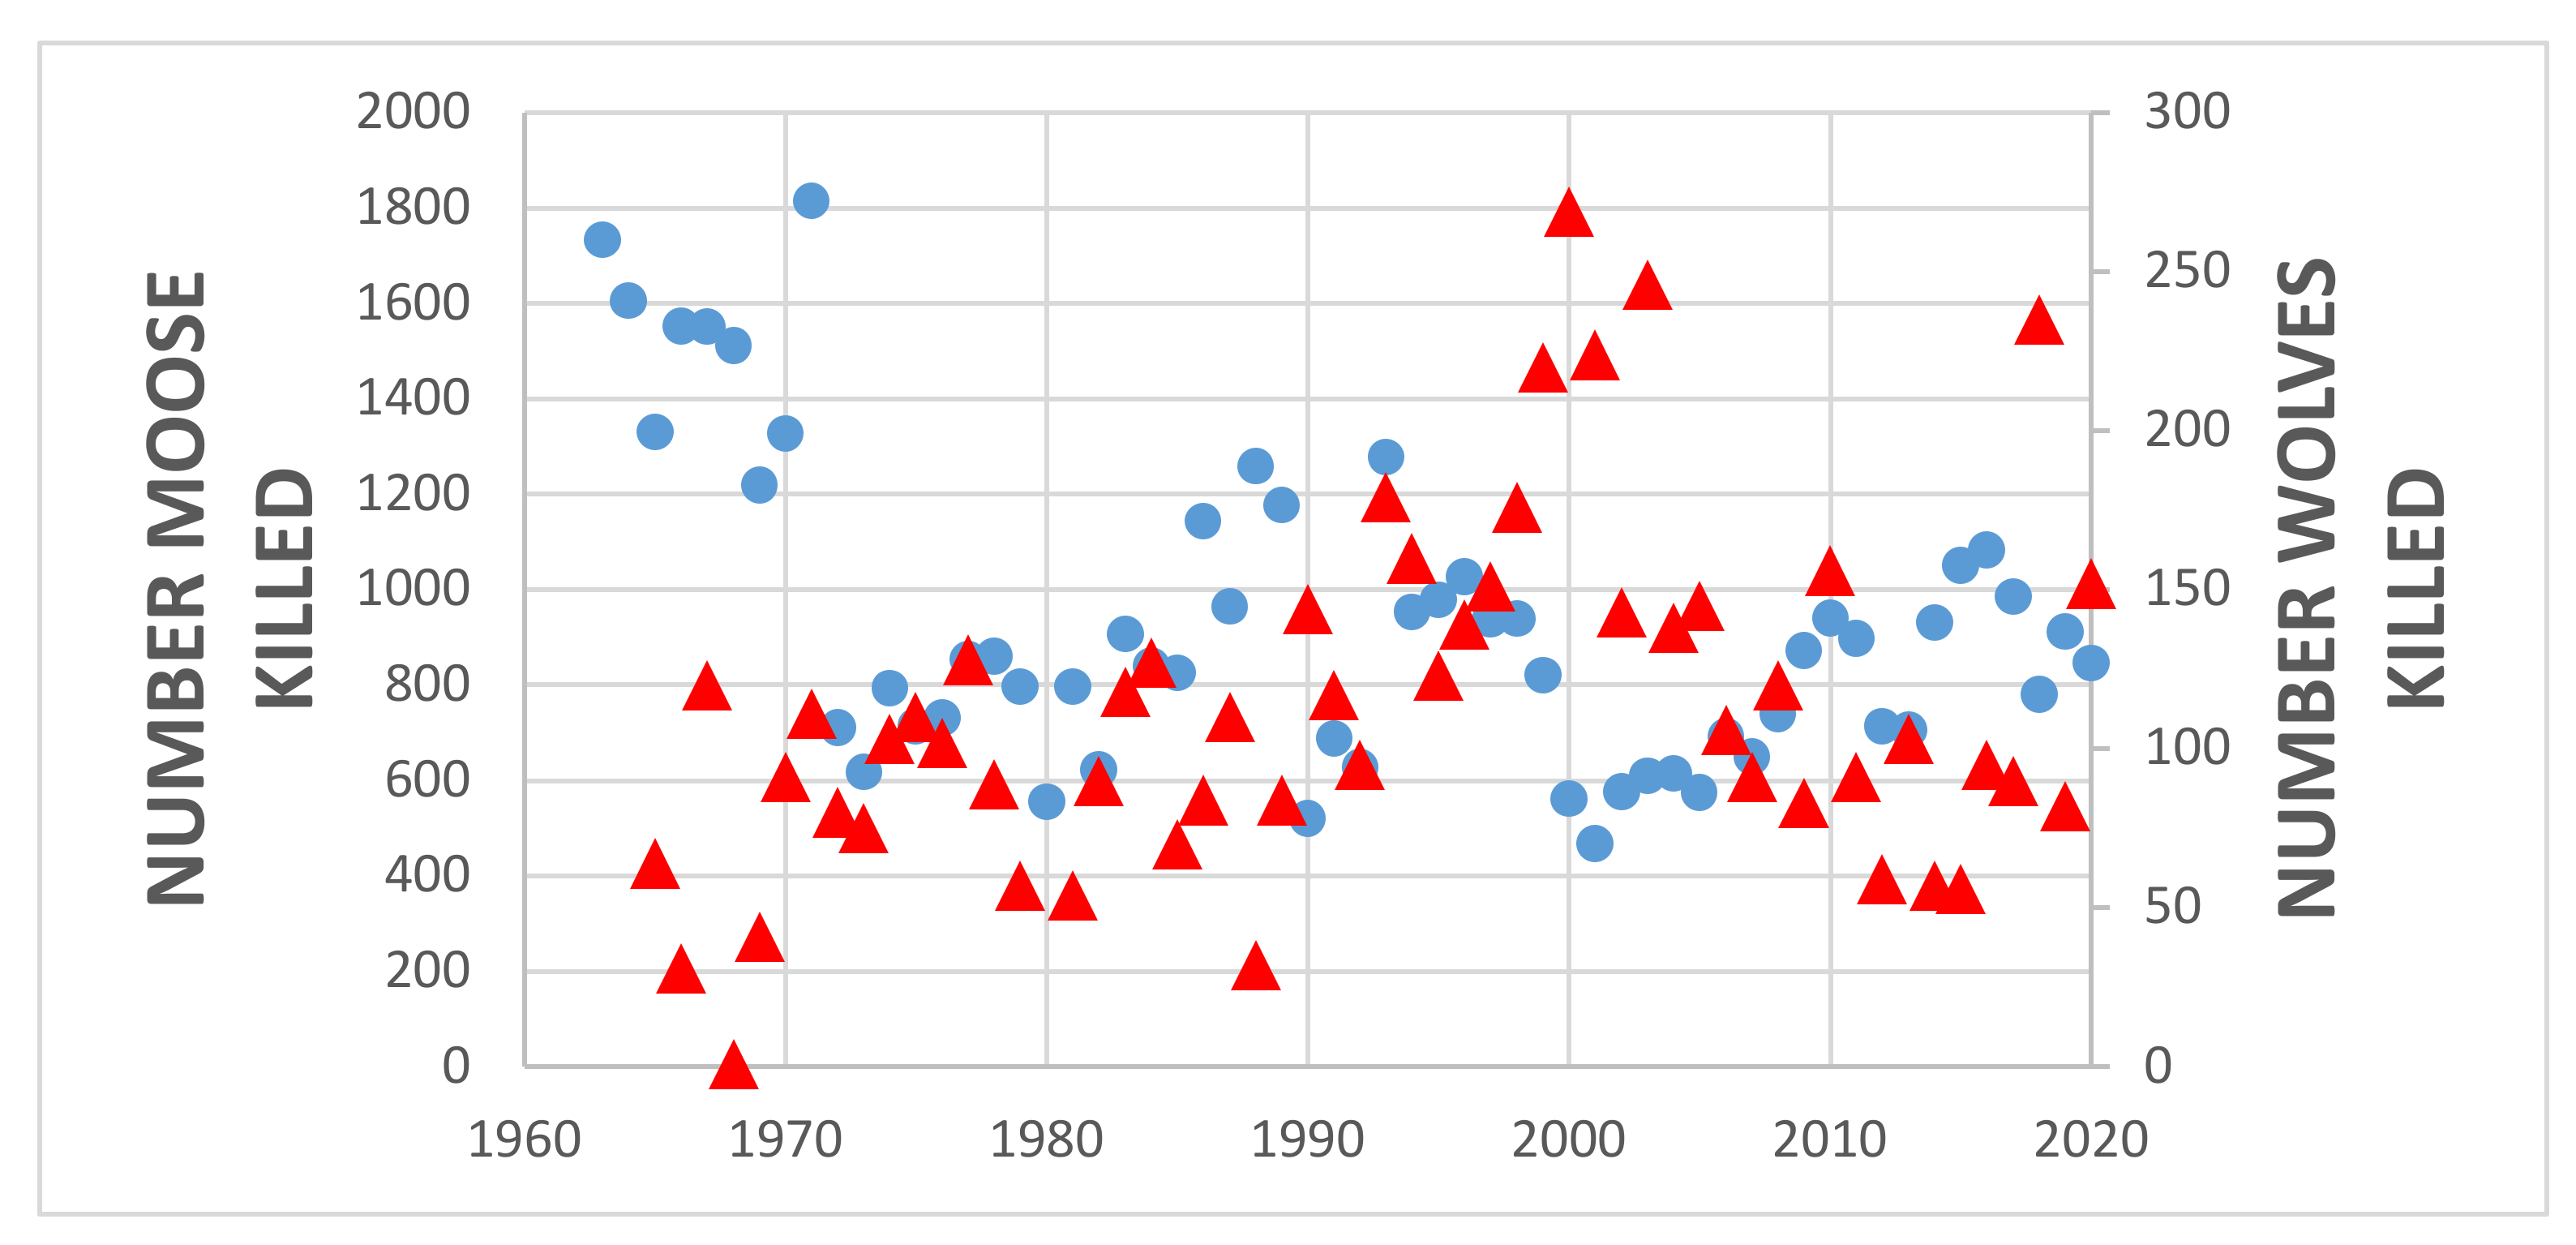
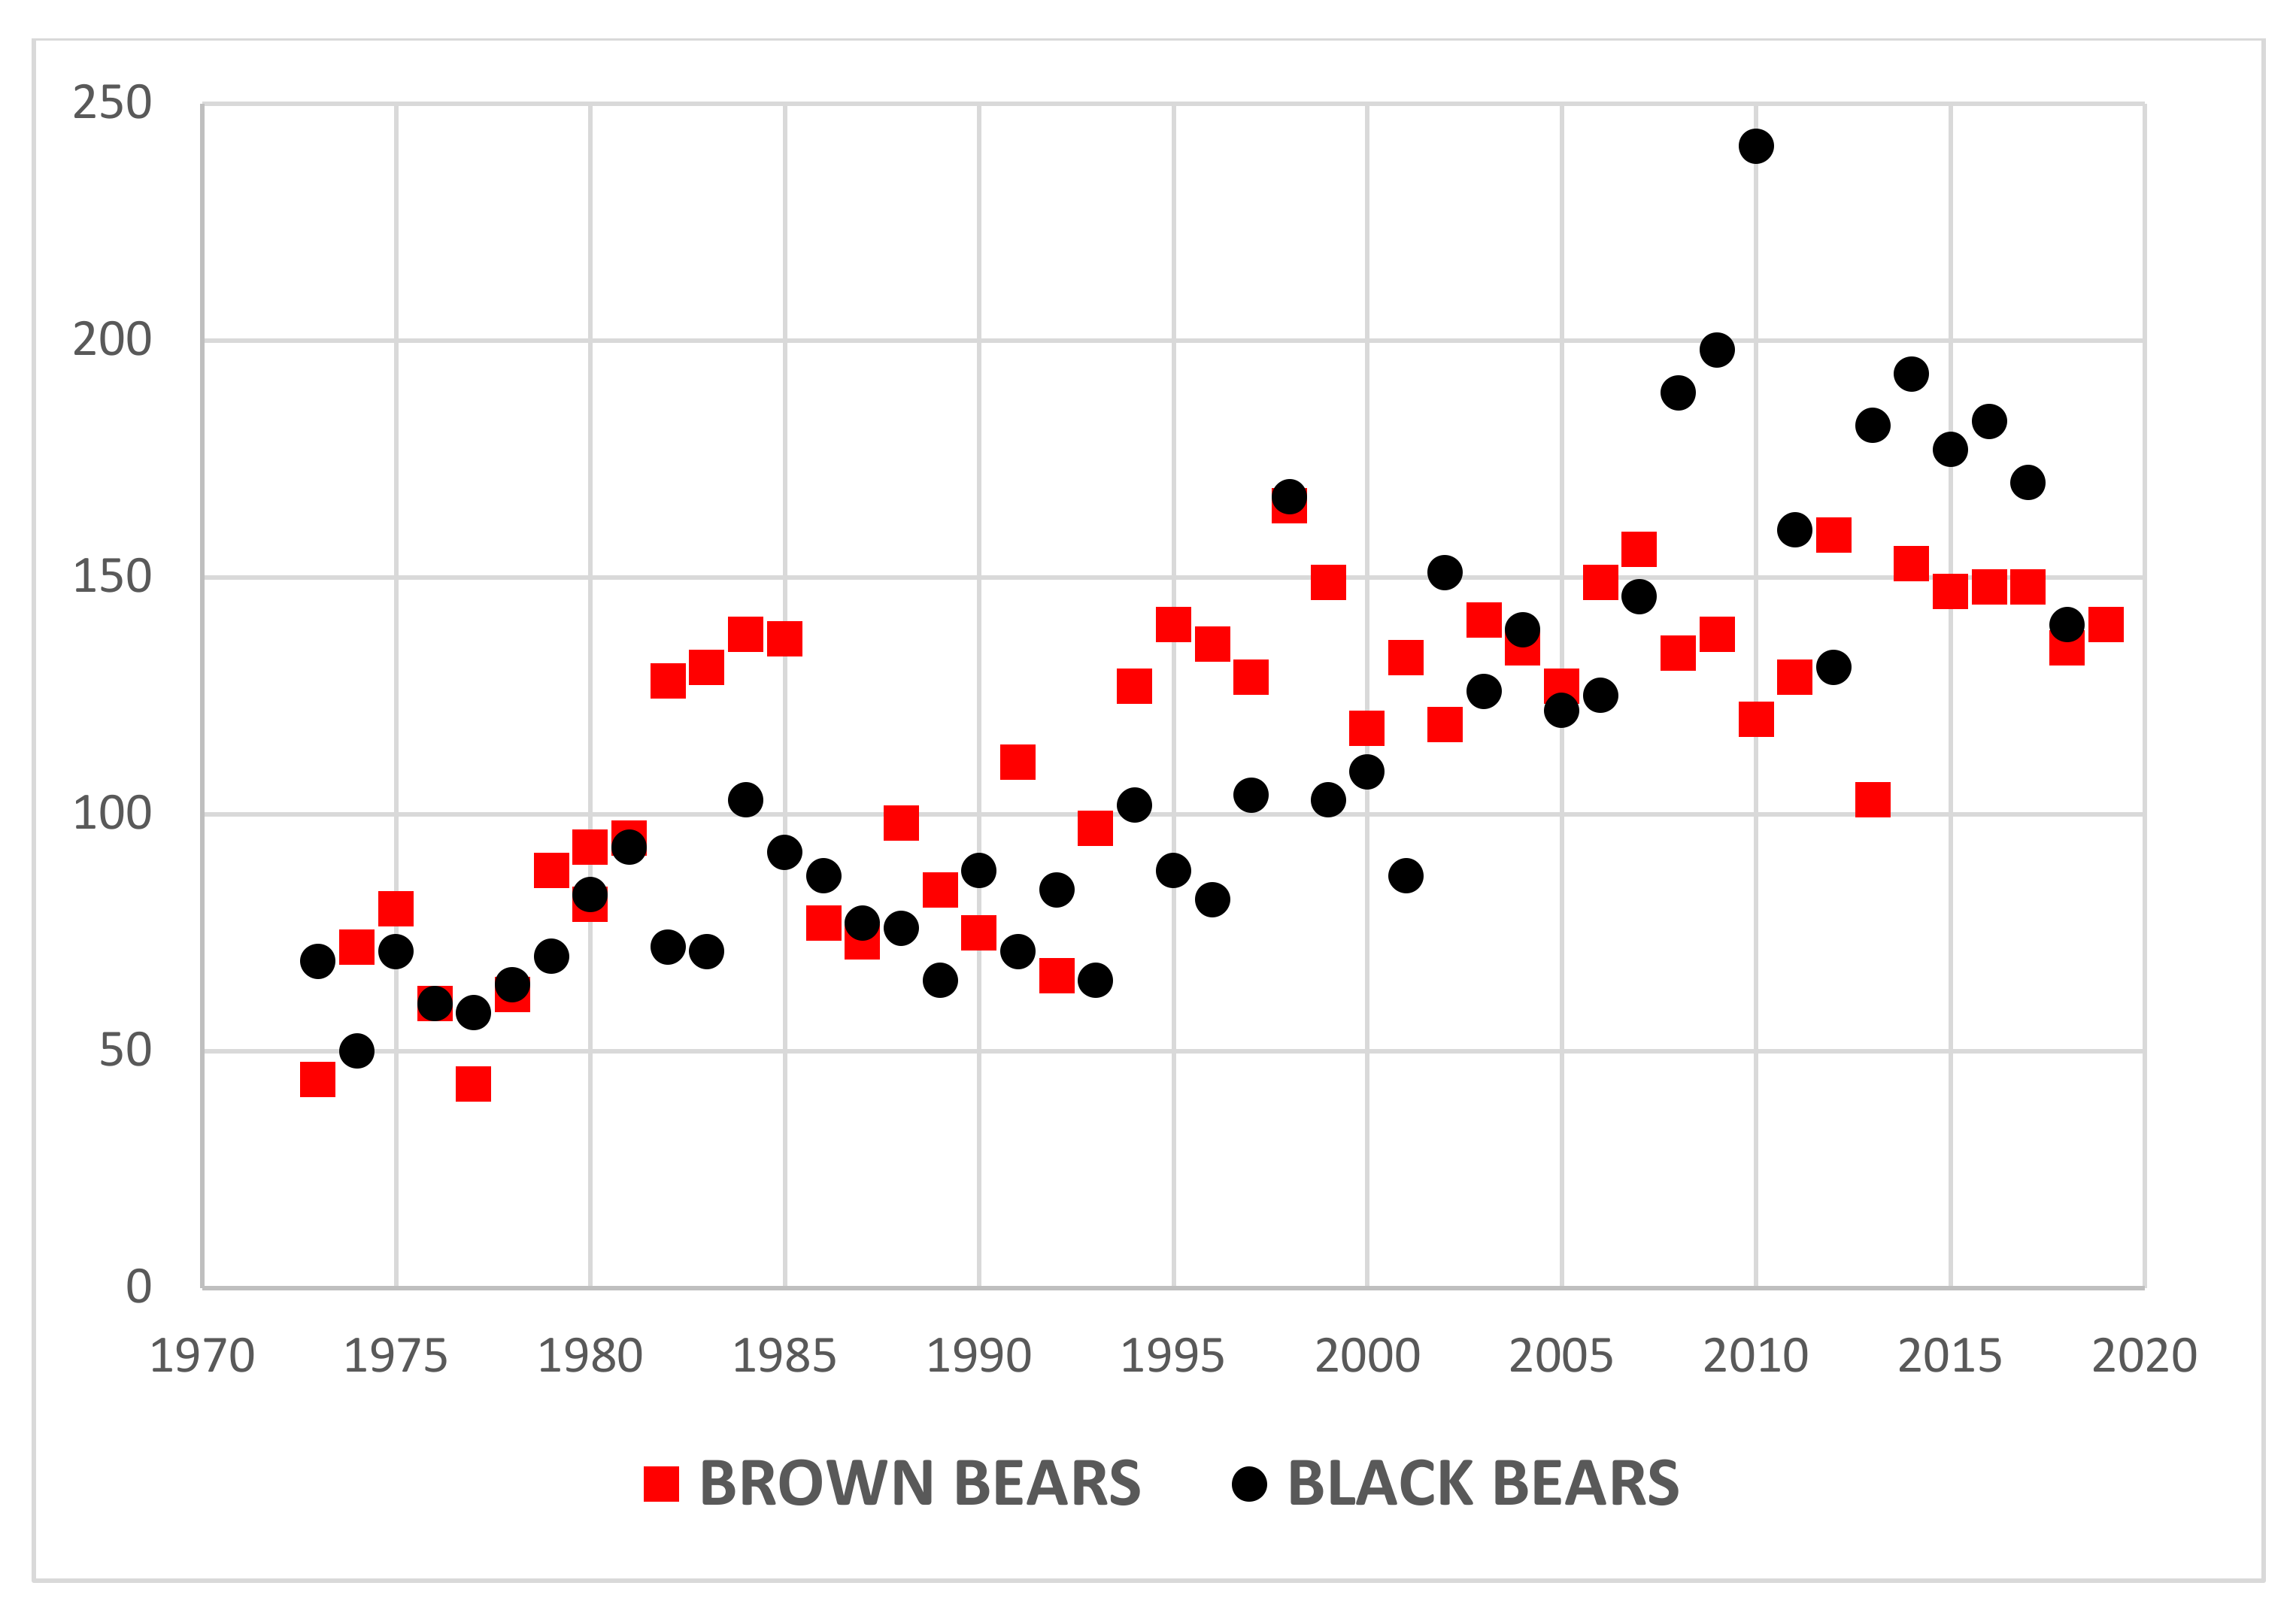
3.1. Harvest Data
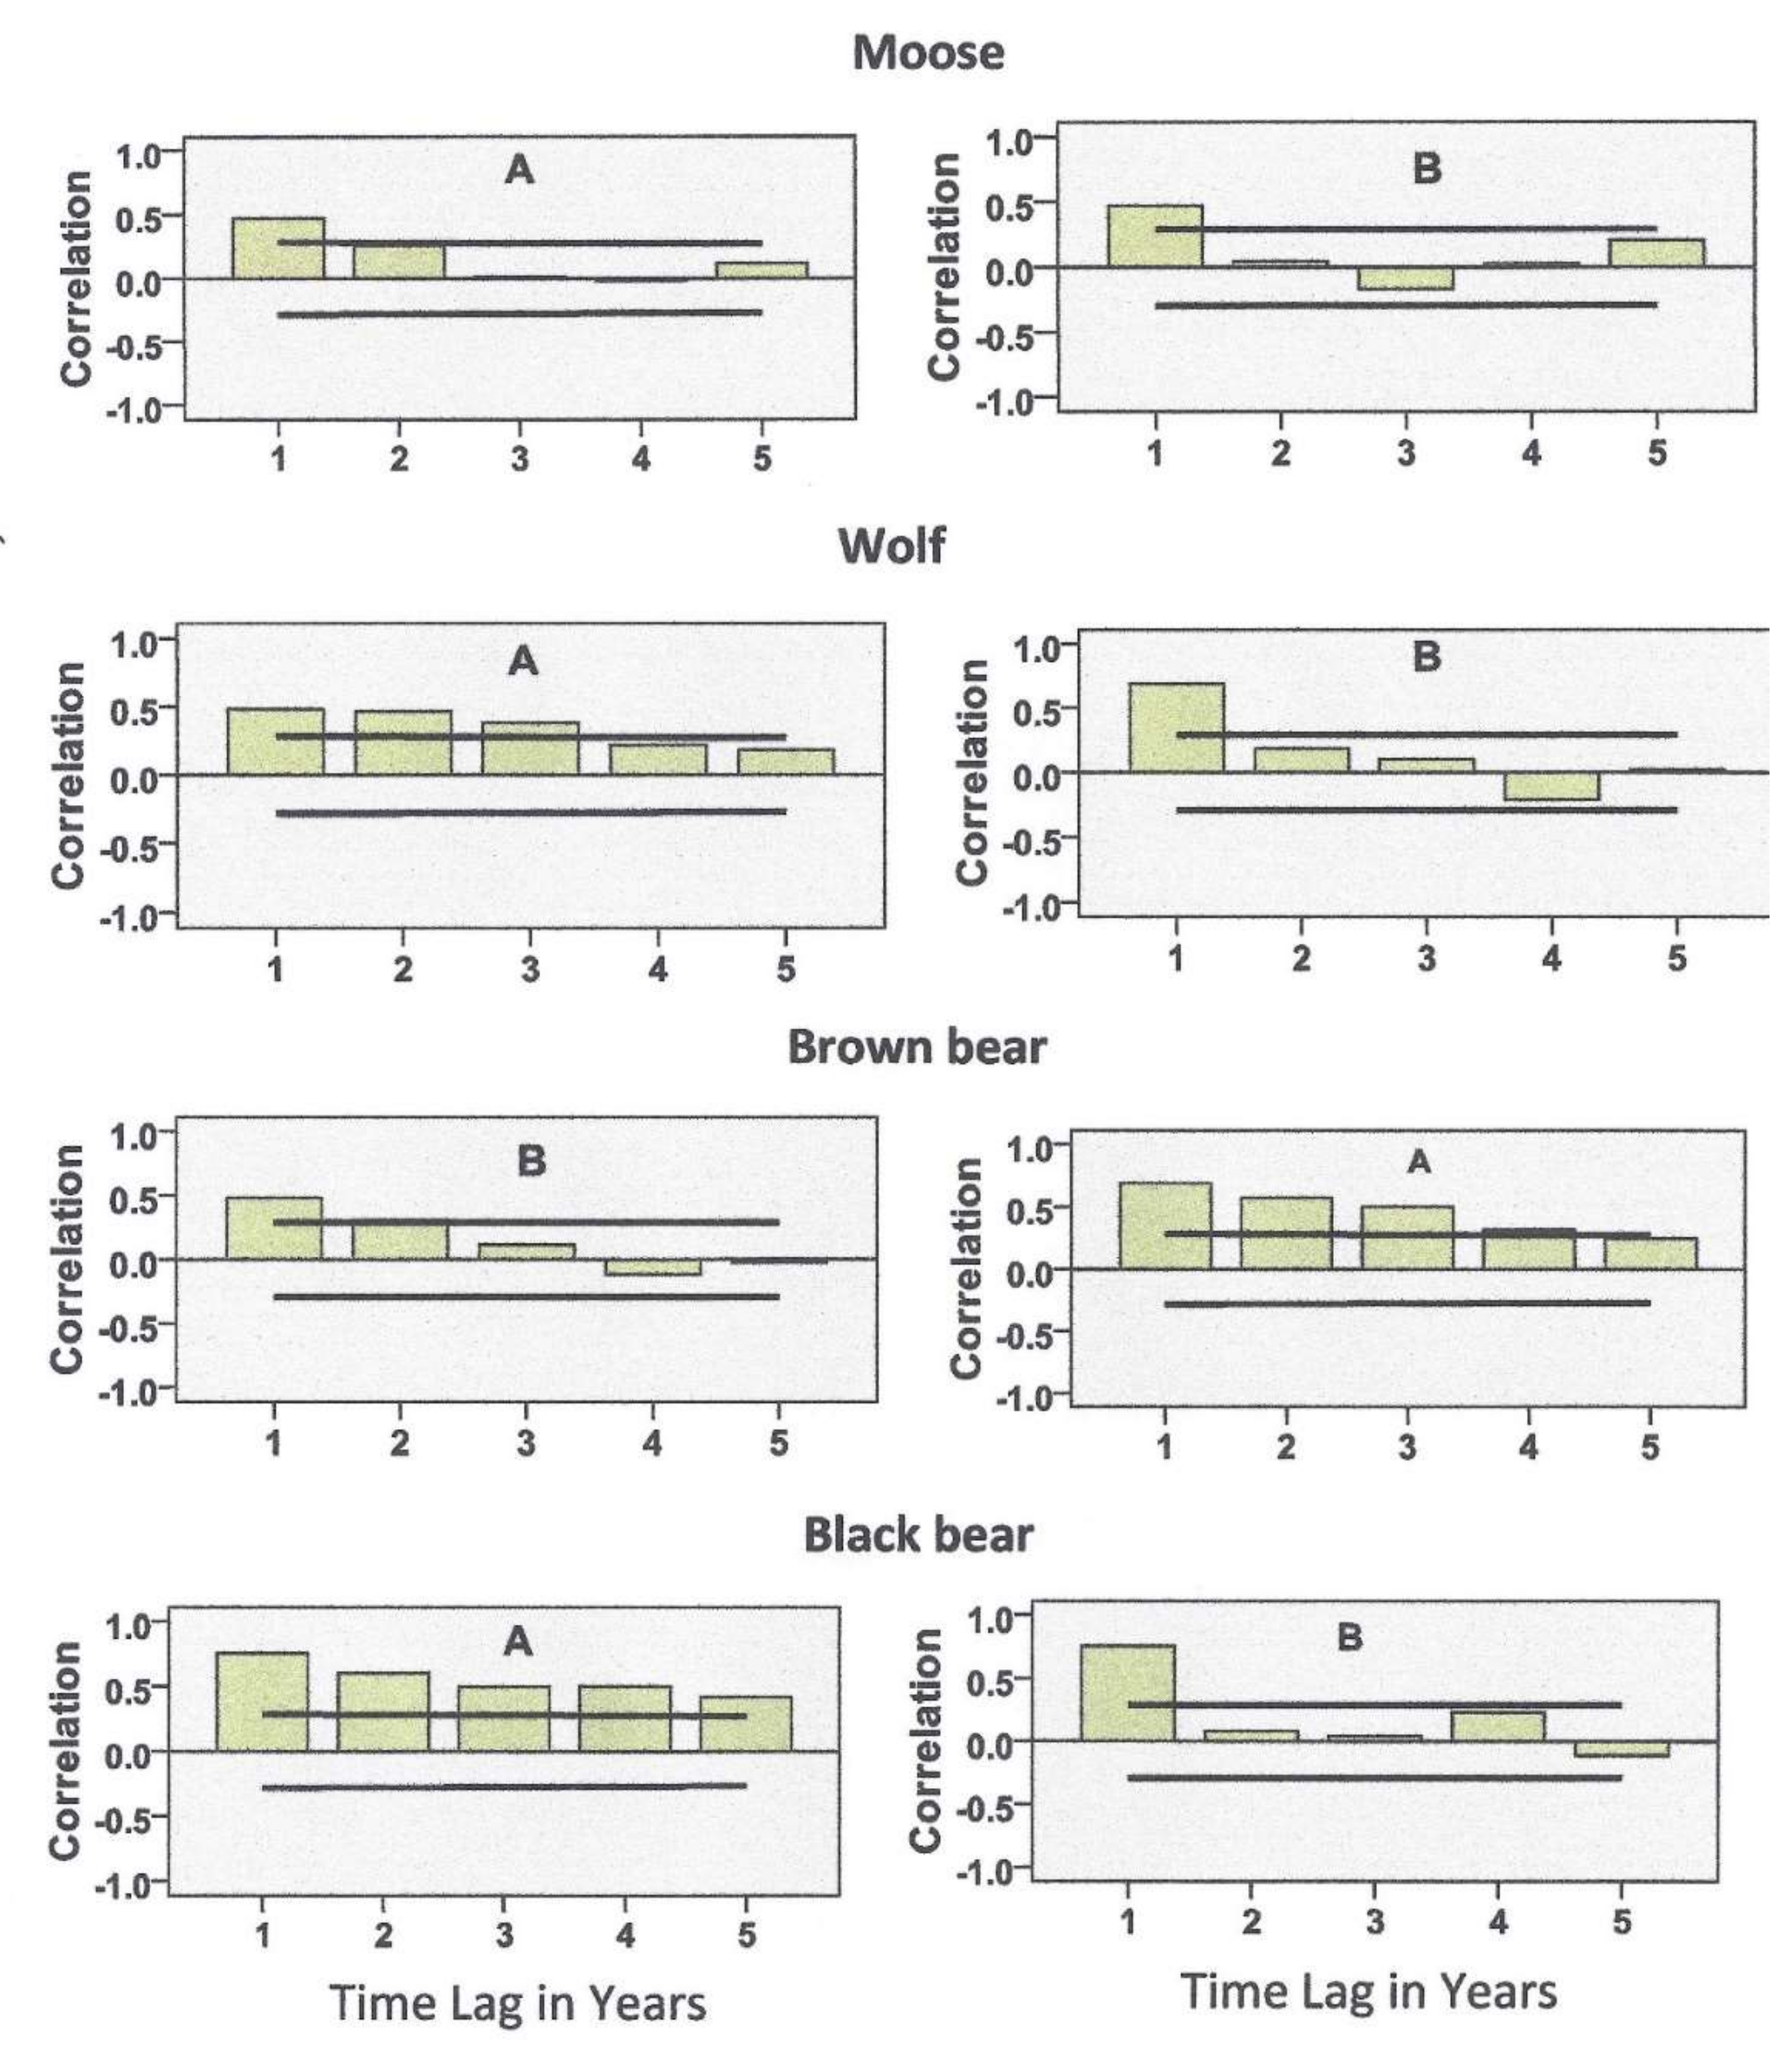
3.2. Statistical Analyses
4. Results
4.1. Game Management Unit 13
4.2. GMU 13D and Subunits A, B, C, and E
4.3. Moose Harvest Means Comparisons, Subunit A, B, C, and E
5. Discussion
5.1. Predator Kill and Moose Harvest
5.2. Management Considerations
6. Conclusions
Supplementary Materials
Author Contributions
Funding
Institutional Review Board Statement
Data Availability Statement
Acknowledgments
Conflicts of Interest
References
- Bowyer, R.T.; Person, D.E.; Pierce, E.M. Detecting Dop-Down versus Bottom-Up Regulation of Ungulates by Large Carnivores: Implications for Conservation of Biodiver-Sity. In Large Carnivores and the Conservation of Biodiversity; Ray, J.C., Redford, K.H., Steneck, R.S., Berger, J., Eds.; Island Press: Washington, DC, USA, 2005; pp. 342–361. [Google Scholar]
- Gasaway, W.C.; Boertje, R.D.; Grandgaard, D.V.; Kelleyhouse, D.G.; Stephenson, R.O.; Larsen, D.G. The role of predation in limiting moose at low densities in Alaska and Yukon and implications for conservation. Wildl. Monogr. 1992, 120, 3–59. [Google Scholar]
- Van Ballenberghe, V.; Ballard, W.B. Limitation and regulation of moose populations: The role of predation. Can. J. Zool. 1994, 72, 2071–2077. [Google Scholar] [CrossRef]
- Bowyer, R.T.; Kie, J.G.; Person, D.K.; Monteith, K.L. Metrics of predation: Perils of predator-prey ratios. Acta Theol. 2013, 58, 329–340. [Google Scholar] [CrossRef]
- Bowyer, R.T.; Stewart, K.M.; Bleich, V.C.; Whiting, J.C.; Monteith, K.L.; Blum, M.E.; LaSharr, T.N. Metrics of harvest for ungulate populations: Misconceptions, lurking variables, and prudent management. Alces 2020, 56, 15–38. [Google Scholar]
- Ballard, W.B.; Spraker, T.H.; Taylor, K.P. Causes of neonatal moose calf mortality in southcentral Alaska. J. Wildl. Manag. 1981, 45, 335–342. [Google Scholar] [CrossRef]
- Ballard, W.B.; Miller, S.D.; Whitman, J.S. Brown and black bear predation on moose in southcentral Alaska. Alces 1990, 26, 1–8. [Google Scholar]
- Ballard, W.B.; Whitman, J.S.; Reed, D.J. Dynamics of moose in south-central Alaska. Wildl. Monogr. 1991, 114, 1–49. [Google Scholar]
- Schwartz, C.C.; Franzmann, A.W. Interrelationship of black bears to moose and forest succession in the northern coniferous forest. Wildl. Monogr. 1991, 113, 3–58. [Google Scholar]
- Bowyer, R.T.; Van Ballenberghe, V.; Kie, J.G. Timing and synchrony of parturition in Alaskan moose: Long-term versus proximal effects of climate. J. Mammal. 1998, 79, 1332–1344. [Google Scholar] [CrossRef]
- Ballard, W.B.; Whitman, J.S.; Gardner, G.L. Ecology of an exploited wolf population in south-central Alaska. Wildl. Monogr. 1987, 98, 3–54. [Google Scholar]
- Keech, M.A.; Boertje, R.D.; Bowyer, R.T.; Dale, B.W. Effects of birth weight on growth of young moose: Do low-weight neonates compensate? Alces 1999, 35, 51–57. [Google Scholar]
- McCullough, D.R. Male harvest in relation to female removals in a black-tailed deer population. J. Wildl. Manag. 2001, 65, 46–58. [Google Scholar] [CrossRef]
- Bartmann, R.M.; White, G.C.; Carpenter, H.H. Compensatory mortality in a Colorado mule deer population. Wildl. Monogr. 1992, 121, 3–39. [Google Scholar]
- Gilbert, S.L.; Hundertmark, K.J.; Lindberg, M.S.; Person, D.K.; Boyce, M.S. The importance of environmental variability and transient population dynamics for a northern ungulate. Front. Ecol. Evol. 2020, 8, 1–14. [Google Scholar] [CrossRef]
- Testa, J.W. Population dynamics and life history trade-offs of moose (Alces alces) in south-central Alaska. Ecology 2004, 85, 1439–1452. [Google Scholar] [CrossRef]
- Hundermark, K.J.; Schwartz, C.C. Considerations for intensive management of moose in Alaska. Alces 1996, 32, 15–24. [Google Scholar]
- Boertje, R.D.; Keech, M.A.; Young, D.D.; Kellie, K.A.; Seaton, T.C. Managing for elevated yield of moose in interior Alaska. J. Wildl. Manag. 2009, 73, 314–327. [Google Scholar] [CrossRef]
- Young, D.D., Jr.; Boertje, R.D.; Seaton, C.T.; Kellie, K.A. Intensive management of moose at high density: Impediments, achievements, and recommendations. Alces 2006, 42, 41–48. [Google Scholar]
- National Research Council. Wolves, Bears, and Their Prey in Alaska: Biological and Social Challenges in Wildlife Management; National Academy Press: Washington, DC, USA, 1997. [Google Scholar]
- Clark, J.T.; Horn, J.S.; Hebblewhite, M.; Luis, A.D. Stochastic predation exposes prey to predator pit and local extinction. Oikos 2021, 130, 300–309. [Google Scholar] [CrossRef]
- Keech, M.A.; Lindberg, M.S.; Boertje, R.D.; Valkenburg, P.; Taras, P.D.; Boudreau, T.A.; Beckmen, K.B. Effects of predator treatments, individual traits, and environment on moose survival in Alaska. J. Wildl. Manag. 2011, 75, 1361–1380. [Google Scholar] [CrossRef]
- Boertje, R.D.; Valkenburg, P.; McNay, M.E. Increases in moose, caribou, and wolves following wolf control in Alaska. J. Wildl. Manag. 1996, 60, 474–489. [Google Scholar] [CrossRef]
- Boertje, R.D.; Frye, G.G.; Young, D.D. Lifetime sex-specific moose mortality during an intentional population reduction. J. Wildl. Manag. 2020, 84, 6–19. [Google Scholar] [CrossRef]
- Ripple, W.J.; Miller, S.D.; Schoen, J.W.; Rabinowitch, S.P. Large carnivores under assault in Alaska. PLoS Biol. 2019, 17, 332–346. [Google Scholar] [CrossRef] [PubMed]
- Boutin, S. Predation and moose population dynamics: A critique. J. Wildl. Manag. 1992, 56, 116–127. [Google Scholar] [CrossRef]
- Alaska Department of Fish and Game. Intensive Management Protocol; Division of Wildlife Conservation, 2011; p. 44. Available online: https://www.adfg.alaska.gov/static/research/programs/intensivemanagement/pdfs/intensive_management_protocol.pdf (accessed on 2 June 2022).
- Alaska Department of Fish and Game. Board of Game Bear Conservation, Harvest, and Management Policy 2016-214-BOG. 2021. Available online: http://www.adfg.alaska.gov/static/regulations/regprocess/gameboard/pdfs/findings/16214.pdf (accessed on 8 August 2022).
- Miller, S.D.; Schoen, J.W.; Schwartz, C.C. Trends in brown bear reduction efforts in Alaska, 1980–2017. Ursus 2017, 28, 135–149. [Google Scholar] [CrossRef]
- Weixelman, D.A.; Bowyer, R.T.; Van Ballenberghe, V. Diet selection by Alaskan moose during winter: Effects of fire and forest succession. Alces 1998, 34, 213–238. [Google Scholar]
- Schmidt, J.I.; Ver Hoef, J.M.; Maier, J.A.; Bowyer, R.T. Catch per unit effort for moose: A new approach using Weibull regression. J. Wildl. Manag. 2005, 69, 1112–1124. [Google Scholar] [CrossRef]
- Schmidt, J.I.; Ver Hoef, J.M.; Bowyer, R.T. Antler size of Alaskan moose Alces alces gigas: Effects of population density, hunter harvest and use of guides. Wildl. Biol. 2007, 13, 53–65. [Google Scholar] [CrossRef]
- Maier, J.A.K.; Ver Hoef, J.M.; McGuire, D.A.; Bowyer, R.T.; Saperstein, L.; Maier, A. Distribution and density of moose in relation to landscape characteristics: Effects of scale. Can. J. For. Res. 2005, 35, 2233–2243. [Google Scholar] [CrossRef]
- Alaska Department of Fish and Game. Annual Report to the Alaska Board of Game on Intensive Management for Moose with Wolf Predation Control in Unit 13; Division of Wildlife Conservation, February 2022; p. 14. Available online: https://www.adfg.alaska.gov/static/applications/web/nocache/research/programs/intensivemanagement/pdfs/2022_gmu_13_intensive_management_annual_report.pdf38D732401CD0CA2E43CBC5FFBF8CABDF/2022_gmu_13_intensive_management_annual_report.pdf (accessed on 2 June 2022).
- Ballard, W.B.; Miller, S.D. Effects of reducing brown bear density on moose calf survival in southcentral Alaska. Alces 1990, 26, 9–13. [Google Scholar]
- Miller, S.D. Brown Bears in Alaska: A Statewide Management Overview; Wildlife Technical Bulletin 11; Alaska Department of Fish and Game, Division of Wildlife Conservation: Juneau, AK, USA, 1993. Available online: http://www.adfg.alaska.gov/static/home/library/pdfs/wildlife/research_pdfs/miller_1993_adfg_tech_bulletin_11_brown_bears_in_alaska.pdf (accessed on 18 August 2022).
- Miller, S.D.; White, G.C.; Sellers, R.A.; Reynolds, H.V.; Schoen, J.W.; Titus, K.; Barnes, V.G., Jr.; Smith, R.B.; Nelson, R.R.; Ballard, W.B.; et al. Brown and black bear density estimation in Alaska using radiotelemetry and replicated mark-resight techniques. Wildl. Monogr. 1997, 133, 1–55. [Google Scholar]
- Miller, S.D.; Sellers, R.A.; Keay, J.A. Effects of hunting on brown bear cub survival and litter size in Alaska. Ursus 2003, 14, 130–152. [Google Scholar]
- Brockman, C.M.; Guttery, M.R.; Dale, R.W.; Schwanke, R.A.; Tobey, R.W.; Koons, D.N. Effect of harvest on a brown bear population in Alaska. J. Wildl. Manag. 2020, 84, 865–876. [Google Scholar] [CrossRef]
- Robbins, W.F. Black Bear Management Report of Sur-Vey-Inventory Activities 1 July 2010–30 June 2013; Harper, P., Ed.; Unit 13 Black Bear; Species Management Report ADF&G/DWC/SMR-2014-5; Alaska Department of Fish and Game: Juneau, AK, USA, 2008; Chapter 12; pp. 1–8. Available online: http://www.adfg.alaska.gov/static/home/library/pdfs/wildlife/mgt_rpts/08_blb.pdf (accessed on 2 June 2022).
- Derrick, T.R.; Thomas, J.M. Time-series analysis: The cross-correlation function. In Innovative Analyses of Human Movement; Stergiou, N., Ed.; Human Kinetics Publishers: Champaign, IL, USA, 2004; pp. 189–205. [Google Scholar]
- Neter, J.; Wasserman, W.; Kutner, M.H. Applied Linear Statistical Models: Regression, Analysis of Variance, and Experimental Designs, 2nd ed.; Irwin: Homewood, IL, USA, 1985. [Google Scholar]
- Nelson, C.R. Applied Time Series Analysis for Managerial Forecasting; Holden-Day Inc.: San Francisco, CA, USA, 1973. [Google Scholar]
- Burnham, K.P.; Anderson, D.R. Model Selection and Multimodel Inference: A Practical Information-Theoretic Approach, 2nd ed.; Springer Science: New York, NY, USA, 2002. [Google Scholar]
- Arnold, T.W. Uninformative parameters and model selection using Akaike’s information criterion. J. Wildl. Manag. 2010, 74, 1175–1178. [Google Scholar] [CrossRef]
- Thalmann, J.C.; Bowyer, R.T.; Aho, K.A.; Weckerly, F.W.; McCullough, D.R. Antler and body size in black-tailed deer: An analysis of cohort effects. Adv. Ecol. 2015, 2015, 156041. [Google Scholar] [CrossRef]
- Zweiers, F.W.; von Storch, H. Taking Serial Correlation into Account in Tests of the Mean. J. Clim. 1994, 8, 336351. [Google Scholar]
- McCullough, D.R. The George Reserve Deer Herd: Ecology of a K-Selected Species; University of Michigan Press: Ann Arbor, MI, USA, 1979. [Google Scholar]
- Westgate, M.J.; Likens, G.E.; Lindenmayer, D.B. Adaptive management of biological systems: A review. Biol. Conserv. 2013, 158, 128–139. [Google Scholar] [CrossRef]
- Mitchell, C.D.; Chaney, R.; Aho, K.; Bowyer, R.T. Population characteristics, morphometry, and growth of harvested gray wolves and coyotes in Alaska. Arctic 2022, 75, 242–256. [Google Scholar] [CrossRef]
- Robbins, W.F. Moose Management Report and Plan, Game Management Unit 13: Report Period 1 July 2010–30 June 2015; Species Management Report and Plan ADF&G/DWC/SMR&P-2018-47; Alaska Department of Fish and Game: Juneau, AK, USA, 2018. Available online: http://www.adfg.alaska.gov/index.cfm?adfg=librarypublications.wildlifemanagement (accessed on 9 August 2022).
- Testa, J.W. Interaction of top-down and bottom-up life history trade-offs in moose (Alces alces). Ecology 2004, 85, 453–1455. [Google Scholar] [CrossRef]
- Monteith, K.L.; Bleich, V.C.; Stephenson, T.R.; Pierce, B.M.; Conner, M.M.; Kie, J.G.; Bowyer, R.T. Life-history characteristics of mule deer: Effects of nutrition in a variable environment. Wildl. Monogr. 2014, 186, 1–56. [Google Scholar] [CrossRef]
- Hobbs, N.T.; Swift, D.M. Estimates of habitat carrying capacity incorporating explicit nutritional constraints. J. Wildl. Manag. 1985, 49, 814–822. [Google Scholar] [CrossRef]
- Beck, J.L.; Peek, J.M.; Strand, E.K. Estimates of elk summer range nutritional carrying capacity constrained by probabilities of habitat selection. J. Wildl. Manag. 2006, 70, 283–294. [Google Scholar] [CrossRef]
- Boertje, R.D.; Frye, G.G.; Young, D.D., Jr. Lifetime, known-age moose reproduction in a nutritionally stressed population. J. Wildl. Manag. 2019, 83, 6–19. [Google Scholar] [CrossRef]
- Paragi, T.F.; Seaton, C.T.; Kellie, K.A.; Boertje, R.D.; Kieland, K.; Young, D.D., Jr.; Keech, M.A.; DuBois, S.D. Browse removal, plant, condition, and twinning rates before and after short-term changes in moose density. Alces 2015, 51, 1–21. [Google Scholar]
- Hayes, F.P.; Milspaugh, J.J.; Bergman, E.J.; Callaway, R.M.; Bishop, C.J. Effects of willow nutrition and morphology on calving success of moose. J. Wildl. Manag. 2022, 86, e22175. [Google Scholar] [CrossRef]
- Stewart, K.M.; Bowyer, R.T.; Ruess, R.W.; Dick, B.L.; Kie, J.G. Herbivore optimization in North American elk: Consequences for theory and management. Wildl. Monogr. 2006, 167, 1–24. [Google Scholar] [CrossRef]
- Gaudry, W.; Gaillard, J.M.; Saïd, S.; Mårell, A.; Balzinger, C.; Rocquencourt, A.; Bonenfant, C. Population density and plant availability interplay to shape browsing intensity by roe deer in a deciduous forest. For. Ecol. Manag. 2002, 515, 120153. [Google Scholar] [CrossRef]
- Bowyer, R.T.; Pierce, B.M.; Duffy, L.K.; Haggstrom, A. Sexual segregation in moose: Effects of habitat manipulation. Alces 2001, 37, 109–122. [Google Scholar]
- Oehlers, S.A.; Bowyer, R.T.; Huettmann, F.; Person, D.K.; Kessler, W.B. Sex and scale: Implications for habitat selection by Alaskan moose Alces alces gigas. Wildl. Biol. 2011, 17, 67–84. [Google Scholar] [CrossRef]
- Bowyer, R.T. Sexual Segregation in Ungulates: Ecology, Behavior, and Conservation, Institute of Arctic Biology, University of Alaska Fairbanks: Fairbanks, AK, USA, 2022; in press.
- Theberge, J.B. Potentials for misinterpreting impacts of wolf predation through prey: Predator ratios. Wildl. Soc. Bull. 1990, 18, 188–192. [Google Scholar]
- Person, D.K.; Bowyer, R.T.; Van Ballenberghe, V. Density dependence of ungulates and functional responses of wolves: Effects on predator–prey ratios. Alces 2001, 37, 253–273. [Google Scholar]
- Monteith, K.L.; Long, R.A.; Stephenson, T.R.; Bleich, V.C.; Bowyer, R.T.; LaSharr, T. Horn size and nutrition in mountain sheep: Can ewe handle the truth? J. Wildl. Manag. 2018, 82, 67–84. [Google Scholar] [CrossRef]
- Treves, A.; Karanth, K.U. Human-carnivore conflict and perspectives on carnivore management worldwide. Conserv. Biol. 2003, 17, 1491–1499. [Google Scholar] [CrossRef]
- Laliberte, A.S.; Ripple, W.J. Range contractions of North American carnivores and ungulates. BioScience 2004, 64, 123–138. [Google Scholar] [CrossRef]
- Schwartz, C.C.; Swenson, J.E.; Miller, S.D. Large carnivores, moose, and humans: A changing paradigm of predator management in the 21st Century. Alces 2011, 39, 41–63. [Google Scholar]
- Gilbert, S.; Haynes, L.T.; Lindberg, M.S.; Albert, D.M.; Kissing, M.; Lynch, L.; Person, D. Potential futures for coastal wolves and their ecosystem services in Alaska, with implications for management of a social-ecological system. Front. Ecol. Evolut. 2022, 10, 809371. [Google Scholar] [CrossRef]
- Bruskotter, J.T. The predator pendulum revisited: Social conflict over wolves and their management in the western United States. Wildl. Soc. Bull. 2013, 37, 674–679. [Google Scholar] [CrossRef]
- Kellert, S.R.; Black, M.; Reid Rush, C.; Bath, A.J. Human culture and large carnivore conservation in North America. Conserv. Biol. 1996, 10, 977–990. [Google Scholar] [CrossRef]


Publisher’s Note: MDPI stays neutral with regard to jurisdictional claims in published maps and institutional affiliations. |
© 2022 by the authors. Licensee MDPI, Basel, Switzerland. This article is an open access article distributed under the terms and conditions of the Creative Commons Attribution (CC BY) license (https://creativecommons.org/licenses/by/4.0/).
Share and Cite
Miller, S.D.; Person, D.K.; Bowyer, R.T. Efficacy of Killing Large Carnivores to Enhance Moose Harvests: New Insights from a Long-Term View. Diversity 2022, 14, 939. https://doi.org/10.3390/d14110939
Miller SD, Person DK, Bowyer RT. Efficacy of Killing Large Carnivores to Enhance Moose Harvests: New Insights from a Long-Term View. Diversity. 2022; 14(11):939. https://doi.org/10.3390/d14110939
Chicago/Turabian StyleMiller, Sterling D., David K. Person, and R. Terry Bowyer. 2022. "Efficacy of Killing Large Carnivores to Enhance Moose Harvests: New Insights from a Long-Term View" Diversity 14, no. 11: 939. https://doi.org/10.3390/d14110939
APA StyleMiller, S. D., Person, D. K., & Bowyer, R. T. (2022). Efficacy of Killing Large Carnivores to Enhance Moose Harvests: New Insights from a Long-Term View. Diversity, 14(11), 939. https://doi.org/10.3390/d14110939