Article

Complementary Sampling Methods to Improve the Monitoring of Coastal Lagoons

1
Centre of Marine Sciences (CCMAR), University of Algarve, Gambelas Campus, 8005-139 Faro, Portugal
2
Asociación Biodiversidad Atlántica y Sostenibilidad (ABAS), 35214 Telde, Gran Canaria, Spain
3
Grupo en Biodiversidad y Conservación (IU-ECOAQUA), Universidad de Las Palmas de Gran Canaria, 35214 Telde, Gran Canaria, Spain
4
Instituto Português do Mar e da Atmosfera (IPMA), Avenida 5 de Outubro, 8700-305 Olhão, Portugal
*
Author to whom correspondence should be addressed.
Present address: Department of Mathematics and Statistics, University of Strathclyde, Livingstone Tower, 26 Richmond Street, Glasgow G1 1XH, Scotland, UK.
Diversity 2022, 14(10), 849; https://doi.org/10.3390/d14100849
Submission received: 27 July 2022 / Revised: 29 September 2022 / Accepted: 29 September 2022 / Published: 8 October 2022
(This article belongs to the Section Marine Diversity)

Abstract

:
Monitoring the ecological status of marine coastal lagoons requires the integration of multiple indices. However, the efficacy of monitoring programs is complicated by the diverse array of habitats that conform coastal lagoons. In this study, we compared four sampling methods (25-m and 50-m beach seines, beam trawl and Riley push net) in the Ria Formosa coastal lagoon (South Portugal) for assessing fish assemblage and diversity. We compared species richness and assemblage structure with species accumulation curves and multivariate analysis, and assessed diversity patterns using taxonomic, phylogenetic and functional diversity indices. Variation in fish assemblage structure was mostly explained by gear type, and almost all diversity metrics varied not only according to sampling method but also depending on habitat characteristics and season. Based on operational costs and diversity patterns captured by each gear, we conclude that the combined use of 25-m beach seine and beam trawl is the preferred approach. The proposed methodology will provide the data necessary for assessment of ecological status of coastal lagoons.

1. Introduction

Estuaries and sheltered lagoons contain some of the most productive coastal marine habitats such as seagrass beds and salt marshes [1,2]. These ecosystems are essential feeding and nursery grounds for juvenile fishes and invertebrates, including many species with commercial and recreational value [3,4,5,6,7]. However, their long-term monitoring is particularly challenging due to the heterogeneous spatial distribution of species across different habitat types, coupled with seasonal shifts in assemblage structure and diversity [8,9]. Yet, their effective monitoring is fundamental, as an increasing number of anthropogenic threats (e.g., pollution, habitat loss, sea level rise, and overfishing) are degrading the state of these valuable ecosystems [10,11]. Further, in the context of the Water Framework Directive (WFD), member states must establish monitoring programs to provide information on long-term changes for each water body type (lakes, rivers, transitional waters, coastal waters) [12]. Fishes are an important biological component of coastal lagoons, performing key ecological roles that underpin ecosystem productivity and resilience (e.g., top-down control of prey populations, sediment reworking, and nutrient recycling) [13,14,15]. Due to their importance, changes in fish assemblage metrics (e.g., diversity, composition and abundance) are part of the quality elements for the assessment of the ecological status of different water bodies under the WFD.
Until recently, the assessment of fish assemblages in coastal lagoons has mainly focused on traditional taxonomic diversity indices (TD, e.g., species richness, Shannon–Wiener diversity, and Pielou’s evenness) [16]. However, these metrics treat all the species equally without considering their potential contribution to a range of ecosystem functions. In contrast, functional (FD) [17] and phylogenetic (PD) [18] diversity metrics incorporate information on species ecological similarities based on traits (i.e., morphological, ecological, physiological, and behavioural characteristics) and evolutionary information [19,20]. There is growing empirical evidence, in both terrestrial and marine environments, of the importance of these often-overlooked biodiversity components for ecosystem functioning and resilience [21,22,23].
Given the heterogeneity of habitats and seasonal variability in coastal lagoons, sampling their fish assemblages with the appropriate gear or combination of gears is essential for obtaining reliable data for the application of fish-based ecological indicators [24,25,26]. There are a variety of fishing gears for sampling coastal lagoons, so understanding their biases and whether they can replace or complement each other is crucial [27,28]. Beam trawls are fishing gears commonly used not only for commercial fishing activities but also for regular sampling and monitoring of fish communities in estuaries [3,24,29]. This active gear is suitable for sampling large numbers of fish, especially demersal species [30]. Other methods such as beach seines and push nets require different physical characteristics of the study site, since both need access from the shore to shallow waters. Trawls and seines frequently have variable catch efficiency, due to either differences in gear design or gear avoidance by certain fish groups [31]. This sampling bias, together with the fact that estuaries contain highly variable hydrographic and spatial–temporal characteristics, justify the need of multi-method surveys to capture an accurate representation of fish assemblage structure and diversity. Yet, few studies have examined to what extent the inherent bias associated with different sampling methods might undermine the ability of monitoring programs to detect shifts in important but often overlooked functional and phylogenetic diversity components [32].
In the present study, we compared four commonly used sampling methods for coastal lagoon systems—beach seines of 25-m and 50-m, beam trawl and push net—to assess their complementarity in fish assemblage metrics (composition and structure, taxonomic diversity, functional diversity and phylogenetic diversity). Specifically, we hypothesize that these four gears capture different representations of species assemblage and diversity patterns. Other studies have compared different fishing gears to determine their efficiency in sampling species composition and abundance [27,28,29,33], but this study is the first to assess differences among this particular combination of gears using less conventional phylogenetic and functional diversity indices. The results of this work provide useful information for management agencies aiming at identifying which method or combination of methods is more suited to track changes in the ecological status of these valuable but highly threatened ecosystems.

2. Materials and Methods

2.1. Study Site and Sampling Stations

The Ria Formosa is a tidal lagoon extending about 55 km along the south coast of Portugal, consisting of salt marshes, subtidal channels and tidal flats covering a surface area of approximately 170 km2, up to 6 m in depth [4,9]. With tidal elevations of 1.30 and 2.80 m at mean neap tide and spring tide, respectively, the minimum and maximum areas covered by water during spring tides are 14.1 and 63.1 km2 [34]. Since it is located between the sea and the land, this lagoon has distinctive biological, ecological and hydrodynamic features, with a variety of different habitats that can be distinguished based on substrate type (sand, gravel or fine mud), depth, vegetation and distance to the sea [4]. The lagoon has extensive patches of seagrass (Cymodocea nodosa, Zostera marina and Zostera noltii) providing shelter from predators and adverse weather conditions, as well as food sources [9].
Approximately 90% of the area is a natural park corresponding to category V in the International Union for Conservation of Nature (IUCN) classification of protected areas [35,36] and has high ichthyological diversity compared with other equivalent ecosystems [37,38]. This area was integrated as a Natura 2000 site under the Birds and Habitats European Directives [39] and it was also declared a RAMSAR site for conservation of wetlands in 1981 [40]. Nevertheless, several economic activities take place (e.g., fishing, harvesting of bait, aquaculture, tourism, shipping, airport activity), putting pressure on this vulnerable ecosystem [41].
In order to sample the fish fauna in the different habitats present in the Ria Formosa, a variety of sampling methods were tested, and the choice of sampling stations was based on a stratified sampling strategy. Sampling stations were chosen by first dividing the lagoon into three areas with very distinct hydrodynamic characteristics: (1) areas of strong coastal influence, near the inlets and with a strong hydrodynamic regime influenced mostly by coastal waters (closer to barrier islands); (2) interior areas with salt marshes, which correspond to shallow vegetated areas greatly affected by the terrestrial environment and usually dry at low tide; and (3) main and secondary channels, that represent the deepest parts of the Ria Formosa. For these three main areas, 59 sampling stations were chosen based on the types of habitats present and the sampling gear to be used (Figure 1). Habitats were classified according to the presence or absence of vegetation (VEG/UNVEG). Seasons were defined as autumn (AU, from October to December), winter (W, January to March), spring (SP, April to June) and summer (S, July to August). Monthly samples were collected from September 2000 to April 2002, with 37 stations chosen for the 25-m beach seine, 4 stations for the 50-m beach seine, 12 stations used for the beam trawl, and 6 stations for the Riley push net (Table 1). The selection of sampling stations was based on visual surveys of the area and existing aerial photographs and maps [4]. Due to logistic problems, 92% of the target sampling was achieved for the beam trawl, Riley push net and 50-m beach seine, and 84% for the 25-m beach seine. For the latter sampling gear, the main factors affecting sampling were the short period for sampling (could only be done at low tide), the large number of locations, the distances between them, and occasionally, problems such as the net getting stuck, requiring repeating the sample.

2.2. Sampling Gears

2.2.1. Twenty-Five-Meter and Fifty-Meter Beach Seines

The two beach seine nets were deployed at low tides in the margins of the main channels only when the amplitude of the tide was less than 2 m, and during a period of 2 h before and 2 h after the low tide to reduce variability in tidal amplitude between sampling events. One of the beach seine nets was 25-m long, 3.5 high in the middle and was made of 9-mm mesh netting. The net was towed by a boat from one end and by two people on shore from the other end, resulting in an average sampled area of 1087 m2 (based on GPS measurements). The 50-m beach seine was 3.5 m high in the middle and was made of 13 mm mesh [42]. For the setting of the net, one end was held on shore while the net was set in a circle; no towing took place. Based on GPS measurements, the average area sampled was 295 m2, but since 3 replicates were taken at each station and the samples pooled across replicates, the average total area sampled was 885 m2 for each station.

2.2.2. Beam Trawl

A beam trawl 2.6 m wide and 0.45 m high at the mouth was used at low tides in the main channels. The cod end was 10 m long and made of 9-mm mesh netting. Tows of 300 m were performed at 1 knot, resulting in a swept area per tow of 780 m2.

2.2.3. Riley Push Net

The Riley push net was 1.5 m wide and 0.5 m high at the mouth, with a cod end split into two “trouser” legs of 2-mm fine mesh netting. Three 30-m samples were taken at each sampling station within interior areas of the Ria by one person who stood between the two legs of the cod end, resulting in a total swept area of 135 m2.

2.2.4. Processing of Fish Collected

The same method of processing samples was applied for all gears. Invertebrates and species such as seahorses (Hippocampus hippocampus and H. guttulatus) were caught and released alive, while the other fish species were placed immediately after capture in boxes with an ice flurry to minimize suffering and transported to the laboratory for processing. At the laboratory, the fish were sorted, identified to the lowest taxonomic level possible and counted. Total length was measured to the nearest mm. Detailed information about the sampling gears and habitats sampled together with photographs are available in Erzini et al., (2002) [4] (report available upon request).

2.3. Data Analysis

2.3.1. Assemblage Composition and Structure

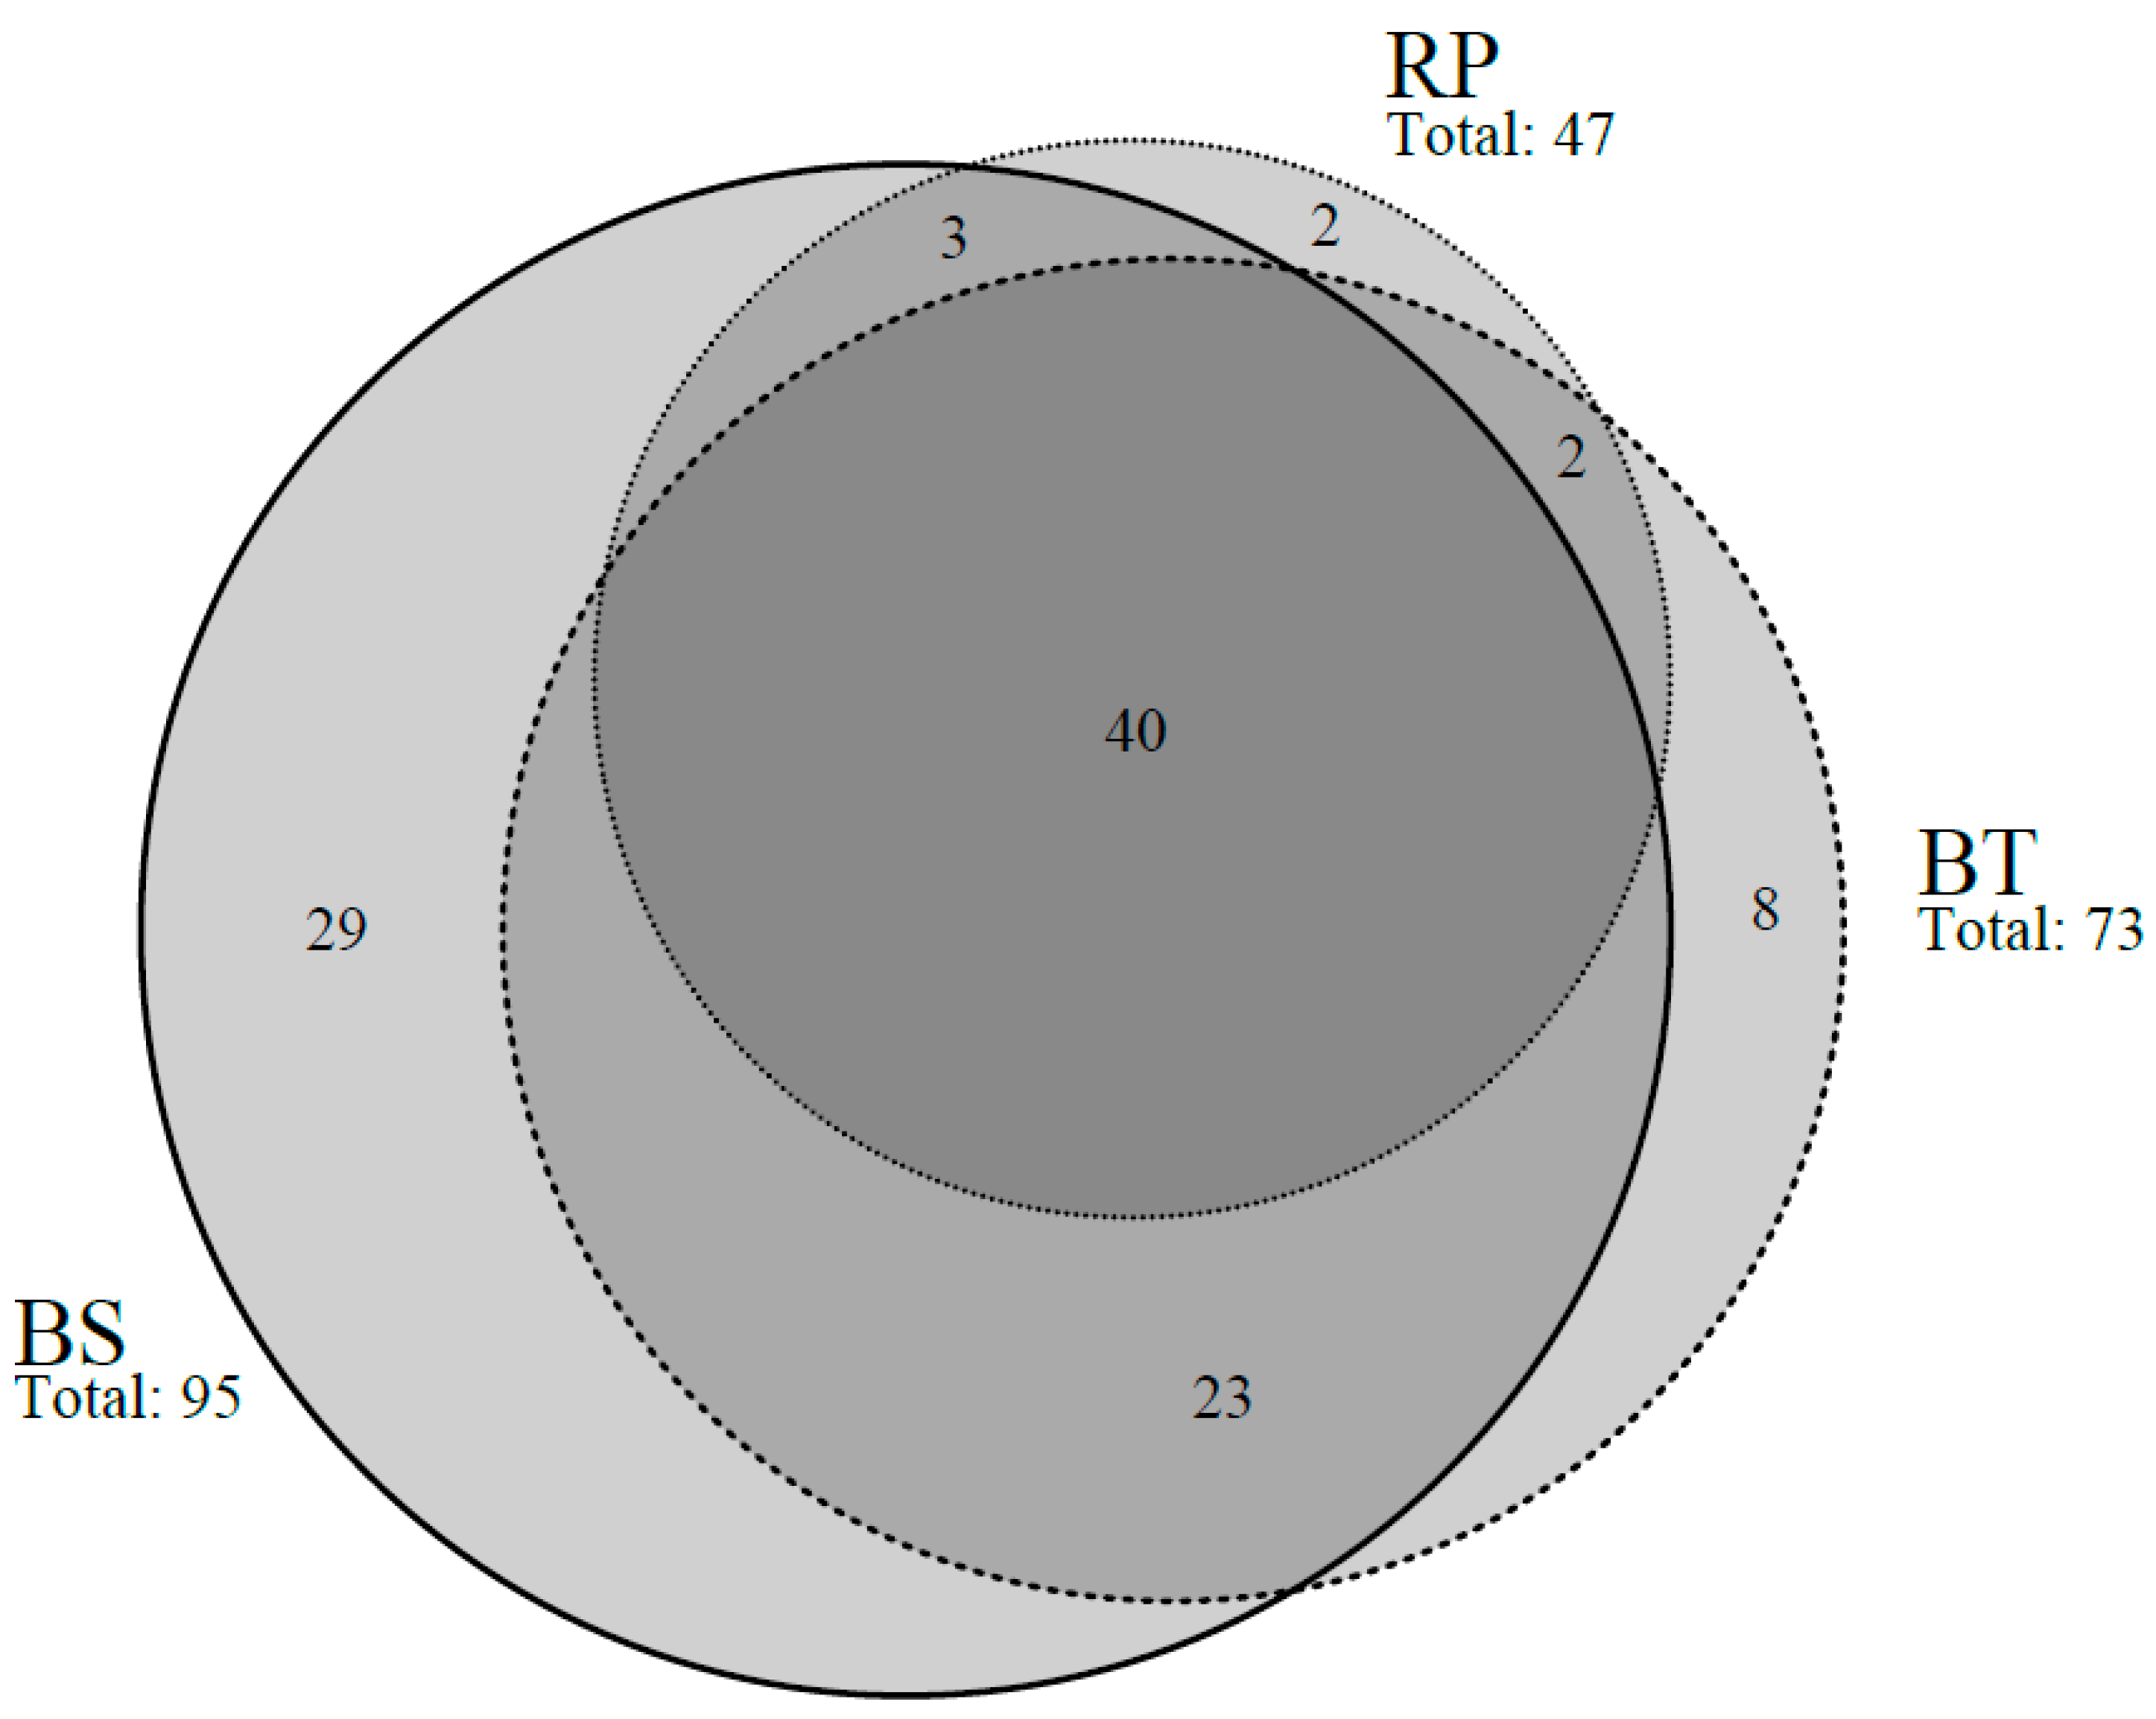
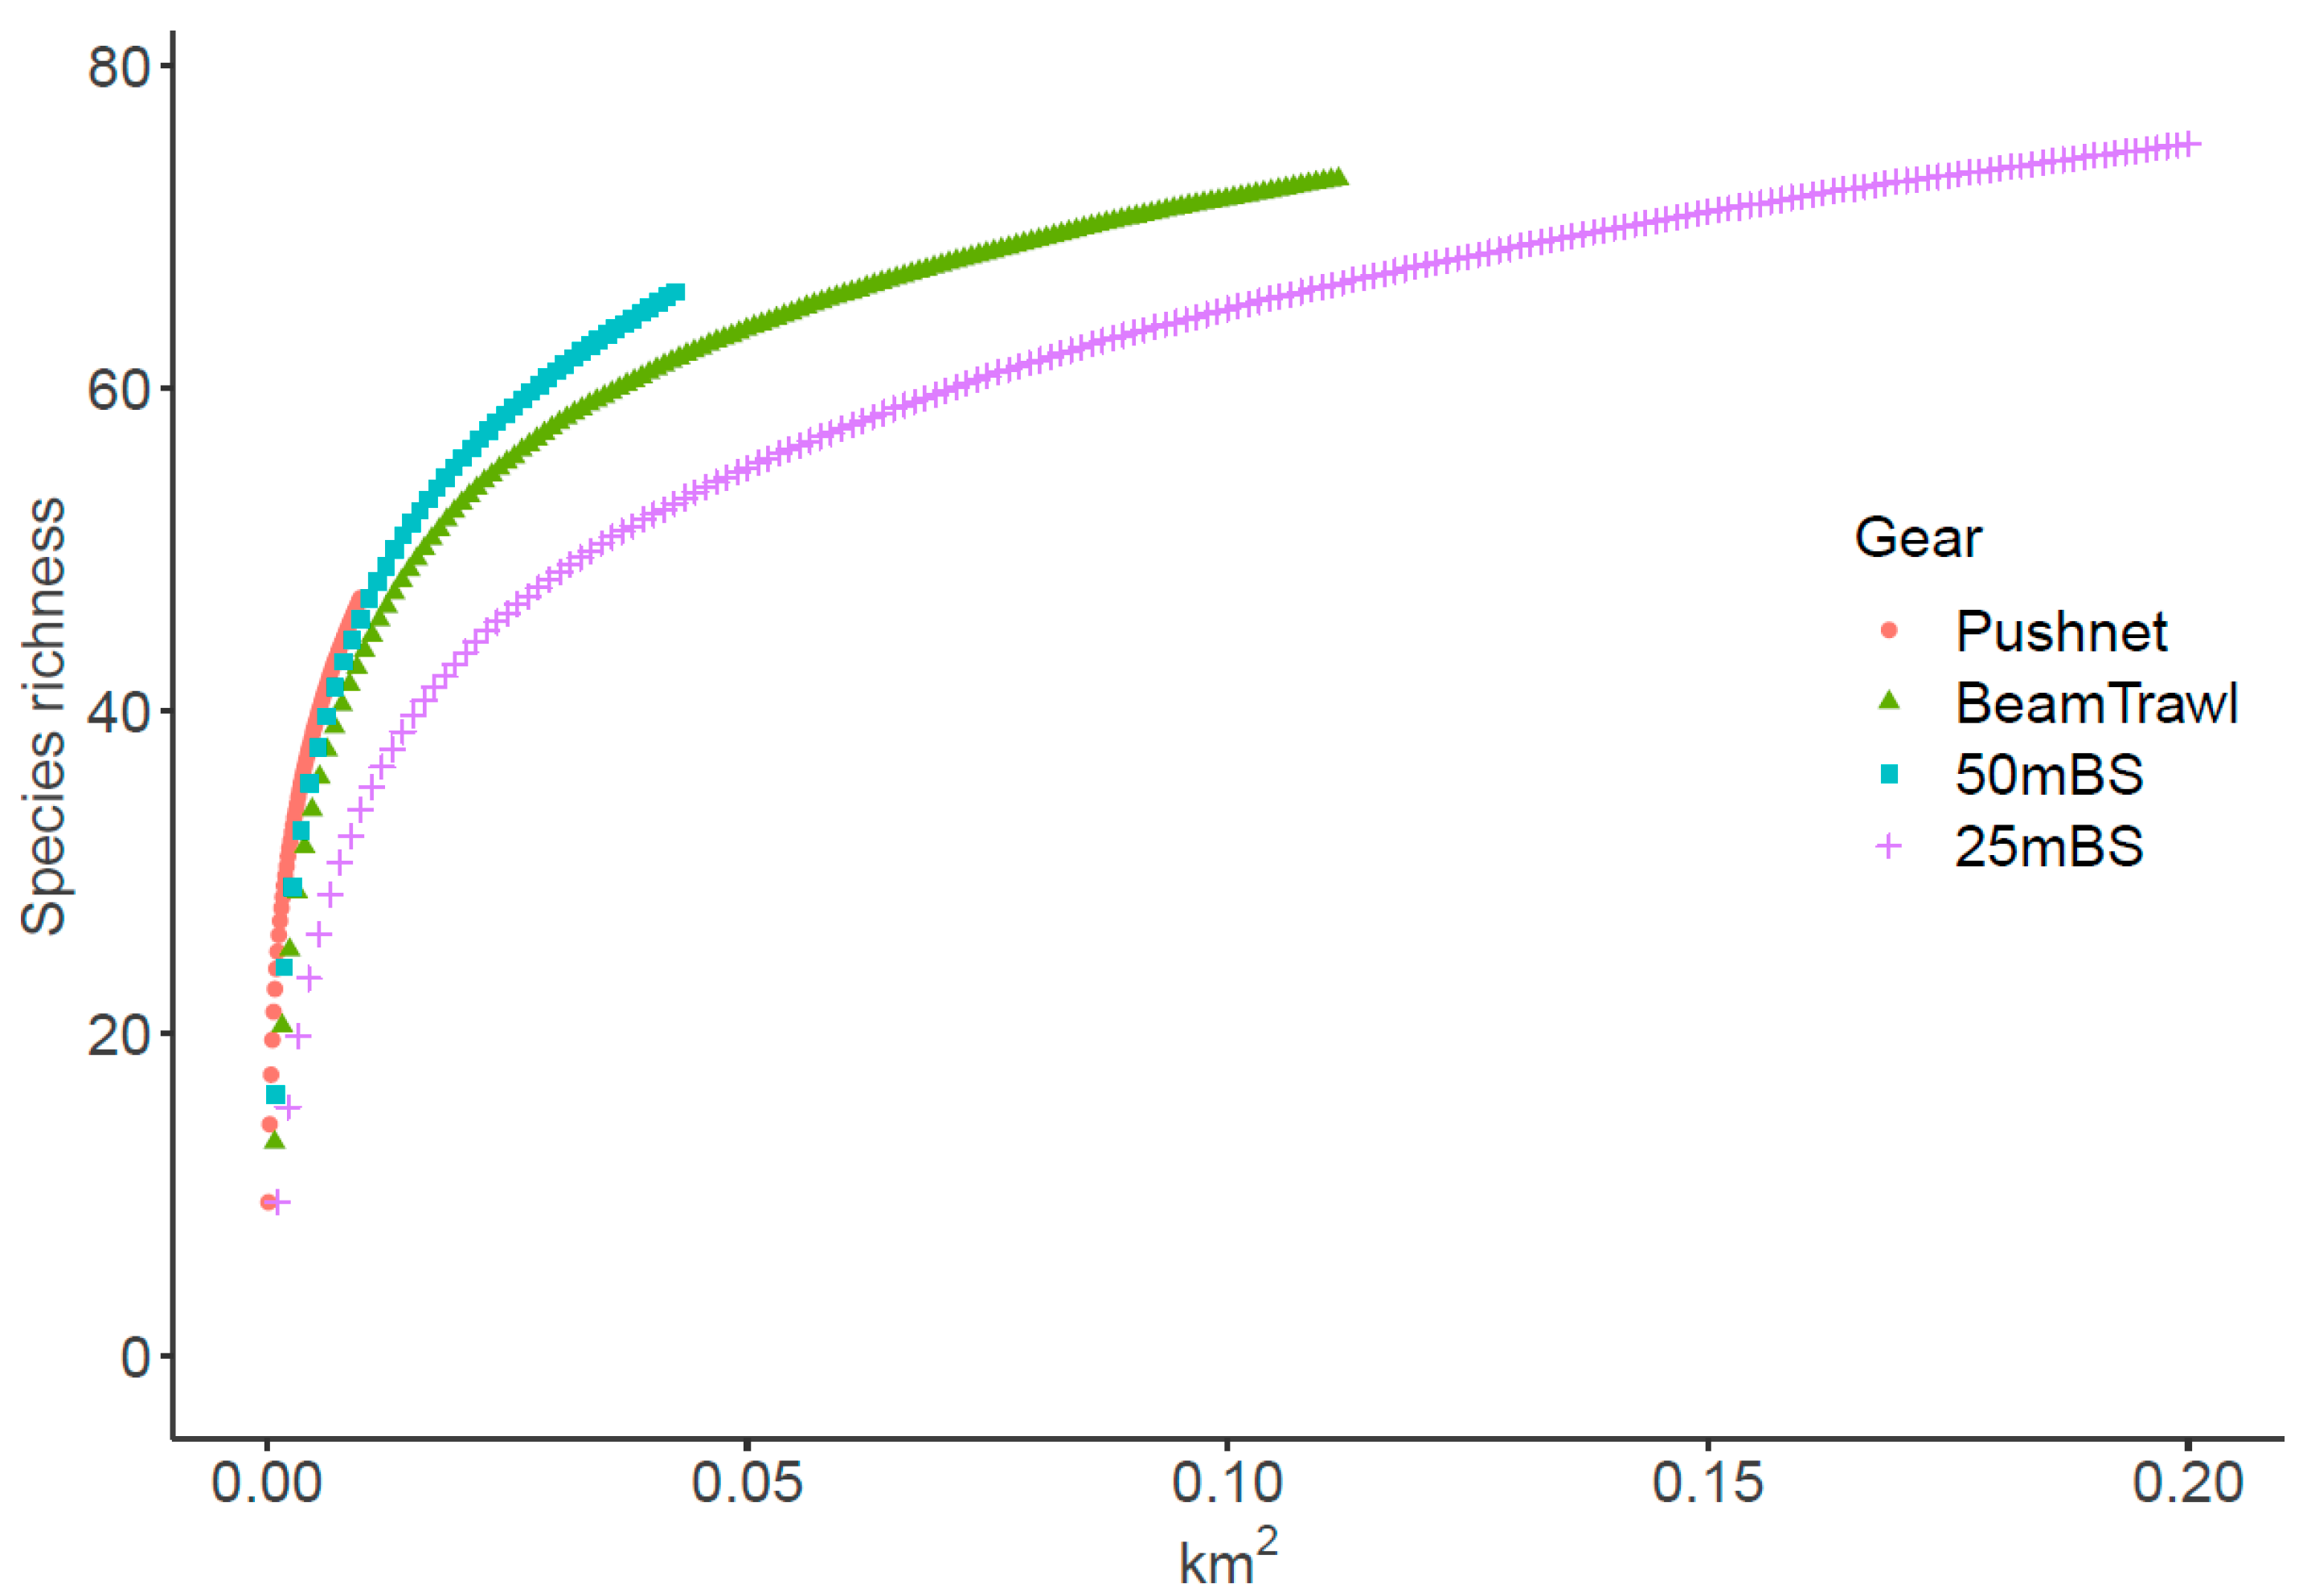
A Euler diagram was constructed in order to compare the overlap in species composition caught by beach seine (25-m and 50-m included in the same group), beam trawl and Riley push net. To estimate the relationship between the number of species observed and the sampling effort as a measure of sampling efficiency of the different gears used, species accumulation curves were computed via sample-based rarefaction [43]. The method calculates the expected species richness for each sample under random order from 1000 permutations of the data, and sampled area was used to standardize effort between sampling methods. For very high sampling efforts, the curves would eventually reach an asymptote matching the assemblage richness available to the method chosen and the more concave-downward the curve, the better sampled the community [44].
A multivariate regression tree (MRT) was constructed to explore the relative influence of sampling gear, season and habitat in explaining fish assemblage structure. MRT is a statistical technique that combines multivariate regression and constrained clustering, since it forms clusters based on a measure of species dissimilarity that are defined by a set of predictor variables [45]. In this case, fish abundance data were partitioned successively in two subsets by selecting one of the factors (gear, season or habitat) that maximizes the homogeneity of the resulting clusters [46]. Each cluster defines a species assemblage and is determined by the associated explanatory factors (gear, season or habitat); this procedure is graphically represented by a tree with nodes where the groups are split and terminal nodes define the final clusters. Optimal tree size was chosen by minimization of cross-validated relative error (CVRE) and smallest tree size. MRT analysis was chosen due to its ability to deal with categorical variables and high-order interactions among explanatory variables [45]. Discriminant species were identified within the tree as species that contribute most for the explained variance at each node. Indicator values (IndVal) were calculated for each species in each terminal group by multiplying a measure of specificity ( A i j , mean abundance of species i in the sites of group j compared to all groups in the study) and a measure of fidelity ( B i j , relative frequency of occurrence of species i in the sites of group j) [47]. This index ranges from 0 (no occurrences of the species within a group) to 1 (the species occurs at all sites within the group and does not occur at any other site). Species with high index values (≥ 0.2) for a cluster were considered indicator species [48]. Species abundance was converted to densities (numbers per sampled area) and standardized by dividing species density at each sampling station by the total density for all species at that same station.

2.3.2. Diversity Indices

For the traditional taxonomic diversity analysis, the following metrics were computed for each sample of each gear: Shannon–Wiener diversity index (H), Pielou’s measure of evenness (J) and species richness (S). Species richness represents counts of the number of species (S). The Shannon–Wiener index is defined as   H = i = 1 S p i   log p i , where pi is the proportional abundance of species i. Pielou’s index measures how evenly the fish are distributed among the different species and is calculated as   J = H / log   S . Abundance data was converted to densities (number per sampled area) before calculation of the indices and square root transformation used to balance the contribution of dominant and rare species.
As a metric of phylogenetic diversity, the index of taxonomic distinctness (∆*) was chosen and is defined as the average taxonomic path length between two individuals chosen at random from the sample, traced through a standard Linnean classification tree, conditional on them being from different species [49]. It is calculated by dividing taxonomic diversity (∆) by the Simpson index and is not affected by the evenness properties of the species abundance matrix. This phylogenetic diversity index takes the form: Δ * = i < j   ω i j   x i   x j / i < j   x i   x j , where ω represents taxonomic distances among taxa, x are species abundances and the double summation goes over species i and j [50]. Taxonomic distances were calculated among taxa at variable step lengths based on an aggregation matrix by species, genus, family and order. Species abundance matrices were transformed to square root density data and ∆* calculated for each sample.
The functional diversity (FD) was measured by the Rao index of functional diversity which represents the probability that, choosing two random species from the sample, they have different trait values or trait categories [51]. The Rao index combines matrixes of species abundances with matrixes of species dissimilarities based on traits’ differences among species [52] and is defined as F D = i = 1 S j = 1 S d i j p i p j , where S is the number of species, pi and pj are the proportion of ith and jth species and dij the dissimilarity between species i and j. Following Bosch et al., (2017, 2021) [32,53], maximum body length, trophic breadth and trophic level were included as continuous (scaled between 0 and 1), while trophic group, water column position, preferred substrate and body shape were considered as categorical traits, using fuzzy coding for traits with more than 2 categories (Table 2). Information on traits was collected from the published literature and Fishbase [54], and when species specific attributes were not available, values from species within the same genus and geographic range were used. The Rao index was calculated using the Macro excel file “FunctDiv.exl” [51] on density data (numbers per sampled area), first for each trait and then averaged for each sample across all traits together.
We tested for differences in diversity indices between sampling gears, season, habitat characteristics (vegetated and unvegetated), and main area using generalized linear models (GLM), applied for each diversity index independently. Second order interactions were included between gear-vegetation, and gear-season. The area consisted of 3 factors: inner, channels and outer areas (I, C and O in Figure 1), and there was no interaction included between gear-area since not all gears were used for all the three areas. The following error distributions were fitted: Poisson distribution for species richness (S) with log link function; normal distribution to species diversity (H), species evenness (J) and functional diversity (FD) (identity link function); and gamma distribution to phylogenetical diversity (PD) (identity link function).
All analyses were carried out using R statistical software version 3.6.0 [56]. The packages ‘vegan’ [57] and ‘biodiversityR’ [58] were used for computing species accumulation curves and calculation of diversity indices (except for the Rao index of functional diversity). The multivariate regression tree (MRT) and species indicator values were calculated with the packages ‘mvpart’ and ‘MVPARTwrap’ [59]). GLMs were conducted with the ‘stats’ package from base R for model evaluation and residuals analysis.

3. Results

3.1. Assemblage Structure

During this study, a total of 255,345 fish belonging to 106 species within 33 families (103 teleosts and 3 chondrichthyes) were captured. Atherina spp., Sardina pilchardus, Gobius niger and Pomatoschistus microps represented 70% (range of 42 to 94%) of the total catches across gears (Supplementary Materials, Table S1). In terms of species composition, there was considerable overlap between the different gears (40 species; Figure 2). Beach seines and beam trawl shared the highest number of species (23 species), while beam trawl—push net and beach seines—push net shared only 2 and 3 species, respectively. Beach seines accounted for 29 species that were not caught by the other gears, mainly species of the Sparidae, Labridae and Triglidae families. The beam trawl caught eight species that none of the other gears captured, with Soleidae being the most representative family (>85% abundance). Two species were only caught by Riley push net, Dentex macrophthalmus and Parablennius sanguinolentus, with forty-five species caught in common with the other gears.
Overall, only the 25-m BS curve was close to reaching the asymptote, having by far the highest cumulative sampled area (Figure 3). Nevertheless, for comparable sampling efforts (e.g., less than 0.05 km2), both the 50-m beach seine and beam trawl caught more species than the 25-m beach seine. The species accumulation curve for the Push net is difficult to distinguish from the others due to low sampling effort.
The best multivariate regression tree explaining variation in fish assemblage structure consisted of four nodes and five leaves (terminal nodes; Figure 4). This model explained 27.22% of the variation in species abundances. The first split in the tree explained 15.87% of the variability and separated the fish assemblage according to two combinations of fishing gears—beam trawl-push net, and 25-m and 50-m beach seine, for which the main species contributing to explaining this split belonged to the genus Atherina spp. The second node separated the assemblage between the other pair of sampling gears (push net and beam trawl). For the 25-m BS-50-m BS cluster (right side of node 1), the species assemblage was divided according to season, with Summer (S) containing a distinct assemblage when compared with the rest of the seasons. On the left side of the main node, the last split between Habitat types explained 4.57% of variation, with habitats containing vegetation (VEG) clearly distinct from non-vegetated (UNVEG).
Overall, five distinct assemblages were identified, each one with a different set of indicator species. The first and second clusters were defined by samples obtained only with the Riley push net; the first group (I) is dominated by the common sand goby (Pomatoschistus microps) in sandy/muddy grounds; and the second group (II) contains three species of pipefish (Syngnathus typhle, S. abaster and Nerophis ophidion), Baillon’s wrasse (Symphodus bailloni), rock goby (Gobius paganellus) and the two-spotted clingfish (Diplecogaster bimaculata) in seagrass habitats. The third assemblage (III) is defined by species captured with beam trawl and the analysis did not separate at the habitat level, with toadfish (Halobatrachus didactylus), two goby species (black goby, Gobius niger, and sand goby, Pomatoschistus minutus), two seahorse species (Hippocampus guttulatus and H. hippocampus), the grey wrasse (Symphodus cinereus), the small red scorpionfish (Scorpaena notata), and the flatfish Arnoglossus thori representing the indicator species for this assemblage. The last two groups (IV and V) were classified by samples collected both with the 25-m and 50-m beach seines, and the only split was defined by season. The summer assemblage was dominated by five sea bream species (black seabream, Spondyliosoma cantharus, Senegal seabream, Diplodus bellottii, White seabream, D. sargus, two-banded seabream, D. vulgaris, and gilt-head seabream, Sparus aurata), European pilchard (Sardina pilchardus), striped red mullet (Mullus surmuletus) and the European bass (Dicentrarchus labrax). In the other seasons, only the resident silverside species was identified as indicator species (Atherina spp.).

3.2. Diversity Indices

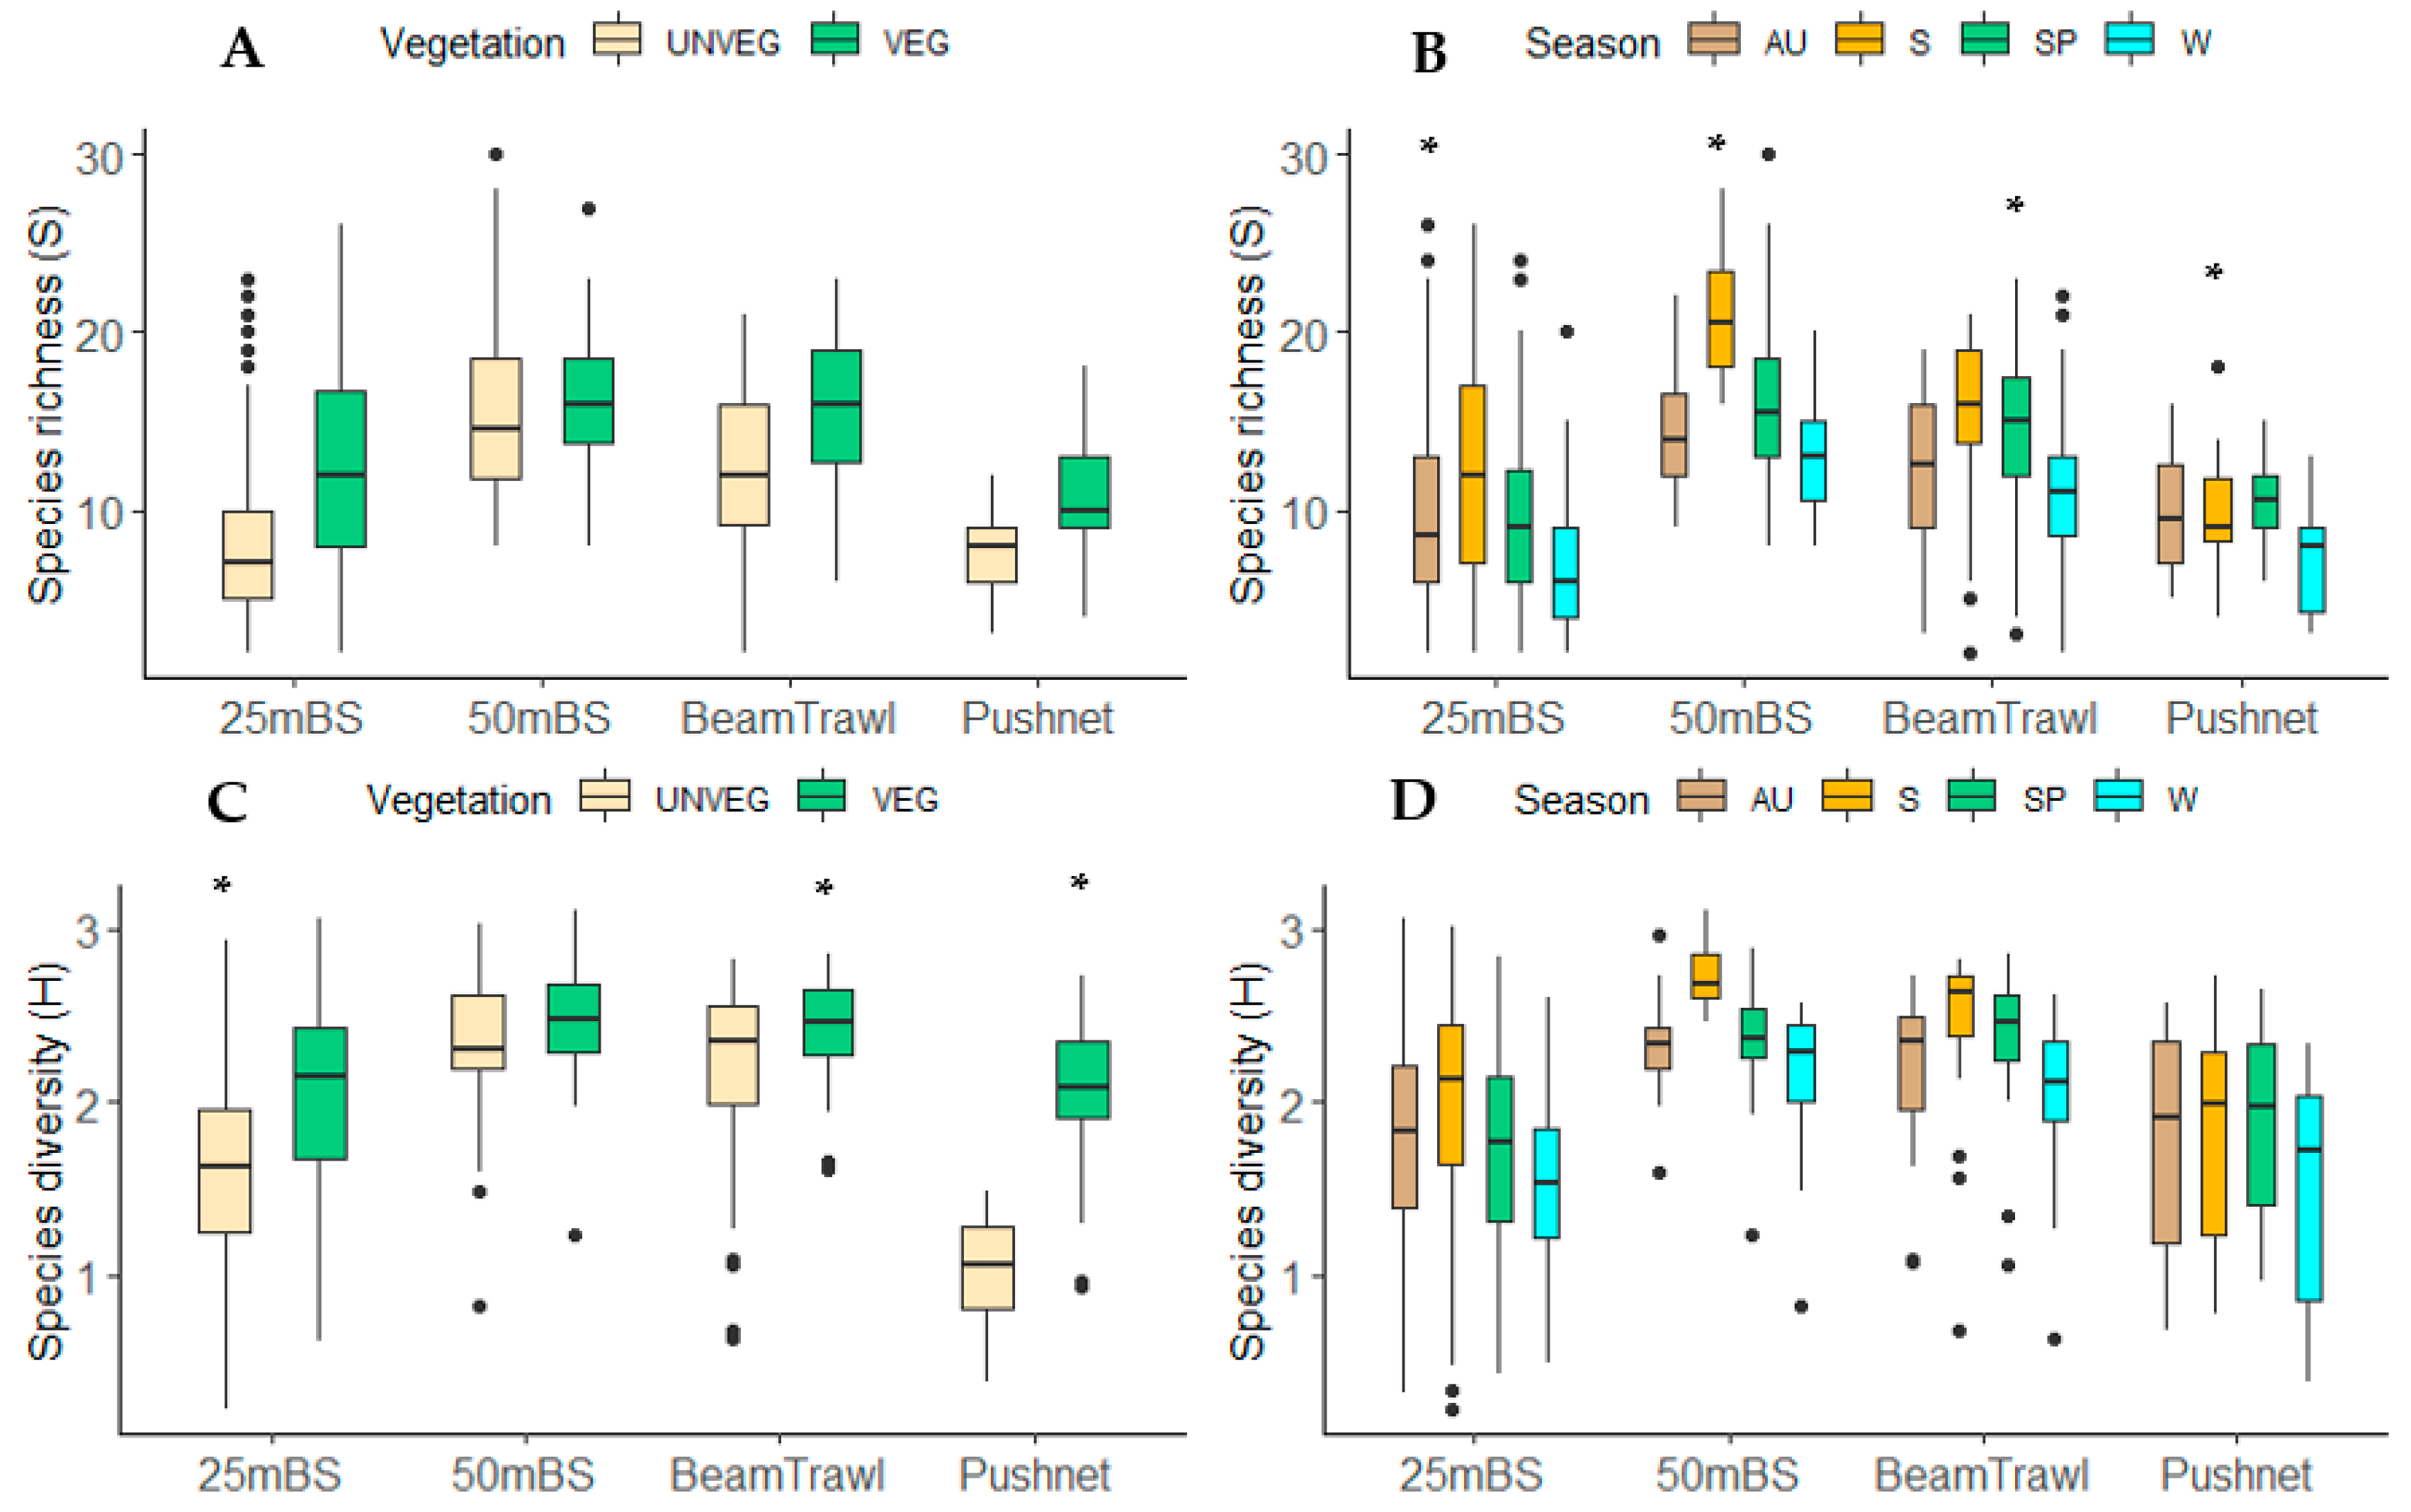
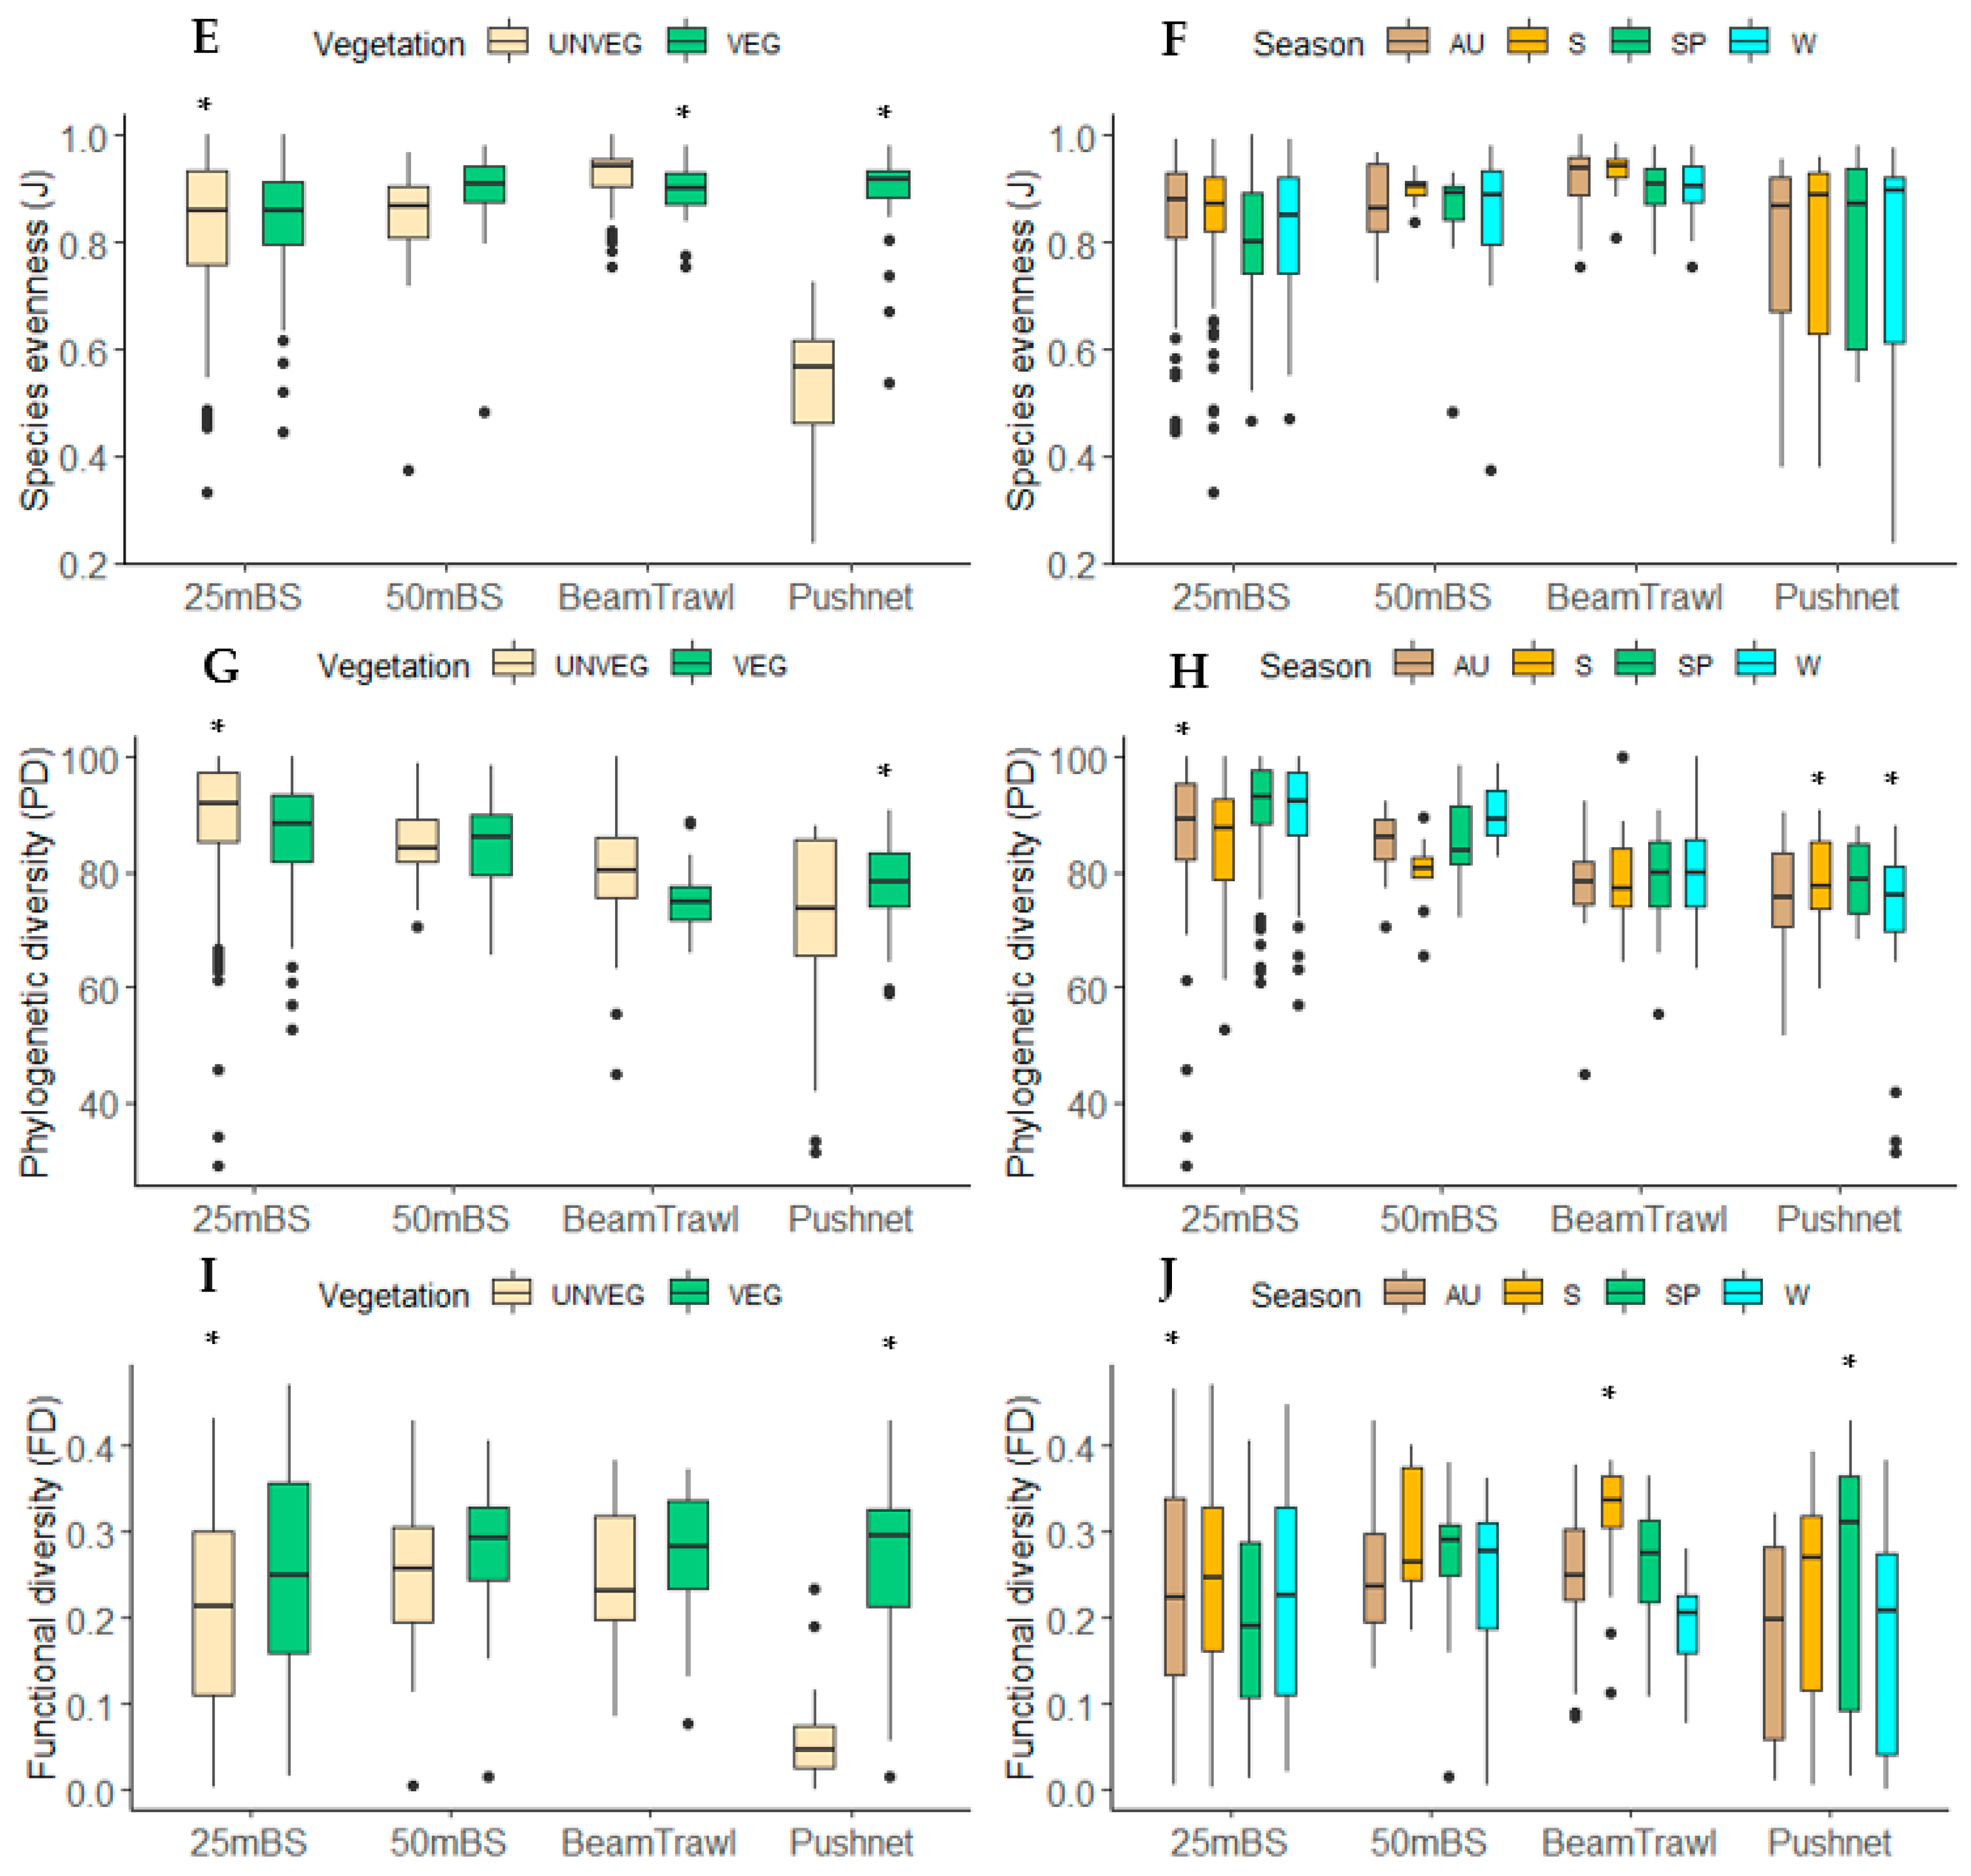
There were clear differences in all diversity measures between sampling gears, presence of vegetation and season (Figure 5, Table S2 in Supplementary Materials). In terms of species richness, the highest values were for the 50-m beach seine (50-m BS) and beam trawl (BT) (panel A). Habitats with vegetation sampled with any of the four gears showed higher species richness than unvegetated locations. There were higher values of species richness (S) for 25-m BS, 50-m BS and beam trawl during summer months, and lower values for all gears in winter (panel B in Figure 5; Table S2). For species diversity represented by the Shannon–Wiener index (H), the highest values were registered for 50-m BS and beam trawl (panels B and C). There were also higher values of H for vegetated locations compared to unvegetated locations, and higher values of H for stations sampled during summer months (particularly 50-m BS), and lower values of H during the winter period. There is a distinct effect of sampling vegetated habitats with push net, with high values of H when compared with habitats without vegetation sampled with 25-m BS (p-value < 0.0001; Table S2). With regard to species evenness (J), there were slightly higher values for BT, and very low values for samples collected with push net in unvegetated locations (panels E and F). There was not an obvious effect of season, only slightly lower values for samples collected in spring with 25-m BS, and samples collected by push net had high variability. In terms of phylogenetic diversity (PD), 25-m BS had highest values (panels G and H). The GLM detected a significant interaction between push net and vegetation, meaning that vegetated habitats sampled with push net had higher phylogenetic diversity than unvegetated stations with 25-m BS. For functional diversity (FD), there were no major differences between sampling gears (panels I and J). There were higher values of FD in vegetated habitats sampled with any of the four gears, and there was a strong effect of sampling with push net in vegetated habitats compared with unvegetated. Summer and spring months show slightly higher values of FD but this is not very clear for samples collected with 25-m BS and 50-m BS.

4. Discussion

For the development and implementation of monitoring programs in estuaries and coastal lagoons, it is necessary to select the most adequate sampling methods for detecting spatiotemporal changes in species composition, abundance, and diversity, while also minimizing the costs and damage to the local assemblages of these sensitive ecosystems [28,32]. Here, we showed that the use of complementary sampling gears suitable for particular habitat types within a coastal lagoon capture a wide range of ichthyofaunal diversity that has been linked to the ecological status and the functioning of these highly productive ecosystems [60].
A strong seasonal influence was found in previous studies in the Ria Formosa, where the fish assemblage richness and abundance increased with the recruitment of marine juvenile migrant individuals during spring and summer into the lagoon [42,61,62]. This might explain the identification of two assemblages distinguished by season in the MRT and a significant effect of season in the GLMs in terms of species richness and diversity. Furthermore, different habitats had distinct characteristics not only in terms of type of substrate, but also depth at low tide, hydrodynamics and distance to the openings of the sea, environmental factors that play a strong role in structuring ichthyofauna diversity and abundance in the Ria Formosa [4]. For example, Ribeiro et al., (2012) [63] found that sampling with Riley push net in vegetated habitats resulted in higher species richness and diversity than unvegetated habitats, where higher densities of fewer species were encountered. This gives support to the results, where a distinct assemblage was identified (cluster II in MRT and significant interactions in the GLMs) characterized by species living in vegetated habitats that were sampled with the push net. Similar outcomes of seagrass and saltmarsh habitats containing maximum diversity and richness were found in other studies [9,37].
Not all diversity metrics (species richness, species evenness, Shannon entropy, taxonomic distinctness, and Rao’s quadratic entropy for functional diversity) varied significantly between sampling gears (Table S2). The results show no significant differences in terms of functional diversity between 25-m beach seine and beam trawl, despite the latter having higher values of species richness and diversity (p-value > 0.05). This could be because of a large range of FD values across samples, especially for the 25-m beach seine. This variation can also be explained by the nature of each gear itself; some gears are more efficient in sampling particular habitats or species with particular functional traits than others. The beach seines are more efficient in sampling small pelagics since they fish the entire water column, particularly the 50-m beach seine (highest species accumulation rate, Figure 3), while the beam trawl catches mostly benthic and epibenthic species since it operates close to the seafloor. The Riley push net captures a large portion of small individuals, being most efficient for sampling juveniles of commercial species [63]. In fact, the beam trawl was used to sample the main deeper channels in the lagoon and captured mainly benthic species, while the beach seines were deployed in the secondary channels and caught more benthopelagic species, belonging to Sparidae and Labridae families. In addition, the deployment methods of the two beach seines differed, with the 50-m used to encircle while the 25-m net was first towed along the shore before being hauled to land. However, the analysis did not show significant differences between these two gears.
Each index gave a distinct picture of the fish assemblage, with only a few similar comparisons between gears across indices. This shows the importance of considering alternative measures of diversity [32]. Other studies have found that functional diversity can be positively related with species richness and diversity [64], but this relationship is not always positive and linear [52]. Phylogenetic diversity and species richness also display different patterns of diversity and do not seem to be correlated [65,66]. Functional traits may change with species ontogenetic shifts, especially in areas that contain different life stages [67]. However, information on trait variability for the life stages of all species included in the analysis was not available but should be accounted for in future studies. Indices based on biomass can be useful complements to those based on abundance, especially for revealing different insights into temporal trends of functional diversity [68], but this is outside the scope of this study. Following the Water Quality European Standard from 2006, the recommended methodology for sampling species composition and abundance in generic transitional waters such as the Ria Formosa is with the beam trawl [69]. However, as found in our comparative study, other sampling gears such as beach seines and push net provide different representations of the fish assemblage, particularly when different dimensions of diversity (FD and PD) are incorporated. Even though the beam trawl samples contained higher species richness and diversity, they had lower phylogenetic diversity. For sampling with a push net, the fish assemblage changed drastically between habitats with and without vegetation and could only be operated at specific locations. As such, a combination of 25-m beach seine and beam trawl might be an effective sampling strategy to cover multiple aspects of diversity. As in Rotherham et al., (2012) [33], each gear used (beam trawl and multi-mesh gillnets) gave a unique picture of assemblages of fauna, so the most complete representation of the entire fish community required sampling with both methods. Several multi-metric fish indices use distinct sampling gears [25]. In Ireland for example, a standard multi-method approach (beach seine, fyke nets and beam trawl) is used in transitional waters for the implementation of the WFD and the development of an estuarine multi-metric fish index [70].
When designing a monitoring plan, the relative costs of deploying each sampling gear need to be taken into account (e.g., human resources, environmental impacts, time and financial expenditures). For this study, all the sampling gears required transport by boat to the sampling locations. The Riley push net required only one person to operate, while the beam trawl needed the skipper to navigate the boat and deploy the gear, and at least another person to help record data, label and store the catches. The beach seines demanded more human power (skipper and three people) to haul the nets and process the catches, particularly the 50-m beach seine. Additionally, the beam trawl operates with heavy ground gear that drags along the lagoon floor and disturbs bottom habitats. On the other hand, the beach seines need to be hauled by a group of people that were occasionally stepping on the seagrass patches which can damage these sensitive habitats. Although operating the beach seines was more labour intensive, these gears allowed sampling of a greater variety of habitats. In contrast, the beam trawl and push net were limited to the deeper channels and the shallow creeks, respectively.

5. Conclusions

Given the heterogeneity of habitats, variability among sampling gears, and seasonal effects, the use of a multi-gear approach would provide a robust assessment of the fish assemblage structure in coastal lagoons as the Ria Formosa. Combining the 25-m beach seine and beam trawl might be the most advantageous strategy given the limitations of sampling with a push net and the operational costs of the 50-m beach seine. This work thus contributes with new knowledge that adds to current guidance on selection of fish sampling methods in coastal lagoons, an essential parameter for the assessment of ecological status and biodiversity conservation of these ecosystems. This information is of paramount importance for implementing policies and management plans at local, regional, and national level to meet the objectives set out in the UN Sustainable Development Goals under the 2030 agenda.

Supplementary Materials

The following supporting information can be download at https://www.mdpi.com/article/10.3390/d14100849/s1, Table S1: All species identified and counted for each gear; Table S2: Generalized linear model results.

Author Contributions

Conceptualization, K.E.; formal analysis, A.C.A.; funding acquisition, K.E.; investigation, L.B., R.C., P.G.L., P.M. and J.M.S.G.; methodology, L.B., R.C., P.G.L., P.M. and J.M.S.G.; project administration, K.E.; software, A.C.A. and N.E.B.; supervision, K.E.; validation, N.E.B.; visualization, A.C.A. and L.B.; writing—original draft, A.C.A.; writing—review and editing, N.E.B. and K.E. All authors have read and agreed to the published version of the manuscript.

Funding

This study received funds from the Commission of the European Communities (DG XIV C1/99/061) and Portuguese national funds from FCT—Foundation for Science and Technology through projects UIDB/04326/2020, UIDP/04326/2020 and LA/P/0101/2020.

Institutional Review Board Statement

At the time when the fieldwork was conducted (2000–2002), there was no code of practice to handle live animals, but the handling practices included the 3R approach (“Replacement, Reduction and Refinement”) through subsampling highly abundant fish species, releasing of animals in good condition and practices for minimizing suffering and pain of animals. Permits authorizing the sampling of fish in the Ria Formosa lagoon were obtained from the Institute for the Conservation of Nature and Forests (ICNF), the Ria Formosa Natural Park (PNRF) and Port of Faro Maritime Authority (CPF/CPO/IPTM).

Data Availability Statement

Data requests should be addressed to the corresponding author.

Acknowledgments

We thank Isidoro Costa (CCMAR) for the construction of the sampling gears and for the boat-based sampling. We are also grateful to the many students who helped with the field and laboratory work.

Conflicts of Interest

The authors declare no conflict of interest.

References

  1. Whitfield, A.K. The role of seagrass meadows, mangrove forests, salt marshes and reed beds as nursery areas and food sources for fishes in estuaries. Rev. Fish Biol. Fish. 2016, 27, 75–110. [Google Scholar] [CrossRef]
  2. Unsworth, R.K.; Nordlund, L.M.; Cullen-Unsworth, L.C. Seagrass meadows support global fisheries production. Conserv. Lett. 2018, 12, e12566. [Google Scholar] [CrossRef]
  3. Abookire, A.; Piatt, J.; Robards, M. Nearshore Fish Distributions in an Alaskan Estuary in Relation to Stratification, Temperature and Salinity. Estuar. Coast. Shelf Sci. 2000, 51, 45–59. [Google Scholar] [CrossRef]
  4. Erzini, K.; Bentes, L.; Coelho, R.; Correia, C.; Lino, P.G.; Monteiro, P.; Ribeiro, J.; Gonçalves, J.M.S. Recruitment of Sea Breams (Sparidae) and Other Commercially Important Species in the Algarve (Southern Portugal); REF. NO. 99/061, Final Report. Commission of the European Communities DG XIV/C/1; 2002; 265p. Available online: https://ec.europa.eu/info/departments/maritime-affairs-and-fisheries_en (accessed on 1 July 2022).
  5. Lazzari, M.A.; Tupper, B. Importance of Shallow Water Habitats for Demersal Fishes and Decapod Crustaceans in Penobscot Bay, Maine. Environ. Biol. Fishes 2002, 63, 57–66. [Google Scholar] [CrossRef]
  6. Seitz, R.D.; Wennhage, H.; Bergström, U.; Lipcius, R.N.; Ysebaert, T. Ecological value of coastal habitats for commercially and ecologically important species. ICES J. Mar. Sci. 2013, 71, 648–665. [Google Scholar] [CrossRef] [Green Version]
  7. Nordlund, L.M.; Unsworth, R.K.F.; Gullström, M.; Cullen-Unsworth, L.C. Global significance of seagrass fishery activity. Fish Fish. 2017, 19, 399–412. [Google Scholar] [CrossRef] [Green Version]
  8. Travers, M.J.; Potter, I.C. Factors influencing the characteristics of fish assemblages in a large subtropical marine embayment. J. Fish Biol. 2002, 61, 764–784. [Google Scholar] [CrossRef]
  9. Ribeiro, J.; Bentes, L.; Coelho, R.; Gonçalves, J.M.; Lino, P.G.; Monteiro, P.; Erzini, K. Seasonal, tidal and diurnal changes in fish assemblages in the Ria Formosa lagoon (Portugal). Estuar. Coast. Shelf Sci. 2006, 67, 461–474. [Google Scholar] [CrossRef]
  10. Halpern, B.S.; Selkoe, K.A.; Micheli, F.; Kappel, C.V. Evaluating and Ranking the Vulnerability of Global Marine Ecosystems to Anthropogenic Threats. Conserv. Biol. 2007, 21, 1301–1315. [Google Scholar] [CrossRef]
  11. Vasconcelos, R.P.; Reis-Santos, P.; Fonseca, V.; Maia, A.; Ruano, M.; França, S.; Vinagre, C.; Costa, M.J.; Cabral, H. Assessing anthropogenic pressures on estuarine fish nurseries along the Portuguese coast: A multi-metric index and conceptual approach. Sci. Total Environ. 2007, 374, 199–215. [Google Scholar] [CrossRef]
  12. European Parliament and Council. Directive 2000/60/EC of the European Parliament and of the Council of 23 October 2000 establishing a framework for Community action in the field of water policy. Off. J. Eur. Communities L 2000, 327, 72. [Google Scholar]
  13. Jackson, J.B.C.; Kirby, M.X.; Berger, W.H.; Bjorndal, K.A.; Botsford, L.W.; Bourque, B.J.; Bradbury, R.H.; Cooke, R.; Erlandson, J.; Estes, J.A.; et al. Historical Overfishing and the Recent Collapse of Coastal Ecosystems. Science 2001, 293, 629–637. [Google Scholar] [CrossRef] [Green Version]
  14. Grant, J. The relative magnitude of biological and physical sediment reworking in an intertidal community. J. Mar. Res. 1983, 41, 673–689. [Google Scholar] [CrossRef]
  15. Allgeier, J.E.; Yeager, L.; Layman, C.A. Consumers regulate nutrient limitation regimes and primary production in seagrass ecosystems. Ecology 2013, 94, 521–529. [Google Scholar] [CrossRef] [Green Version]
  16. Heip, C.H.R.; Herman, P.M.J.; Soetaert, K. Indices of diversity and evenness. Océanis 1998, 24, 61–87. [Google Scholar]
  17. Villéger, S.; Mason, N.W.H.; Mouillot, D. New multidimensional functional diversity indices for a multifaceted framework in functional ecology. Ecology 2008, 89, 2290–2301. [Google Scholar] [CrossRef] [Green Version]
  18. Cadotte, M.W.; Davies, T.J.; Regetz, J.; Kembel, S.; Cleland, E.; Oakley, T. Phylogenetic diversity metrics for ecological communities: Integrating species richness, abundance and evolutionary history. Ecol. Lett. 2010, 13, 96–105. [Google Scholar] [CrossRef]
  19. Petchey, O.L.; Gaston, K.J. Functional diversity: Back to basics and looking forward. Ecol. Lett. 2006, 9, 741–758. [Google Scholar] [CrossRef]
  20. Villéger, S.; Miranda, J.R.; Hernández, D.F.; Mouillot, D. Contrasting changes in taxonomic vs. functional diversity of tropical fish communities after habitat degradation. Ecol. Appl. 2010, 20, 1512–1522. [Google Scholar] [CrossRef]
  21. Flynn, D.F.B.; Mirotchnick, N.; Jain, M.; Palmer, M.I.; Naeem, S. Functional and phylogenetic diversity as predictors of biodiversity–ecosystem-function relationships. Ecology 2011, 92, 1573–1581. [Google Scholar] [CrossRef] [Green Version]
  22. Mouillot, D.; Graham, N.A.; Villéger, S.; Mason, N.W.; Bellwood, D.R. A functional approach reveals community responses to disturbances. Trends Ecol. Evol. 2013, 28, 167–177. [Google Scholar] [CrossRef] [PubMed]
  23. Bosch, N.E.; McLean, M.; Zarco-Perello, S.; Bennett, S.; Stuart-Smith, R.D.; Vergés, A.; Pessarrodona, A.; Tuya, F.; Langlois, T.; Spencer, C.; et al. Persistent thermally driven shift in the functional trait structure of herbivorous fishes: Evidence of top-down control on the rebound potential of temperate seaweed forests? Glob. Chang. Biol. 2022, 28, 2296–2311. [Google Scholar] [CrossRef] [PubMed]
  24. Cabral, H.; Fonseca, V.; Gamito, R.; Gonçalves, C.; Costa, J.; Erzini, K.; Gonçalves, J.; Martins, J.; Leite, L.; Andrade, J.; et al. Ecological quality assessment of transitional waters based on fish assemblages in Portuguese estuaries: The Estuarine Fish Assessment Index (EFAI). Ecol. Indic. 2012, 19, 144–153. [Google Scholar] [CrossRef]
  25. Pérez-Domínguez, R.; Alvarez, M.C.; Borja, A.; Cabral, H.; Courrat, A.; Elliott, M.; Fonseca, V.; Franco, A.; Gamito, R.; Garmendia, J.M.; et al. Deliverable D4.4–5: Precision and Behaviour of Fish-Based Ecological Quality Metrics in Relation to Natural and Anthropogenic Pressure Gradients in European Estuaries and Lagoons. Water Bodies in Europe: Integrative Systems to Assess Ecological Status and Recovery (WISER), Seventh Framework Programme Collaborative Project (Large-Scale Integrating Project), Grant Agreement 226273, 2012, 71p. Final Report. Available online: https://repositorio.ul.pt/bitstream/10451/37777/1/MARE_ULisboa_WISER_D4.4-5.pdf (accessed on 1 July 2022).
  26. Coates, S.; Waugh, A.; Anwar, A.; Robson, M. Efficacy of a multi-metric fish index as an analysis tool for the transitional fish component of the Water Framework Directive. Mar. Pollut. Bull. 2007, 55, 225–240. [Google Scholar] [CrossRef]
  27. Dembkowski, D.J.; Wuellner, M.R.; Willis, D.W. Sampling Glacial Lake Littoral Fish Assemblages with Four Gears. N. Am. J. Fish. Manag. 2012, 32, 1160–1166. [Google Scholar] [CrossRef]
  28. Baker, D.G.; Eddy, T.D.; McIver, R.; Schmidt, A.L.; Thériault, M.-H.; Boudreau, M.; Courtenay, S.C.; Lotze, H.K. Comparative analysis of different survey methods for monitoring fish assemblages in coastal habitats. PeerJ 2016, 4, e1832. [Google Scholar] [CrossRef] [Green Version]
  29. Butcher, A.; Mayer, D.; Smallwood, D.; Johnston, M. A comparison of the relative efficiency of ring, fyke, fence nets and beam trawling for estimating key estuarine fishery populations. Fish. Res. 2005, 73, 311–321. [Google Scholar] [CrossRef]
  30. Dahm, E. Chapter 6: Sampling with active gear. In Guidelines for Sampling Fish in Inland Waters; FAO, Fisheries and Aquaculture Department: Rome, Italy, 1980; Available online: http://www.fao.org/docrep/003/AA044E/AA044E06.htm (accessed on 16 January 2019).
  31. Elliot, M.; Hemingway, K. Fishes in Estuaries. Blackwell Science Ltd: Oxford, UK, 2002. [Google Scholar]
  32. Bosch, N.E.; Gonçalves, J.M.S.; Erzini, K.; Tuya, F. “How” and “what” matters: Sampling method affects biodiversity estimates of reef fishes. Ecol. Evol. 2017, 7, 4891–4906. [Google Scholar] [CrossRef] [Green Version]
  33. Rotherham, D.; Johnson, D.D.; Kesby, C.L.; Gray, C.A. Sampling estuarine fish and invertebrates with a beam trawl provides a different picture of populations and assemblages than multi-mesh gillnets. Fish. Res. 2012, 123–124, 49–55. [Google Scholar] [CrossRef]
  34. Águas, M.P.N. Simulação da circulação hidrodinâmica na Ria Formosa. In Os sistemas Lagunares do Algarve; University of Algarve: Faro, Portugal, 1986; pp. 78–90. [Google Scholar]
  35. Diário da República. Decreto-Lei n° 373/87; Ministério do Planeamento e da Administração do Território Série I; Imprensa Nacional-Casa da Moeda: Lisbon, Portugal, 1987; pp. 4257–4263. [Google Scholar]
  36. IUCN. Protected Area Categories. 2020. Available online: https://www.iucn.org/theme/protected-areas/about/protected-area-categories (accessed on 3 November 2020).
  37. França, S.; Costa, M.J.; Cabral, H.N. Assessing habitat specific fish assemblages in estuaries along the Portuguese coast. Estuar. Coast. Shelf Sci. 2009, 83, 1–12. [Google Scholar] [CrossRef]
  38. França, S.; Costa, M.J.; Cabral, H.N. Inter- and intra-estuarine fish assemblage variability patterns along the Portuguese coast. Estuar. Coast. Shelf Sci. 2011, 91, 262–271. [Google Scholar] [CrossRef]
  39. Diário da República. Decreto-Lei n° 384-B/99; Ministério do Ambiente Série I-A; Imprensa Nacional-Casa da Moeda: Lisbon, Portugal, 1999; pp. 6644(2)–6644(3). [Google Scholar]
  40. ICNF. Convenção de Ramsar. 2012. Available online: http://www2.icnf.pt/portal/pn/biodiversidade/ei/Ramsar (accessed on 4 November 2020).
  41. Ribeiro, J.; Monteiro, C.C.; Monteiro, P.; Bentes, L.; Coelho, R.; Gonçalves, J.M.; Lino, P.G.; Erzini, K. Long-term changes in fish communities of the Ria Formosa coastal lagoon (southern Portugal) based on two studies made 20years apart. Estuar. Coast. Shelf Sci. 2008, 76, 57–68. [Google Scholar] [CrossRef]
  42. Monteiro, C.; Lasserre, G.; Lam Hoai, T. Spatial organization of the ichthyological community in the Ria Formosa lagoon (Portugal). Oceanol. Acta 1990, 13, 79–96. Available online: https://archimer.ifremer.fr/doc/00103/21424/ (accessed on 10 June 2021).
  43. Gotelli, N.J.; Colwell, R.K. Quantifying biodiversity: Procedures and pitfalls in the measurement and comparison of species richness. Ecol. Lett. 2001, 4, 379–391. [Google Scholar] [CrossRef] [Green Version]
  44. Hughes, J.B.; Hellmann, J.J.; Ricketts, T.H.; Bohannan, B.J.M. Counting the Uncountable: Statistical Approaches to Estimating Microbial Diversity. Appl. Environ. Microbiol. 2002, 68, 448. [Google Scholar] [CrossRef] [Green Version]
  45. De’ath, G. Multivariate regression trees: A new technique for modeling species-environment relationships. Ecology 2002, 83, 1105–1117. [Google Scholar] [CrossRef]
  46. Duarte, R.; Azevedo, M.; Afonso-Dias, M. Segmentation and fishery characteristics of the mixed-species multi-gear Portuguese fleet. ICES J. Mar. Sci. 2009, 66, 594–606. [Google Scholar] [CrossRef] [Green Version]
  47. Dufrêne, M.; Legendre, P. Species assemblages and indicator species: The need for a flexible asymmetrical approach. Ecol. Monogr. 1997, 67, 345–366. [Google Scholar] [CrossRef]
  48. Sousa, I.; Gonçalves, J.M.; Claudet, J.; Coelho, R.; Gonçalves, E.J.; Erzini, K. Soft-bottom fishes and spatial protection: Findings from a temperate marine protected area. PeerJ 2018, 6, e4653. [Google Scholar] [CrossRef] [Green Version]
  49. Clarke, K.R.; Warwick, R.M. Change in Marine Communities: An Approach to Statistical Analysis and Interpretation, 2nd ed.; PRIMER-E: Plymouth, UK, 2001; 178p. [Google Scholar]
  50. Clarke, K.R.; Warwick, R.M. A taxonomic distinctness index and its statistical properties. J. Appl. Ecol. 1998, 35, 523–531. [Google Scholar] [CrossRef]
  51. Lepš, J.; de Bello, F.; Lavorel, S.; Berman, S. Quantifying and interpreting functional diversity of natural communities: Practical considerations matter. Preslia 2006, 78, 481–501. Available online: http://botanika.bf.jcu.cz/suspa/FunctDiv.php (accessed on 4 November 2020).
  52. Botta-Dukát, Z. Rao’s quadratic entropy as a measure of functional diversity based on multiple traits. J. Veg. Sci. 2005, 16, 533–540. [Google Scholar] [CrossRef]
  53. Bosch, N.E.; Wernberg, T.; Langlois, T.J.; Smale, D.A.; Moore, P.J.; Franco, J.N.; Thiriet, P.; Feunteun, E.; Ribeiro, C.; Neves, P.; et al. Niche and neutral assembly mechanisms contribute to latitudinal diversity gradients in reef fishes. J. Biogeogr. 2021, 48, 2683–2698. [Google Scholar] [CrossRef]
  54. Froese, R.; Pauly, D. FishBase. Version (10/2018). 2018. Available online: www.fishbase.org (accessed on 10 June 2021).
  55. Stuart-Smith, R.D.; Bates, A.E.; Lefcheck, J.; Duffy, J.E.; Baker, S.C.; Thomson, R.J.; Stuart-Smith, J.F.; Hill, N.A.; Kininmonth, S.J.; Airoldi, L.; et al. Integrating abundance and functional traits reveals new global hotspots of fish diversity. Nature 2013, 501, 539–542. [Google Scholar] [CrossRef]
  56. R Core Team. R: A Language and Environment for Statistical Computing; R Foundation for Statistical Computing: Vienna, Austria, 2020; Available online: https://www.r-project.org/ (accessed on 5 May 2020).
  57. Oksanen, J.; Blanchet, F.G.; Kindt, R.; Legendre, P.; O’hara, R.B.; Simpson, G.L.; Solymos, P.; Stevens, M.H.; Wagner, H. Vegan: Community Ecology Package. R Package Version 2.5-6. Available online: https://CRAN.R-project.org/package=vegan (accessed on 1 July 2021).
  58. Kindt, R.; Coe, R. Tree Diversity Analysis. A Manual and Software for Common Statistical Methods for Ecological and Biodiversity Studies; World Agroforestry Centre (ICRAF): Nairobi, Kenya, 2005; ISBN 92-9059-179-X. [Google Scholar]
  59. Therneau, T.M.; Atkinson, B. R Port of rpart by Brian Ripley. Some Routines from Vegan—Jari Oksanen.Extensions and Adaptations of Rpart to Mvpart by Glenn De’ath. (2014). Mvpart: Multivariate Partitioning. R Package Version 1.6-2. Available online: https://CRAN.R-project.org/package=mvpart (accessed on 1 July 2021).
  60. Whitfield, A.K.; Elliott, M. Fishes as indicators of environmental and ecological changes within estuaries: A review of progress and some suggestions for the future. J. Fish Biol. 2002, 61 (Suppl. A), 229–250. [Google Scholar] [CrossRef]
  61. Monteiro, C.; Lam Hoai, T.; Lasserre, G. Chronological assemblages of fishes in 2 stations of the Ria Formosa lagoon (Portugal). Oceanol. Acta 1987, 10, 359–371. Available online: https://archimer.ifremer.fr/doc/00108/21912/ (accessed on 10 June 2021).
  62. Gonçalves, J.M.; Erzini, K. The reproductive biology of Spondyliosoma cantharus (L.) from the SW Coast of Portugal. Sci. Mar. 2000, 64, 403–411. [Google Scholar] [CrossRef] [Green Version]
  63. Ribeiro, J.; Carvalho, G.M.; Gonçalves, J.M.S.; Erzini, K. Fish assemblages of shallow intertidal habitats of the Ria Formosa lagoon (South Portugal): Influence of habitat and season. Mar. Ecol. Prog. Ser. 2012, 446, 259–273. [Google Scholar] [CrossRef] [Green Version]
  64. Micheli, F.; Halpern, B.S. Low functional redundancy in coastal marine assemblages. Ecol. Lett. 2005, 8, 391–400. [Google Scholar] [CrossRef]
  65. Warwick, R.M.; Clarke, K.R. New ‘biodiversity’ measures reveal a decrease in taxonomic distinctness with increasing stress. Mar. Ecol. Prog. Ser. 1995, 129, 301–305. [Google Scholar] [CrossRef] [Green Version]
  66. Ellingsen, K.E.; Clarke, K.R.; Somerfield, P.J.; Warwick, R.M. Taxonomic distinctness as a measure of diversity applied over a large scale: The benthos of the Norwegian continental shelf. J. Anim. Ecol. 2005, 74, 1069–1079. [Google Scholar] [CrossRef]
  67. Zhao, T.; Villéger, S.; Cucherousset, J. Accounting for intraspecific diversity when examining relationships between non-native species and functional diversity. Oecologia 2018, 189, 171–183. [Google Scholar] [CrossRef]
  68. Fontrodona-Eslava, A.; Deacon, A.E.; Ramnarine, I.W.; Magurran, A.E. Numerical abundance and biomass reveal different temporal trends of functional diversity change in tropical fish assemblages. J. Fish Biol. 2021, 99, 1079–1086. [Google Scholar] [CrossRef] [PubMed]
  69. European Committee for Standardization. European Standard. Water Quality—Guidance on the Scope and Selection of Fish Sampling Methods. EN 14962, 2006 E, Brussels, 2006; 25p. Available online: https://standards.iteh.ai/catalog/standards/cen/9ad3ded9-51c1-4080-b022-2991364d6b1b/en-14962-2006 (accessed on 1 May 2020).
  70. Harrison, T.D.; Kelly, F.L. Development of an estuarine multi-metric fish index and its application to Irish transitional waters. Ecol. Indic. 2013, 34, 494–506. [Google Scholar] [CrossRef]
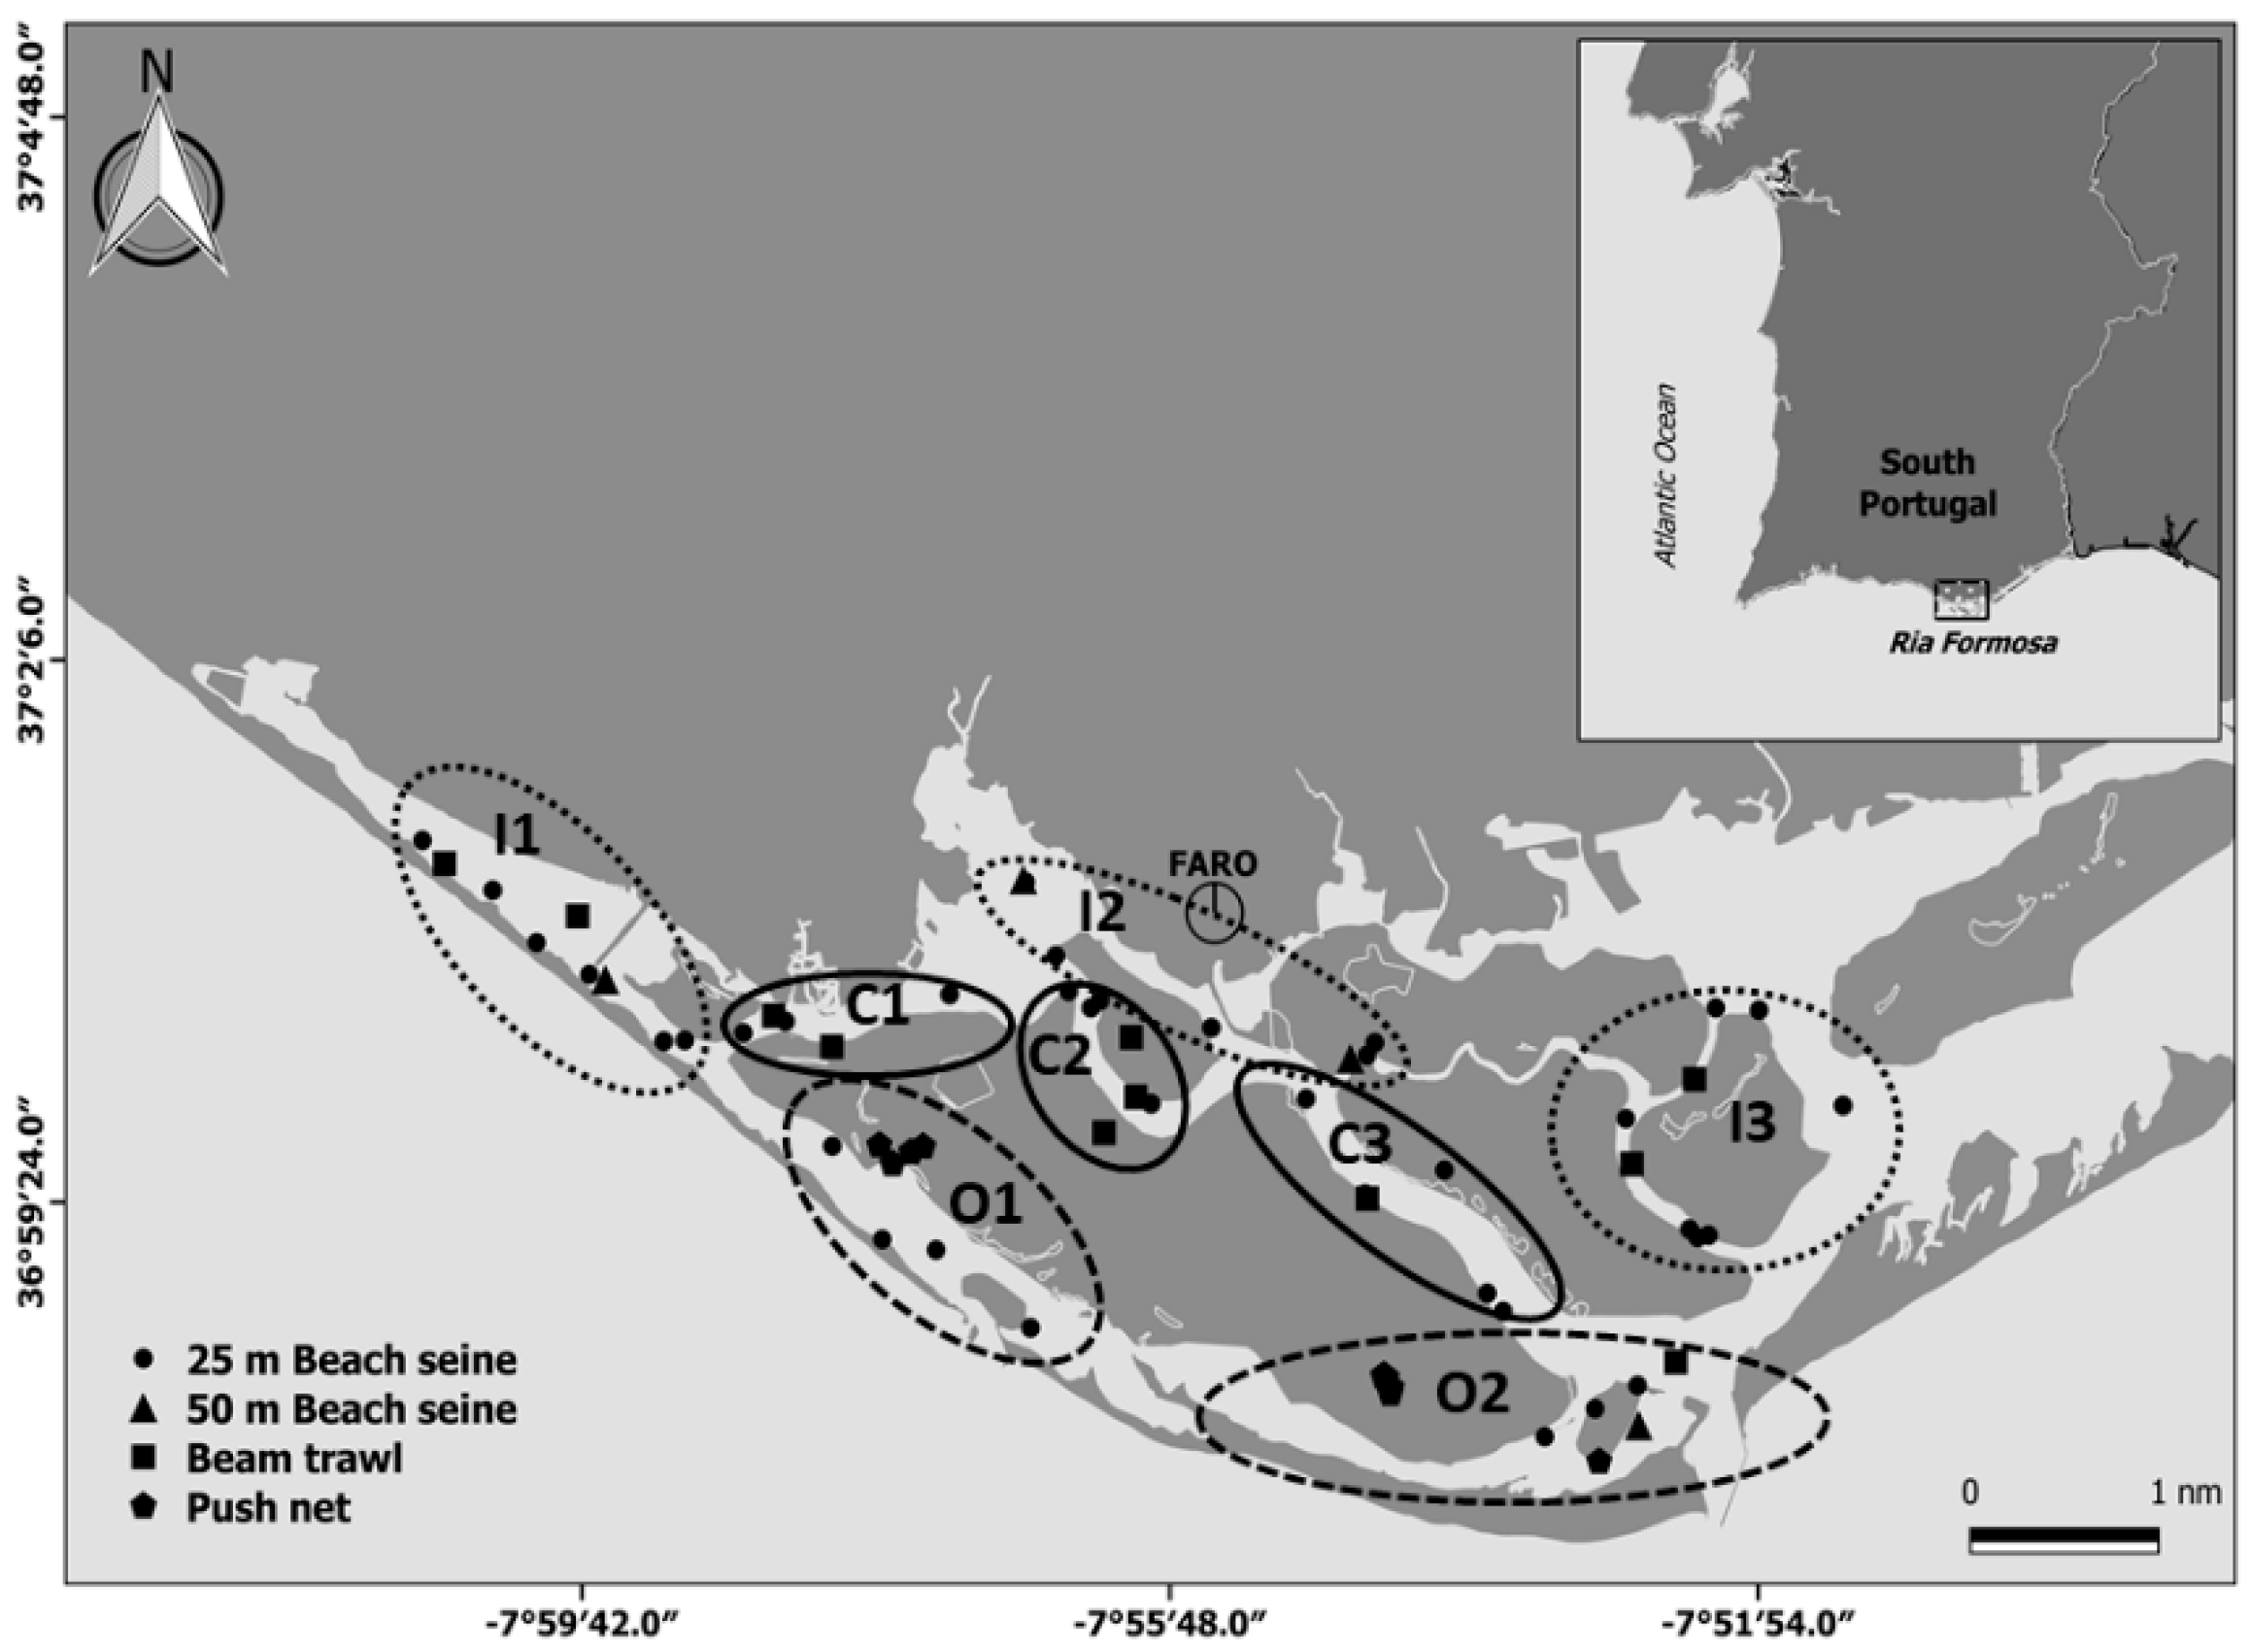
Figure 1. Distribution of sampling stations for the four sampling gears used to survey fish assemblages in the Ria Formosa coastal lagoon (South Portugal), with the three areas (Interior: I1, I2, I3; Main and secondary channels: C1, C2, C3; Outer, strong coastal influence: O1, O2). nm = nautical miles.
Diversity 14 00849 g001
Figure 2. Euler diagram representing the catch composition in number of species for beach seine (BS; 25 and 50-m), beam trawl (BT) and Riley push net (RP).
Diversity 14 00849 g002
Figure 3. Species accumulation curves representing the number of species observed vs. sampled area, for 25-m beach seine (BS25), 50-m beach seine (BS50), beam trawl (BT) and Riley push net (RP). Each point represents one sample.
Diversity 14 00849 g003
Figure 4. Multivariate regression tree for standardized species abundance data. Discriminant species (species that contributed the most to the variance explained in each node) are shown within the tree. Indicator species for each cluster (I–V) are represented together with their indicator values between brackets (IndVal ≥ 0.2).
Diversity 14 00849 g004
Figure 5. Box plots of indices of diversity split according to gear and presence/absence of vegetation (left column, panels (A,C,E,G,I)), and gear and season (right column, panels (B,D,F,H,J)). UNVEG—no vegetation, VEG—presence of vegetation; AU—autumn, S—summer, SP—spring, W—winter. * Represents significant differences (p-values < 0.05). Black dots are outliers.
Diversity 14 00849 g005aDiversity 14 00849 g005b
Table 1. Sampling periods, numbers of vegetated (VEG) and unvegetated (UNVEG) sampling locations, total number of sampling locations and total numbers of samples for each gear (number of sampling locations x number of months where sampling occurred). Due to logistic problems, sampling did not take place every month in all sampling locations.
Sampling GearSampling PeriodSampling LocationsTotal Samples
VEGUNVEGTotal
25-m beach seineSeptember 2000–December 2001142337497
50-m beach seineJanuary 2001–January 200231448
Beam trawlMarch 2001–March 20024812143
Riley push netApril 2001–April 200233672
Table 2. Functional traits selected for each species, adapted from [32,53,55].
Functional TraitTypeUnits/Categories
Maximum body lengthContinuousTotal length in cm
Trophic breadthContinuousNumber of prey phyla consumed (from diet studies). Ranged from 1 to 9 (Plants/Algae, Mollusca, Arthropoda, Echinodermata, Chordata, Cnidaria, Nematoda, Porifera, Annelida)
Trophic levelContinuousIndex, range from 1 to 5.
Trophic groupCategoricalPlanktivorous, Omnivorous, Herbivorous, Microinvertebrate feeders, Macroinvertebrate feeders and Piscivorous
Water column positionCategoricalPelagic, Benthic and Benthopelagic
Preferred substrateCategoricalSoft bottoms, Hard bottoms, Hard and Soft bottoms
Body shapeCategoricalFusiform, Compressed, Depressed, Globiform, Elongated/Anguilliform
Publisher’s Note: MDPI stays neutral with regard to jurisdictional claims in published maps and institutional affiliations.