Article

Amphibian Diversity of the Yucatan Peninsula: Representation in Protected Areas and Climate Change Impacts

by
Sandra Milena Castaño-Quintero
1,
Jazmín Escobar-Luján
1,
Fabricio Villalobos
2,
Leticia Margarita Ochoa-Ochoa
3 and
Carlos Yáñez-Arenas
1,*
1
Laboratorio de Ecología Geográfica, Unidad de Biología de la Conservación, Parque Científico y Tecnológico de Yucatán, Unidad Académica Sisal-Facultad de Ciencias, Universidad Nacional Autónoma de México, Mérida 97302, Yucutan, Mexico
2
Laboratorio de Macroecología Evolutiva, Red de Biología Evolutiva, Instituto de Ecología, A.C. Carretera Antigua a Coatepec 351, El Haya, Xalapa 91070, Veracruz, Mexico
3
Museo de Zoología “Alfonso L. Herrera”, Departamento de Biología Evolutiva, Facultad de Ciencias, Universidad Nacional Autónoma de México, Ciudad de México 04510, Mexico, Mexico
*
Author to whom correspondence should be addressed.
Diversity 2022, 14(10), 813; https://doi.org/10.3390/d14100813
Submission received: 12 July 2022 / Revised: 3 September 2022 / Accepted: 6 September 2022 / Published: 29 September 2022
(This article belongs to the Section Biodiversity Conservation)

Abstract

:
Knowledge about the dynamics of regional diversity patterns is a foundation on which measures aimed to protect diversity dimensions in the light of climate change can be constructed. Here, we describe taxonomic, phylogenetic, and functional diversity patterns of amphibians in the Yucatan Peninsula and their representation in the current protected area system. We stacked current and future potential distribution models to estimate taxonomic diversity and, based on the most recent amphibian phylogeny and nine functional traits, we measured phylogenetic and functional diversity. Independent phylogenetic and functional metrics were obtained by applying null models that allowed us to identify the presumably signature mechanisms underlying assemblage formation. We evaluated the effectiveness of the protected areas in protecting diversity dimensions across scenarios. We found phylogenetic and functional clustering as a result of environmental filters that have allowed only recently diverged species with converged functional traits to establish. Nevertheless, random assemblages are more widespread possibly due to the opposite directions in which competition and environmental filtering are acting. Overall, a decrease in all diversity dimensions is projected under future climate change scenarios compared with the current time. None of the protected areas evaluated were effective in protecting diversity dimensions, stressing the need to complete the existing protected areas network.

1. Introduction

Biodiversity as a characteristic of a site, which includes the species that compose it, the genotypic and phenotypic variation within each species, and the spatial and temporal variability in the communities and ecosystems that these species shape [1]. Often biodiversity conservation and characterization strategies have been focused on taxonomic diversity (TD), (or species richness), and abundance of species [2]. However, TD ignores that communities are composed of species with different evolutionary histories and a wide range of ecological functions [3]. Deeper descriptions of community assemblages (groups of taxonomically related species that coexist in space and time [4]) include complementary diversity dimensions such as phylogenetic diversity (PD) and functional diversity (FD), which represent the evolutionary history [5] and the diversity of ecological or functional traits of a group of species [1], respectively.
Phylogenetic diversity is often estimated from a phylogeny by summing the lengths of the branches that connect the species present in a site, providing information not only about evolutionary relationships among species but also the evolutionary processes that shape both contemporary assemblages of species and geographical gradients of biodiversity [6]. Functional diversity is the component of biodiversity that determines the dynamics, stability, productivity, balance of nutrients, and other aspects of the functioning of ecosystems [1]. FD can be estimated by grouping life-history traits of the species phenotype that potentially affect its fitness [7] while influencing the functioning of ecosystems [8]. The traits can be physical (e.g., size, weight, tooth morphology), biochemical (e.g., presence of secondary metabolites), behavioral (e.g., night vs. day activity, female cannibalism over males), or phenological (e.g., flowering time, larval stage duration) [7]. Together with taxonomic diversity, PD and FD can give insights into the main causal processes of the origin and maintenance of biodiversity [9].
Nevertheless, phylogenetic and functional diversity are often highly correlated with taxonomic diversity. Therefore, if identifying the mechanisms responsible for the observed diversity patterns is the aim, independence between each diversity metric is required [10]. In this sense, the application of null models has allowed researchers to identify non-random assemblages that represent a product of ecological and/or evolutionary processes [11,12]. For instance, when competition is the dominant process or there is a plethora of different environments and resources available, phylogenetically and functionally dispersed assemblages are expected [11]. Phylogenetic and functionally clustered assemblages take place when in situ radiation from a few evolutionarily close lineages has occurred [13] or environmental filters have brought together close relatives that share similar strategies to acquire resources [14,15].
Evidence shows that combining different diversity dimensions (TD, PD, and FD) allows for stronger inferences about possible ecological and evolutionary processes that affect the composition of communities [16]. Adopting this type of approach in the context of climate change (CC) could be relevant for developing strategies that allow the effective conservation of the patterns and processes that originate and maintain biodiversity at broader time scales. Certainly, it has been suggested that without species’ explicit responses, any attempt to minimize the negative effects of climate change would be worthless [17]. A way to project future species range shifts caused by climate change is by applying ecological niche models (ENM) [18,19]. ENM has as inputs georeferenced presence records and environmental layers, which are subsequently correlated to estimate not only ecological niche requirements but also both current and future potential distributions of species [20]. The latter are the inputs for the estimation of the diversities.
Currently, the earth’s annual mean temperature has increased by nearly 1 °C above pre-industrial levels and the increase, between 2030 and 2050, is projected to reach 1.5 °C with respect to the period of reference [21]. In response to environmental changes, species are expected to change their distribution ranges in search of adequate climatic conditions [22], acclimatize to the new conditions, or become locally extinct [23,24]; thus, spatial patterns of TD, PD, and FD could change and decouple.
Although protected areas (PA) serve as a means to protect biodiversity, most of these come from proposals that ignore possible future changes in the species’ distributions [25]. It is also important to take into account that, in general, they only considered species richness or TD as the criterion for selecting areas to protect [26]. However, nowadays, conservation planning has become integrative [27]. Despite this, there is a high degree of uncertainty regarding their current and future role in protecting the different dimensions of diversity.
Among terrestrial vertebrates, amphibians exhibit the narrowest distribution ranges and could suffer more severe extinction processes [28,29,30,31]. Habitat loss and fragmentation, environmental pollution, invasive species, and emerging diseases could act synergistically, depicting an even worse scenario for amphibians [32,33,34,35,36]. Furthermore, it has been suggested that important aspects of amphibian biology, such as growth, development, foraging, hibernation, and reproduction seasons, could be affected by changes in climate [34]. In Mexico, more than 400 species of amphibians currently occur, of which more than 65% are endemic [35] and about 43% are threatened [37]. The Mexican portion of the Biotic Province of the Yucatan Peninsula (YP) harbors 23 native species, one of which is regionally endemic [38]. Although the Yucatan Peninsula exhibits low topographic variation leading to little variation in temperature, a clear precipitation gradient that decreases from the southeast to the northwest is observed [39]. The Yucatan Peninsula is currently quite warm where water availability is a limiting factor and will increase in temperature and decrease in rainfall due to the climate change that is expected [40]. Owing to some morphological characteristics that make them prone to desiccation and their dependence on water for reproduction [41], in future scenarios, the amphibians of YP could shift their distribution, resulting in new assemblage arrangements. Those shifts could lead to changes in the spatial distribution of the diversity dimensions. Although, different studies such as composition, conservation status, and distribution of herpetofaunal species have been performed for the YP [38,41], the current and future (under CC scenarios) spatial patterns of amphibians’ diversity dimensions are unknown, as well as their representation in the current system of the PA.
Here, we described the spatial patterns and geographical relationships between TD, PD, and FD of amphibians in the Mexican Yucatan Peninsula in a CC context. As hypotheses, (1) we expect that the spatial pattern of TD follows a gradient of water availability, presenting the greatest diversity where the highest amount of available water is; (2) as the lack of relief suggests low ecological or environmental space availability [42], we expect a functional clustering and only a phylogenetic clustering if functional traits are shared by closely related species; (3) it has been shown that, as a result of CC, a decoupling of the different diversity dimensions could occur due to the potential changes in the distribution of the species [43], thus changes in the relationships among the different diversity dimensions are expected; (4) and lastly, among diversities, we expect a significant representation of TD in the PA system, at least in the current scenario.

2. Materials and Methods

2.1. Study Area

The Mexican Yucatan Peninsula is located in the southeast end of Mexico and includes the states of Campeche, Yucatán, and Quintana Roo (Figure 1). YP consists of a relatively flat platform of calcareous rock and hard limestone soil; there are no mountain systems, and the maximum elevation barely reaches 250 m a.s.l. [39]. Because of the lack of reliefs and its recent emergence of the sea [43], in the YP, the marine climate effect is accentuated to a great extent. Furthermore, the Yucatan Peninsula is located in the path of the Caribbean winds and cyclones [44]. The predominant vegetation consists of deciduous forest, subdeciduous forest, evergreen forest, and spiny forest [45], distributed in five ecoregions: Mesoamerican Gulf-Caribbean mangroves, Pantanos de Centla, Petén-Veracruz moist forests, Yucatan dry forests, and Yucatan moist forests [44]. The annual mean temperature is between 25 and 28 °C, while the annual mean rainfall on the peninsula is 1100 mm [46], presenting a gradient in precipitation that decreases from the southeast to the northwest [39]. Another characteristic that stands out in the YP is that rivers are superficially absent, and instead, they travel below ground, opening outwards to form the so-called “cenotes”. Permanent lagoons and bodies of water are also scarce in the YP, being mainly located at its base [41].

2.2. Presence Records

We obtained presence records of the 23 native amphibian species that currently occur in the YP [38] from the databases of the Global Biodiversity Information Facility (GBIF, https://www.gbif.org, accessed on 26 August 2017) and VertNet (http://vertnet.org, accessed on 29 August 2017). Duplicate data, poorly georeferenced (located at sea) data, and possible errors in determination were deleted using references such as the book Amphibians of Central America [47], the online resource Amphibiaweb (https://amphibiaweb.org, accessed on 15 October 2017), and the online resource Amphibian Species of the World (http://research.amnh.org/herpetology/amphibia/index.html, accessed on 30 January 2018). The number of presences by species is shown in Table S1.
For each species, we generated a hypothesis of historical accessibility (area M of the BAM diagram; a heuristic scheme with three factors: biotic, abiotic, and mobility at whose intersection stable populations are predicted to be present. [48]), which has important implications for constructing robust ecological niche and species distribution models with reliable evaluations [49,50]. M stands for the arena of comparison where the background landscape has been tested by the species, and either it has been occupied (presence) or it has not (absence) due to its suitability [49]. Here, presences may exist, and absences are meaningful [49]. The Ms were generated from the intersection of the presence records with the WWF terrestrial ecoregions [51] using the raster [52] and rgdal packages [53]. In order to gather as many environments as possible and remove clusters of records to avoid overadjustment in the ENMs [54], an environmental filter was applied to the presence records [55]. This was performed taking into account the first two main components of the environmental predictors (Environmental Data Section) with the ‘gridSample’ function of the raster package [52]. Then, the presence data were divided into two sets, training and evaluation, using the ‘chekerboard1′ function with an aggregation factor of 10 from the ENMeval package [56].

2.3. Environmental Data

The environmental variables were obtained from the WorldClim database (version 1.4) [57] at a resolution of 2.5′ (~5 km) and datum WGS-84. The variables BIO8 (average temperature of the wettest quarter), BIO9 (average temperature of the driest quarter), BIO18 (precipitation of the warmest quarter), and BIO19 (precipitation of the coldest quarter) were eliminated from the set because they contained previously identified artifacts [58]. Variables simulating future (2050 and 2070) climate behavior analogous to those of the current were downloaded. Two general circulation models (GCM: CCSM4 and MIROC5) from the Coupled Model Intercomparison Project Phase 5 (CMIP5) [59] were chosen to take into account the variation and uncertainty between their predictions of the future [18,60]. In addition, for each GCM, two greenhouse gas representative concentration pathways (RCP) were selected, one plausible optimistic (RCP45) and one pessimistic (RCP85).
We cropped environmental variables to the extension of the joined Ms of all species and to reduce multicollinearity among variables, and we performed a principal component analysis (PCA). The first four axes that explained 95.1% of the total variance were retained to run the models. This procedure was performed with the ‘iPCAProjection’ function of the ENMGadgets package [61].

2.4. Ecological Niche Modeling

Calibration, evaluation, and selection of ENMs were performed using the kuenm package [62]. Using the maxent algorithm, this package executes the calibration and constructs the models [63] through the dismo package in R [64]. Models were calibrated with ‘kuenm_cal’ function combining regularization multipliers one by one up to four, 10,000 background points and establishing the “basic” option for the argument of ‘features’ to be taken into account (seekuenm’s help in R). The selection of the models was performed hierarchically, taking into account first, the statistical significance via partial receiver operating characteristic ROC [65] with bootstrapping of 50% of the evaluation data 100 times, second, the allowed omission rate (E = 5%), and finally, the complexity through the Akaike information criterion corrected for the sample size (AICc) [66], but see [67]. Once the best models were selected, they were converted to binary maps by taking the allowed omission rate to generate geographical distributions (extents of occurrence [68]) as a threshold. The models selected in kuenm were transferred to future scenarios by applying clamping and truncation as transfer procedures with five bootstrap replicates to take into account potential effects given by specific sorting in calibration data. Further details of the modeling process and projections for the future are shown in the supporting information. In summary, we generated SDMs for 23 species where projections to future scenarios resulted from combining year and RCP (i.e., 2050-rcp45). We performed an extrapolation risk analysis using the mobility-oriented parity (MOP) metric of ntbox package [69] that allows for finding areas with strict extrapolation. That is, where projection areas (future scenarios) and calibration areas (M) possess dissimilar environments [70].

2.5. Diversity Measurements

Here taxonomic diversity of each scenario was estimated as species richness from the presence/absence matrices (PAM) based on the thresholded SDMs at a resolution of 2.5′ (~5 km) using the lets.presab function of the letsR package [71]. This procedure assumes that communities are constituted from the coincident assemblages of the individual ecological responses of the species [72]. We used Rao’s quadratic entropy index (QE) to measure PD and FD per pixel [73]. QE is the mean phylogenetic or functional distance between randomly chosen pairs of species in a distance matrix, and in this case, given by PAM. Rao indices for PD and FD were estimated with the ‘melodic’ function [74].
We estimated PD from the phylogeny of Jetz and Pyron [75], which is based on a Bayesian time tree that represents 87% of the currently described amphibian species (~8319 species; http://research.amnh.org/herpetology/amphibia/index.html, accessed on 11 May 2021). To account for phylogenetic uncertainty, we obtained a distribution of 100 sampled trees trimmed to the native amphibians of YP to estimate standardized cophenetic distances between 0 and 1. Median values between all trees are reported.
To estimate FD among the 23 species, a paired functional dissimilarity matrix, standardized between 0 and 1, was estimated using the Gower distance [76]. The traits used were: body size, habit (e.g., arboreal, terrestrial, or aquatic), fertilization type, reproductive cycle, reproductive type, presence of larvae, spawn site, site of larval development, and parental care (Table S1). These traits comprehend a wide variety of ecological, life history, and morphological features of the species [77]. To obtain the information of traits we used the database of Sodhi et al. (2008). The missing data were completed using the AmphiBio database [78].
The PD and FD Rao indices were transformed to equivalent numbers [79] to ensure that all indices (TD, PD, and FD) could be compared directly and that these comparisons made biological sense [80]. Thus, PD and FD were expressed in terms of the effective number of species needed to produce the given value of the diversity index [79] per pixel. To better visualize the results, we mapped the changes (in percentage) per diversity dimension and climate change scenario.

2.6. Statistical Analysis

Correlations between diversity patterns were assessed by performing a modified t-test implemented in the SpatialPack package [81] with a correction of the degrees of freedom and the sample covariance under the null hypothesis of no spatial correlation between pairs of patterns [82,83]. In order to rapidly visualize the central tendency of the potential change in biodiversity patterns, we mapped values of each biodiversity metric per scenario. We carried out Wilcoxon tests to compare future median diversity values against those observed in the current scenario by applying wilcox.test function in R [60].
To identify areas in which the phylogenetic or functional diversity was higher or lower than expected by TD, the independence between each metric must be assured [10]. Thus, for each pixel, we calculated the standardized effect size (SES) of PD and FD by standardizing the differences between the observed (Obs) and expected values (Exp) [84]. The latter corresponds to the average PD–FD values from 10.000 simulated assemblages keeping the observed number of species fixed while the identities of species were randomly drawn from the total species. The standard deviation (SD) of simulated assemblages was used to obtain SES.PD and SES.FD as SESx = (Obsx − Expx)/SDx, where X denotes PD or FD. Null models allowed us to assume not only that all species have equal chances to occur within assemblages but also that the occurrence is independent of their functional traits and phylogeny [10]. As SES approximates the Z distribution, values lower than −1.96 or higher than 1.96 indicate subsets of species significantly clustered or overdispersed, respectively, in phylogenetic and functional terms. Due to the lack of overdispersion patterns (see results), only values indicating clustering were reclassified as −1.

2.7. Effectiveness of Protected Areas

The PAs of categories Ia up to IV of the IUCN in the YP were taken as a reference (Figure S1, Table S2), which includes only PAs with specific conservation objectives [85]. A total of ten PAs were evaluated. A pixel was considered protected when an area higher than or equal to 50% of it was included in a PA. The effectiveness of the current system of PAs was evaluated by comparing TD, the identified significant phylogenetic or functional clusters, and the 14% most diverse pixels (which is the percentage of area covered by the PAs in the Yucatan Peninsula) per diversity dimension within each PA across all scenarios, with respect to the values expected by a null model. The PAs were spatially randomized only in unprotected areas but kept the shape, size, and orientation [86,87,88]. We performed 1000 randomizations of the null model. A PA was considered effective when the observed diversity value was higher than expected in at least 95% of the runs, that is, p ≤ 0.05 [88]. All analyses in this article were performed in R [64].

3. Results

We obtained statistically significant models for each of the 23 species, which served as the basis for assessing the spatial diversity patterns. However, based on the MOP analysis, interpretations of the future projections, specifically those made on the western part of the Yucatan Peninsula, must be made with caution. Models of up to 15 species showed strict extrapolation risks over the same areas (Figure S2).
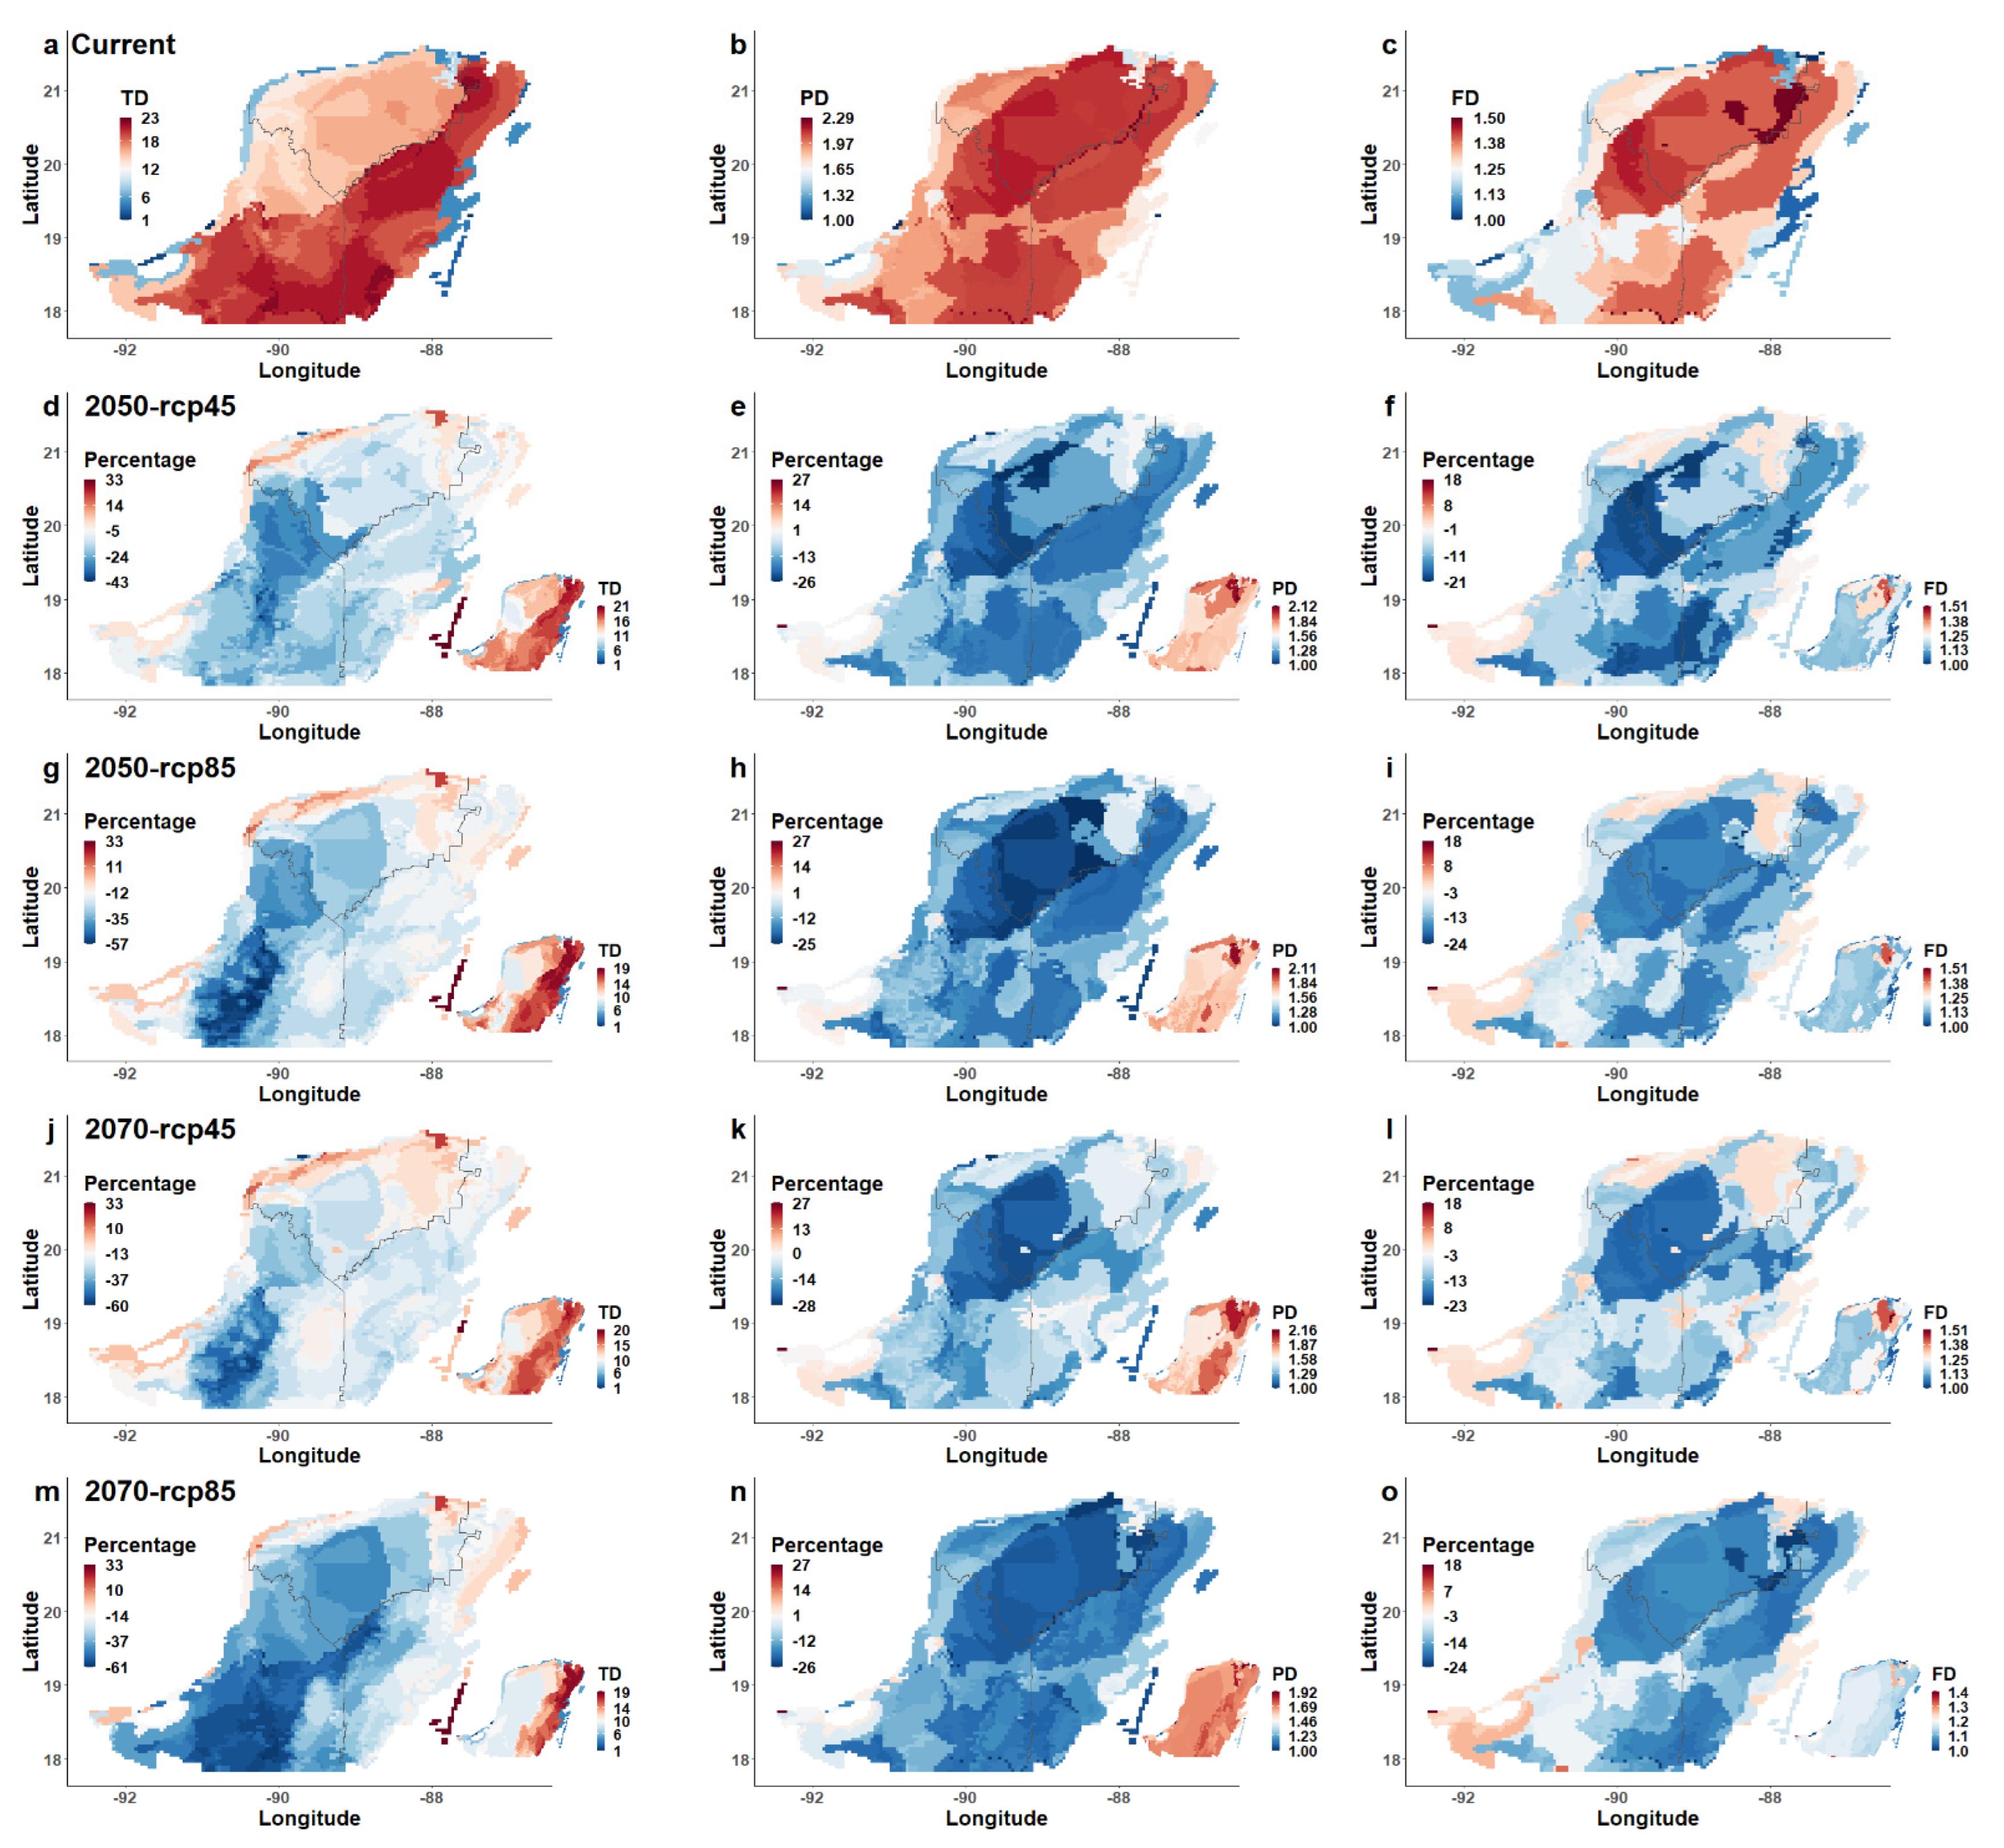
Currently, the highest values for TD are found in the base of the peninsula and toward the east, along the state of Quintana Roo (Figure 2a). The lowest values for TD are found in part of the state of Yucatán and the north of Campeche. The PD and FD patterns present high spatial congruence (Figure 2b,c). Diversity dimensions partially overlap. Although zones with high values for PD and FD overlap with some areas of high TD, it is interesting to note that also areas with high PD and FD located in the north-central zone of the YP overlap with areas where low values for TD predominate.
As a general trend, models showed that there would be a contraction of the areas of high TD through the different time frames towards the eastern zone of the peninsula along the state of Quintana Roo. A maximum loss of TD, between 43% and 61%, can be observed in future scenarios with respect to the current (Figure 2a,d,g,j,m). Zones with maximum TD gain showed only 33% more in small northern areas of YP (Figure 2a,d,g,j,m). Likewise, phylogenetically and functionally diverse areas would be reduced and located in the northern and southeast zones of the YP. Like TD, areas with the highest losses of PD (25–28%; Figure 2b,e,h,k,n) and FD (21–24%; Figure 2c,f,i,l,o) in future scenarios would be considerably larger than areas with gains.
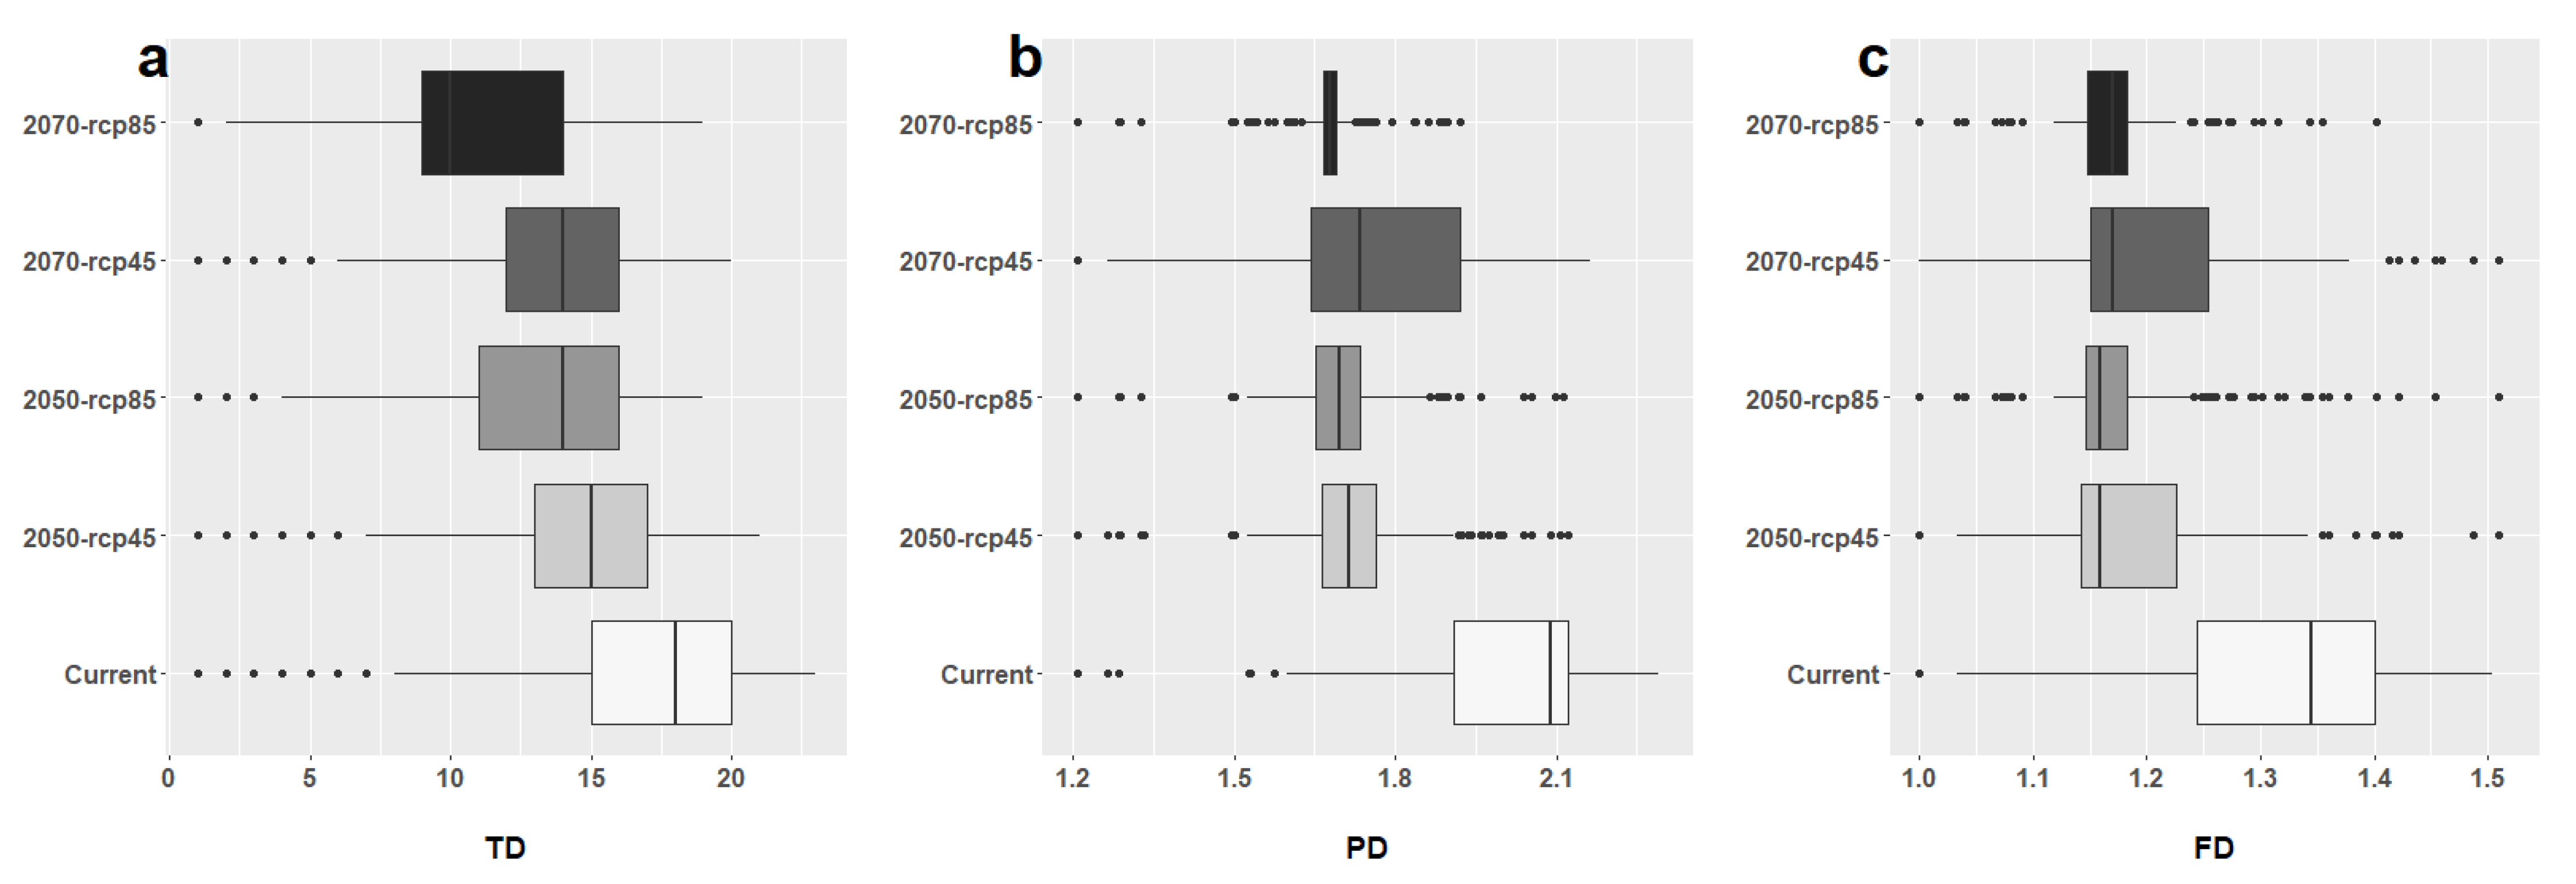
Phylogenetic and functional diversity presented positive correlations, the correlation being higher in the present and fluctuating in future scenarios (Table 1). In the current scenario, PD and FD were moderately correlated with TD (Table 1). This suggests that approximately 38% and 50% of the spatial variation of PD and FD, respectively, is not explained by TD. In the models that projected the future, the dynamics of these relationships varied. Throughout scenarios, the explanation for PD by TD varied from 51% to 79%, while TD explained FD variation from 6% to 57% (see supporting information for details). Significant displacement from relatively high values to lower values for all diversities measured from current to future scenarios is observed. This is a consequence of projected range contractions and species extirpations (Figure 3, Table S3).
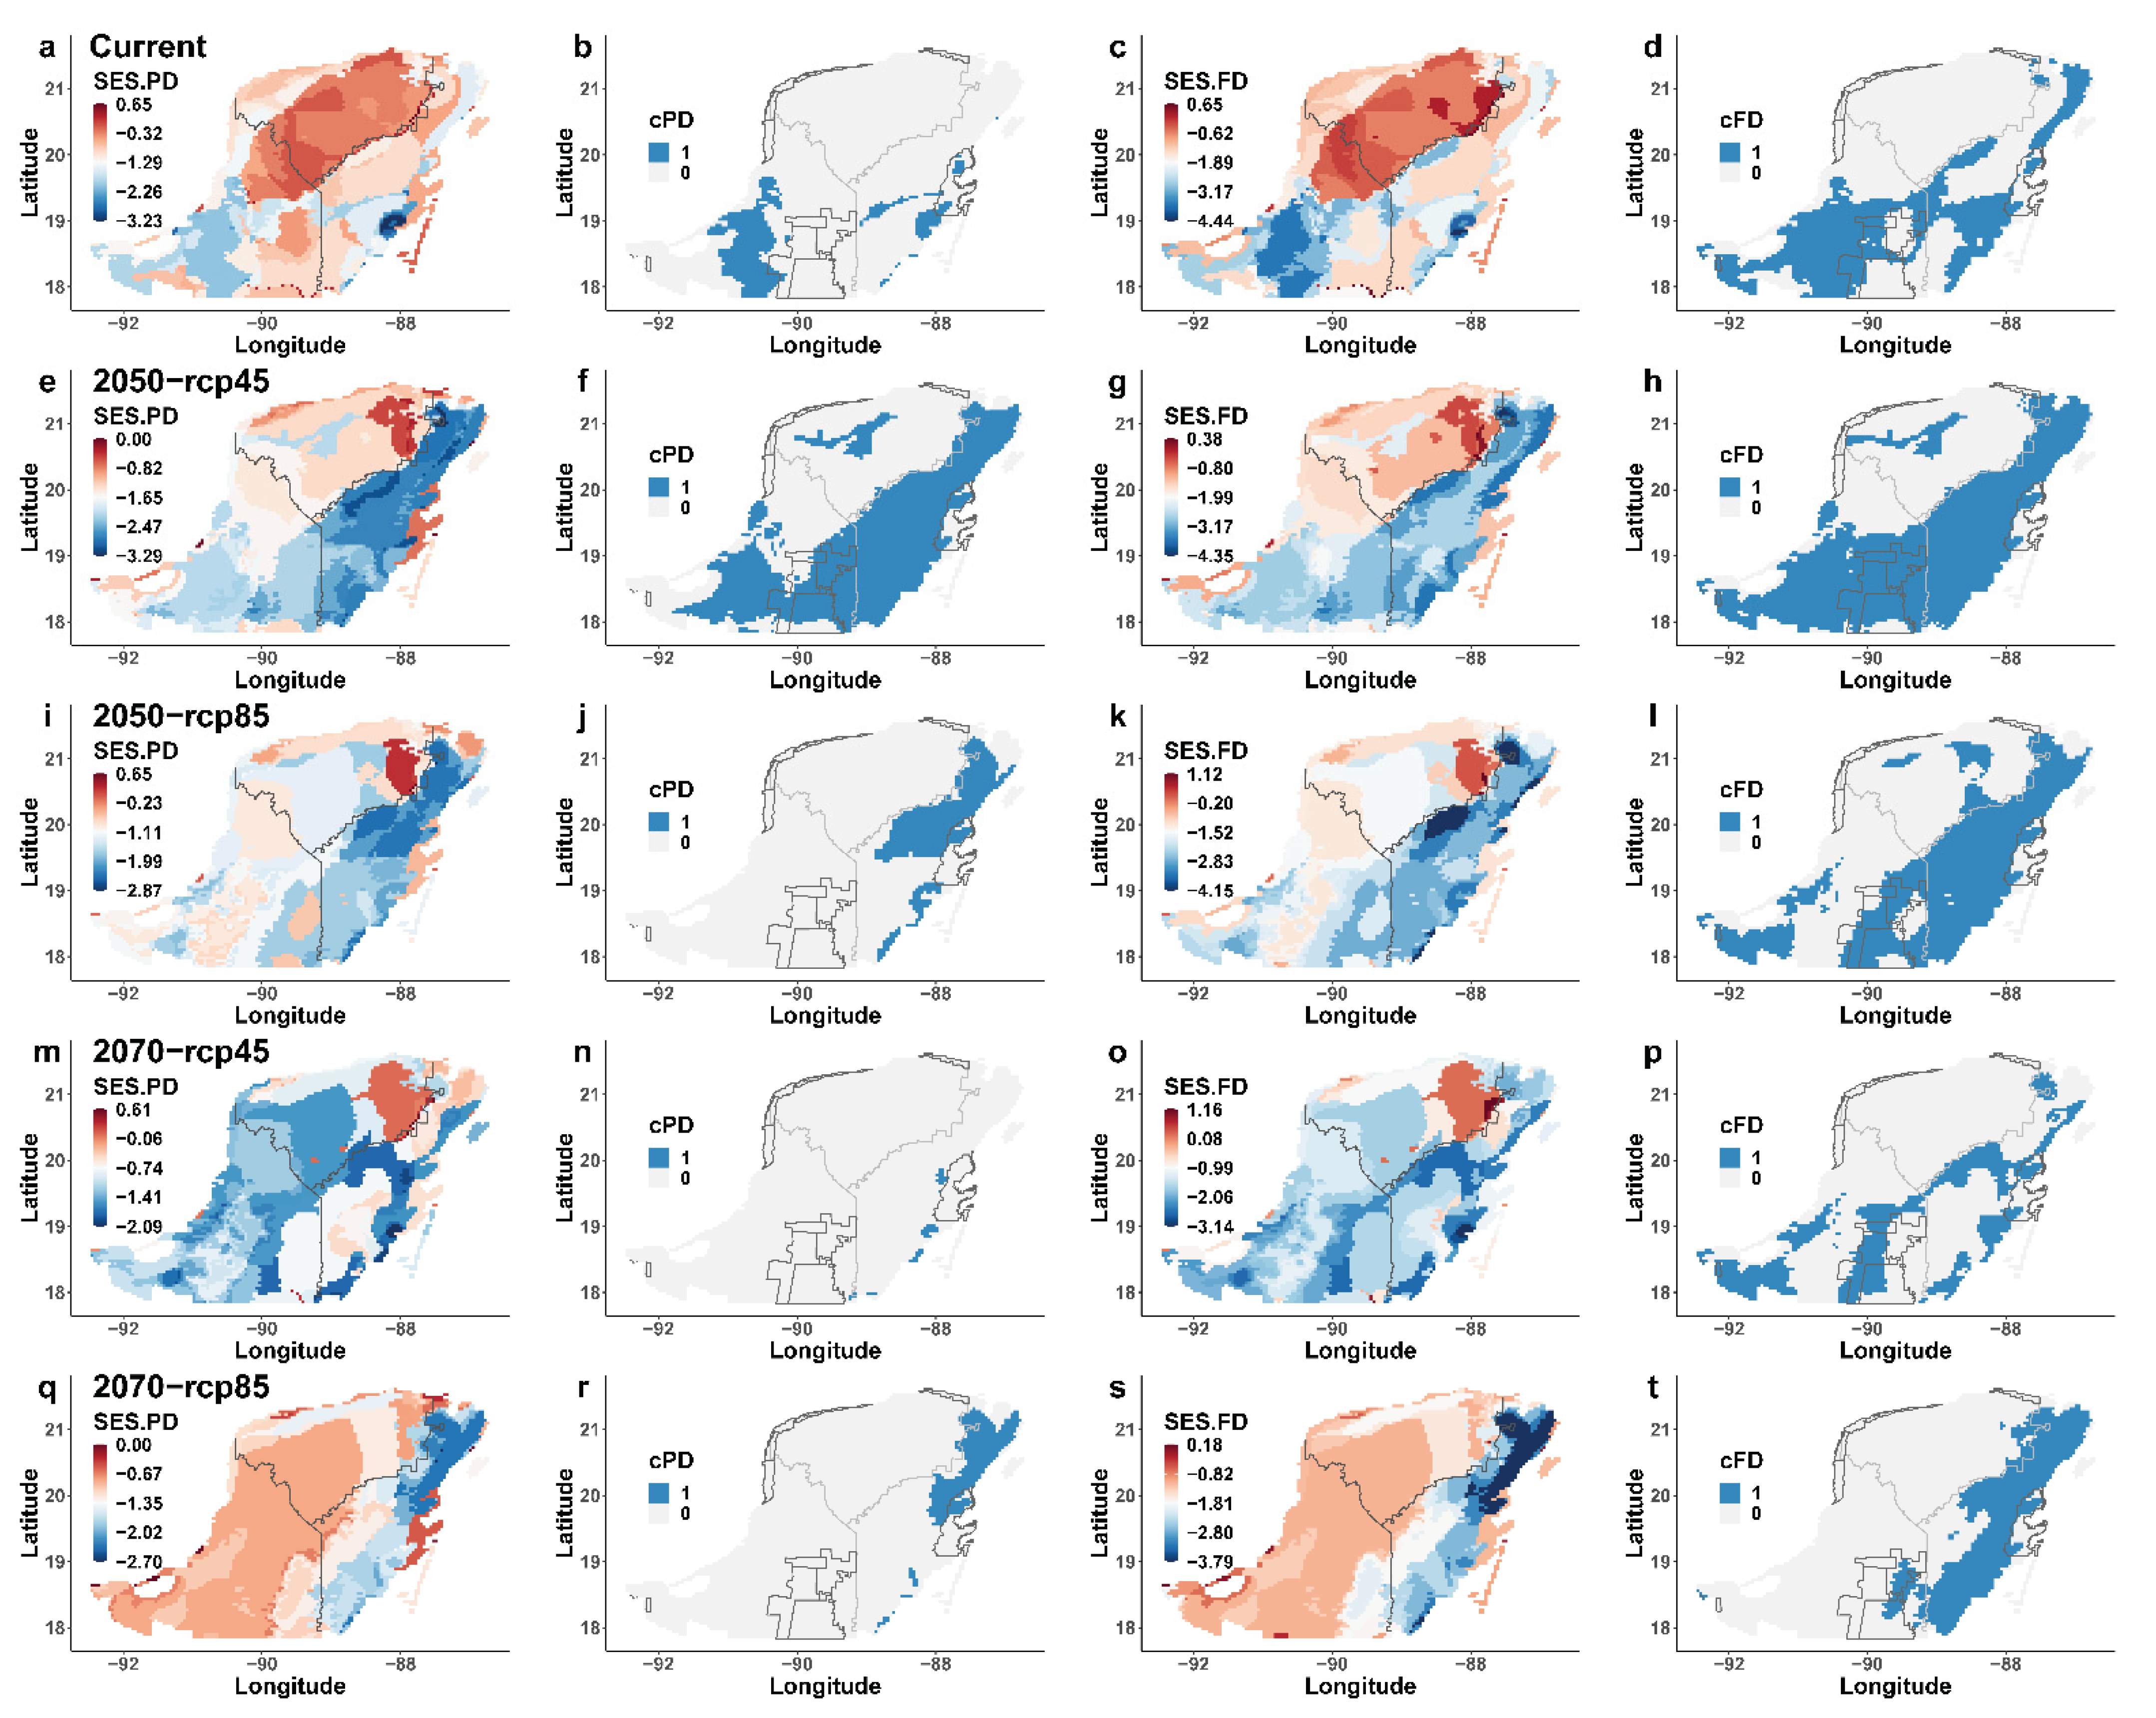
Across all scenarios, we were able to identify zones with phylogenetic or functional clustering (Figure 4). In the current scenario, phylogenetic clusters are mainly over a part of the southwestern coast and south of the state of Campeche and along the eastern coast and a few dispersed areas in the state of Quintana Roo. Zones with functional clustering are widely distributed over the southwest, center, and eastern coast of the Yucatan Peninsula. For future scenarios, variations between expansions and contractions of either phylogenetically or functionally clustered zones were projected (see supporting information for further details).
None of the ten existing PAs evaluated proved to effectively protect TD, the identified phylogenetic and functional clustering (Table S4), or the 14% most diverse pixels (Table S5).

4. Discussion

Positive relationships were observed between TD, PD, and FD. PD does not have to reflect FD because functional traits may be the result of convergence processes [5]. Even so, we found that PD and FD attained the highest correlations. TD losses of up to 61% were observed; however, the loss of PD and FD was much lower, indicating that there is a phylogenetic and functional redundancy among the species inhabiting the YP. Given the monotonic relationship between TD, PD, and FD, an increase or decrease in species richness (TD) can only mean an increase or decrease in PD and FD, and rarely no change [89,90].
In the current scenario, the highest values for TD were found at the base of the YP, exhibiting a peninsularity effect where the greatest species diversity is found in the areas closest to the mainland [44] and also on the east of the YP. The increase in TD from west to east in forest of the YP is related to increased rainfall in this direction [47]. In the eastern region of the YP, precipitation is higher, as is the availability of water. This has a positive effect on amphibian species’ richness and abundance, given their ecophysiological characteristics and their dependence on water to complete their reproduction [91,92]. In addition, it has been found that a reduction in water availability is particularly important in areas that are already under hydrological stress, acting as a limiting factor for amphibian species distribution [93].
The Yucatan Peninsula species pool is a sample of a particularly large proportion of recently diverged species, mostly salamanders (Plethodontidae), toads (Bufonidae), true frogs (Ranoidea), and tree frogs (Hylidae), which in turn possess low evolutionary distinctiveness (ED), (ED estimates an amount of evolutionary isolation per species, therefore, reflecting how genetically distinct a species is in a tree [94]), implying a major redundancy among species [75]. Even though the Mexican burrowing toad (Rhinophrynus dorsalis), with 157 Myr of unique evolutionary history [75], inhabits the YP, we did not find phylogenetic or functional overdispersion patterns. Possibly the widespread distribution of R. dorsalis is acting as a common denominator between the assemblages. Both phylogenetic and functional clusters could be explained by the effect of environmental filters. Possibly only species with similar characteristics, given by a common and recent evolutionary history, have been able to settle.
Nevertheless, randomness is the most widespread ‘pattern’. Assuming an almost complete recently diverged species pool with convergent functional traits in an area where presumably environmental filtering and competition act as two vectors with nearly the same magnitude but in opposite directions, random assemblages rise instead of non-random ones [95]. Furthermore, when competition generates the repulsion of convergent traits, random assemblages are favored rather than phylogenetically clustered ones [15]. Additionally, previous beta diversity studies have shown a low species turnover over the YP [96], implying that almost all species are ubiquitous or that within the Yucatan Peninsula, there are no geographical barriers, at least for amphibians. In those cases, in regions where dispersion is a predominant factor, the random nature of the assemblages is given by stochastic events boosted by the species dispersion capacities [97]. Although, in some cases, in addition to driving random assemblage [98], dispersal also plays a significant role in generating non-random patterns in birds [99].
In the vast majority of sites, diversities have evolved altogether, probably trying to fill all the available ecological space. Future scenarios show that there will be a decoupling of these diversities as a result of potential random local extirpations and projected species range shifts. For instance, substantial extinctions of amphibians by 2050 have been projected over the YP, with approximately one species remaining in the northwest [35]. Although, it is worth noting that climate change scenarios have been better modeled, and now climate scenarios are not as severe as the ones used in that study. A general trend of heterogenization of lowlands has been projected to occur mainly as a consequence of local extinctions among closely related species [43] but also, a homogenization northeastward where we project the aggregation of phylogenetic and functional clusters, presumably due to the tracking of suitable environmental configurations by closely related taxa with similar physiological tolerances [100]. In those models, universal dispersion is considered, but it has been shown that some species, instead of reshaping their ranges in response to climate change, have moved upwards in mountain formations [101]. However, in areas without relief, if amphibians are not able to change their distribution, their future would be compromised because moving upslope is not possible. This could be sharpened by biotic factors and reduced adaptive evolutionary responses [102].
Ecological niche and species distribution modeling is plagued with well-known uncertainties [103]. Acknowledging such uncertainties, we applied a set of recognized good practices in ecological niche modeling approaches. For instance, to avoid model overfitting, we cleaned and processed the presence record data; we decreased predictors dimensions to control multicollinearity, therefore, avoiding instability in modeling [104] and over-characterization of sites [105]; and we tested different combinations of setting parameters when fitting the models [106] together with a hierarchical selection, retaining only those models with the best statistical performance and the lowest allowed omission rate. Likewise, the modeling process was based on a hypothesis of M, which holds the probable set of environments experienced and accessed by species over relevant time periods [107], although it is probably a subset of environments tolerated by species, and is better than modeling only over the study area, which can lead to a truncated subset of environments that, therefore, can provoke miscalculations and an increase in the uncertainties when projections to climate change future scenarios are made. Despite GCMs being reliable hypotheses for the complexity around future climate change scenarios, the selection of GCMs among the available alternatives is difficult [108]. As we show in MOP analysis, the uncertainties around the projections are exacerbated as we move to distant time and/or pessimistic scenarios, but at least it provides caution limits around interpretations. Moreover, we assumed full dispersion capacity in modeling projections, having considered the lack of reliefs in the Yucatan Peninsula [43] that could act as geographical barriers. Certainly, rather than trying to present definitive future predictions [108], we only want to outline one of the thousands of possible scenarios if, as in this case, universal dispersion is considered.
Unlike the European PA system that effectively protects the diversity dimensions of amphibians [109], the protected areas of the Yucatan Peninsula constitute an inefficient protection network for amphibians. As previously shown at a global level [110], protected areas in Yucatan Peninsula do not protect any diversity dimension better than a set of randomly located PAs would do. This could be extended across time since policies and international agreements do not take species range shifts into account in the formulation of conservation protocols [17]. Seeking an alternative in the permanent forest areas (AFPs) system in Mexico, between 1 and 6 AFPs out of 94 proved to be effective in protecting TD throughout all scenarios (data not shown). However, most of these AFPs cover areas of approximately 5 to 10 Km2. By not protecting the variation contained in the different diversity dimensions, areas that harbor species with ancient evolutionary histories [111]; areas occupied by species with recent evolutionary histories that constitute evolutionary potential, under the assumption that they will continue to evolve at rates similar to those of the past [112]; and finally, areas that harbor communities that have multiple responses to environmental change and areas where communities could respond better to extirpation events because they are composed of functionally redundant species, are put at risk. Finally, we highlight the importance of completing the protected area network in order to take into account the dynamic nature of diversity dimensions in the long term.

Supplementary Materials

The following supporting information can be downloaded at: https://www.mdpi.com/article/10.3390/d14100813/s1. Figure S1: Protected areas of the Yucatan Peninsula; Figure S2: Extrapolation risk count resulting from mobility-oriented parity analysis (MOP) based on future projections; Table S1: Number of presence records taken into account in the ecological niche modeling processes together with the nine functional traits used per specie; Table S2: List of APs taken into account to assess their effectiveness in protecting diversity dimensions; Table S3: Results of Wilcoxon tests comparing projected future diversity changes against current diversity patterns; Table S4: Protected areas’ effectiveness in protecting taxonomic diversity and both phylogenetic and functional clustering across scenarios; Table S5: Protected areas’ effectiveness in protecting the 14% most diverse pixels per each diversity dimension after controlling the effect of TD over phylogenetic and functional diversity.

Author Contributions

Conceptualization, F.V., L.M.O.-O. and C.Y.-A.; Data curation, S.M.C.-Q.; Formal analysis, S.M.C.-Q. and J.E.-L.; Funding acquisition, F.V. and C.Y.-A.; Investigation, S.M.C.-Q.; Methodology, S.M.C.-Q. and J.E.-L.; Project administration, F.V. and C.Y.-A.; Resources, C.Y.-A.; Validation, F.V., L.M.O.-O. and C.Y.-A.; Writing—original draft, S.M.C.-Q.; Writing—review and editing, S.M.C.-Q., J.E.-L., F.V., L.M.O.-O. and C.Y.-A. All authors have read and agreed to the published version of the manuscript.

Funding

This research was funded by Consejo Nacional de Ciencia y Tecnología of México (CONACYT), grant number 889393, PAPIIT IA205817 and Secretaría de Investigación, Innovación y Educación Superior del estado de Yucatán (Yucatan Initiative Project-Research Coordination Network: Biodiversity, Genomics, and Niche Modeling Across Multiple Scales in Yucatan).

Data Availability Statement

The data that support the findings of this study are openly available in the FigShare Data Repository: https://figshare.com/articles/journal_contribution/Current_and_future_diversity_patterns_of_amphibians_in_the_Yucatan_Peninsula_and_their_representation_in_Protected_Areas/14575233 (accessed on 8 September 2022).

Acknowledgments

We would like to thank Consejo Nacional de Ciencia y Tecnología of México (CONACYT) for the scholarship granted to S.C.Q. through Posgrado de Ciencias Biológicas UNAM. We are also grateful to Bruno R. Ribeiro for sharing the scripts for randomizations of PAs. This project was supported by PAPIIT IA205817, IN229020, and Secretaría de Investigación, Innovación y Educación Superior del Estado de Yucatán (Yucatan Initiative Project-Research Coordination Network: Biodiversity, Genomics, and Niche Modeling Across Multiple Scales in Yucatan).

Conflicts of Interest

The authors declare no conflict of interest. The funders had no role in the design of the study; in the collection, analyses, or interpretation of data; in the writing of the manuscript; or in the decision to publish the results.

References

  1. Tilman, D. Functional Diversity. Encycl. Biodivers. 2001, 3, 109–120. [Google Scholar]
  2. Véron, S.; Saito, V.; Padilla-García, N.; Forest, F.; Bertheau, Y. The Use of Phylogenetic Diversity in Conservation Biology and Community Ecology: A Common Base but Different Approaches. Q. Rev. Biol 2019, 94, 123–148. [Google Scholar] [CrossRef]
  3. Cardoso, P.; Rigal, F.; Borges, P.A.V.; Carvalho, J.C. A New Frontier in Biodiversity Inventory: A Proposal for Estimators of Phylogenetic and Functional Diversity. Methods Ecol. Evol. 2014, 5, 452–461. [Google Scholar] [CrossRef]
  4. Stroud, J.T.; Bush, M.R.; Ladd, M.C.; Nowicki, R.J.; Shantz, A.A.; Sweatman, J. Is a Community Still a Community? Reviewing Definitions of Key Terms in Community Ecology. Ecol. Evol. 2015, 5, 4757–4765. [Google Scholar] [CrossRef] [PubMed]
  5. Faith, D.P. Conservation Evaluation and Phylogenetic Diversity. Biol. Conserv. 1992, 61, 1–10. [Google Scholar] [CrossRef]
  6. Tucker, C.M.; Cadotte, M.W.; Carvalho, S.B.; Jonathan Davies, T.; Ferrier, S.; Fritz, S.A.; Grenyer, R.; Helmus, M.R.; Jin, L.S.; Mooers, A.O.; et al. A Guide to Phylogenetic Metrics for Conservation, Community Ecology and Macroecology. Biol. Rev. 2017, 92, 698–715. [Google Scholar] [CrossRef]
  7. Cadotte, M.W.; Carscadden, K.; Mirotchnick, N. Beyond Species: Functional Diversity and the Maintenance of Ecological Processes and Services. J. Appl. Ecol. 2011, 48, 1079–1087. [Google Scholar] [CrossRef]
  8. Petchey, O.L.; Gaston, K.J. Functional Diversity: Back to Basics and Looking Forward. Ecol. Lett. 2006, 9, 741–758. [Google Scholar] [CrossRef]
  9. Cadotte, M.; Albert, C.H.; Walker, S.C. The Ecology of Differences: Assessing Community Assembly with Trait and Evolutionary Distances. Ecol. Lett. 2013, 16, 1234–1244. [Google Scholar] [CrossRef]
  10. Pavoine, S.; Gasc, A.; Bonsall, M.B.; Mason, N.W.H. Correlations between Phylogenetic and Functional Diversity: Mathematical Artefacts or True Ecological and Evolutionary Processes? J. Veg. Sci. 2013, 24, 781–793. [Google Scholar] [CrossRef]
  11. Cardillo, M. Phylogenetic Structure of Mammal Assemblages at Large Geographical Scales: Linking Phylogenetic Community Ecology with Macroecology. Philos. Trans. R. Soc. B Biol. Sci. 2011, 366, 2545–2553. [Google Scholar] [CrossRef] [PubMed] [Green Version]
  12. Ouchi-Melo, L.S.; Meynard, C.N.; Gonçalves-Souza, T.; de Cerqueira Rossa-Feres, D. Integrating Phylogenetic and Functional Biodiversity Facets to Guide Conservation: A Case Study Using Anurans in a Global Biodiversity Hotspot. Biodivers Conserv. 2018, 27, 3247–3266. [Google Scholar] [CrossRef]
  13. Fritz, S.A.; Rahbek, C. Global Patterns of Amphibian Phylogenetic Diversity. J. Biogeogr. 2012, 39, 1373–1382. [Google Scholar] [CrossRef]
  14. Holdaway, R.J.; Sparrow, A.D. Assembly Rules Operating along a Primary Riverbed–Grassland Successional Sequence. J. Ecol. 2006, 94, 1092–1102. [Google Scholar] [CrossRef]
  15. Webb, C.O.; Ackerly, D.D.; McPeek, M.A.; Donoghue, M.J. Phylogenies and Community Ecology. Annu. Rev. Ecol. Syst. 2002, 33, 475–505. [Google Scholar] [CrossRef]
  16. Pavoine, S.; Bonsall, M.B. Measuring Biodiversity to Explain Community Assembly: A Unified Approach. Biol. Rev. 2011, 86, 792–812. [Google Scholar] [CrossRef] [PubMed]
  17. Pecl, G.T.; Araújo, M.B.; Bell, J.D.; Blanchard, J.; Bonebrake, T.C.; Chen, I.C.; Clark, T.D.; Colwell, R.K.; Danielsen, F.; Evengård, B.; et al. Biodiversity Redistribution under Climate Change: Impacts on Ecosystems and Human Well-Being. Science (1979) 2017, 355, eaai9214. [Google Scholar] [CrossRef]
  18. Yañez-Arenas, C.; Townsend Peterson, A.; Rodríguez-Medina, K.; Barve, N. Mapping Current and Future Potential Snakebite Risk in the New World. Clim. Change 2016, 134, 697–711. [Google Scholar] [CrossRef]
  19. Menéndez-Guerrero, P.A.; Green, D.M.; Davies, T.J. Climate Change and the Future Restructuring of Neotropical Anuran Biodiversity. Ecography 2020, 43, 222–235. [Google Scholar] [CrossRef]
  20. Peterson, A.T.; Soberón, J.; Pearson, R.G.; Anderson, R.P.; Martínez-Meyer, E.; Nakamura, M.; Araújo, M.B. Ecological Niches and Geographic Distributions; Princeton University Press: Princeton, NJ, USA, 2012. [Google Scholar]
  21. IPCC. 2018: Global Warming of 1.5 °C. An IPCC Special Report on the Impacts of Global Warming of 1.5 °C above Pre-Industrial Levels and Related Global Greenhouse Gas Emission Pathways, in the Context of Strengthening the Global Response to the Threat of Climate Change, Sustainable Development, and Efforts to Eradicate Poverty. Masson-Delmotte, V., Zhai, P., Pörtner, H.-O., Roberts, D., Skea, J., Shukla, P.R., Pirani, A., Moufouma-Okia, W., Péan, C., Pidcock, R., et al., Eds.; In Press. Available online: https://www.ipcc.ch/sr15/download/ (accessed on 11 July 2022).
  22. Tingley, M.W.; Koo, M.S.; Moritz, C.; Rush, A.C.; Beissinger, S.R. The Push and Pull of Climate Change Causes Heterogeneous Shifts in Avian Elevational Ranges. Glob. Change Biol. 2012, 18, 3279–3290. [Google Scholar] [CrossRef]
  23. Berg, M.P.; Kiers, E.T.; Driessen, G.; van der HEIJDEN, M.; Kooi, B.W.; Kuenen, F.; Liefting, M.; Verhoef, H.A.; Ellers, J. Adapt or Disperse: Understanding Species Persistence in a Changing World. Glob. Change Biol. 2010, 16, 587–598. [Google Scholar] [CrossRef]
  24. Peterson, A.T.; Ortega-Huerta, M.A.; Bartley, J.; Sánchez-Cordero, V.; Soberón, J.; Buddemeier, R.H.; Stockwell, D.R.B. Future Projections for Mexican Faunas under Global Climate Change Scenarios. Nature 2002, 416, 626–629. [Google Scholar] [CrossRef] [PubMed]
  25. Cabeza, M.; Moilanen, A. Site-selection Algorithms and Habitat Loss. Conserv. Biol. 2003, 17, 1402–1413. [Google Scholar] [CrossRef]
  26. Margules, C.R.; Pressey, R.L. Systematic Conservation Planning. Nature 2000, 405, 243–253. [Google Scholar] [CrossRef] [PubMed]
  27. Pressey, R.L.; Cabeza, M.; Watts, M.E.; Cowling, R.M.; Wilson, K.A. Conservation Planning in a Changing World. Trends Ecol. Evol. 2007, 22, 583–592. [Google Scholar] [CrossRef]
  28. Cooper, N.; Bielby, J.; Thomas, G.H.; Purvis, A. Macroecology and Extinction Risk Correlates of Frogs. Glob. Ecol. Biogeogr. 2008, 17, 211–221. [Google Scholar] [CrossRef]
  29. Pounds, J.A.; Fogden, M.P.L.; Savage, J.M.; Gorman, G.C. Tests of Null Models for Amphibian Declines on a Tropical Mountain. Conserv. Biol. 1997, 11, 1307–1322. [Google Scholar] [CrossRef]
  30. Pounds, J.A.; Fogden, M.P.L.; Campbell, J.H. Biological Response to Climate Change on a Tropical Mountain. Nature 1999, 398, 611–615. [Google Scholar] [CrossRef]
  31. Stuart, S.N.; Chanson, J.S.; Cox, N.A.; Young, B.E.; Rodrigues, A.S.L.; Fischman, D.L.; Waller, R.W. Status and Trends of Amphibian Declines and Extinctions Worldwide. Science (1979) 2004, 306, 1783–1786. [Google Scholar] [CrossRef]
  32. Ackerly, D.D.; Loarie, S.R.; Cornwell, W.K.; Weiss, S.B.; Hamilton, H.; Branciforte, R.; Kraft, N.J.B. The Geography of Climate Change: Implications for Conservation Biogeography: Geography of Climate Change. Divers. Distrib. 2010, 16, 476–487. [Google Scholar] [CrossRef]
  33. Hof, C.; Araújo, M.B.; Jetz, W.; Rahbek, C. Additive Threats from Pathogens, Climate and Land-Use Change for Global Amphibian Diversity. Nature 2011, 480, 516–519. [Google Scholar] [CrossRef] [PubMed]
  34. Li, Y.; Cohen, J.M.; Rohr, J.R. Review and Synthesis of the Effects of Climate Change on Amphibians. Integr. Zool. 2013, 8, 145–161. [Google Scholar] [CrossRef] [PubMed]
  35. Ochoa-Ochoa, L.M.; Rodríguez, P.; Mora, F.; Flores-Villela, O.; Whittaker, R.J. Climate Change and Amphibian Diversity Patterns in Mexico. Biol. Conserv. 2012, 150, 94–102. [Google Scholar] [CrossRef]
  36. Blaustein, A.R.; Walls, S.C.; Bancroft, B.A.; Lawler, J.J.; Searle, C.L.; Gervasi, S.S. Direct and Indirect Effects of Climate Change on Amphibian Populations. Diversity 2010, 2, 281. [Google Scholar] [CrossRef]
  37. Parra-Olea, G.; Flores-Villela, O.; Mendoza-Almeralla, C. Biodiversidad de anfibios en México. Rev. Mex. Biodivers. 2014, 85, 460–466. [Google Scholar] [CrossRef]
  38. González-Sánchez, V.H.; Johnson, J.D.; García-Padilla, E.; Mata-Silva, V.; DeSantis, D.L.; Wilson, L.D. The Herpetofauna of the Mexican Yucatan Peninsula: Composition, Distribution, and Conservation. Mesoam. Herpetol. 2017, 4, 264–380. [Google Scholar]
  39. Pérez-Sarabia, J.E.; de Stefano, R.; Fernández-Concha, G.C.; Ramírez Morillo, I.; Méndez-Jiménez, N.; Zamora-Crescencio, P.; Gutiérrez-Baez, C.; Cetzal-Ix, W. The floristic knowledge of the Yucatan peninsula, Mexico. Polibotanica 2017, 44, 39–49. [Google Scholar] [CrossRef]
  40. Sáenz-Romero, C.; Rehfeldt, G.E.; Crookston, N.L.; Duval, P.; St-Amant, R.; Beaulieu, J.; Richardson, B.A. Spline Models of Contemporary, 2030, 2060 and 2090 Climates for Mexico and Their Use in Understanding Climate-Change Impacts on the Vegetation. Clim. Change 2010, 102, 595–623. [Google Scholar] [CrossRef]
  41. Islebe, G.A.; Calmé, S.; León-Cortés, J.L.; Schmook, B. Biodiversity and Conservation of the Yucatán Peninsula, 1st ed.; Springer: Cham, Switzerland, 2015; Volume 1, ISBN 978-3-319-06528-1/978-3-319-06529-8. [Google Scholar]
  42. Ochoa-Ochoa, L.M.; Mejía-Domínguez, N.R.; Velasco, J.A.; Dimitrov, D.; Marske, K.A. Dimensions of Amphibian Alpha Diversity in the New World. J. Biogeogr. 2020, 47, 2293–2302. [Google Scholar] [CrossRef]
  43. Vázquez-Domínguez, E.; Arita, H.T. The Yucatan Peninsula: Biogeographical History 65 Million Years in the Making. Ecography 2010, 33, 212–219. [Google Scholar] [CrossRef]
  44. Morrone, J.J. Hacia Una Síntesis Biogeográfica de México. Rev. Mex. Biodivers. 2005, 76, 207–252. [Google Scholar] [CrossRef]
  45. INEGI Uso Del Suelo y Vegetación de México, (Serie VI), INEGI, 2014–2017. Available online: https://www.inegi.org.mx/temas/usosuelo/ (accessed on 24 May 2021).
  46. White, D.A.; Hood, C.S. Vegetation Patterns and Environmental Gradients in Tropical Dry Forests of the Northern Yucatan Peninsula. J. Veg. Sci. 2004, 15, 151–160. [Google Scholar] [CrossRef]
  47. Köhler, G. Amphibians of Central America; Herpeton Verlag Elke Köhler: Offenbach, Germany, 2011; ISBN 978-3-936180-33-6. [Google Scholar]
  48. Soberon, J.; Peterson, A.T. Interpretation of Models of Fundamental Ecological Niches and Species’ Distributional Areas. Biodivers. Inform. 2005, 2. [Google Scholar] [CrossRef]
  49. Barve, N.; Barve, V.; Jiménez-Valverde, A.; Lira-Noriega, A.; Maher, S.P.; Peterson, A.T.; Soberón, J.; Villalobos, F. The Crucial Role of the Accessible Area in Ecological Niche Modeling and Species Distribution Modeling. Ecol. Model. 2011, 222, 1810–1819. [Google Scholar] [CrossRef]
  50. Cooper, J.C.; Soberón, J. Creating Individual Accessible Area Hypotheses Improves Stacked Species Distribution Model Performance. Glob. Ecol. Biogeogr. 2018, 27, 156–165. [Google Scholar] [CrossRef]
  51. Olson, D.M.; Dinerstein, E.; Wikramanayake, E.D.; Burgess, N.D.; Powell, G.V.N.; Underwood, E.C.; D’amico, J.A.; Itoua, I.; Strand, H.E.; Morrison, J.C. Terrestrial Ecoregions of the World: A New Map of Life on EarthA New Global Map of Terrestrial Ecoregions Provides an Innovative Tool for Conserving Biodiversity. Bioscience 2001, 51, 933–938. [Google Scholar] [CrossRef]
  52. Hijmans, R.J.; van Etten, J.; Cheng, J.; Summer, M.; Mattiuzzi, M. Raster: Geographic Data Analysis and Modeling. R Package Version 2.7-15. Available online: https://cran.r-project.org/web/packages/raster/index.html (accessed on 22 February 2019).
  53. Bivand, R.; Keitt, T.; Rowlingson, B. Rgdal: Bindings for the “Geospatial” Data Abstraction Library. Available online: https://cran.r-project.org/web/packages/rgdal/index.html (accessed on 22 February 2019).
  54. Boria, R.A.; Olson, L.E.; Goodman, S.M.; Anderson, R.P. Spatial Filtering to Reduce Sampling Bias Can Improve the Performance of Ecological Niche Models. Ecol. Model. 2014, 275, 73–77. [Google Scholar] [CrossRef]
  55. Varela, S.; Anderson, R.P.; García-Valdés, R.; Fernández-González, F. Environmental Filters Reduce the Effects of Sampling Bias and Improve Predictions of Ecological Niche Models. Ecography 2014, 37, 1084–1091. [Google Scholar] [CrossRef]
  56. Muscarella, R.; Galante, P.J.; Soley-Guardia, M.; Boria, R.A.; Kass, J.M.; Uriarte, M.; Anderson, R.P. ENMeval: An R Package for Conducting Spatially Independent Evaluations and Estimating Optimal Model Complexity for Maxent Ecological Niche Models. Methods Ecol. Evol. 2014, 5, 1198–1205. [Google Scholar] [CrossRef]
  57. Hijmans, R.J.; Cameron, S.E.; Parra, J.L.; Jones, P.G.; Jarvis, A. Very High Resolution Interpolated Climate Surfaces for Global Land Areas. Int. J. Climatol. 2005, 25, 1965–1978. [Google Scholar] [CrossRef]
  58. Ashraf, U.; Peterson, A.T.; Chaudhry, M.N.; Ashraf, I.; Saqib, Z.; Rashid Ahmad, S.; Ali, H. Ecological Niche Model Comparison under Different Climate Scenarios: A Case Study of Olea Spp. in Asia. Ecosphere 2017, 8, e01825. [Google Scholar] [CrossRef]
  59. Taylor, K.E.; Stouffer, R.J.; Meehl, G.A. An Overview of CMIP5 and the Experiment Design. Bull. Am. Meteorol. Soc. 2012, 93, 485–498. [Google Scholar] [CrossRef] [Green Version]
  60. Diniz-Filho, J.A.F.; Mauricio Bini, L.; Fernando Rangel, T.; Loyola, R.D.; Hof, C.; Nogués-Bravo, D.; Araújo, M.B. Partitioning and Mapping Uncertainties in Ensembles of Forecasts of Species Turnover under Climate Change. Ecography 2009, 32, 897–906. [Google Scholar] [CrossRef]
  61. Barve, N.; Barve, V. ENMGadgets: Tools for Pre and Post Processing in ENM Workflows. Available online: https://github.com/narayanibarve/ENMGadgets. (accessed on 22 February 2019).
  62. Cobos, M.E.; Peterson, A.T.; Barve, N.; Osorio-Olvera, L. Kuenm: An R Package for Detailed Development of Ecological Niche Models Using Maxent. PeerJ 2019, 7, e6281. [Google Scholar] [CrossRef] [PubMed]
  63. Phillips, S.J.; Anderson, R.P.; Schapire, R.E. Maximum Entropy Modeling of Species Geographic Distributions. Ecol. Model. 2006, 190, 231–259. [Google Scholar] [CrossRef]
  64. R Core Team. R: A Language and Environment for Statistical Computing; R Foundation for Statistical Computing: Vienna, Austria, 2018. [Google Scholar]
  65. Peterson, A.T.; Papeş, M.; Soberón, J. Rethinking Receiver Operating Characteristic Analysis Applications in Ecological Niche Modeling. Ecol. Model. 2008, 213, 63–72. [Google Scholar] [CrossRef]
  66. Warren, D.L.; Seifert, S.N. Ecological Niche Modeling in Maxent: The Importance of Model Complexity and the Performance of Model Selection Criteria. Ecol. Appl. 2011, 21, 335–342. [Google Scholar] [CrossRef]
  67. Velasco, J.A.; González-Salazar, C. Akaike Information Criterion Should Not Be a “Test” of Geographical Prediction Accuracy in Ecological Niche Modelling. Ecol. Inform. 2019, 51, 25–32. [Google Scholar] [CrossRef]
  68. Gaston, K.J. The Structure and Dynamics of Geographic Ranges; Oxford University Press: Oxford, UK, 2003; ISBN 0-19-852641-5. [Google Scholar]
  69. Osorio-Olvera, L.; Lira-Noriega, A.; Soberón, J.; Peterson, A.T.; Falconi, M.; Contreras-Díaz, R.G.; Martínez-Meyer, E.; Barve, V.; Barve, N. Ntbox: An r Package with Graphical User Interface for Modelling and Evaluating Multidimensional Ecological Niches. Methods Ecol. Evol. 2020, 11, 1199–1206. [Google Scholar] [CrossRef]
  70. Owens, H.L.; Campbell, L.P.; Dornak, L.L.; Saupe, E.E.; Barve, N.; Soberón, J.; Ingenloff, K.; Lira-Noriega, A.; Hensz, C.M.; Myers, C.E.; et al. Constraints on Interpretation of Ecological Niche Models by Limited Environmental Ranges on Calibration Areas. Ecol. Model. 2013, 263, 10–18. [Google Scholar] [CrossRef]
  71. Vilela, B.; Villalobos, F. LetsR: A New R Package for Data Handling and Analysis in Macroecology. Methods Ecol. Evol. 2015, 6, 1229–1234. [Google Scholar] [CrossRef]
  72. D’Amen, M.; Mateo, R.G.; Pottier, J.; Thuiller, W.; Maiorano, L.; Pellissier, L.; Ndiribe, C.; Salamin, N.; Guisan, A. Improving Spatial Predictions of Taxonomic, Functional and Phylogenetic Diversity. J. Ecol. 2018, 106, 76–86. [Google Scholar] [CrossRef] [Green Version]
  73. Rao, C.R. Diversity and Dissimilarity Coefficients: A Unified Approach. Theor. Popul. Biol. 1982, 21, 24–43. [Google Scholar] [CrossRef]
  74. de Bello, F.; Carmona, C.P.; Lepš, J.; Szava-Kovats, R.; Pärtel, M. Functional Diversity through the Mean Trait Dissimilarity: Resolving Shortcomings with Existing Paradigms and Algorithms. Oecologia 2016, 180, 933–940. [Google Scholar] [CrossRef]
  75. Jetz, W.; Pyron, R.A. The Interplay of Past Diversification and Evolutionary Isolation with Present Imperilment across the Amphibian Tree of Life. Nat. Ecol. Evol. 2018, 2, 850–858. [Google Scholar] [CrossRef]
  76. Pavoine, S.; Vallet, J.; Dufour, A.-B.; Gachet, S.; Daniel, H. On the Challenge of Treating Various Types of Variables: Application for Improving the Measurement of Functional Diversity. Oikos 2009, 118, 391–402. [Google Scholar] [CrossRef]
  77. Sodhi, N.S.; Bickford, D.; Diesmos, A.C.; Lee, T.M.; Koh, L.P.; Brook, B.W.; Sekercioglu, C.H.; Bradshaw, C.J.A. Measuring the Meltdown: Drivers of Global Amphibian Extinction and Decline. PLoS ONE 2008, 3, e1636. [Google Scholar] [CrossRef]
  78. Oliveira, B.F.; São-Pedro, V.A.; Santos-Barrera, G.; Penone, C.; Costa, G.C. AmphiBIO, a Global Database for Amphibian Ecological Traits. Sci. Data 2017, 4, 170123. [Google Scholar] [CrossRef] [PubMed]
  79. Jost, L. Partitioning Diversity into Independent Alpha and Beta Components. Ecology 2007, 88, 2427–2439. [Google Scholar] [CrossRef]
  80. de Bello, F.; Lavergne, S.; Meynard, C.N.; Lepš, J.; Thuiller, W. The Partitioning of Diversity: Showing Theseus a Way out of the Labyrinth. J. Veg. Sci. 2010, 21, 992–1000. [Google Scholar] [CrossRef]
  81. Vallejos, R.; Osorio, F.; Bevilacqua, M. Spatial Relationships Between Two Georeferenced Variables With Applications in R; Springer: Cham, Switzerland, 2020. [Google Scholar]
  82. Clifford, P.; Richardson, S.; Hemon, D. Assessing the Significance of the Correlation between Two Spatial Processes. Biometrics 1989, 45, 123–134. [Google Scholar] [CrossRef] [PubMed]
  83. Dutilleul, P.; Clifford, P.; Richardson, S.; Hemon, D. Modifying the t Test for Assessing the Correlation between Two Spatial Processes. Biometrics 1993, 49, 305–314. [Google Scholar] [CrossRef]
  84. Gotelli, N.J.; McCabe, D.J. Species Co-occurrence: A Meta-analysis of JM Diamond’s Assembly Rules Model. Ecology 2002, 83, 2091–2096. [Google Scholar] [CrossRef]
  85. Nori, J.; Villalobos, F.; Loyola, R. Global Priority Areas for Amphibian Research. J. Biogeogr. 2018, 45, 2588–2594. [Google Scholar] [CrossRef]
  86. Ferro, V.G.; Lemes, P.; Melo, A.S.; Loyola, R. The Reduced Effectiveness of Protected Areas under Climate Change Threatens Atlantic Forest Tiger Moths. PLoS ONE 2014, 9, e107792. [Google Scholar] [CrossRef] [PubMed]
  87. Lemes, P.; Melo, A.S.; Loyola, R.D. Climate Change Threatens Protected Areas of the Atlantic Forest. Biodivers. Conserv. 2014, 23, 357–368. [Google Scholar] [CrossRef]
  88. Ribeiro, B.R.; Sales, L.P.; de Marco, P.; Loyola, R. Assessing Mammal Exposure to Climate Change in the Brazilian Amazon. PLoS ONE 2016, 11, e0165073. [Google Scholar] [CrossRef]
  89. Devictor, V.; Mouillot, D.; Meynard, C.; Jiguet, F.; Thuiller, W.; Mouquet, N. Spatial Mismatch and Congruence between Taxonomic, Phylogenetic and Functional Diversity: The Need for Integrative Conservation Strategies in a Changing World. Ecol. Lett. 2010, 13, 1030–1040. [Google Scholar] [CrossRef]
  90. Safi, K.; Cianciaruso, M.V.; Loyola, R.D.; Brito, D.; Armour-Marshall, K.; Diniz-Filho, J.A.F. Understanding Global Patterns of Mammalian Functional and Phylogenetic Diversity. Philos. Trans. R. Soc. B Biol. Sci. 2011, 366, 2536–2544. [Google Scholar] [CrossRef]
  91. Buckley, L.B.; Jetz, W. Environmental and Historical Constraints on Global Patterns of Amphibian Richness. Proc. R. Soc. B Biol. Sci. 2007, 274, 1167–1173. [Google Scholar] [CrossRef]
  92. Lion, M.B.; Mazzochini, G.G.; Garda, A.A.; Lee, T.M.; Bickford, D.; Costa, G.C.; Fonseca, C.R. Global Patterns of Terrestriality in Amphibian Reproduction. Glob. Ecol. Biogeogr. 2019, 28, 744–756. [Google Scholar] [CrossRef]
  93. Araújo, M.B.; Thuiller, W.; Pearson, R.G. Climate Warming and the Decline of Amphibians and Reptiles in Europe. J. Biogeogr. 2006, 33, 1712–1728. [Google Scholar] [CrossRef]
  94. Redding, D.W.; Mooers, A.O. Incorporating Evolutionary Measures into Conservation Prioritization. Conserv. Biol. 2006, 20, 1670–1678. [Google Scholar] [CrossRef] [PubMed]
  95. Weiher, E.; Keddy, P.A. Assembly Rules, Null Models, and Trait Dispersion: New Questions from Old Patterns. Oikos 1995, 74, 159. [Google Scholar] [CrossRef]
  96. Ochoa-Ochoa, L.M.; Munguía, M.; Lira-Noriega, A.; Sánchez-Cordero, V.; Flores-Villela, O.; Navarro-Sigüenza, A.; Rodríguez, P. Spatial Scale and β-Diversity of Terrestrial Vertebrates in Mexico. Rev. Mex. Biodivers. 2014, 85, 918–930. [Google Scholar] [CrossRef]
  97. Emerson, B.C.; Gillespie, R.G. Phylogenetic Analysis of Community Assembly and Structure over Space and Time. Trends Ecol. Evol. 2008, 23, 619–630. [Google Scholar] [CrossRef]
  98. Sobral, F.L.; Cianciaruso, M.V. Functional and Phylogenetic Structure of Forest and Savanna Bird Assemblages across Spatial Scales. Ecography 2016, 39, 533–541. [Google Scholar] [CrossRef]
  99. Meynard, C.N.; Devictor, V.; Mouillot, D.; Thuiller, W.; Jiguet, F.; Mouquet, N. Beyond Taxonomic Diversity Patterns: How Do α, β and γ Components of Bird Functional and Phylogenetic Diversity Respond to Environmental Gradients across France? Glob. Ecol. Biogeogr. 2011, 20, 893–903. [Google Scholar] [CrossRef]
  100. Wiens, J.J.; Graham, C.H. Niche Conservatism: Integrating Evolution, Ecology, and Conservation Biology. Annu. Rev. Ecol. Evol. Syst. 2005, 36, 519–539. [Google Scholar] [CrossRef]
  101. Enriquez-Urzelai, U.; Bernardo, N.; Moreno-Rueda, G.; Montori, A.; Llorente, G. Are Amphibians Tracking Their Climatic Niches in Response to Climate Warming? A Test with Iberian Amphibians. Clim. Change 2019, 154, 289–301. [Google Scholar] [CrossRef]
  102. Pacifici, M.; Foden, W.B.; Visconti, P.; Watson, J.E.M.; Butchart, S.H.M.; Kovacs, K.M.; Scheffers, B.R.; Hole, D.G.; Martin, T.G.; Akçakaya, H.R.; et al. Assessing Species Vulnerability to Climate Change. Nat Clim. Change 2015, 5, 215–225. [Google Scholar] [CrossRef]
  103. Beale, C.M.; Lennon, J.J. Incorporating Uncertainty in Predictive Species Distribution Modelling. Philos. Trans. R. Soc. B Biol. Sci. 2012, 367, 247–258. [Google Scholar] [CrossRef] [PubMed]
  104. Cruz-Cárdenas, G.; Villaseñor, J.L.; López-Mata, L.; Martínez-Meyer, E.; Ortiz, E. Selection of Environmental Predictors for Species Distribution Modeling in Maxent. Rev. Chapingo Ser. Cienc. For. Ambiente 2014, 20, 188–201. [Google Scholar] [CrossRef]
  105. Peterson, A.T.; Nakazawa, Y. Environmental Data Sets Matter in Ecological Niche Modelling: An Example with Solenopsis Invicta and Solenopsis Richteri. Glob. Ecol. Biogeogr. 2008, 17, 135–144. [Google Scholar] [CrossRef]
  106. Radosavljevic, A.; Anderson, R.P. Making Better MAXENT Models of Species Distributions: Complexity, Overfitting and Evaluation. J. Biogeogr. 2014, 41, 629–643. [Google Scholar] [CrossRef]
  107. Peterson, A.T.; Cobos, M.E.; Jiménez-García, D. Major Challenges for Correlational Ecological Niche Model Projections to Future Climate Conditions. Ann. N. Y. Acad. Sci. 2018, 1429, 66–77. [Google Scholar] [CrossRef]
  108. Martinez-Meyer, E. Climate Change and Biodiversity: Some Considerations in Forecasting Shifts in Species’ Potential Distributions. Biodivers. Inform. 2005, 2, 42–55. [Google Scholar] [CrossRef]
  109. Thuiller, W.; Maiorano, L.; Mazel, F.; Guilhaumon, F.; Ficetola, G.F.; Lavergne, S.; Renaud, J.; Roquet, C.; Mouillot, D. Conserving the Functional and Phylogenetic Trees of Life of European Tetrapods. Philos. Trans. R. Soc. B Biol. Sci. 2015, 370, 20140005. [Google Scholar] [CrossRef]
  110. Nori, J.; Lemes, P.; Urbina-Cardona, N.; Baldo, D.; Lescano, J.; Loyola, R. Amphibian Conservation, Land-Use Changes and Protected Areas: A Global Overview. Biol. Conserv. 2015, 191, 367–374. [Google Scholar] [CrossRef]
  111. Zupan, L.; Cabeza, M.; Maiorano, L.; Roquet, C.; Devictor, V.; Lavergne, S.; Mouillot, D.; Mouquet, N.; Renaud, J.; Thuiller, W. Spatial Mismatch of Phylogenetic Diversity across Three Vertebrate Groups and Protected Areas in Europe. Divers. Distrib. 2014, 20, 674–685. [Google Scholar] [CrossRef]
  112. Forest, F.; Grenyer, R.; Rouget, M.; Davies, T.J.; Cowling, R.M.; Faith, D.P.; Balmford, A.; Manning, J.C.; Procheş, Ş.; van der Bank, M.; et al. Preserving the Evolutionary Potential of Floras in Biodiversity Hotspots. Nature 2007, 445, 757–760. [Google Scholar] [CrossRef] [PubMed]
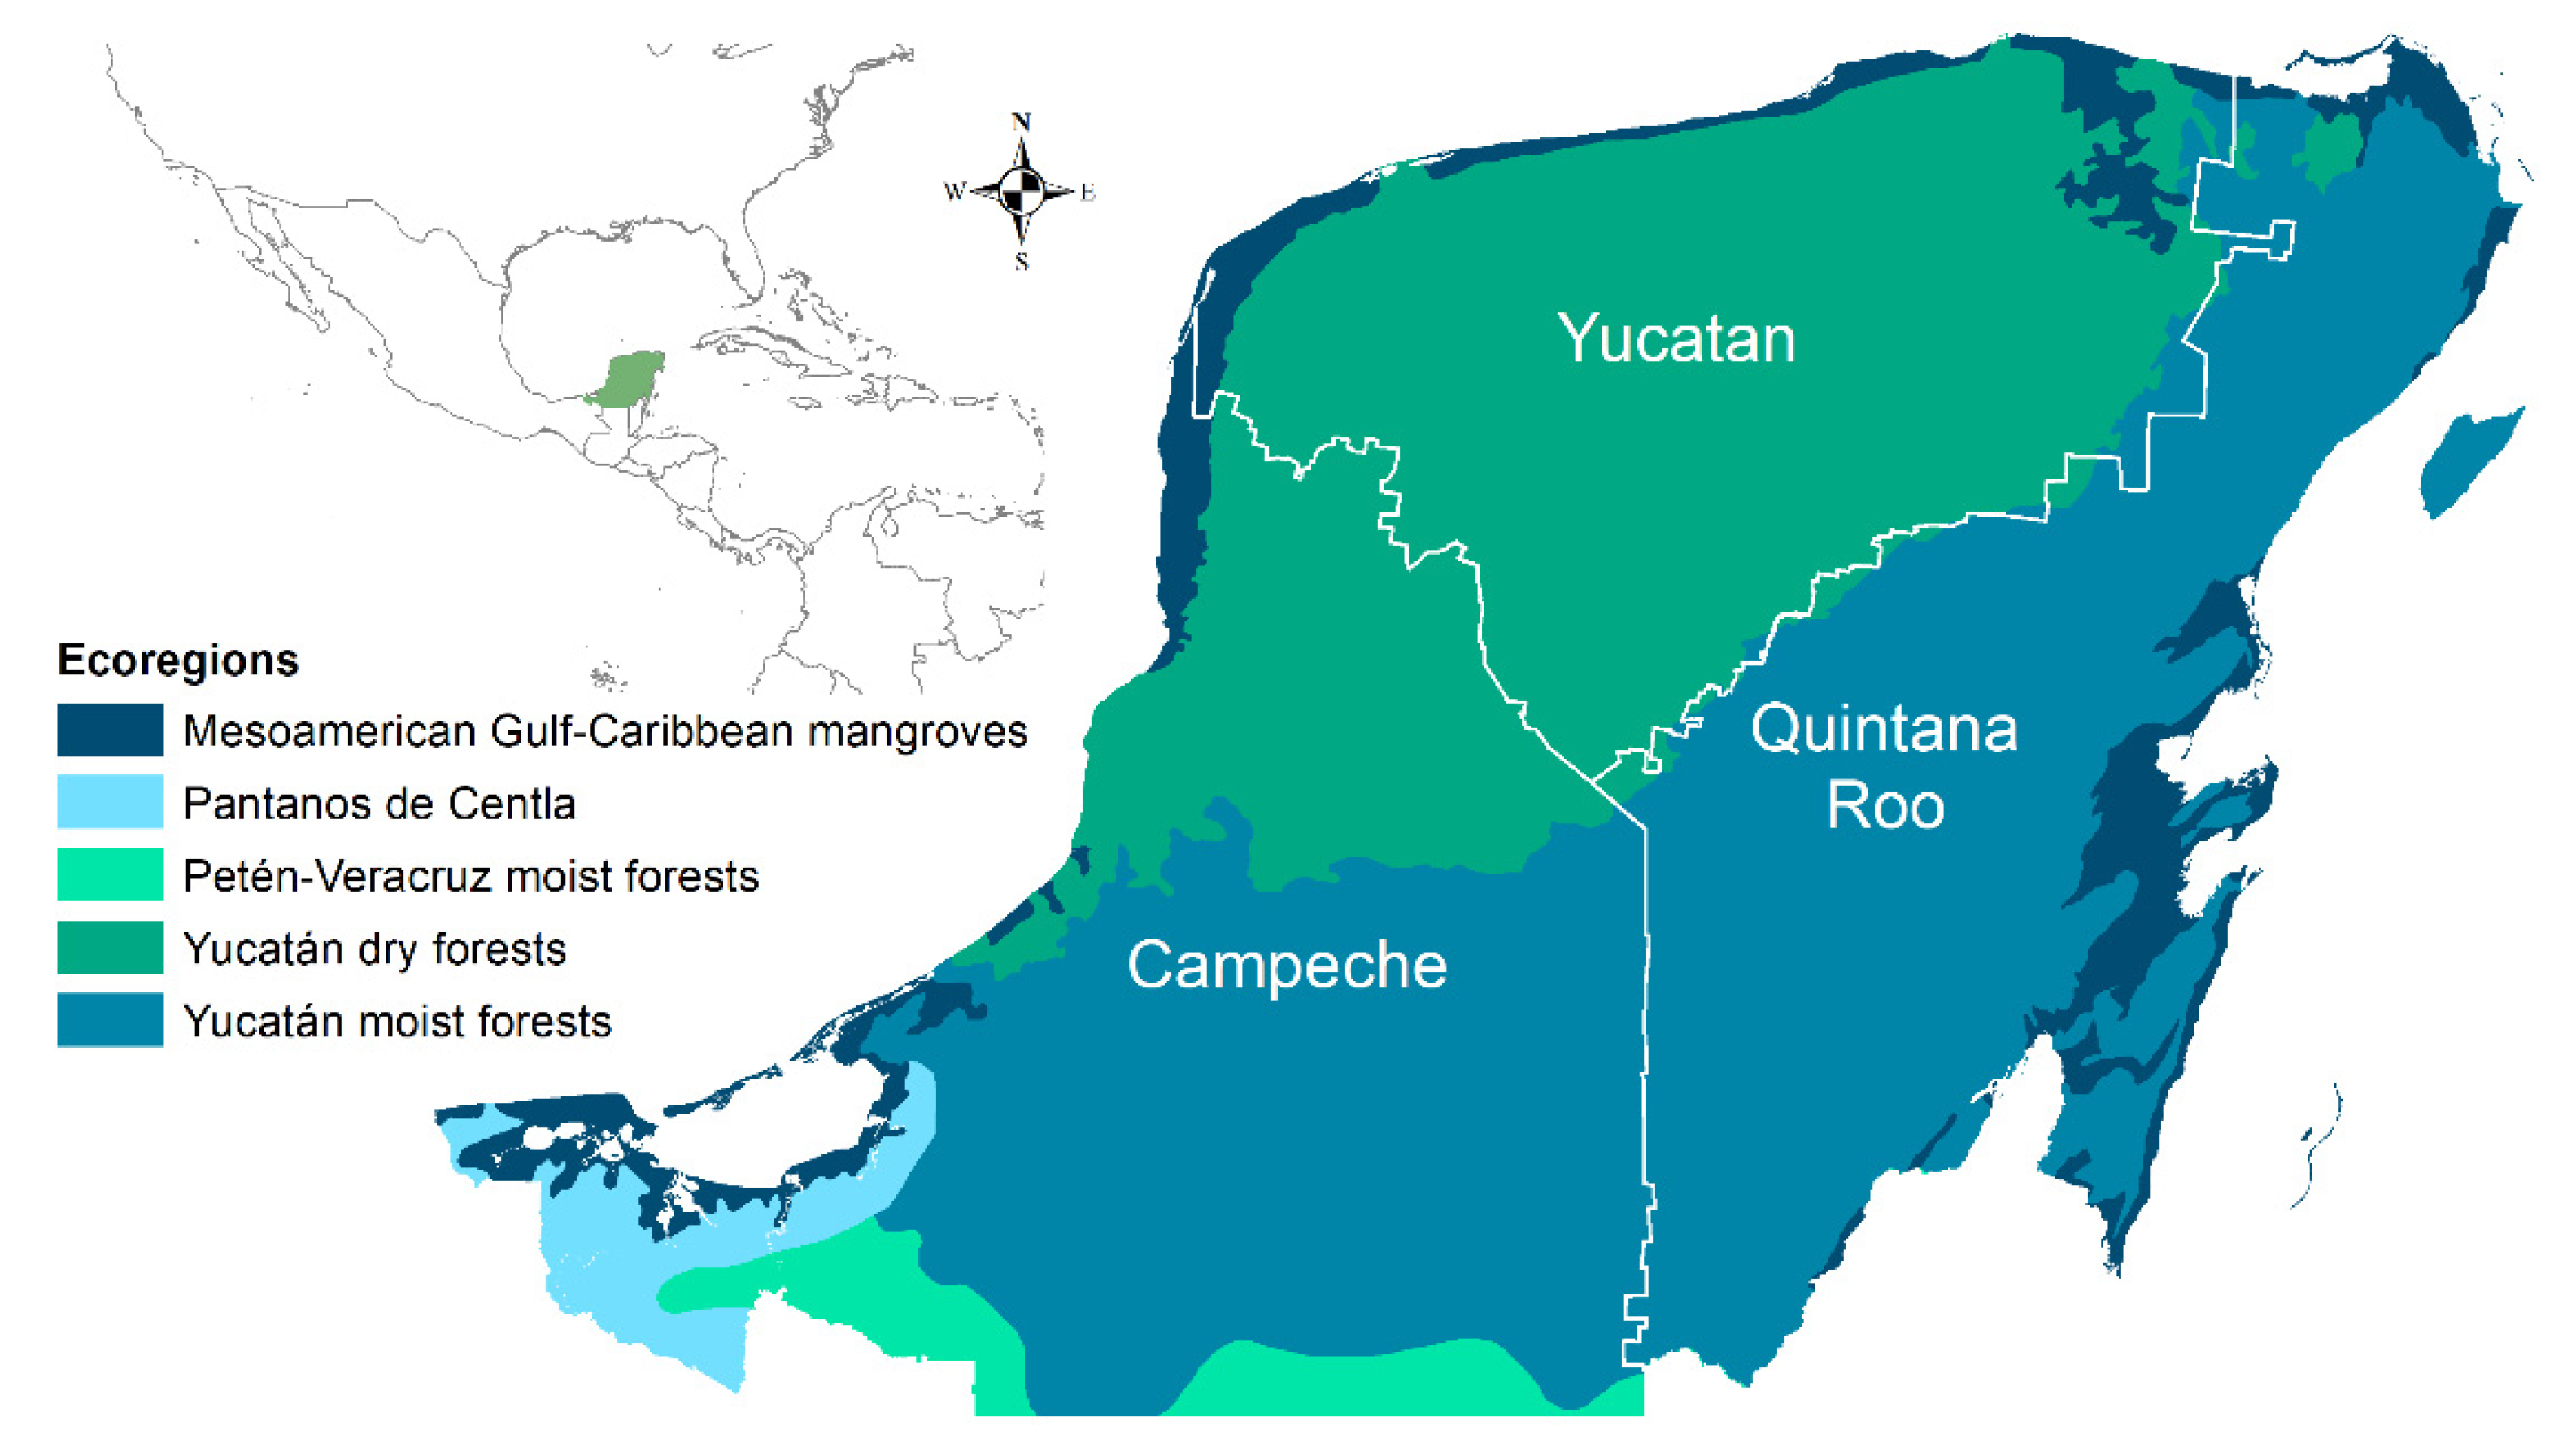
Figure 1. Mexican portion of the Yucatan Peninsula with ecoregions. White lines stand for administrative states.
Diversity 14 00813 g001
Figure 2. Percentage changes in diversity patterns throughout the evaluated scenarios. Positive percentage values mean projected increase in a diversity measurement in the future scenarios compared with the current. Negative percentage means the opposite, that is a decrease in diversity regarding to the current scenario. Columns indicate diversity dimensions and rows current and future scenarios. Current scenario: (ac); 2050-rcp45: (df); 2050-rcp85: (gi); 2070-rcp45: (jl), and 2070-rcp85: (mo). Inset plots represent raw values for each diversity dimension.
Diversity 14 00813 g002
Figure 3. Mean diversity values comparison per dimension and scenario. (a) Taxonomic diversity, (b) phylogenetic diversity, and (c) functional diversity.
Diversity 14 00813 g003
Figure 4. Raw standardized effect size (SES) values for phylogenetic and functional diversities (SES.PD: (a,e,i,m,q) and SES.FD: (c,g,k,o,s)). The identified and reclassified significant values depicting phylogenetic or functional clustered assemblages, cPD and cFD, respectively, are shown in blue. cPD: (b,f,j,n,r); cFD: (d,h,l,p,t).
Diversity 14 00813 g004
Table 1. Pearson correlations between TD, PD, and FD. Applying the Dutilleul method (1993), spatial autocorrelation was taken into account prior to the estimation of statistical significance (p-value). In each column, the correlation value between pairs of diversities is presented. *** p < 0.001; ** p < 0.01; * p < 0.05.
ScenarioTD–PDF-StatTD–FDF-StatPD–FDF-Stat
Present0.616 ***0.6110.500 ***0.3340.910 ***4.812
2050-rcp450.508 ***0.3490.319 *0.1130.813 ***1.952
2050-rcp850.565 ***0.4690.352 **0.1420.784 ***1.594
2070-rcp450.790 ***1.6600.569 ***0.4790.856 ***2.747
2070-rcp850.519 ***0.3700.0560.0030.633 ***0.668
Publisher’s Note: MDPI stays neutral with regard to jurisdictional claims in published maps and institutional affiliations.