Article

Ectomycorrhizospheric Microbiome Assembly Rules of Quercus mongolica in the Habitat of SongRong (Tricholoma matsutake) and the Effect of Neighboring Plants

1
Engineering Research Center of Edible and Medicinal Fungi, Ministry of Education, Jilin Agricultural University, Changchun 130118, China
2
Shanghai Shbio Biotechnology Corporation, Shanghai 201203, China
3
Jilin Forestry Science Institute, Changchun 130032, China
*
Authors to whom correspondence should be addressed.
These authors contributed equally to this work.
Diversity 2022, 14(10), 810; https://doi.org/10.3390/d14100810
Submission received: 22 August 2022 / Revised: 25 September 2022 / Accepted: 26 September 2022 / Published: 28 September 2022
(This article belongs to the Section Microbial Diversity and Culture Collections)

Abstract

:
Host plants are known to determine the distribution and development of ectomycorrhizal fungi such as Tricholoma matsutake; however, we found that the fruit body distribution of T. matsutake was different in Quercus mongolica pure or mixed forests. To clarify the fungal and other microbial composition rules of host plants, ectomycorrhizal root tip samples of Q. mongolica mixed with different plants were selected for study. By using high-throughput sequencing, we obtained 5229 fungal and 38,834 bacterial amplicon sequence variants (ASVs) as determined by internally transcribed spacer ribosomal RNA (ITS rRNA) and 16S ribosomal RNA (16S rRNA) sequencing via the Illumina NovaSeq platform. Among the neighboring plants, there were no significant differences in fungal or bacterial alpha diversity, but there was a significant difference (p < 0.05) in ectomycorrhizal alpha diversity. The fungal, bacterial and ectomycorrhizal fungal communities in the ectomycorrhizosphere of Q. mongolica all showed differences in beta diversity and species composition. In addition, the physical and chemical properties of the soil and the relationships among species could affect the relative abundance of fungi, bacteria and ectomycorrhizal fungi, but the soil microbial pool had little effect on microbial composition. Using PICRUSt2, some significantly up-regulated (p < 0.05) metabolic functions in ectomycorrrhizospheric microbial communities were predicted, which would be an interesting research field for ectomycorrhizal microecology.

1. Introduction

Mycorrhizal fungi are widely found in terrestrial ecosystems and form mycorrhizas on most vascular and non-vascular plants, or nearly 80% of the world’s plant species, among which angiosperms are the most common [1]. Ectomycorrhizal symbiosis plays an important role in forest ecosystems [2,3,4,5,6]. For example, Pinus koraiensis grows close to ectomycorrhizal fungi (ECMFs) such as Suillus, Russula, and Lactarius [7], and the endangered subalpine tree species Pinus albicaulis requires association with an ECMF for survival and growth [8]. An ectomycorrhiza (ECM) is a microecosystem formed by abiotic components and the roots of higher plants, fungi, bacteria, and other biotic factors [9,10], and the significance of ECMFs in carbon and nutrient cycling of host trees has been well-documented [11].
Some symbiotic plant–fungus relationships have specific morphological structures [7], where plants, ECMFs, other microorganisms and soil factors exchange matter and energy [12] to form an ectomycorrhizosphere. Tricholoma matsutake (Ito and Imai) is an ECMF well-known for the economic and medicinal value of its fruiting bodies [13]. Research has also shown that enrichment of the T. matsutake mycelium biomass, known as Shiro, is closely related to fruiting body formation [14,15]. Soil microorganisms in the Shiro have certain relationships with the fruiting and formation of mycorrhizae [16,17,18,19,20,21,22], which provide a beneficial basis for the artificial cultivation of T. matsutake (e.g., slow growth rate in in vitro culture of the pure mycelium and the survival rate of ectomycorrhizal seedlings [23,24,25,26]).
We know that the distribution and development of fruiting bodies are closely related to their host plants [27,28]. T. matsutake, for example, usually grows in Japanese red pine (Pinus densiflora Siebold and Zucc.) [29,30,31,32], Quercus mongolica, and Q. aquifolioides forests [33,34,35]. However, little is known about the composition and function of microbes in the ectomycorrhizosphere or the influences of biotic or abiotic factors. Therefore, a clear understanding of the microbial composition and influencing factors of the ectomycorrhizosphere system would be of great significance for the study of the selection mechanism of the T. matsutake host, and for the artificial cultivation of T. matsutake.
To investigate the growth of T. matsutake with different neighboring plants in a Q. mongolica forest, three sample plots were selected as study sites. We hypothesized that the fungal and bacterial distributions in the host ectomycorrhizal root tips were not only related to the host species but also to the neighboring plants and that the soil microbial pool, climate factors, and correlations of species also influenced the ectomycorrhizospheric microbiome.

2. Materials and Methods

2.1. Sampling Sites

Samples were taken from June to September, which is the growing season in northeast China. We selected three sampling sites. Sample plot A is a pure forest of Q. mongolica (i.e., no other woody plants) in Baoqing County, Heilongjiang Province (132°3′2.35″ E, 46°7′20.19″ N, 230 m a.s.l.). Sample plot B is a mixed forest of Q. mongolica and Rhododendron dauricum also in Baoqing County (132°3′3.54″ E, 46°7′16.72″ N, 280 m a.s.l.). Sample plot C is forest of Q. mongolica mixed with R. dauricum, and Pinus densiflora in Longjing County, Jilin Province (129°39′52.70″ E, 42°33′31.75″ N, 380 m asl.). Samples QA, QB and QC are the ectomycorrhizal root tips of Q. mongolica from plots A, B, C, respectively.

2.2. Sample Collection and Processing

At all three sites, five 20 × 20 m quadrats were sectioned off and in each of them plant roots and rhizosphere soils were sampled using a five-point method [36]. The roots and soil of the same plant in all five quadrats were mixed into one sample, put into a box with dry ice and sent to the laboratory as quickly as possible.
The root samples were soaked in 0.1% tween 20 for 1 h at room temperature and rinsed repeatedly with clean water to remove soil impurities. Ectomycorrhizae with enlarged root tips were selected under a stereomicroscope, put into 50 mL centrifuge tubes, and stored in a refrigerator at −70 °C for later DNA extraction and high-throughput sequencing.

2.3. DNA Extraction

To extract the total microbial genomic DNA in the ectomycorrhizal root tips, we used the DNeasy Power Soil Kit (QIAGEN, Inc., Hilden, Germany). The samples were lysed by chemical and mechanical homogenization. A lysis buffer was added to a mixed zirconium bead tube containing the sample. The crude lysate was then subjected to inhibitor removal for cleanup, after which the purified lysate was mixed with an equal volume of DNA binding solution and passed through a silica spin-filter membrane. The membrane was given a two-step wash, and silica-bound DNA was then eluted using a 10 mm Tris elution buffer. The samples were then stored at −70 °C. We measured the quantity and quality of DNA using a NanoDrop spectrophotometer (ThermoFisher Scientific, Waltham, MA, USA) and agarose gel electrophoresis.
PCR amplification of the bacterial 16S rRNA gene V3–V4 region was performed using the primers 338F(5′-ACTCCTACGGGAGGCAGCA-3′) and 806F(5′-GGACTACHVGGGTWTCTAAT-3′) [37]. PCR amplification of the fungal ITS1 region was performed using the primers ITS5(5′-GGAAGTAAAAGTCGTAACAAGG-3′) and ITS2(5′-GCTGCGTTCTTCATCGATGC-3′) [38]. PCR reactions were carried out in 25 µL containing 1 µL of DNA template, 2 µL PCR primers, 2 µL dNTPs (2.5 mN), 5 µL PCR loading buffer, 0.25 µL DNA polymerase and 14.75 µL ddH2O. PCR reaction conditions were 98 °C for 5 min, 98 °C for 30 s, 53 °C for 30 s, 72 °C for 30 s, 25 cycles; 72 °C for 5 min and stored at 4 °C. After individual quantification, amplicons were pooled in equal amounts, and paired-end 2 × 300 bp sequencing was performed using the Illumina NovaSeq platform at Shanghai Personal Biotechnology Co., Ltd. (Shanghai, China).

2.4. Determination of Rhizosphere Environment and Climatic Factors

We dried the rhizosphere soil and stored it in a 50 mL centrifuge tube containing silica beads for further drying, then passed through a 20-mesh sieve to remove stone particles. The soil-available phosphorus (SAP) was measured by the 0.5 mol·L−1 NaHCO3 extraction–molybdenum anti-colorimetric method. Soil organic matter (SOM) was detected using the K2Cr2O7 (potassium dichromate) volumetric method. The soil effective nitrogen (SEN) was determined by the alkali diffusion method. The soil available potassium (SAK) was determined using 1 mol·L−1 NH4OAc (ammonium acetate) extraction-flame photometry [39]. We also measured the pH of the soil samples by potentiometry. Temperature and rainfall data were obtained from weather stations where the sampling site was located. A one-way analysis of variance (ANOVA) was performed to analyze differences in physicochemical properties and climatic factors using SPSS 19.0 software.

2.5. Data Analyses

QIIME2 2019.4 was used for bioinformatics analysis of the sequence data [40]. DEMUX plugin was used to multiplex the raw sequence data, and then the cutadapt plugin was used to cut the primer [41]. The sequences were quality filtered, de-noised, merged, and removed from the chimera using the DADA2 plugin [42]. Non-single amplicon sequence variants (ASV) were compared with MAFFT and used to construct phylogeny using FastTree2 [43,44]. In the SILVA Release 132/UNITE Release 8.0 database, ASVs are classified using Naive Bayes classification techniques in the feature classifier plugin [45,46].
All statistical analyses and charting were performed using R, Version 3.6.1 [47]. Alpha diversity indexes and beta diversity analysis were used to evaluate the overall diversity of species within and between experimental treatments, respectively [48,49]. To evaluate the alpha diversity of microbial community comprehensively, Shannon [50] and Simpson [51] indices were used to characterize diversity.
The beta analysis focused on the comparison of diversity between different sampling sites. Hierarchical clustering was used to display similarity between samples in the form of hierarchical tree, and the clustering effect was measured by the branch length of the cluster tree. Similar to ranking analysis, cluster analysis can use any distance to evaluate the similarity between samples. The UcLUST function of STAT package in R was used, and the Bray–Curtis algorithm was used for clustering analysis at the genus level. R script was used for visualization. We used nonparametric multivariate analysis of variance based on distance matrix decomposition by PERMANOVA, which is often used to determine if there are significant differences in community composition in different ecological niches.
Relative abundance is mainly used to describe the percentage of a single genus in the entire environmental community and describe the degree of dominance of a single genus. Relative abundance was calculated by dividing the number of reads for each single ASV by the total number of reads per sample. A histogram of the composition of fungi and bacteria at the genus level in each sample was obtained by statistical analysis of the ASV tables (Table S1). A relative abundance of ASV ≥ 5% was considered to be the dominant genus. We selected the top 20 genera in relative abundance across all samples and selected ectomycorrhizal fungi by reading the literature. ASV tables were used to make a Venn diagram to learn the unique or common number of ASV/OTU between samples [52].
Redundancy analysis (RDA) was used to analyze the relationship between rhizospheric soil biological factors and fungal or bacterial community diversity and compositions. RDA and ANOVA were performed by the R (V3.2.0) program; p < 0.05 was considered statistically significant and p < 0.01 was considered extremely significant [53].
We used nonparametric Spearman’s rank-order correlations between pairs of taxa. Comparative hypotheses for beneficial and harmful associations between microorganisms were evaluated by pair correlation analysis at the microbial genus level [54]. A positive correlation means a beneficial one, while a negative one means a harmful one.
Phylogenetic Investigation of Communities by Reconstruction of Unobserved States (PICRUSt2) was used to predict sample functional abundance [55]. The 16S rRNA gene sequence and the metabolic pathway were predicted in MetaCyc (https://metacyc.org/, accessed on 30 August 2020) using PICRUSt2. Heat maps and bar charts were then drawn according to the abundance values of the metabolic pathways to represent the abundance of secondary pathways in the samples and then clustering.

3. Results

3.1. Microbial Community from the Ectomycorrhizal Root Tips of Quercus mongolica

We obtained 81,218, 88,464 and 117,100 ITS rDNA amplicons from QA at sample plot A, QB at sample plot B and QC at sample plot C, which were, respectively divided into 1942, 2527 and 2230 fungal ASVs by clustering with 100% similarity. There were 403 fungal ASVs (7.71%) shared among QA, QB and QC, and 1110 fungal ASVs unique to QA, 1565 unique to QB and 1433 unique to QC (Figure 1a).
We also obtained 113,993, 126,508 and 106,715 16s rDNA amplicons of QA, QB and QC, respectively, which were divided into 16,812, 16,258 and 13,971 bacterial ASVs at 100% similarity. Only 1863 (4.8%) bacterial ASVs were shared among QA, QB and QC, whereas 12,267 ASVs were specific to QA, 11,435 ASVs to QB, and 8788 ASVs to QC (Figure 1b).

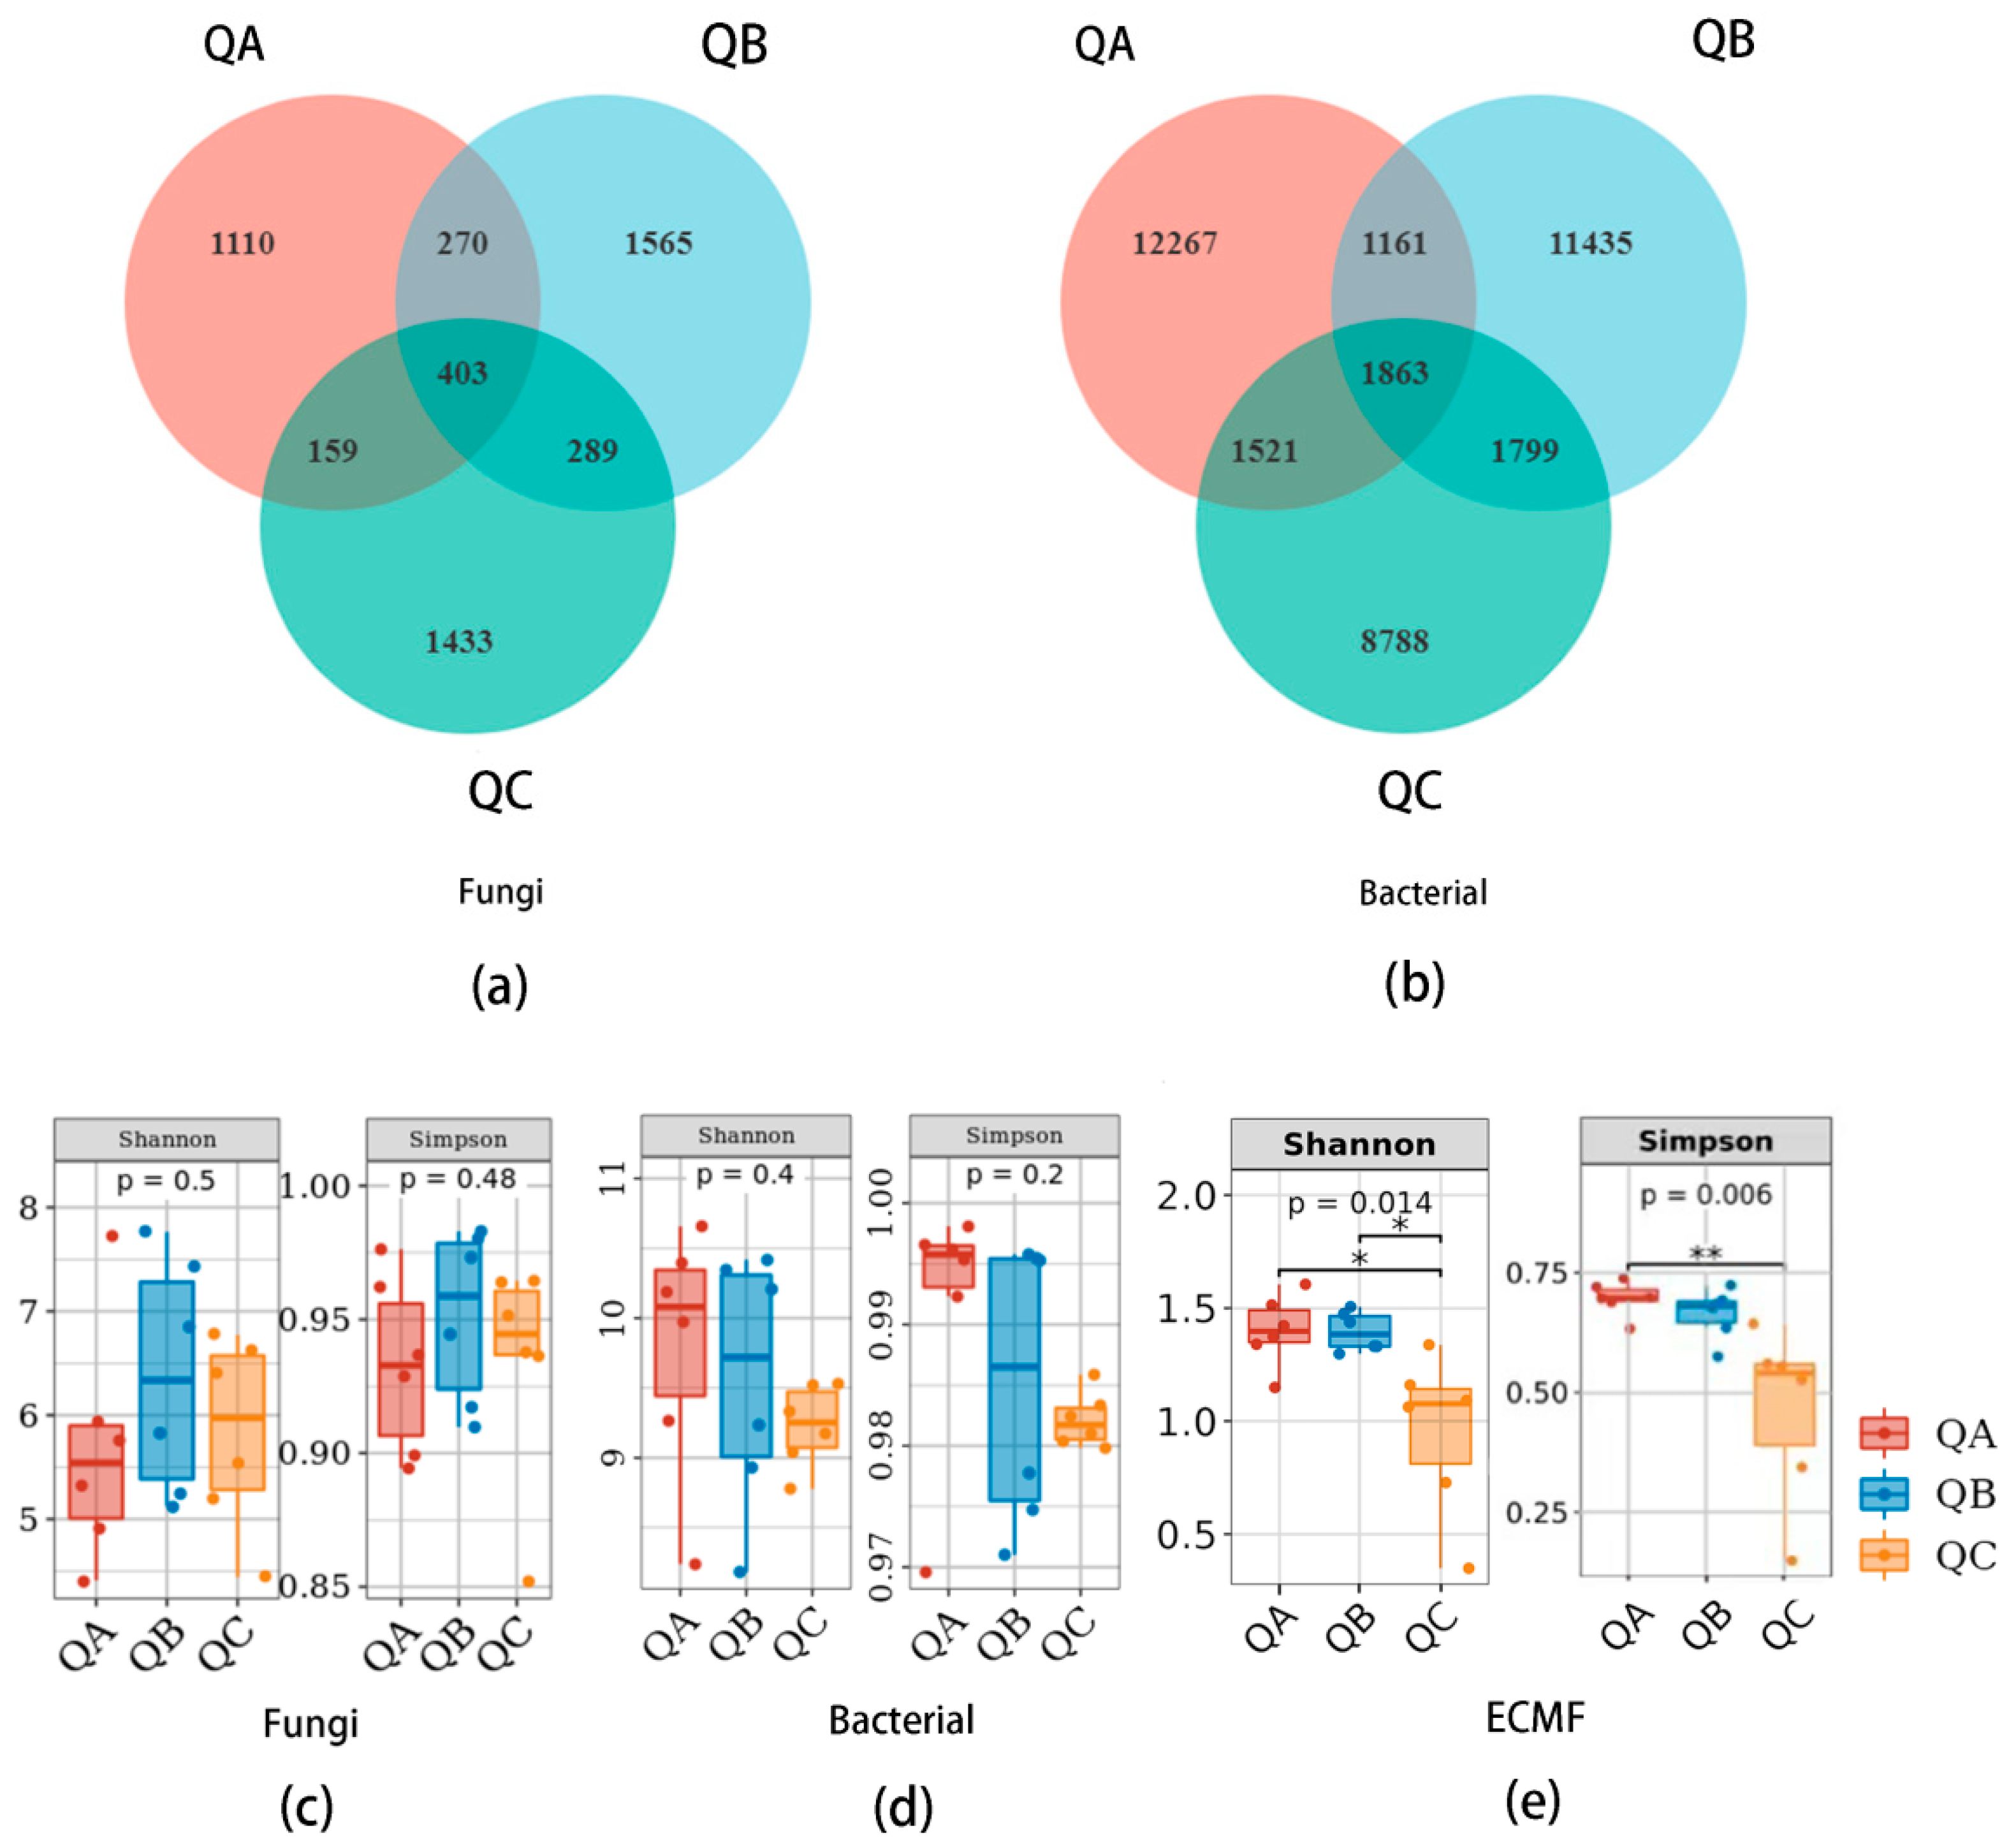
3.1.1. Alpha-Diversity of Fungal and Bacterial Communities

Shannon and Simpson indices were used to verify the richness and evenness of the microbiome from the ectomycorrhizal root tips of Q. mongolica. The Shannon indices were 5.68 ± 1.15, 6.37 ± 1.13 and 5.83 ± 0.92; the Simpson indices were 0.93 ± 0.03, 0.95 ± 0.03 and 0.93 ± 0.04, respectively, for QA, QB and QC (Figure 1c). The Shannon indices of the bacterial community were 9.79 ± 0.89, 9.55 ± 0.91 and 9.23 ± 0.29; the Simpson indices were 0.93 ± 0.03, 0.93 ± 0.03, 0.98 ± 0.00, respectively, for QA, QB and QC (Figure 1d). There was no significant difference in the alpha diversity of the fungal or bacterial community in the ectomycorrhizosphere of Q. mongolica in the different forest types, but there was a significant difference (p < 0.05) in the ectomycorrhizal fungal community. The Shannon indices of the ectomycorrhizal fungi community were 1.4 ± 0.16, 1.4 ± 0.09 and 0.95 ± 0.36, and Simpson indices were 0.7 ± 0.04, 0.66 ± 0.05 and 0.46 ± 0.18, respectively, of QA, QB and QC. There were significant differences (p < 0.01) in the Shannon and Simpson indices of ectomycorrhizal fungal communities among the three plots (Figure 1e).

3.1.2. Beta-Diversity of Microbial Communities

Beta diversity of the fungal community was analyzed by hierarchical clustering. The results showed that the fungal communities QB and QC clustered together and were similar; however, three sub-samples of QA (QA1, QA2, QA3) were separated from three other sub-samples (QA4, QA5, QA6), which was similar to QC (Figure 2a). For bacterial communities, samples were separated into three groups, and the bacterial communities of QB and QC were comparably similar (Figure 2b). Ectomycorrhizal fungi QA and QB clustered together and separated from QC (Figure 2c).

3.1.3. Species Construction of Microbial Communities

All the fungal ITS ASVs were compared in UNITE Release 8.0, and all the bacterial 16S rDNA ASVs were compared in the SILVA Release 132 databases. The fungi can be classified into to 14 phyla, 52 classes, 129 orders, 320 families and 659 genera. Bacteria comprised 35 phyla, 114 classes, 366 orders, 737 families and 1601 genera. Percentage accumulation was performed for the top 20 genera in each sample.
The dominant genera (relative abundance > 5%) of fungi from QA were Lachnum (15.6%), Cortinarius (11.11%), Mortierella (10.43%), Russula (10.1%) and Tomentella (8.09%), which accounted for 55.33% relative abundance; for QB, dominant genera accounted for 38.99% relative abundance: Russula (24.88%), Phellodon (7.89%), Tricholoma (6.22%); and for QC, dominant genera accounted for 47.34% relative abundance: Lachnum (20.63%), Phialocephala (12.42%), Hygrophorus (7.44%), Mycena (6.85%) (Figure 2a) (Table S2a). The only dominant genus of bacteria from QA was Pseudomonas (10.26%). The dominant genera from QB were Burkholderia (19.05%) and Acidothermus (5.1%), and from QC they were Burkholderia (23.49%), Pseudomonas (8.63%) and Allorhizobium (5.38%) (Figure 2b) (Table S2b). The dominant genera of ectomycorrhizal fungi in QA were Cortinarius (11.11%), Russula (10.1%) and Tomentella (8.09%), which accounted for 29.30% relative abundance. For QB, the dominant genera accounted for 38.99% relative abundance: Russula (24.88%), Phellodon (7.89%) and Tricholoma (6.22%). For QC, the dominant genera accounted for 14.29% relative abundance: Hygrophorus (7.44%) and Mycena (6.85%) (Figure 2c) (Table S2c).

3.2. Effects of Environmental Factors on Microbial Community in Ectomycorrhiza of Quercus mongolica

The rhizospheric soil samples of Q. mongolica were collected for physicochemical properties testing. The results show that the soil organic matter (SOM) and the soil available phosphorus (SAP) of sample plot A were significantly higher (p < 0.05) than those of the other two sample plots. Then, SOM and SAP of sample B and sample C were more similar. The pH of the soil (SpH) and the content of soil effective nitrogen (SEN) of the three sample plots were significantly different (p < 0.05), while the content of soil available potassium (SAK), the monthly average air temperature (T) and the monthly average rainfall capacity (RM) have not significant difference (Table 2).
Redundancy Analysis (RDA) was conducted for correlations of the relative abundance of the top 20 genera of fungi from the ectomycorrhiza root tips (QA, QB and QC), climatic factors and rhizospheric soil physicochemical properties (Figure 3). The interpretation rate of the RDA was 47.58% (RDA1 = 33.55%, RDA2 = 14.03%) (Figure 3a). The SpH (R2 = 0.43, Pr = 0.017), SOM (R2 = 0.63, Pr = 0.002), SEN (R2 = 0.57, Pr = 0.005) and SAP (R2 = 0.33, Pr = 0.041) were significant (p < 0.05) influencing factors on the fungal composition of the ectomycorrhizosphere. SAK and RM correlated positively with the relative abundance of all of ectomycorrhizal fungi except for Hygrophorus and Mycena. The RDA interpretation rate of the ectomycorrhizal fungal community was 54.45% (RDA1 = 37.14%, RDA2 = 17.31%) (Figure 3c). SpH (R2 = 0.59, Pr = 0.003), SOM (R2 = 0.48, Pr = 0.011) and SEN (R2 = 0.46, Pr = 0.011) had significant correlations on relative abundance.
The interpretation rate of the first and second axes of the bacterial community RDA was 65.69 and 11.95%, respectively, and the total interpretation rate was 77.64% (Figure 3b). SEN (R2 = 0.67, Pr = 0.001) was the most significant correlation factor, while SpH, SOM, SAK and SAP (R2 = 0.56, Pr = 0.002; R2 = 0.74, Pr = 0.002; R2 = 0.52, Pr = 0.005; R2 = 0.52, Pr = 0.003) were significant factors on the bacterial community.

3.3. The Relationship between Microorganisms from the Ectomycorrhizal Root Tips of Quercus mongolica

A nonparametric Spearman’s rank-order correlation assessed the beneficial and detrimental interactions among different taxa. In QA, QB and QC, a significant positive correlation accounted for 12.11, 17.89 and 20.00% of fungi, respectively; a significant negative correlation accounted for 2.11, 21.05 and 8.95%, respectively. In the bacterial correlation between QA, QB and QC, the significant positive correlation accounted for 8.95, 26.84 and 16.84%, and the significant negative correlation was 2.11, 16.84 and 5.26%, respectively.
We found that for all samples, except for fungi in QB, the significant positive correlation was greater than the significant negative correlation. This indicates that most microorganisms in the ectomycorrhizal of Quercus mongolica adopt beneficial associations (Figure 4).

3.4. The Predicted Metabolic Functions of Microorganisms from the Ectomycorrhizal Root Tips of Q. mongolica

The metabolic functions of ectomycorrrhizospheric microbial communities were predicted and analyzed using PICRUSt2 and compared in the MetaCyc metabolic database to obtain the abundance and quantity of metabolic pathways. A total of five primary and 29 secondary metabolic pathways of the ectomycorrrhizospheric fungi were determined by the database. The type and number of secondary pathways were biosynthesis (7), degradation/utilization/assimilation (7), generation of precursor metabolite and energy (9), glycan (1). and metabolic clusters (5). Ectomycorrhizospheric bacteria had 7 primary and 61 secondary metabolic pathways, the latter of which comprised biosynthesis (12), degradation/utilization/assimilation (16), detoxification (2), generation of precursor metabolite and energy (17), glycan (2), macromolecule modification (2) and metabolic clusters (10) (Table S3a,b).
For the fungal functions, with QA as the control, no significant differences in the third metabolic pathways were detected in QB; however, the LIPASYN-PWY and PWY-6121 pathways were up-regulated in QC (p < 0.05). For bacteria, QA was also used as the control, and the three pathways PWY-6486, PWY-7046 and PWY-1501 were significantly up-regulated in QB (p < 0.05). In QC, PWY-6486, PWY-1361, PWY0-41, GLUCARDEG-PWY, GALACTARDEG-PWY, GLUCARGALACTSUPER-PWY, AEROBACTINSYN-PWY, PWY-6641, PWY-722, and PWY-1501 were significantly upregulated (p < 0.05).

4. Discussion

We selected the ectomycorrhizal root tips of Quercus mongolica as study material in three forest types with different neighboring plants and where the fruiting body distribution of Tricholoma matsutake were different. From our results, the fungal or bacterial alpha-diversity of the root tips were similar among the three forest types (Figure 1c,d), which meant that the plant species influenced the fungal and bacterial abundance of the ectomycorrhizosphere. These results were also verified by studies showing that tree species determine the root microbiome [56,57,58,59]. According to our results, plant species mainly affected the amount of fungi and bacteria, so there was no significant difference in alpha index diversity [60,61,62,63,64].
However, fungal and bacterial beta diversity and species composition of microorganisms in the root tips were different (Figure 2a,b), and the alpha and beta diversity and species composition also showed significant difference as neighboring plants affected the microbiome composition [65,66,67]. When the roots overlapped intensively, “microbial spillover” occurred, affecting rhizosphere microorganisms on the grassland [68]. Saccharum Officinarum and Arachis Hypogaea intercropping significantly increased the number of bacteria and fungi in peanut and sugarcane rhizosphere soil compared with the soil of a monoculture [69]. Our results verified that neighboring plants to some extent affected the microbiome, especially fungi in the ectomycorrhizosphere.
We also found that not all QA samples gathered together (Figure 2a), possibly because Lachnum was the dominant genus of QC with high relative abundance, which was similar to the subsamples QA1, QA2 and QA3. In addition to being influenced by plant species and nearby plants, the microbiome can also be influenced by as soil [70,71] and climatic factors [72]. From our results, the abundance of Lachnum correlated positively with soil pH, SEN, SAK, SOM and T (Figure 3a). The relationship between the microbes in the ectomycorrhizosphere is extremely complex and shows that different microbes restrict or promote each other [73,74].
Habitat soil is the reservoir of rhizospheric microbes; therefore, we believe that this is the source of most of the root microbes, which was also verified by most of the research results [75,76,77,78,79]. Interestingly, though, only 23.09–38.59% of the fungal or bacterial ASVs showed similarity to the habitat rhizospheric soil (Figure 5), and some genera from the ectomycorrhizal root tips could not occur in the habitat soil. Some studies also found that only 28% of the common OTUs were in the root and soil, indicating that only some of the soil microorganisms entered the roots and leaves [80]. A large number of studies on the rule and function of microbial colonization in plant roots have shown that plants also recruit microorganisms from the air to the leaves, which they eventually colonize [81,82]. This could explain this phenomenon, but it needs a lot of testing to be verified.
The rhizosphere environment is one of the most important factors affecting the composition of a root microbial community [83]. Physical and chemical soil properties can indirectly determine its composition by affecting plant physiology and root secretion [84]. In our study, soil pH, soil organic matter, soil effective nitrogen content have significant correlations on fungal, bacterial and ectomycorrhizal fungal communities (Figure 3).
Microbial interactions can also cause changes to the community structure [85,86] as there is competition and cooperation among species in the same niche community [87,88]. In our study, microorganisms were more likely to adopt a positive correlation, which was significantly greater than the negative correlation (Figure 4). This indicated that beneficial interactions of coexisting microorganisms on resource use are common in forest soils, a view shared by many scholars [89,90].
In predicting fungal metabolic function, two up-regulated QA/QC pathways were phospholipase and 5-aminoimidazole ribonucleotide biosynthesis I. Phospholipases are enzymes that hydrolyze glycerol phospholipids [91]. The up-regulated functions of QA/QB bacteria included D-galacturonate degradation II, 4-coumarate degradation (Anaerobic) and mandelate degradation I. The metabolic pathway of BACTERIAL QA/QC was also more up-regulated had had the following functions: D-galacturonate degradation II, benzoyl-CoA degradation I (aerobic), allantoin degradation IV (anaerobic), D-glucarate degradation I, superpathway of D-glucarate and D-galactarate degradation, aerobactin biosynthesis, superpathway of sulfolactate degradation, nicotinate degradation I and mandelate degradation I. In the D-galacturonate degradation II pathway, D-galacturonate was oxidized to D-galactaro-1,5-lactone by an inducible dehydrogenase [92,93]. Regarding benzoyl-CoA degradation I (aerobic), several bacterial species, such as the Gram-negative denitrifying bacterium Aromatoleum evansii, the Gram-positive Geobacillus stearothermophilus and the proteobacterium Paraburkholderia xenovorans LB400 used benzoate aerobically as a sole source of carbon and energy [94,95,96].

5. Conclusions

In this study, high-throughput sequencing of ITS1 for fungi and 16S for bacteria were used to reveal the effect of neighboring plants on the microbial composition in the ectomycorrhizosphere of Quercus mongolica, the host plant for Tricholoma matsutake. Significant differences were found in fungal, ectomycorrhizal fungal and bacterial beta diversity and species composition in three sample plots.
In addition, the physical and chemical properties of the soil––soil pH (SpH), soil organic matter (SOM), soil effective nitrogen (SEN) and soil available phosphorus (SAP)––had significant correlations in the fungal communities (p < 0.05). SpH, SOM and SEN had significant correlations on the ectomycorrhizal fungal community (p < 0.05), whereas SEN, SpH, SOM, SAK and SAP affected the bacterial community (p < 0.05). However, the soil microbial pool had little effect on microbial compositions in the ectomycorrhizosphere of Q. mongolica. Most of the microorganisms were willing to form beneficial associations, but further research is needed to reveal the reasons. PICRUSt2 was used to predict metabolic functions in the ectomycorrhizosphere of Q. mongolica, which were 5 primary and 29 secondary metabolic pathways for fungi, and 7 primary and 61 secondary metabolic pathways for bacteria.

Supplementary Materials

The following supporting information can be downloaded at: https://www.mdpi.com/article/10.3390/d14100810/s1. Table S1: Statistical analysis of the ASV tables, Table S2: Top 20 genera for the relative abundance from the ectomycorrhizal root tips of Quercus mongolica, Table S3: The metabolic functions of microorganisms from the ectomycorrhizal root tips of Q. mongolica.

Author Contributions

R.-Q.J. and S.-Y.L. conceived and designed the experiments, authored or reviewed drafts of the paper and approved the final draft. Y.-J.S. and Y.X. performed the experiments, analyzed the data, prepared figures and tables, and approved the final draft. B.-Q.L. and J.L. analyzed the data, authored or reviewed drafts of the paper, and approved the final draft. L.-P.M. and Y.L. conceived and designed the experiments, analyzed the data, prepared figures and/or tables, and approved the final draft. All authors have read and agreed to the published version of the manuscript.

Funding

This work was supported by the Key Project on R&D of the Ministry of Science and Technology (No. 2018YFE0107800) and by the Chinese National Natural Science Foundation of China (No. 31600020).

Institutional Review Board Statement

Not applicable.

Informed Consent Statement

Not applicable.

Data Availability Statement

The following information was supplied regarding data availability: Sequence data were deposited at the National Center for Biotechnology Information (NCBI) Sequence Read Archive (SRA) database (SAMN30262834–SAMN30262851).

Conflicts of Interest

The authors declare no conflict of interest.

References

  1. Tedersoo, L.; Bahram, M.; Zobel, M. How mycorrhizal associations drive plant population and community biology. Science 2020, 367, eaba1223. [Google Scholar] [CrossRef] [PubMed]
  2. Rosenstock, N.P.; Berner, C.; Smits, M.M.; Krám, P.; Wallander, H. The role of phosphorus, magnesium and potassium availability in soil fungal exploration of mineral nutrient sources in Norway spruce forests. New Phytol. 2016, 211, 542–553. [Google Scholar] [CrossRef]
  3. Voříšková, J.; Brabcová, V.; Cajthaml, T.; Baldrian, P. Seasonal dynamics of fungal communities in a temperate oak forest soil. New Phytol. 2014, 201, 269–278. [Google Scholar] [CrossRef] [PubMed]
  4. Ji, R.Q.; Zhou, J.J.; Ma, S.Y.; Xu, Y.; Li, Y. Investigation on Symbiotic Fungi in Roots of Coniferous Forests in Jingyuetan National Forest Park. J. Fungal Res. 2020, 18, 154–161. [Google Scholar]
  5. Smith, S.E.; Smith, F.A. Tansley review No. 20. structure and function of the interfaces in biotrophic symbioses as they relate to nutrient transport. New Phytol. 1990, 114, 1–38. [Google Scholar] [CrossRef] [PubMed]
  6. Trappe, J.M. A.B. Frank and mycorrhizae: The challenge to evolutionary and ecologic theory. Mycorrhiza 2005, 15, 277–281. [Google Scholar] [CrossRef]
  7. Elena, A.P.; Mikhail, N.G.; Svetlana, N.B.; Vera, F.M.; Ekaterina, F.M.; Alexander, E.K. Post-fire Successions of vegetation and Pinus koraiensis ectomycorrhizal communities in Korean pine–broadleaf forests of the central aikhote-alin. Achiev. Life Sci. 2016, 10, 48–56. [Google Scholar] [CrossRef]
  8. Southam, H.; Stafl, N.; Guichon, S.H.A.; Simard, S.W. Characterizing the Ectomycorrhizal Fungal Community of Whitebark Pine in Interior British Columbia: Mature Trees, Natural Regeneration and Planted Seedlings. Frontiers 2022, 4, 750701. [Google Scholar] [CrossRef]
  9. Ji, R.Q.; Gao, T.T.; Li, G.L.; Xu, Y.; Xing, P.J.; Zhou, J.J.; Xie, M.L.; Li, J.Q.; Li, Y. Correlation between ectomycorrhizal fungal community and environmental factors in Pinus koraiensis forest in Northeast China. Mycosystema 2020, 39, 743–754. [Google Scholar] [CrossRef]
  10. Dickie, I.A.; John, M.G.S. Molecular Mycorrhizal Symbiosis: Second-Generation Molecular Understanding of Mycorrhizas in Soil Ecosystems; John Wiley & Sons, Inc.: Hoboken, NJ, USA, 2017; pp. 474–491. [Google Scholar]
  11. Smith, S.E.; Read, D.J. Mycorrhizal Symbiosis; Academic Press: New York, NY, USA, 2008. [Google Scholar]
  12. Milović, M.; Orlović, S.; Grebenc, T.; Bajc, M.; Kovačević, B.; Kraigher, H. Ectomycorrhizal fungal community in mature white poplar plantation. Iforest-Biogeosciences For. 2021, 14, 540. [Google Scholar] [CrossRef]
  13. Amend, A.; Keeley, S.; Garbelotto, M. Forest age correlates with fine-scale spatial structure of Matsutake mycorrhizas. Mycol. Res. 2009, 113, 541–551. [Google Scholar] [CrossRef] [PubMed]
  14. Matsushita, N.; Kikuchi, K.; Sasaki, Y.; Guerin-Laguette, A.; Vaario, L.-M.; Suzuki, K.; Lapeyrie, F.; Intini, M. Genetic relationship of Tricholoma matsutake and T. nauseosum from the Northern Hemisphere based on analyses of ribosomal DNA spacer regions. Mycoscience 2005, 46, 90–96. [Google Scholar] [CrossRef]
  15. Ogawa, M. Microbial ecology of mycorrhizal fungus Tricholoma matsutake (Ito et Imai) Sing. in pine forest. II. Mycorrhiza formed by Tricholoma matsutake. Bull. Gov. For. Exp. Sta. 1975, 272, 79–121. [Google Scholar]
  16. Li, Q.; Li, X.; Chen, C.; Li, S.; Huang, W.; Xiong, C.; Jin, X.; Zheng, L. Analysis of bacterial diversity and communities associated with Tricholoma matsutake fruiting bodies by barcoded pyrosequencing in Sichuan Province, Southwest China. Microbiol. Biotechnol. 2016, 26, 89–98. [Google Scholar] [CrossRef] [PubMed]
  17. Park, M.S.; Oh, S.-Y.; Cho, H.J.; Fong, J.J.; Cheon, W.-J.; Lim, Y.W. Trichoderma songyi sp. nov., a new species associated with the pine mushroom (Tricholoma matsutake). Antonie Van Leeuwenhoek 2014, 106, 593–603. [Google Scholar] [CrossRef]
  18. Li, Q.; Li, X.; Huang, W.; Xiong, C.; Yang, Y.; Yang, Z.; Zheng, L. Community structure and diversity of entophytic bacteria in Tricholoma matsutake in Sichuan Province, Southwest China. Chin. J. Appl. Ecol. 2014, 25, 3316–3322. [Google Scholar]
  19. Liu, P.G.; Yuan, M.S.; Wang, X.H. Notes on the resources of matsutake group and their reasonable utilization as well as effective conservation in China. Jouranal Nat. Resour. 1999, 14, 245–252. [Google Scholar] [CrossRef]
  20. Fu, W.J.; Xu, G.B.; Liu, J.S. Research on Distribution and Ecological Environment of Tricholoma matsutake in Changbai Mountain Area. Acta Edulis Fungi 1998, 03, 48–52. [Google Scholar]
  21. Yang, M.H.; Yang, X.M.; Chen, L.G. Studies on the Relationship Between Tricholoma matsutake and Other Rhizosphere Microorganisms. Acta Agric. Univ. Jiangxiensis 1997, 4, 78–82. [Google Scholar]
  22. Ohara, H.; Hamada, M. Disappearance of bacteria from the zone of active mycorrhizas in Tricholoma matsutake (S. Ito et Imai) Singer. Nature 1967, 213, 528. [Google Scholar] [CrossRef]
  23. Yamanaka, T.; Yamada, A.; Furukawa, H. Advances in the cultivation of the highly-prized ectomycorrhizal mushroom Tricholoma matsutake. Mycoscience 2020, 61, 49–57. [Google Scholar] [CrossRef]
  24. Vaario, L.M.; Guerin-Laguette, A.; Gill, W.M.; Lapeyrie, F.; Suzuki, K. Only two weeks are required for Tricholoma matsutake to differentiate ectomycorrhizal Hartig net structures in roots of Pinus densiflora seedlings cultivated on artificial substrate. J. For. Res. 2000, 5, 293–297. [Google Scholar] [CrossRef]
  25. Guerin-Laguette, A.; Vaario, L.M.; Gill, W.M.; Lapeyrie, F.; Matsushita, N.; Suzuki, K. Rapid in vitro ectomycorrhizal infection on Pinus densiflora roots by Tricholoma matsutake. Mycoscience 2000, 41, 389–393. [Google Scholar] [CrossRef]
  26. Ka, K.-H.; Kim, H.-S.; Hur, T.-C.; Park, H.; Jeon, S.-M.; Ryoo, R.; Yeongseon, J. Analysis of environment and production of Tricholoma matsutake in Matsutake-infected pine trees (in Korean). Korean J. Mycol. 2018, 46, 34–42. [Google Scholar] [CrossRef]
  27. Yamada, A.; Endo, N.; Murata, H.; Ohta, A.; Fukuda, M. Tricholoma matsutake Y1 strain associated with Pinus densiflora shows a gradient of in vitro ectomycorrhizal specificity with Pinaceae and oak hosts. Mycoscience 2014, 55, 27–34. [Google Scholar] [CrossRef]
  28. Murata, H.; Babasaki, K.; Yamada, A. Highly polymorphic DNA markers to specify strains of the ectomycorrhizal basidiomycete Tricholoma matsutake based on σmarY1, the long terminal repeat of gypsy-type retroelement marY1. Mycorrhiza 2005, 15, 179–186. [Google Scholar] [CrossRef]
  29. Vaario, L.-M.; Pennanen, T.; Lu, J.; Palmén, J.; Stenman, J.; Leveinen, J.; Kilpeläinen, P.; Kitunen, V. Tricholoma matsutake can absorb and accumulate trace elements directly from rock fragments in the shiro. Mycorrhiza 2015, 25, 325–334. [Google Scholar] [CrossRef]
  30. Murata, H.; Yamada, A.; Maruyama, T.; Neda, H. Ectomycorrhizas in vitro between Tricholoma matsutake, a basidiomycete that associates with pinaceae, and Betula platyphylla var. japonica, an early-successional birch species, in cool-temperate forests. Mycorrhiza 2015, 25, 237–241. [Google Scholar] [CrossRef]
  31. Lian, C.; Hogetsu, T.; Matsushita, N.; Guerin-Laguette, A.; Suzuki, K.; Yamada, A. Development of microsatellite markers from an ectomycorrhizal fungus, Tricholoma matsutake, by an issr-suppression-pcr method. Mycorrhiza 2003, 13, 27–31. [Google Scholar] [CrossRef]
  32. Tan, W. Cultivation Theory and Method of Trichotoma matsutake. Acta Edulis Fungi 1994, 1, 53–63. [Google Scholar]
  33. Narimatsu, M.; Koiwa, T.; Masaki, T.; Sakamoto, Y.; Ohmori, H.; Tawaraya, K. Relationship between climate, expansion rate, and fruiting in fairy rings (‘shiro’) of an ectomycorrhizal fungus Tricholoma matsutake in a Pinus densiflora forest. Fungal Ecol. 2015, 15, 18–28. [Google Scholar] [CrossRef]
  34. Li, W.G.; Zhao, Y.G. Ecological conditions suitable for growth of Trichotoma matsutake. J. Microbiol. 2000, 20, 52–54. [Google Scholar]
  35. Xu, G.B.; Fu, W.J.; Zhang, M.J. Ecological Behaviour and Domestication of Tricholoma Matsutake in Changbai Mountain Area. J. Agric. Sci. Yanbian Univ. 1999, 2, 130–135. [Google Scholar]
  36. Xing, P.J.; Xu, Y.; Gao, T.T.; Li, G.L.; Zhou, J.J.; Xie, M.L.; Ji, R.Q. The community composition variation of Russulaceae associated with the Quercus mongolica forest during the growing season at Wudalianchi City, China. PeerJ 2020, 8, e8527. [Google Scholar] [CrossRef] [PubMed]
  37. Yu, X.; Yu, K.; Chen, B.; Liao, Z.H.; Liang, J.Y.; Yao, Q.C.; Qin, Z.J.; Wang, H.; Yu, J. Different responses of scleractinian coral Acropora pruinosa from Weizhou Island during extreme high temperature events. Coral Reefs 2021, 40, 1697–1711. [Google Scholar] [CrossRef]
  38. White, T.J.; Bruns, T.; Lee, S.; Taylor, J. Amplification and direct sequencing of fungal ribosomal RNA genes for phylogenetics. In PCR Protocols: A Guide to Methods and Applications; Innis, M.A., Gelfand, D.H., Sninsky, J.J., White, T.J., Eds.; Academic Press: San Diego, CA, USA, 1990; pp. 315–322. [Google Scholar]
  39. Bao, S.D. Soil Agrochemical Analysis, 3rd ed.; China Agricultural Press: Beijing, China, 2000; pp. 1–495. [Google Scholar]
  40. Bolyen, E.; Rideout, J.R.; Dillon, M.R.; Bokulich, N.A.; Abnet, C.; Al-Ghalith, G.A.; Caporaso, J.G. QIIME 2: Reproducible, interactive, scalable, and extensible microbiome data science. Nat. Biotechnol. 2019, 37, 852–857. [Google Scholar] [CrossRef]
  41. Martin, M. Cutadapt removes adapter sequences from high-throughput sequencing reads. EMBnet J. 2011, 17, 10–12. [Google Scholar] [CrossRef]
  42. Callahan, B.J.; McMurdie, P.J.; Rosen, M.J.; Han, A.W.; Johnson, A.J.A.; Holmes, S.P. DADA2: High-resolution sample inference from Illumina amplicon data. Nat. Methods 2015, 13, 581–583. [Google Scholar] [CrossRef] [Green Version]
  43. Price, M.N.; Dehal, P.S.; Arkin, A.P. FastTree: Computing large minimum evolution trees with profiles instead of a distance matrix. Mol. Biol. Evol. 2009, 26, 1641–1650. [Google Scholar] [CrossRef]
  44. Katoh, K.; Misawa, K.; Kuma, K.; Miyata, T. MAFFT: A novel method for rapid multiple sequence alignment based on fast Fourier transform. Nucleic Acids Res. 2002, 30, 3059–3066. [Google Scholar] [CrossRef]
  45. Nicholas, B.; Benjamin, D.K.; Ram, R.J.; Matthew, D.; Evan, B.; Rob, K.; Gavin, A.H.; Gregory, C.J. Optimizing taxonomic classification of marker-gene amplicon sequences with QIIME 2′s q2-feature-classifier plugin. Microbiome 2018, 6, 90. [Google Scholar] [CrossRef]
  46. Kõljalg, U.; Nilsson, R.H.; Abarenkov, K.; Tedersoo, L.; Taylor, A.F.S.; Bahram, M.; Bates, S.T.; Bruns, T.D.; Bengtsson-Palme, J.; Callaghan, T.M. Towards a unified paradigm for sequence-based identification of fungi. Mol. Ecol. 2013, 22, 5271–5277. [Google Scholar] [CrossRef]
  47. R Core Team. R: A Language and Environment for Statistical Computing [Computer Software Manual]; R Core Team: Vienna, Austria, 2019. [Google Scholar]
  48. Whittaker, R.H. Vegetation of the Siskiyou Mountains, Oregon and California. Ecol. Monogr. 1960, 30, 279–338. [Google Scholar] [CrossRef]
  49. Whittaker, R.H. Evolution and measurement of species diversity. Taxon 1972, 21, 213–251. [Google Scholar] [CrossRef]
  50. Shannon, C.E. A mathematical theory of communication. Bell Syst. Tech. J. 1948, 27, 379–423. [Google Scholar] [CrossRef]
  51. Simpson, E.H. Measurement of diversity. Nature 1949, 163, 688. [Google Scholar] [CrossRef]
  52. Yang, Y.; Yan, W.; Wei, J. Ectomycorrhizal fungal community in the rhizospheric soil of Betula platyphylla in Inner Mongolia. Mycosystema 2018, 37, 294–304. [Google Scholar]
  53. Clarke, K.R. Non-parametric multivariate analyses of changes in community structure. Aust. J. Ecol. 1993, 18, 117–143. [Google Scholar] [CrossRef]
  54. Faust, K.; Raes, J. Microbial interactions: From networks to models. Nat. Rev. Microbiol. 2012, 10, 538–550. [Google Scholar] [CrossRef]
  55. Douglas, G.M.; Maffei, V.; Zaneveld, J.; Yurgel, S.N.; Brown, J.R.; Taylor, C.M.; Huttenhower, C.; Langille, M.G.I. PICRUSt2: An improved and extensible approach for metagenome inference. bioRxiv 2019, 10, 672295. [Google Scholar]
  56. Suz, L.M.; Kallow, S.; Reed, K.; Bidartondo, M.I.; Barsoum, N. Pine mycorrhizal communities in pure and mixed pine-oak forests: Abiotic environment trumps neighboring oak host effects. For. Ecol. Manag. 2017, 406, 370–380. [Google Scholar] [CrossRef]
  57. Xiong, C.; Zhu, Y.G.; Wang, J.T.; Singh, B.; Han, L.L.; Shen, J.P.; Li, P.P.; Wang, G.B.; Wu, C.F.; Ge, A.H.; et al. Host selection shapes crop microbiome assembly and network complexity. New Phytol. 2021, 229, 1091–1104. [Google Scholar] [CrossRef] [PubMed]
  58. Mony, C.; Gaudu, V.; Ricono, C.; Jambon, O.; Vandenkoornhuyse, P. Plant neighbours shape fungal assemblages associated with plant roots: A new understanding of niche-partitioning in plant communities. Funct. Ecol. 2021, 35, 1768–1782. [Google Scholar] [CrossRef]
  59. Gao, C.; Montoya, L.; Xu, L.; Madera, M.; Hollingsworth, J.; Purdom, E.; Singan, V.; Vogel, J.; Hutmacher, R.B.; Dahlberg, J.A.; et al. Fungal community assembly in drought-stressed sorghum shows stochasticity, selection, and universal ecological dynamics. Nat. Commun. 2020, 11, 1–14. [Google Scholar] [CrossRef]
  60. Chaluvadi, S.; Bennetzen, J.L. Species-associated differences in the below-ground microbiomes of wild and domesticated Setaria. Front. Plant Sci. 2018, 9, 1183. [Google Scholar] [CrossRef]
  61. Wang, Q.F.; Ma, M.C.; Jiang, X.; Zhou, B.K.; Guan, D.W.; Cao, F.M.; Chen, S.F.; Li, J. Long-term N fertilization altered 13C-labeled fungal community composition but not diversity in wheat rhizosphere of Chinese black soil. Soil Biol. Biochem. 2019, 135, 117–126. [Google Scholar] [CrossRef]
  62. Tan, S.; Liu, J.; Fang, Y.; Hedlund, B.P.; Lian, Z.H.; Huang, L.Y.; Li, J.T.; Huang, L.N.; Li, W.J.; Jiang, H.C.; et al. Insights into ecological role of a new deltaproteobacterial order Candidatus Acidulodesulfobacterales by metagenomics and metatranscriptomics. ISME J. 2019, 13, 2044–2057. [Google Scholar] [CrossRef]
  63. Pang, Z.Q.; Xu, P.; Yu, D.Q. Environmental adaptation of the root microbiome in two rice ecotypes. Microbiol. Res. 2020, 241, 126588. [Google Scholar] [CrossRef]
  64. Zhou, W.H.; Wang, Y.T.; Lian, Z.H.; Yang, T.T.; Zeng, Q.W.; Feng, S.W.; Fang, Z.; Shu, W.S.; Huang, L.N.; Ye, Z.H.; et al. Revegetation approach and plant identity unequally affect structure, ecological network and function of soil microbial community in a highly acidified mine tailings pond. Sci. Total Environ. 2020, 744, 140793. [Google Scholar] [CrossRef]
  65. Badri, D.V.; De-la-Peña, C.; Lei, Z.; Manter, D.K.; Chaparro, J.M.; Guimarães, R.L.; Sumner, L.W.; Vivanco, J.M. Root secreted metabolites and proteins are involved in the early events of plant-plant recognition prior to competition. PLoS ONE 2012, 7, e46640. [Google Scholar] [CrossRef] [Green Version]
  66. Pierik, R.; Mommer, L.; Voesenek, L.A. Molecular mechanisms of plant competition: Neighbour detection and response strategies. Funct. Ecol. 2013, 27, 841–853. [Google Scholar] [CrossRef]
  67. Lumibao, C.Y.; Kimbrough, E.; Formel, S.; Day, R.R.; From, A.S.; Conner, W.H.; Krauss, K.W.; Bael, S.A.V. Salinity, water level, and forest structure contribute to baldcypress (Taxodium distichum) rhizosphere and endosphere community structure. Wetlands 2020, 40, 2179–2188. [Google Scholar] [CrossRef]
  68. Ulbrich, T.C.; Rivas-Ubach, A.; Tiemann, L.K.; Friesen, M.L.; Evans, S.E. Plant root exudates and rhizosphere bacterial communities shift with neighbor context. Soil Biol. Biochem. 2022, 172, 108753. [Google Scholar] [CrossRef]
  69. Shen, X.F.; Fang, Y.; Dong, Z.X. Effects of sugarcane/peanut intercropping on soil microbes and soil enzyme activities. Crops 2014, 5, 55–58. [Google Scholar]
  70. Walters, W.A.; Jin, Z.; Youngblut, N.; Wallace, J.G.; Sutter, J.; Zhang, W.; González-Peña, A.; Peiffer, J.; Koren, O.; Shi, Q.; et al. Large-scale replicated field study of maize rhizosphere identifies heritable microbes. Proc. Natl. Acad. Sci. USA 2018, 115, 7368–7373. [Google Scholar] [CrossRef] [PubMed]
  71. Xu, L.; Naylor, D.; Dong, Z.B.; Simmons, T.; Pierroz, G.; Hixson, K.K.; Kim, Y.M.; Zink, E.M.; Engbrecht, K.M.; Wang, Y.; et al. Drought delays development of the sorghum root microbiome and enriches for monoderm bacteria. Proc. Natl. Acad. Sci. USA 2018, 115, E4284–E4293. [Google Scholar] [CrossRef]
  72. Ashhab, A.A.; Meshner, S.; Alexander-Shani, R.; Dimerets, H.; Brandwein, M.; Bar-Lavan, Y.; Winters, G. Temporal and Spatial Changes in Phyllosphere Microbiome of Acacia Trees Growing in Arid Environments. Front. Microbiol. 2021, 12, 656269. [Google Scholar] [CrossRef]
  73. Zhang, R.F.; Vivanco, J.M.; Shen, Q.R. The unseen rhizosphere root-soil-microbe interactions for crop production. Curr. Opin. Microbiol. 2017, 37, 8–14. [Google Scholar] [CrossRef]
  74. Heijden, G.A.; Bruin, S.D.; Luckerhoff, L.; Logtestijn, R.S.P.; Schlaeppi, K. A widespread plant-fungal-bacterial symbiosis promotes plant biodiversity, plant nutrition and seedling recruitment. ISME J. 2016, 10, 389–399. [Google Scholar] [CrossRef]
  75. Vandenkoornhuyse, P.; Quaiser, A.; Duhamel, M.; Van, A.L.; Dufresne, A. The importance of the microbiome of the plant holobiont. New Phytol. 2015, 206, 1196–1206. [Google Scholar] [CrossRef]
  76. Jacoby, R.; Peukert, M.; Succurro, A.; Koprivova, A.; Kopriva, S. The role of soil microorganisms in plant mineral nutrition—Current knowledge and future directions. Front. Plant Sci. 2017, 8, 1617. [Google Scholar] [CrossRef] [PubMed] [Green Version]
  77. Rolfe, S.A.; Griffiths, J.; Ton, J. Crying out for help with root exudates: Adaptive mechanisms by which stressed plants assemble health-promoting soil microbiomes. Curr. Opin. Microbiol. 2019, 49, 73–82. [Google Scholar] [CrossRef] [PubMed]
  78. Frew, A.; Wilson, B.A.L. Different mycorrhizal fungal communities differentially affect plant phenolic-based resistance to insect herbivory. Rhizosphere 2021, 19, 100365. [Google Scholar] [CrossRef]
  79. Ji, R.Q.; Xu, Y.; Si, Y.J.; Phukhamsakda, C.; Li, Y.; Meng, L.P.; Liu, S.Y.; Xie, M.L. Fungal–Bacterial Networks in the Habitat of SongRong (Tricholoma matsutake) and Driving Factors of Their Distribution Rules. J. Fungi 2022, 8, 575. [Google Scholar] [CrossRef] [PubMed]
  80. Redford, A.J.; Bowers, R.M.; Knight, R.; Linhart, Y.; Fierer, N. The ecology of the phyllosphere: Geographic and phylogenetic variability in the distribution of bacteria on tree leaves. Environ. Microbiol. 2010, 12, 2885–2893. [Google Scholar] [CrossRef]
  81. Balint, M.; Bartha, L.; O′Hara, R.B.; Olson, M.S.; Otte, J.; Pfenninger, M.; Robertson, A.L.; Tiffin, P.; Schmitt, I. Relocation, highlatitude warming and host genetic identity shape the foliar fungal microbiome of poplars. Mol. Ecol. 2015, 24, 235–248. [Google Scholar] [CrossRef]
  82. Rostas, M.; Cripps, M.G.; Silcock, P. Aboveground endophyte affects root volatile emission and host plant selection of a belowground insect. Oecologia 2015, 177, 487–497. [Google Scholar] [CrossRef]
  83. Schmidt, J.E.; Kent, A.D.; Brisson, V.L.; Gaudin, A.C.M. Agricultural management and plant selection interactively affect rhizosphere microbial community structure and nitrogen cycling. Microbiome 2019, 7, 146. [Google Scholar] [CrossRef]
  84. Philippot, L.; Raaijmakers, J.M.; Lemanceau, P.; van der Putten, W.H. Going back to the roots: The microbial ecology of the rhizosphere. Nat. Rev. Microbiol. 2013, 11, 789–799. [Google Scholar] [CrossRef]
  85. Apigo, A.; Oono, R. Dimensions of host specificity in foliar fungal endophytes. In Endophytes of Forest Trees; Pirttil, A., Frank, A., Eds.; Springer: Dordrecht, The Netherlands, 2018; pp. 15–42. [Google Scholar] [CrossRef]
  86. U’Ren, J.M.; Lutzoni, F.; Miadlikowska, J.; Zimmerman, N.B.; Carbone, J.; May, G.; Arnold, A.E. Host availability drives distributions of fungal endophytes in the imperilled boreal realm. Nat. Ecol. Evol. 2019, 3, 1430–1437. [Google Scholar] [CrossRef] [Green Version]
  87. Xiong, W.; Jousset, A.; Guo, S.; Karlsson, I.; Zhao, Q.Y.; Wu, H.S.; Kowalchuk, G.A.; Shen, Q.R.; Li, R.; Geisen, S. Soil protist communities form a dynamic hub in the soil microbiome. ISME J. 2018, 12, 634–638. [Google Scholar] [CrossRef] [PubMed]
  88. Yurgel, S.N.; Douglas, G.M.; Dusault, A.; Percival, D.; Langille, M.G.I. Dissecting community structure in wild blueberry root and soil microbiome. Front. Microbiol. 2018, 9, 1187. [Google Scholar] [CrossRef] [PubMed]
  89. Schoener, T.W. Resource partitioning in ecological communities. Science 1974, 185, 27–39. [Google Scholar] [CrossRef]
  90. Wu, S.H.; Huang, B.H.; Huang, C.L.; Li, G.; Liao, P.C. The aboveground vegetation type and underground soil property mediate the divergence of soil microbiomes and the biological interactions. Microb. Ecol. 2018, 75, 434–446. [Google Scholar] [CrossRef]
  91. Wei, Y.; Liu, X.; Ge, S.; Zhang, H.; Che, X.; Liu, S.; Liu, D.; Li, H.; Gu, H.; He, L.; et al. Involvement of Phospholipase C in Photosynthesis and Growth of Maize Seedlings. Genes 2022, 13, 1011. [Google Scholar] [CrossRef] [PubMed]
  92. Wagner, G.; Hollmann, S. Uronic acid dehydrogenase from Pseudomonas syringae. Purif. Prop. 1976, 61, 589–596. [Google Scholar] [CrossRef]
  93. Harry, B.; Hannu, M.; Anu, K.; Merja, P.; Peter, R. Identification in Agrobacterium tumefaciens of the D-galacturonic acid dehydrogenase gene. Appl. Microbiol. Biotechnol. 2010, 86, 901–909. [Google Scholar]
  94. Johannes, G.; Annette, Z.; Magdy, M.; Hermann, S.; Georg, F. Genes coding for a new pathway of aerobic benzoate metabolism in Azoarcus evansii. J. Bacteriol. 2002, 184, 6301–6315. [Google Scholar] [CrossRef]
  95. Uwe, A.; Brigitte, O.; Erdmute, S.; Heidrun, H.; Georg, F. New aerobic benzoate oxidation pathway via benzoyl-coenzyme A and 3-hydroxybenzoyl-coenzyme A in a denitrifying Pseudomonas sp. J. Bacteriol. 1993, 175, 4851–4858. [Google Scholar] [CrossRef]
  96. Jasleen, B.; Martin, J.B. Structural and biochemical characterization of a novel aldehyde dehydrogenase encoded by the benzoate oxidation pathway in Burkholderia xenovorans LB400. J. Mol. Biol. 2008, 379, 597–608. [Google Scholar] [CrossRef]
Figure 1. Microbial community of ectomycorrhizosphere of Q. mongolica from the three forest types sites: (a) Venn diagram of fungi community; (b) Venn diagram of bacteria community; (c) Alpha diversity of fungi; (d) Alpha diversity of bacteria; (e) Alpha diversity of ectomycorrhizal fungi, the asterisk (*) represents a significant difference at p < 0.05 level, the asterisk (**) represents a significant difference at p < 0.01 level. QA, root tips sample of Q. mongolica from sample plot A; QB, root tips sample from sample plot B; QC, root tips sample from sample plot C.
Diversity 14 00810 g001
Figure 2. Microbial community of ectomycorrhizosphere of Q. mongolica from three forest types sites: (a) Beta diversity analysis by Hierarchical clustering of fungi, (b) Beta diversity analysis by Hierarchical clustering of bacteria, (c) Beta diversity analysis by Hierarchical clustering of ectomycorrhizal fungi. QA, root tips sample of Q. mongolica from sample plot A; QB, root tips sample of Q. mongolica from sample plot B; QC, root tips sample of Q. mongolica from sample plot C A pairwise comparison of samples showed highly significant differences (p < 0.01) in the microbial composition of each group (Table 1).
Diversity 14 00810 g002
Figure 3. The relationships of physicochemical properties of rhizosphere soil with (a) fungal, (b) bacterial and (c) ectomycorrhizal fungal communities at different collection sites. QA, root tips sample of Q. mongolica from plot A; QB, sample from plot B; QC, sample of Q. mongolica from plot C. SpH, the pH of the soil; SOM, soil organic matter; SAK, soil available potassium; SEN, soil effective nitrogen; SAP, soil available phosphorus; T, monthly average air temperature; RM, monthly average rainfall.
Diversity 14 00810 g003
Figure 4. Spearman correlation analysis of the relationships of fungal or bacterial genus in the ectomycorrhizosphere of Q. mongolica from the three sampling sites: (a) relationships between fungi in QA; (b) relationships between bacteria in QA; (c) relationships between ectomycorrhizal fungi in QA; (d) relationships between fungi in QB; (e) relationships between bacteria in QB; (f) relationships between ectomycorrhizal fungi in QB; (g) relationships between fungi in QC; (h) relationships between bacteria in QC; (i) relationships between ectomycorrhizal fungi in QC. Significance levels: 0.05 ≥ *; 0.01 ≥ **; 0.001 ≥ ***.
Diversity 14 00810 g004
Figure 5. Venn diagrams of rhizosphere soil and ectomycorrhizosphere of Q. mongolica. (ac): Venn diagrams of fungi; (df): Venn diagrams of bacteria. TA: soil sample from plot A; TB, soil sample from plot B; TC, soil sample from plot C soils. QA, root tips sample of Q. mongolica from plot A; QB, sample from plot B; QC, sample from plot C.
Diversity 14 00810 g005
Table 1. PERMANOVA analysis of fungal, bacterial and ectomycorrhizal fungi community of ectomycorrhizosphere of Q. mongolica from the three sampling sites.
FungiBacteriaEctomycorrhizal Fungi
DfR2Pr (>F)DfR2Pr (>F)DfR2Pr (>F)
QA/QB/QC20.37210.00120.389460.00120.496820.001
QB/QA10.313350.00210.286440.00210.471840.006
QC/QA10.264160.00510.356960.00210.370810.001
QC/QB10.349050.00410.334990.00410.451860.004
Notes: QA, the root tips sample of Q. mongolica from sample plot A; QB, the root tips sample from sample plot B; QC, the root tips sample from sample plot C. Df, degrees of freedom; R2, coefficient of determination; Pr, p-value.
Table 2. Physicochemical properties and climatic factors of three Q. mongolica forests.
Sample Soil IDSpH (mg·kg−1)SOM (mg·kg−1)SAK (mg·kg−1)SEN (mg·kg−1)SAP (mg·kg−1)T (°C)RM (mm)
Sample plot A5.71 ± 0.11a106.89 ± 23.26a23.57 ± 8.26a203.73 ± 22.68a20.19 ± 15.54a19.67 ± 2a10.05 ± 8.87a
Sample plot B5 ± 0.19c68.04 ± 12.54b25.83 ± 1.43a114.32 ± 10.98b4.67 ± 3.46b19.67 ± 2a10.05 ± 8.87a
Sample plot C5.29 ± 0.1b61.32 ± 6.15b20.27 ± 4.54a94.82 ± 7.49c3.43 ± 2.69b19.03 ± 0.86a1.63 ± 3.71a
Notes: SpH, pH of the soil; SOM, \soil organic matter; SAK, soil available potassium; SEN, soil effective nitrogen; SAP, soil available phosphorus; T, monthly average air temperature; RM, monthly average rainfall. The data are represented by the mean ± SD, n = 6. Different letters in the table represent a significant difference in the alpha diversity indices at p < 0.05.
Publisher’s Note: MDPI stays neutral with regard to jurisdictional claims in published maps and institutional affiliations.

