Article

Effect of Saline Water for Drip Irrigation on Microbial Diversity and on Fertility of Aeolian Sandy Soils

1
National Engineering Technology Research Center for Desert-Oasis Ecological Construction, Xinjiang Institute of Ecology and Geography, Chinese Academy of Sciences, Urumqi 830011, China
2
Mosuowan Desert Research Station, Xinjiang Institute of Ecology and Geography, Chinese Academy of Sciences, Shihezi 832000, China
3
The Taklimakan Desert Research Station, Xinjiang Institute of Ecology and Geography, Chinese Academy of Sciences, Korla 841000, China
*
Author to whom correspondence should be addressed.
Diversity 2021, 13(8), 379; https://doi.org/10.3390/d13080379
Submission received: 19 March 2021 / Revised: 23 July 2021 / Accepted: 11 August 2021 / Published: 15 August 2021
(This article belongs to the Section Microbial Diversity and Culture Collections)

Abstract

:
Saline water is widely distributed in the arid environment and sometimes represents the only source of irrigation water to restore and reconstruct vegetation. However, the effects of saline water on the bacterial diversity and fertility level of aeolian sandy soil are not well understood. In this study, we investigated a vegetation belt along the Tarim Desert Highway that has been constructed as a windbreak and consists of desert shrubs and was irrigated with saline water at six levels of salinity along the Tarim Desert Highway. The bacterial diversity was studied using Biolog Eco, a phospholipid fatty acid analysis, and a polymerase chain reaction–denaturing gradient gel electrophoresis, and the soil fertility was calculated and expressed as the integrated fertility index. The soil bacterial diversity (in terms of carbon metabolism, genes, and fatty acid species) was significantly affected by the level of salinity, and the microbial activity was low under high salinity. Fertility was also markedly affected by the degree of salinity and by the depth of soil, being lower at higher salinity levels and in the top layer (0–5 cm), and was also correlated to both the metabolic diversity index of soil microorganisms and the diversity index of fatty acids of soil microorganisms. The genetic diversity index of soil microorganisms shared a polynomial relation with fertility and contributed to it positively and significantly. Therefore, using less saline water for drip irrigation could avoid salt accumulation in soil and arrest its compaction, promote the formation of soil aggregates and the build-up of nutrients, and increase microbial activity, thus playing a crucial role in promoting the circulation, conversion, and utilization of nutrients in aeolian sandy soils and improving the soil quality. The judicious use of saline water, therefore, deserves serious consideration in irrigation practices.

1. Introduction

Soil fertility is generally evaluated in terms of its physical, chemical, and biological properties [1], and it is very important to evaluate the fertility of soils [2]. A commonly used method for expressing soil quality in quantitative terms is the integrated fertility index (IFI) of soil [3]. Changes in the numbers of soil microorganisms and their metabolic functions can be used as sensitive indicators of the short-term and long-term changes in soil fertility [4]. Fertile soils have stable microbial populations (stable in terms of numbers and in the composition of microbial communities) and a high level of microbial activity [5]. Soil microbiome is a potential and sensitive indicator of soil fertility [6]. It is important to study the effects of changes in soil fertility on the microbial diversity.
The Tarim Desert Highway shelterbelt across the Taklimakan Desert in China is a piece of ecological engineering to ensure the safe operation of the Tarim Desert Highway. However, the harsh natural conditions, such as extreme temperatures, high salinity, and sandstorms, are serious threats to the shelterbelt. The Taklimakan Desert has an extremely arid climate and a serious lack of surface water. The abundant groundwater with different salt content (approximately 2–29 g/L−1) is the main source of irrigation water for the construction of the shelterbelt in the hinterland of the desert. Although salt water irrigation can cause soil salt accumulation, the species of tree planted in the shelterbelt are three shrubs named Haloxylon ammodendron (C. A. Mey.) Bunge, Calligonum mongolicum Turcz., and Tamarix chinensis Lour., which are resistant to salt and alkali. Therefore, the Tarim Desert Highway shelterbelt located in the hinterland of the Taklimakan Desert can only be kept alive by pumping salt water underground for common drip irrigation. The present study aims to examine the pattern of changes in the fertility of the aeolian sandy soils that surround the highway in response to irrigation with saline water to obtain useful insights for sustainable development of the shelterbelt.
Soil microorganisms and soil quality in arid areas have been studied extensively. The results suggest that microorganisms are an important source of available nitrogen in woodland soils of the desert ecosystem [7] and that they improve soil fertility once the soil is brought under cultivation [8]. The relationship between soil microorganisms and soil quality was investigated by Shao et al. [9] in the shrub forest consisting mostly of Artemisia ordosica Krasch in the Kubuqi Desert; by Wang et al. [10] in the improved semi-mobile sands of Ephedra along artemisia ordosicaartemisia ordosicaartemisia ordosicaartemisia ordosicathe southern edge of the Mu Us Sandland; and by Cao et al. [11] in the sand dunes that support Caragana microphylla Lam. in the Horqin Sandland in Inner Mongolia. The researchers found that the roots of the sand-fixing plants provide soil microorganisms with nutrient-rich metabolites and promote the development of the rhizosphere; at the same time, the metabolic activities of the rhizospheric microorganisms influence the movement of nutrients in the soil and their uptake by plants. This symbiotic relationship thus contributes to the formation of aeolian sandy soils [12].
However, most of the research mentioned above on soil microorganisms focussed on non-irrigated woodlands and woodlands irrigated with fresh water in arid and semi-arid areas, whereas the evaluation of aeolian sandy soils of the shelterbelt irrigated with saline water received little attention.
The present study used conventional methods to determine the bacterial diversities of these sandy soils irrigated with saline water. The following hypotheses were addressed: (i) saline water is significantly altering the soil bacterial diversity and soil fertility in the shelterbelt and (ii) the soil bacterial diversity and soil fertility are depending on irrigation water salt concentrations and on soil depth. The findings will provide a theoretical underpinning for the management of the shelterbelt along the Tarim Desert Highway.

2. Materials and Methods

2.1. Experimental Design and Sampling

The areas that border the Taklimakan Desert are characterized by an extremely arid climate, scarcity of surface water resources, highly saline groundwater, strong winds, encroachment of sand, and infertile soil. The Tarim Desert Highway shelterbelt across the Taklimakan Desert was established in 2003. Three desert shrub species with a good tolerance to drought and salinity, namely Haloxylon ammodendron (C. A. Mey.) Bunge, Calligonum mongolicum Turcz., and Tamarix chinensis Lour., were planted as mixed rows with a spacing of 1 m × 1 m to form a shelterbelt that was 72–78 m wide and 436 km long.
Three desert shrub species with a good tolerance to drought and salinity, namely Haloxylon ammodendron (C. A. Mey.) Bunge, Calligonum mongolicum Turcz., and Tamarix chinensis Lour., received drip irrigation to the shelterbelt with saline water. There are great spatial differences in the groundwater salinity along the Tarim Desert Highway shelterbelt as the plantation times on some sections of the shelterbelt are different (Table 1). To avoid the influence of stand age and tree species on the soil property, we selected sampling sites with the same stand age (planted in 2003) and tree species (only Haloxylon ammodendron (C. A. Mey.) Bunge). At each site, six plants of Haloxylon ammodendron (C. A. Mey.) Bunge were selected at random and the soil was sampled from points close to the roots [13] to represent four depths, namely 0–5 cm (D1), 5–15 cm (D2), 15–30 cm (D3), and 30–50 cm (D4).

2.2. Sampling

The chosen points were sampled five times. Plant residues in the soil samples were discarded. The samples from the same depth but from different sampling points were pooled, evenly mixed, sieved through a 2 mm sieve, immediately stored in sterile sample bags in a car refrigerator at −4 °C, and transported to the laboratory [13]. The samples for the determination of the physical and chemical properties, biomass, and enzyme activity were air-dried in the laboratory, and those for the determination of the bacterial diversity were stored in a refrigerator at −20 °C and analysed within 4 weeks.

2.3. Determination Methods

2.3.1. Diversity of the Soil Bacterial Community

As a carrier to study the metabolic function of the environmental bacterial community based on a redox reaction, the Biolog Eco board has been widely used in the study of functional diversity of the soil bacterial community. The Biolog Eco method consisted of the preparation of buffers, extraction, inoculation, incubation, and determination [14].
The polymerase chain reaction–denaturing gradient gel electrophoresis (PCR–DGGE) consisted of DNA extraction, PCR amplification, denaturing gradient gel electrophoresis, gel extraction, DGGE profile analysis, DNA cloning, and sequence analysis [15]. We used the PfuTurbo Cx Hotstart DNA Cloning Kit (Agilent, Santa Clara, CA, USA) for the PCR. We applied a gradient from a 40-65% denaturing agent. The primer pair 16F27 (forward primer: 5′-AGA GTT TGA TCC TGG CTC AG-3′)/16R1522 (reverse primer: 5′-AAG GAG GTG ATC CAG CCG CA-3′) was applied to target the 16S rDNA V3 of the bacteria [16]. The cloning sequence analysis was performed by Shanghai Sangon Biotechnology Technology Service Co., Ltd, Shanghai, China.
The microbial phospholipid fatty acid analysis (PLFA) consisted of a fatty acid extraction, methylation, and identification [17].

2.3.2. Physical and Chemical Analysis

All the standard physical and chemical properties were determined [18]. The organic matter (OM) was determined by using the potassium dichromate volumetric method with external heating; total nitrogen (TN) by perchloric acid-sulphuric uric acid digestion; available nitrogen (AN) by alkaline hydrolysis distillation; total phosphorus (TP) by the acid dissolution-molybdenum antimony resistance colourimetric method; available phosphorus (AP) by the extraction-molybdenum antimony resistance colourimetric method; and total potassium (TK) by acid dissolution-flame photometry.
The soil moisture content was estimated by drying and the soil bulk was estimated by the cutting ring method. The total porosity was calculated from the soil volume, weight, and bulk [10].

2.3.3. Soil Bacterial Mass

The soil bacterial biomass was extracted by fumigation and leaching. Among them, the bacterial biomass carbon was fumigated and determined by the extraction–volumetric analysis method, the bacterial biomass nitrogen was fumigated and determined by the extraction–ninhydrin colourimetric method, and the bacterial biomass phosphorus was fumigated and determined by the extraction–total phosphorus determination method [19]. The kEc value used in the fumigation extraction method was 0.38.

2.3.4. Soil Enzyme Activity

Activity of the soil protease, cellulose, invertase, phosphatase, and urease was determined by colourimetry and that of the catalase activity by titration [20].

2.4. Data Analysis

BIOLOG metabolism: average well colour development (AWCD)
AWCD = Σ (CR)/n
(n differs with the type of medium [14]; in the present study, n was 31.)
PLFA profiles: gas chromatography–mass spectrometry (GC–MS) was used for the determination of the fatty acid species. A variance analysis of the fatty acid profiles was conducted using STATISTICA ver. 6.0 (StatSoft Inc., Tulsa, OK, USA).
DGGE fingerprinting: the gel interpretation and the calculation of mobility, intensity, and area were carried out using Bio-Rad’s gel imaging system (Quantity One 4.4.1, Bio-Rad, Hercules, CA, USA).
Diversity index: the Shannon–Wiener diversity index equation, namely
H = i = 1 S P i ln p i ,   E H = H / H max = H / ln S
was used, where the diversity index (H), richness (S), and evenness (EH) represent the diversities of the soil bacterial carbon metabolism, fatty acids, and DNA segments, respectively.
Differences in soil microorganisms: a variance analysis and multiple comparisons with the least significant difference (LSD) method were performed using DPS ver. 9.5 (Data Processing System, Science Press, Beijing, China) to reveal whether the soil bacterial diversity differed significantly among different sites.

2.5. Evaluation of Soil Fertility

The soil fertility reflects the combined physical, chemical, and biological properties of soil. To reliably reveal the differences in a single fertility index among different soil layers, the average values of the soil parameters at 0–5 cm, 5–15 cm, 15–30 cm, and 30–50 cm were analysed using the principal component analysis (PCA) to establish an evaluation system for soil fertility in the shelterbelt bordering the Tarim Desert Highway. In this evaluation system, the physical properties include the bulk density, total moisture content, and median diameter of the soil particles; the chemical properties include the soil nutrients (OM, TN, TP, TK, AN, AP, AK) and salinity-related parameters, including the pH, total salt content, and cation exchange capacity (CEC); and the biological properties include the bacterial diversity index (carbon source metabolism, species of fatty acid, and DNA segments), the activity of the soil enzymes (protease, cellulose, invertase, phosphatase, urease, and catalase), and the C, N, and P content of the soil bacterial biomass. The weights of all the fertility indicators were shown in Table 2.
The soil integrated fertility index (IFI), viewed as a synthetic index of each soil parameter, has been used in another study [21]. We selected the continuous function to evaluate each factor because each parameter varies continuously. The ascending or descending property of this function was determined by the positive or negative property of the factor loading of the principal component, which agrees with the effects of these factors on vegetation. For the bulk density, pH, and total salt content, a function with a descending property was chosen:
F(Xij) = (XimaxXij)/(XimaxXimin)
However, for the soil moisture content, porosity, and all the chemical and biological factors, a function with an ascending property was introduced:
F(Xij) = (XijXimin)/(XimaxXimin)
In the above equations, F(Xij) shows the relative importance of each fertility factor, Xij is the value of each fertility factor, and Ximax and Ximin express the maximum and minimum value of one factor.
Because the soil fertility parameters differ in their importance, a weight coefficient was introduced, which was obtained by calculating the percentage of the communality of one factor, and the numerical conversion was performed as follows:
W i = C o m m u n i t y i / n = 1 i C o m m u n i t y i
According to the additive–multiplicative rule, the fertility index is synthesized multiplicatively by the individual parameters. The integrated fertility index is, therefore, calculated by the following equation:
IFI = ∑ [Wi × F(Xij)]
where Wi is the weight coefficient of each fertility factor and F (Xij) expresses its relative importance.

3. Results and Analysis

3.1. Soil Bacterial Diversity
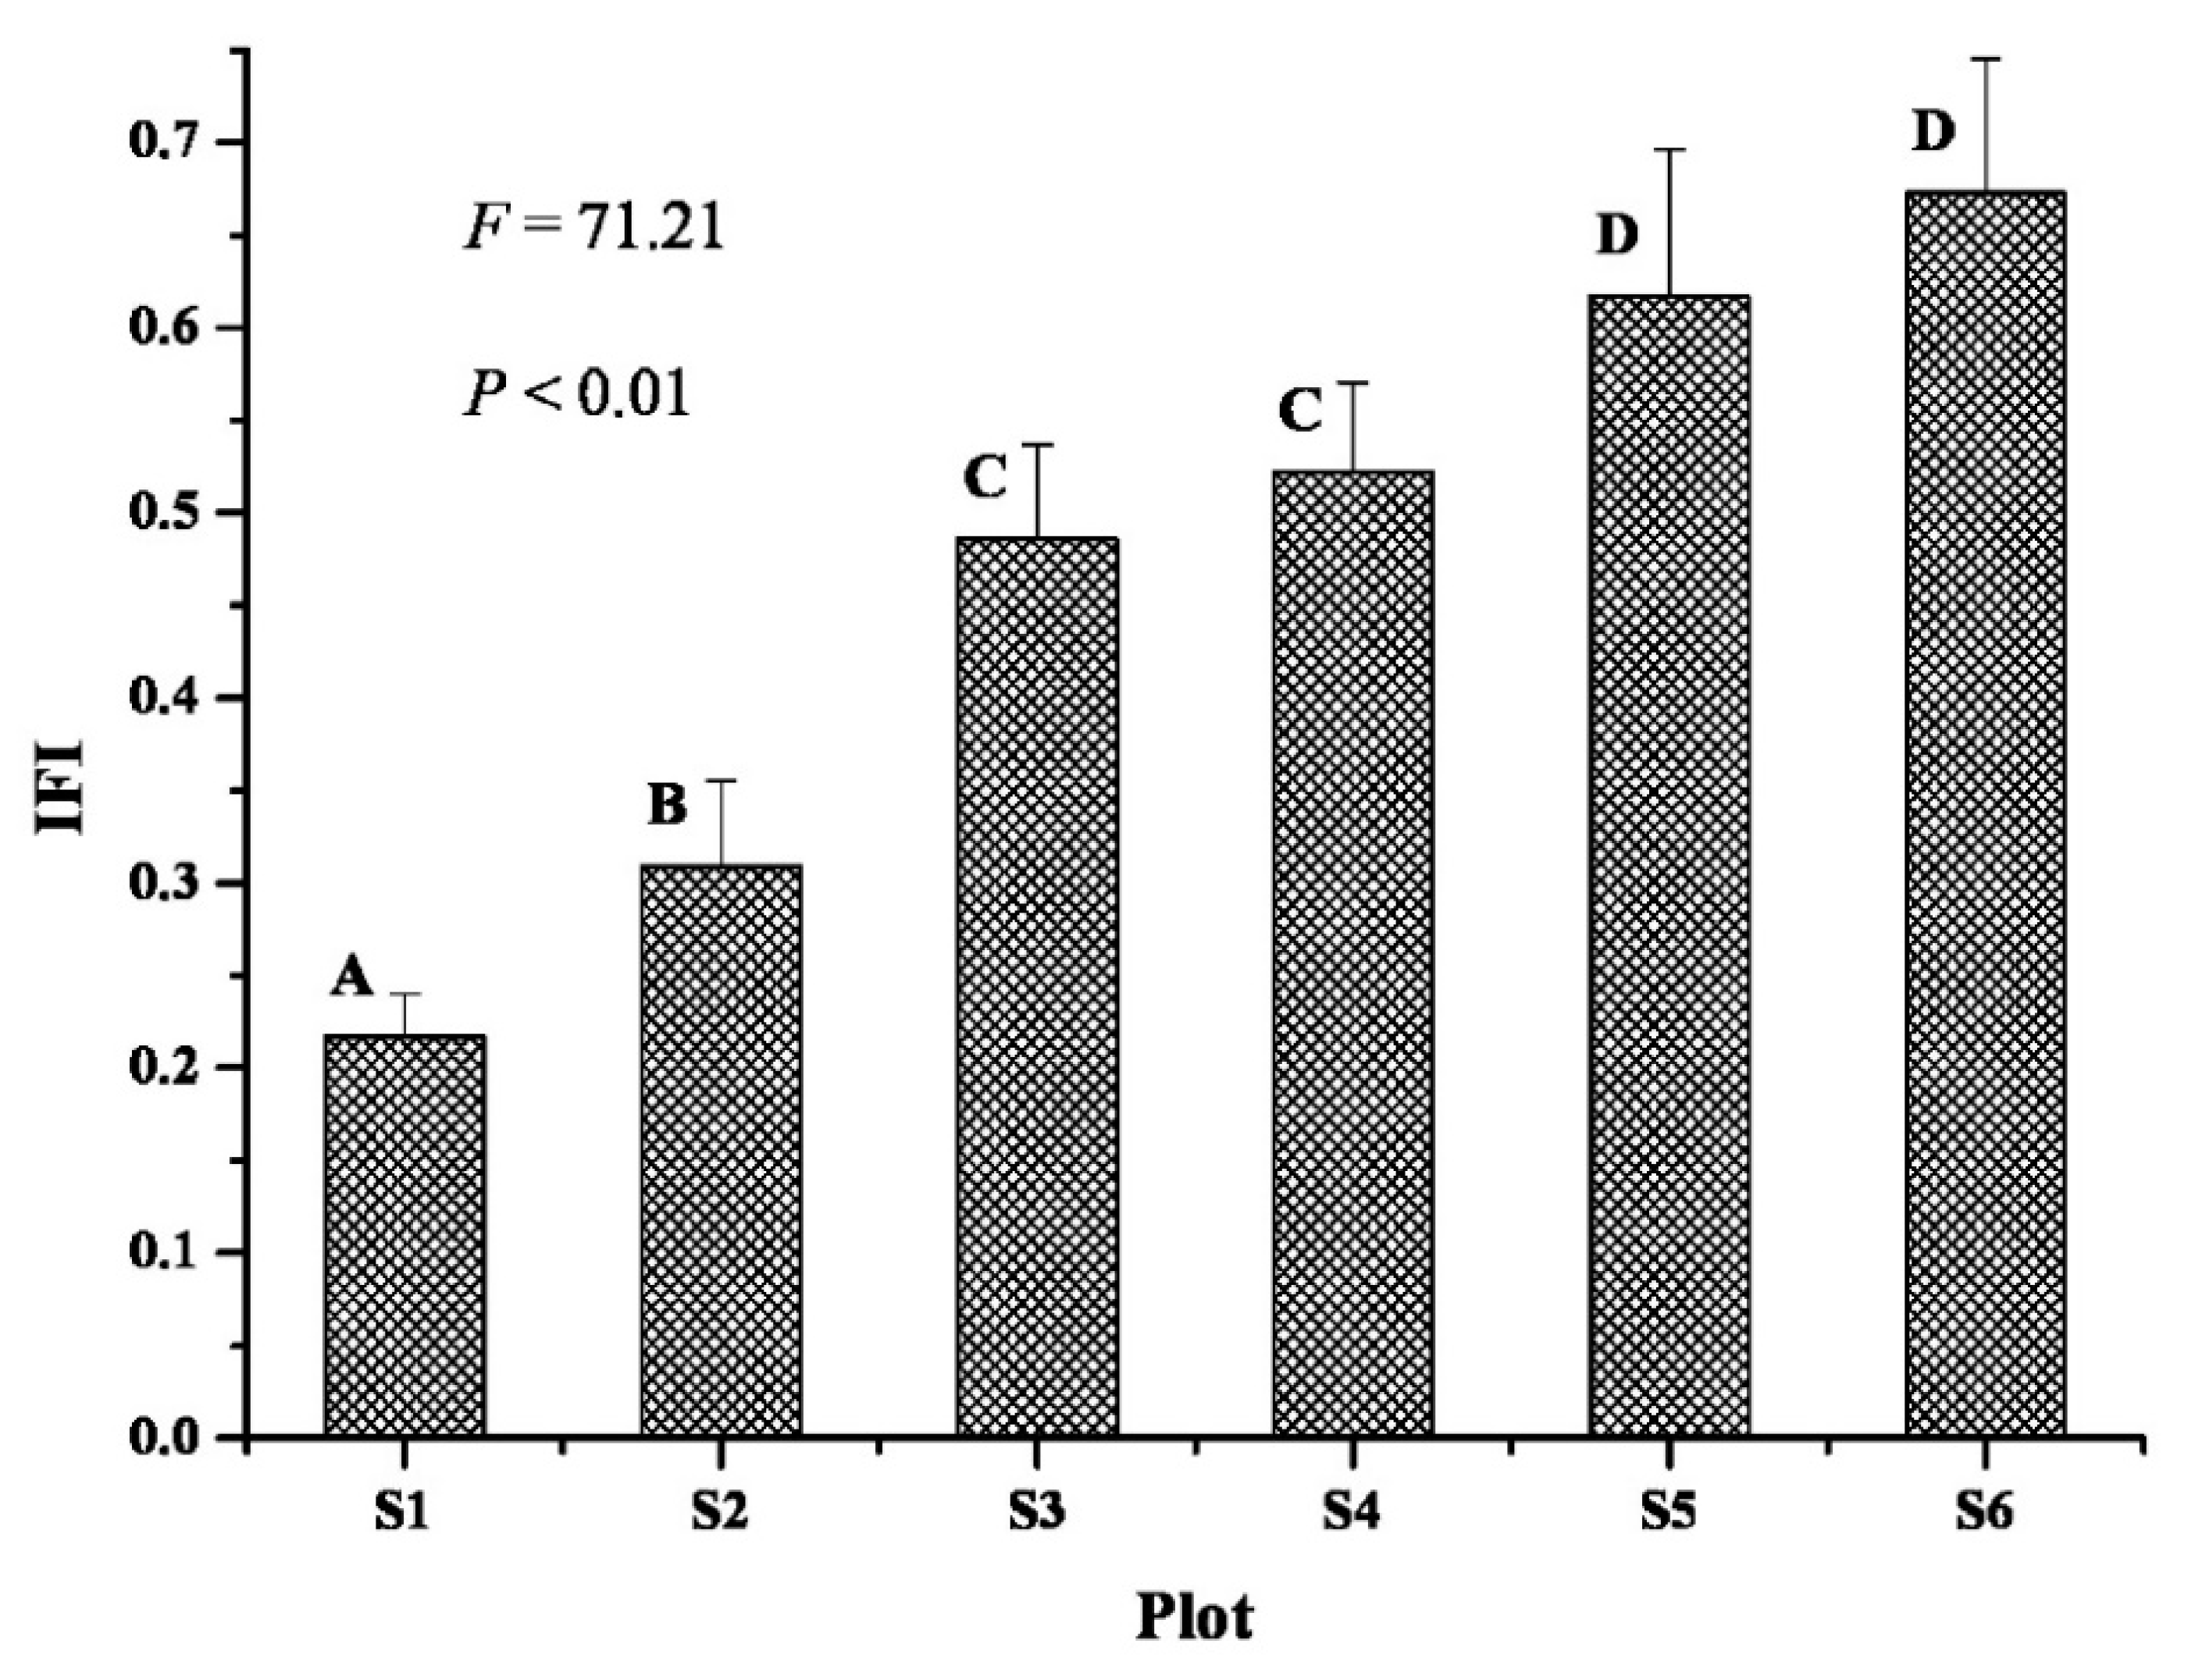
Table 3 shows that the carbon metabolic diversity index, genetic diversity index, and fatty acid diversity index of soil microorganisms decreased with an increase in salinity. The variance analysis and multiple comparisons indicated that the differences in the genetic diversity index H and richness S among the shelterbelt soils receiving irrigation water of different salinity levels were highly significant (p > p0.01), and the differences among the soils in terms of the diversity index H and the richness index S representing carbon metabolism were also significant (p > p0.05), whereas those in terms of the diversity index H, richness index S, evenness index EH of fatty acids, and evenness index EH of genes were not significant (p < p0.05). Thus, the genetic diversity of soil microorganisms was most affected by the differences in the salinity, followed by the carbon metabolic diversity and fatty acid diversity, in that order, suggesting that the species distribution evenness indexes of soil bacterial genes and of fatty acids were not particularly affected. Therefore, when the salinity was high, the metabolic activity of soil microorganisms was low and so were the diversities of the gene and fatty acid species.
According to Table 4, the homology value of the bacteria was greater than 95% after a phylogenetic comparison on the GenBank database. Among the 30 soil samples were Janthinobacterium sp., Thiobacillus denitrificans, Acidovorax sp., Shewanella frigidimarina, and Anaeromyxobacter. In more than half of the soil samples, the homogeneity of the electrophoretic bands with Janthinobacterium sp. and Thiobacillus denitrificans reached 100%.

3.2. Soil Fertility

As can be seen in Figure 1, as the salinity decreased, the IFI increased significantly (F = 71.21 > F 0.01): at the highest level of salinity (S1, 23.8 g/L), the IFI was less than 0.25; at the next level (S2, 18.10 g/L), the IFI was slightly greater than 0.3; the trend continued until at the lowest salinity (S6, 2.58 g/L), the IFI exceeded 0.65, a value that was more than double that at S2. Therefore, highly saline water for irrigation is not conducive to soil fertility.
The soil fertility also varied with depth, with the deeper layers being more fertile. Figure 2 shows that the IFI of the top layer (D1, 0–5 cm) was the lowest (less than 0.3) and was significantly lower than that of any other layer. However, among the three other layers, the difference in fertility was not significant.

3.3. Relationship between Soil Bacterial Diversity and Soil Fertility

Figure 3 shows the power function relation between the AWCD values, which represent the carbon metabolic activity of soil microorganisms, and the IFI. The function equation was Y = 0.56X0.66 and the coefficient of determination R2 was 0.82. Therefore, the IFI would increase proportionally to the power of the soil carbon metabolic activity.
Figure 4 shows the power function relation between the diversity index H of fatty acids in soil microorganisms and the IFI. The function equation was Y = 2×10−7X15.35 and the coefficient of determination R2 was 0.889, indicating that the IFI increased proportionally to the power of the diversity index H of the soil fatty acids.
Figure 5 shows the polynomial relation between the diversity index H of DNA segments of soil microorganisms and the IFI. The function equation was Y = 1.07X2 + 4.28X–3.41 and the coefficient of determination R2 was 0.866, indicating that the IFI increased proportionally to the polynomial of the diversity index H of the soil DNA segments.

3.4. Composition Characters of Soil Salinity

Table 5 shows that the contents of salt ions in soils differed due to the level of salinity of the irrigation water. The ions, in descending order, were SO42−, Cl, Na+, Ca2+, HCO3, K+, Mg2+, and CO32–. Three salt ions, SO42–, Cl, and Na+, together contributed more than 80% of the total, whereas CO32–, at less than 1%, contributed the least. This distribution indicates that the major salts in the soils of the Tarim Desert Highway shelterbelt were Na+, Cl, and SO42–. The total soil salinity increased with an increase in the level of salinity of the irrigation water, although the Na+ and Cl contents decreased and the SO42– content increased.

4. Discussion and Conclusions

4.1. Effect of Salinity of Irrigation Water on Soil Bacterial Diversity

The soil samples in this study were collected from non-rhizospheric areas of the shelterbelt trees; therefore, the effects of plants on soil salinity can be safely ignored. The soil salinity depended mainly on the salt content of the irrigation water and was thus related to the level of salinity of that water [22].
The soil bacterial diversity of the Tarim Desert Highway shelterbelt differed significantly with the level of salinity of the irrigation water. A higher salinity exposes the soil microorganisms to greater salt stress, which lowers not only the diversity of the bacterial populations but also their activity [23]. The soil salinity affects the availability of soil nutrients; for example, a massive accumulation of Ca2+ results in more of the soil phosphorus being fixed, thereby reducing its availability to plants [24]. The richness and composition of the soil nutrients determine the species, numbers, and activities of the microorganisms [25]. In the Tarim Desert Highway shelterbelt, the irrigation salinity mainly affected the soil salinity in the 0–20 cm range [26]. Therefore, highly saline water used for drip irrigation is not conducive to the survival of microorganisms and adversely affects their functional diversity, genetic diversity, and species diversity in the Tarim Desert Highway shelterbelt.

4.2. Changes in Soil Fertility under Drip Irrigation with Saline Water

The IFI values increased significantly with a decrease in the salinity of the drip irrigation. Highly saline water used for drip irrigation is not conducive to soil fertility. The salt accumulation caused greater bulk density, which is not conducive to the normal turnover of soil nutrients and their availability, resulting in an overall decline in the soil quality [27].
The differences in soil fertility at different depths were obvious. The lower fertility of the top layer was due to severe soil compaction, and the topsoil was also affected by sandstorms. In fact, most of the topsoil consisted of mobile aeolian sand, which directly lowers its fertility, whereas the lower layers were protected in one sense and hence more fertile [28].
Gu et al. [29] suggest that the use of saline water for irrigating the extremely arid areas that border the Tarim Desert Highway helped not only in establishing the shelterbelt, but also in making the aeolian sandy soils more fertile by improving their physical and chemical properties. Wang et al. [10] found that the nutrient content of soils from a four-year-old plantation of Ephedra was much higher than that of a site along artemisia ordosicaartemisia ordosicaartemisia ordosicaartemisia ordosicathe southern edge of the Mu Us Sandland. Cao et al. [11] found that the physical and chemical properties of soils were improved after a plantation of Caragana microphylla Lam. was established in the sand dunes of the Horqin Sandland, and that the activity of soil enzymes increased gradually with the age of the forest. Therefore, establishing or restoring vegetation, even by using saline water for drip irrigation, is good for the soil—it increases the soil nutrient levels and encourages biological activity.

4.3. The Relationship between Soil Microorganisms and Soil Fertility

Microorganisms play an important role in maintaining soil fertility. They convert naturally occurring nutrients in soil and those added from fertilizers from unavailable forms to available forms. The soil ecosystem is primarily controlled by soil microflora, and small changes in soil can lead to large changes in the bacterial diversity [30]. Changes in the soil bacterial communities, which are governed by soil fertility and environmental conditions, can be used as important biological indicators of soil fertility [31].
Therefore, using less saline water for drip irrigation could avoid salt accumulation in soil and arrest its compaction, promote the formation of soil aggregates and the build-up of nutrients, and increase microbial activity, thus playing a crucial role in promoting the circulation, conversion, and utilization of nutrients in aeolian sandy soils and improving the soil quality. The judicious use of saline water, therefore, deserves serious consideration in irrigation practices.

Author Contributions

Data curation, H.W.; writing—original draft preparation, X.Y.; writing—review and editing, Z.J. All authors have read and agreed to the published version of the manuscript.

Funding

This research was funded by the Natural Science Foundation of China, grant number 41571498.

Institutional Review Board Statement

Not applicable.

Informed Consent Statement

Not applicable.

Data Availability Statement

The data that support the findings of this study are available from the corresponding author upon reasonable request.

Acknowledgments

The authors wish to thank Key Laboratory of Biogeography and Bioresource in Arid Land, Xinjiang Institute of Ecology and Geography, Chinese Academy of Sciences, and Xinjiang Corps’ Oasis Agriculture Key Laboratory for providing technical supports.

Conflicts of Interest

The authors declare no conflict of interest.

References

  1. Breure, A.M.; Mulder, C.; Römbke, J.; Ruf, A. Ecological classification and assessment concepts in soil protection. Ecotoxicol. Environ. Saf. 2005, 62, 211–229. [Google Scholar] [CrossRef]
  2. Doran, J.W.; Coleman, D.C.; Bezdicek, D.F. Defining Soil Quality for a Sustainable Environment; SSSA Special Publication: Madison, WI, USA, 1994. [Google Scholar]
  3. Sun, B.; Zhou, S.; Zhao, Q. Evaluation of spatial and temporal changes of soil quality based on geostatistical analysis in the hill region of subtropical China. Geoderma 2003, 115, 85–99. [Google Scholar] [CrossRef]
  4. Harris, J.A. Measurements of the soil microbial community for estimating the success of restoration. Eur. J. Soil Sci. 2003, 54, 801–808. [Google Scholar] [CrossRef]
  5. Bonanomi, G.; D’Ascoli, R.; Antignani, V.; Capodilupo, M.; Cozzolino, L.; Marzaioli, R.; Puopolo, G.; Rutigliano, F.A.; Scelza, R.; Scotti, R.; et al. Assessing soil quality under intensive cultivation and tree orchards in Southern Italy. Appl. Soil Ecol. 2011, 47, 184–194. [Google Scholar] [CrossRef]
  6. Liu, Z.F.; Fu, B.J.; Liu, G.H.; Zhu, Y.G. Soil quality: Concept, indicators and its assessment. Acta Ecol. Sin. 2006, 26, 901–910. [Google Scholar]
  7. Schaeffer, S.M.; Billings, S.A.; Evans, R.D. Responses of soil nitrogen dynamics in a Mojave Desert ecosystem to manipulations in soil carbon and nitrogen availability. Oecologia 2003, 134, 547–553. [Google Scholar] [CrossRef]
  8. Jin, Z.; Lei, J.; Xu, X.; Li, S.; Fan, J.; Zhao, S. Characteristics of the soil microbial population in forest land irrigated with saline water in the desert area. J. Arid. Land 2010, 2, 107–115. [Google Scholar] [CrossRef]
  9. Yuqin, S.; Ji, Z. Vertical distributions in number of soil microorganism in stabilized sand dune with Artemisia ordosica in the Hobq of Inter-mongol. Acta Scient. Natur. Univer. Neim. 2000, 31, 198–200. [Google Scholar]
  10. Wang, Z.; Peng, R.Y.; Wang, L.; Liu, L.Y. Studies on soil properties of aeolian sandy land improvement and utilization in south edge of Musu desert. J. Soil Water Conserv. 2006, 20, 14–17. [Google Scholar]
  11. Cao, C.Y.; Jiang, D.M.; Quan, G.J.; Geng, L.; Cui, Z.B.; Luo, Y.M. Soil physical and chemical characters changes of Caragana mi-crophylla plantation for sand fixation in Keerqin sandy land. J. Soil Water Conserv. 2004, 18, 108–112. [Google Scholar]
  12. Guo, K.; Dong, X.J.; Liu, Z.M. Characteristics of soil moisture content on sand dunes in Mu Us sandy grassland: Why Artemisia ordosica declines old fixed sand dunes. Acta Phyt. Sin. 2000, 24, 275–279. [Google Scholar]
  13. Liu, J.-J.; Fang, S.-Z.; Xie, B.-D.; Hao, J.-J. Effects of bio-mulching on rhizosphere soil microbial population, enzyme activity and tree growth in poplar plantation. Ying Yong Sheng Tai Xue Bao J. Appl. Ecol. 2008, 19, 1204–1210. [Google Scholar]
  14. Calbrix, R.; Laval, K.; Barray, S. Analysis of the potential functional diversity of the bacterial community in soil: A reproducible procedure using sole-carbon-source utilization profiles. Eur. J. Soil Biol. 2005, 41, 11–20. [Google Scholar] [CrossRef]
  15. Duan, X.-J.; Min, H. Diversity of microbial genes in paddy soil stressed by cadmium using DGGE. Huan Jing Ke Xue Huanjing Kexue 2004, 25, 122–126. [Google Scholar]
  16. Pennanen, T.; Paavolainen, L.; Hantula, J. Rapid PCR-based method for the direct analysis of fungal communities in complex environmental samples. Soil Biol. Biochem. 2001, 33, 697–699. [Google Scholar] [CrossRef]
  17. Larkin, R.P.; Honeycutt, C.W.; Griffin, T.S. Effect of swine and dairy manure amendments on microbial communities in three soils as influenced by environmental conditions. Biol. Fert. Soils 2006, 43, 51–61. [Google Scholar] [CrossRef]
  18. Institute of Soil Science; Chinese Academy of Science. Soil Physical and Chemical Properties Analysis; Science and Technology Press in Shanghai: Shanghai, China, 1978. [Google Scholar]
  19. Wu, J.S.; Lin, Q.M.; Huang, Q.Y. Soil Microbial Biomass of Methods and Application; Meteorological Press: Beijing, China, 2006; pp. 55–88. [Google Scholar]
  20. Guang, S.Y. Soil Enzyme and Its Methodology; Agriculture Press: Beijing, China, 1986. [Google Scholar]
  21. Zhang, D.H.; Ye, Z.F. The effects of rotating plantation on the soil fertility of forest and the growth of stand. Scinen. Silv. Sin. 2001, 37, 10–15. [Google Scholar]
  22. Jin, Z.; Lei, J.; Xu, X.; Li, S.; Zhang, Z.; Peng, H.; Zhong, X. Effect of Drip Irrigation Water with Different Salinity on Soil Microbe of the Tarim Desert Highway Shelter-Forest. In Proceedings of the 2nd International Conference on Remote Sensing, Environment and Transportation Engineering, Nanjing, China, 1–3 June 2012; pp. 1–6. [Google Scholar] [CrossRef]
  23. Pang, H.C.; Li, Y.Y.; Yu, T.Y.; Liu, G.J.; Dong, L.H. Effects of microorganism agent on soil salination and alfalfa growth under different salt stress. Plant Nutr. Fertil. Sci. 2011, 17, 1403–1408. [Google Scholar]
  24. Kirk, J.L.; Beaudette, L.A.; Hart, M.; Moutoglis, P.; Klironomos, J.N.; Lee, H.; Trevors, J.T. Methods of studying soil microbial diversity. J. Microbiol. Methods 2004, 58, 169–188. [Google Scholar] [CrossRef]
  25. Yu, H.Y.; Li, T.X. Evolution of salt accumulation greenhouse soil in Liaoning province. J. Soil Water Conserv. 2005, 19, 80–83. [Google Scholar]
  26. Zhang, J.G.; Xu, X.W.; Li, S.Y.; Zhao, Y.; Zhang, A.F.; Zhang, T.B.; Jiang, R. Is the Taklimakan Desert Highway shelterbelt sus-tainable to long-term drip irrigation with high saline groundwater? PLoS ONE 2016, 11, 1–16. [Google Scholar]
  27. Wall, D.H.; Virginia, R.A. Controls on soil biodiversity: Insights from extreme environments. Appl. Soil Ecol. 1999, 13, 137–150. [Google Scholar] [CrossRef]
  28. Lei, J.; Li, S.; Jin, Z.; Fan, J.; Wang, H.; Fan, D.; Zhou, H.; Gu, F.; Qiu, Y.; Xu, B. Comprehensive eco-environmental effects of the shelter-forest ecological engineering along the Tarim Desert Highway. Sci. Bull. 2008, 53, 190–202. [Google Scholar] [CrossRef] [Green Version]
  29. Gu, F.X.; Pan, X.L.; Pan, B.R.; Wen, Q.K. Changing of eolian soil fertility in central Taklimakan Desert under impact of artificial vegetation. Ecol. Sin. 2002, 22, 1179–1188. [Google Scholar]
  30. Zhang, H.B.; Duan, C.Q.; Qu, L.H. Culture independent methods for studies on microbial ecology of soils. Chin. J. Ecol. 2003, 22, 131–136. [Google Scholar]
  31. Wang, Y.; Han, B.; Shi, Z.Q.; Shao, G.Q.; Jiang, X.D.; Ning, T.Y.; Jiao, N.Y.; Li, Z.J. Effects of conservation tillage on soil microbial characters and soil enzyme activities. J. Soil Water Conserv. 2006, 20, 120–122. [Google Scholar]
Figure 1. Soil fertility following irrigation with water of different salinity levels (S1, S2, S3, S4, S5, S6 refer to the plots with different salinity value mentioned in Table 1; A, B, C, D represents the result of a letter marker in a variety of comparisons).
Diversity 13 00379 g001
Figure 2. Soil fertility at different depths (D1, D2, D3, D4 refer to the different soil layer; A, B represents the result of a letter marker in a variety of comparisons).
Diversity 13 00379 g002
Figure 3. The relationship between the metabolic diversity of soil microorganisms and soil fertility.
Diversity 13 00379 g003
Figure 4. The relationship between the fatty acid diversity of soil microorganisms and soil fertility.
Diversity 13 00379 g004
Figure 5. The relationship between the genetic diversity of soil microorganisms and soil fertility.
Diversity 13 00379 g005
Table 1. Details of the sampling plots receiving irrigation water at different levels of salinity (mean ± SD, n = 10). Data were mean ± standard deviation (n = 10).
Plot No.Salinity Value (g/L−1)Location (Miles along the Desert Highway from Minfeng County)
S123.80 ± 1.12140 km + 470 m
S218.10 ± 0.84168 km + 800 m
S313.99 ± 0.66176 km + 000 m
S48.90 ± 0.45184 km + 500 m
S55.75 ± 0.29277 km + 500 m
S62.58 ± 0.13318 km + 100 m
Table 2. The weights of all the fertility indicators.
Fertility FactorCommunityFertility FactorCommunity
Organic matter0.036DNA segments0.033
Total nitrogen0.043Carbon source metabolism0.039
Total phosphorus0.041Species of fatty acid0.038
Total potassium0.037Catalase0.039
Available nitrogen0.044Phosphatase0.040
Available phosphorus0.041Urease0.043
Available potassium0.041Cellulose0.033
pH0.049Urease0.039
Electrical conductivity0.034Protease0.036
Total salt0.043Bacterial biomass carbon0.044
Bulk density0.041Bacterial biomass nitrogen0.039
Median diameter of soil particles0.040Bacterial biomass phosphorus0.041
Moisture content0.047
Table 3. Changes in the soil bacterial diversity indexes due to the salinity levels (n = 5, Mean ± SE).
PlotCarbon MechanismGenesFatty Acids
HSEHHSEHHSEH
S1(23.80)2.85 ± 0.23 a21.75 ± 2.84 a0.93 ± 0.12 a0.82 ± 0.07 A12.34 ± 1.61 A0.25 ± 0.02 a1.30 ± 0.35 a20.08 ± 1.83 a0.33 ± 0.05 a
S2(18.10)3.14 ± 0.47 b25.75 ± 3.16 b0.97 ± 0.14 a0.87 ± 0.06 A12.96 ± 1.80 A0.29 ± 0.04 a1.47 ± 0.38 a21.69 ± 2.48 a0.41 ± 0.08 ab
S3(13.99)3.20 ± 0.35 b27.13 ± 3.60 c0.97 ± 0.17 a1.00 ± 0.06 A14.25 ± 2.57 A0.39 ± 0.04 b1.51 ± 0.33 ab23.5 ± 5.07 ab0.39 ± 0.09 a
S4(8.90)3.24 ± 0.39 b27.88 ± 2.82 c0.97 ± 0.18 a1.34 ± 0.32 B20.25 ± 3.18 B0.50 ± 0.11 c1.65 ± 0.60 b25.75 ± 2.56 b0.55 ± 0.15 bc
S5(5.75)3.26 ± 0.44 b28.63 ± 4.58 c0.97 ± 0.19 a1.78 ± 0.54 C35.00 ± 5.34 C0.48 ± 0.10 c1.73 ± 0.75 bc30.01 ± 4.91 c0.58 ± 0.11 c
S6(2.58)3.59 ± 0.45 c29.13 ± 4.22 c1.06 ± 0.21 a2.43 ± 0.47 D41.75 ± 5.9 D0.63 ± 0.13 d1.86 ± 0.92 c32 ± 8.42 c0.57 ± 0.14 c
p value** ****
Note: (1) The least significant difference (LSD) method was used for determining the significance (F test); n = 5; ** and * denote significance levels of 0.01 and 0.05, respectively; and capital and small letters after numbers denote highly significant and significant differences, respectively. (2) H—Diversity index, S—Richness index, EH—Uniformity index.
Table 4. Tentative identification of the dominant DGGE bands by sequencing the excised and BLAST analysis.
BandsClosest Species in the GenBank DatabaseSequence Accession NumberSimilarity (%)
C1Janthinobacterium sp.AY88012100
C2Acidovorax sp.AY8801399
C3AnaeromyxobacterAY8801496
C4Thiobacillus denitrificansAY88015100
C5Shewanella frigidimarinaAY8801697
Note: C1, C2, C3, C4, C5 refers to the five bands marked in the DGGE electrophoretic picture after being cut.
Table 5. Contents (grams/litre) of eight main salt ions in soils irrigated with water at different salinity levels.
PlotCO32−HCO3−ClSO42−Ca2+Mg2+Na+K+
S10.090.316.366.042.100.583.470.32
S20.070.286.045.751.860.473.290.27
S30.010.124.464.881.520.262.970.12
S40.010.121.693.330.870.251.180.14
S50.030.171.310.710.140.070.920.11
S60.020.131.090.860.190.060.800.11
Publisher’s Note: MDPI stays neutral with regard to jurisdictional claims in published maps and institutional affiliations.

