Article

Bacterial Diversity and Community in Regional Water Microbiota between Different Towns in World’s Longevity Township Jiaoling, China

1
School of Food and Biological Engineering, Shaanxi University of Science and Technology, Xi’an 710021, China
2
Guangdong Provincial Key Laboratory of Microbial Safety and Health, State Key Laboratory of Applied Microbiology Southern China, Institute of Microbiology, Guangdong Academy of Sciences, Guangzhou 510070, China
3
Department of Food Science and Technology, Institute of Food Safety and Nutrition, Jinan University, Guangzhou 510632, China
*
Authors to whom correspondence should be addressed.
Diversity 2021, 13(8), 361; https://doi.org/10.3390/d13080361
Submission received: 28 June 2021 / Revised: 12 July 2021 / Accepted: 30 July 2021 / Published: 5 August 2021
(This article belongs to the Section Microbial Diversity and Culture Collections)

Abstract

:
Healthy longevity is associated with many factors, however, the potential correlation between longevity and microbiota remains elusive. To address this, we explored environmental microbiota from one of the world’s longevity townships in China. We used 16S rRNA gene high-throughput sequencing to analyze the composition and function of water microbiota. The composition and diversity of water microbiota significantly differed between the towns. Lactobacillus, Streptococcus, Bacteroides, Faecalibacterium, and Stenotrophomonas were only dominant in Xinpu, a town with an exceptionally high centenarian population. Several biomarkers were identified, including Flavobacterium, Acinetobacter, Paracoccus, Lactobacillales, Psychrobacter, Bacteroides, Ruminococcaceae, and Faecalibacterium, and these shown to be responsible for the significant differences between towns. The main species contributing to the differences between towns were Cyanobacteria, Cupriavidus and Ralstonia. Based on KEGG pathways showed that the predicted metabolic characteristics of the water microbiota in Xinpu towns were significantly different to those of the other towns. The results revealed significant differences in the composition and diversity of water microbiota in the longevity township. These findings provide a foundation for further research on the role of water microbiota in healthy longevity.

1. Introduction

Increasing human health and longevity is of global interest. The continuous increase in lifespan and the consequent growth of the elderly population have led to an increase in studies on aging. Centenarians are considered a symbol of health and longevity [1,2]. Therefore, many studies have focused on centenarians to identify the factors influencing health and longevity [3,4,5]. Although the mechanism of longevity is complex and there are many controversial debates, researchers have basically reached the consensus that longevity is comprehensively affected by genetics [6,7,8], lifestyle [9], environment [10,11], health care level [12], psychological factors [13,14], and other factors [15,16,17].
In the biomedical field, the research has focused on searching for molecular and biological factors that promote healthy aging and longevity. Considerable attention has been paid to analyzing the role of genetic factors in determining healthy aging and longevity. Siblings of centenarians have a lower risk of suffering from major age-related diseases (diabetes, cancer, and cardiovascular diseases) than controls from the same population [18,19]. Furthermore, the offspring of centenarians are healthier than age-matched controls belonging to the same demographic cohorts [20], suggesting that the biological components of longevity might basically overlap with those of healthy aging. However, a study concluded that approximately one-quarter of the variation in lifespan can be attributed to genetic factors. Some environmental and lifestyle determinants associated with longevity have been identified [21].
The correlation between genetics and the environment in determining aging is a hot topic in modern geriatrics. Improvements of living conditions, such as increasing the diversity of food, encouraging sports, and advances in medicine and pharmacology, have greatly contributed to a significantly increased lifespan [22]. Environmental factors may have a cumulative and multiple impact on health and longevity. The idea of “healthy lifestyles and environments” comes from the observation of geographical clusters of centenarians around the world, with five identified “longevity hotspots” known as blue zones, which are located in Sardinia (Italy), Okinawa (Japan), Loma Linda (California), Nicoya (Costa Rica), and Ikaria (Greece) [23]. Thus, their lifestyles and environments are possibly more conducive to longevity than those of the rest of the world [24]. The populations in these areas are characterized by having an active, stress-free lifestyle, strong community bonds, and spirituality [25]. On the other hand, dietary restriction has been robustly associated with increased lifespan and reduced age-associated decline across a wide range of species [26]. The gut microbiota is known to be an important factor in the development of lifestyle-related chronic diseases and metabolic pathologies, such as diabetes, and cardiovascular and inflammatory diseases, which will eventually reduce the quality of life and lead to aging [27]. The gut microbiota can adapt its functional profile in response to changes in diet, environment, and lifestyle, through an optimization of immunological and metabolic performances [28,29].
The environment also plays a very important role in determining longevity, as people are sensitive to the environment [30,31]. In China, differences in life expectancy are related to the humanistic geographical environment, such as the level of economic development [32]. However, the distribution of lifespans reflects the differences in the natural geographical environment [33]. Topography and landforms, climate, soil, water, and other natural geographical environmental factors are the main determinants of longevity [34]. Soil is the material basis on which organisms rely for survival. The most essential trace elements from the soil affect water quality, plant, and human health through the food chain [35,36].
Although some studies have addressed the relationship between the environment and longevity, they have been limited to the macroscopic environmental medium. Few studies have comprehensively investigated the relationship between water microbiota and human longevity. To investigate the association between the water microbiota and longevity in counties of China, we studied Jiaoling, one of the world’s longevity townships. Water samples were collected from eight different towns and a comprehensive study of the environmental microbiota was conducted. The correlation between diversity and function of the water microbiota and longevity in these populations was also explored to provide basic data and scientific support for further studies on regional longevity and its relationship with the natural geographical environment.

2. Materials and Methods

2.1. Sample Collection

In August 2018, 58 water samples were collected from eight towns (TW1, Guangfu, 6 samples; TW2, Nanzai, 4 samples; TW3, Wenfu, 9 samples; TW4, Changtan, 10 samples; TW5, Jiaocheng, 12 samples; TW6, Lanfang, 6 samples; TW7, Sanzhen, 6 samples; and TW8, Xinpu, 5 samples) belonging to the “world’s longevity township” of Jiaoling County (Meizhou City, Guangdong Province, China). Water samples were collected from the lake at the front and back of a long-lived family’s house or drinking water. In order to avoid potential contamination, we have done the following: (1) When sampling, we first put on clean gloves to remove floating objects on the water surface, and collected water samples with a sterile ribozyme-free sampling tube (Axygen). We unscrewed the lid at 10–15cm underwater and tightened the lid when it was full. (2) Water samples were filtered, DNA extraction and PCR were all performed in a clean workbench after UV sterilization, so as to avoid potential pollution effects caused by environmental factors. After collection, the samples were kept at 4 °C during transportation to the laboratory and then stored at −80 °C until DNA extraction was performed. The distribution of population over 80 years old is provided by the local Jiaoling County government.

2.2. DNA Extraction and Polymerase Chain Reaction (PCR) Amplification

The bacterial DNA is extracted by using the Bacteria DNA Kit according to the manufacturer’s protocols. First, the 200 mL water sample was filtered with a 0.22 μm sterile filter membrane, and then the side of the filter membrane that had adsorbed microorganisms was placed in a centrifuge tube with grinding beads so that the grinding beads were closely attached to the side with microorganisms. Then, the sample was then vortexed and shaken for 15 min, centrifuged at 13,000× g for 10 min, and 600 µL of the supernatant was transferred to a new 2.0 mL tube. Then, 150 µL of PS buffer and absorption solution were added, respectively, and centrifuged at 13,000 g for 5 min, put the supernatant in a new tube, and added 700 µL of GDP buffer. The HiPure DNA mini-column absorbed the product and eluted it with sterile water. We used Qubit method and 1% agarose gel electrophoresis to detect the concentration and purity of genomic DNA to quantify and report the biomass, and only reached level B (Qubit: 5 µg ≤ m < 10 ug or m ≥ 10 ug; C ≥ 20 ng/µL; AGE: The sample with no degradation, no stickiness, and no impurities) before proceeding to the next experiment. Sample DNA was diluted to 1 ng/L in sterile water. PCR primers were designed to target the V4 and V5 hypervariable regions of the bacterial 16S rRNA gene, which was amplified by PCR (95 °C for 2 min; 25 cycles at 95 °C for 30 s, 55 °C for 30 s, and 72 °C for 30 s; and extension at 72 °C for 5 min) using primers 338F 5′-ACTCCTACGGGAGGCAGCA-3′ and 806R 5′-GGACTACHVGGGTWTCTAAT-3′. Phusion high-fidelity PCR Master Mix with GC Buffer (New England Biolabs) was used to ensure the amplification efficiency and accuracy, with the diluted genomic DNA as the template.

2.3. 16S rRNA Gene Sequencing

The amplicon library was built using the Ion Plus Fragment Library Kit 48 RXNS (Thermofisher, Shanghai, China). The library was sequenced using Ion S5TMXL (Thermofisher, Shanghai, China) at Novogene Bioinformatics Technology Co., Ltd. A single-end sequencing method was used to construct a small-fragment library.

2.4. Processing of Sequencing Data

Cutadapt (v1.9.1, http://cutadapt.readthedocs.io/en/stable/ (accessed on 10 September 2018)) [37] was first used to remove low-quality fragments of reads. Next, the data were filtered for preliminary quality control of the raw reads. Then, to remove the chimera sequences and obtain clean reads, they were processed by comparing with an annotation database as described elsewhere [38] using GitHub (https://github.com/torognes/vsearch/ (accessed on 10 September 2018)) [39].

2.5. Statistical Analysis

Uparse software (Uparse v7.0.1001, http://www.drive5.com/uparse/ (accessed on 10 September 2018)) [40] was used to cluster all clean reads from the samples. Mothur and the SSUrRNA database [41] from SILVA132 (http://www.arb-silva.de/ (accessed on 10 September 2018)) [42] were used for species annotation. MUSCLE [43] (v3.8.31, http://www.drive5.com/muscle/ (accessed on 10 September 2018)) was used for rapid multiple sequence alignment to determine the phylogenetic relationship of all operational taxonomic units (OTUs). QIIme (v1.9.1) was used to calculate the Shannon index and the Unifrac distance as well as to construct the sample-clustering tree using the unweighted pair group method with arithmetic mean (UPGMA). R (v2.15.3) was used for dilution curve, rank abundance curve, and species accumulation curve calculations, and it was also used to analyze the differences in alpha and beta diversity indices between the groups using the Wilcoxon test in the agricolae package for parametric test. Linear discriminant analysis effect size (LEfSe) software was used to find biomarkers using a default score setting of linear discriminant analysis (LDA) of 4. Based on species abundance, the correlation coefficient (Spearman correlation coefficient or Pearson correlation coefficient) was calculated between the genera, to obtain a correlation coefficient matrix. For edges, graphviz (v2.38.0) was used to draw the network graph. The Tax4Fun function prediction was executed using the nearest-neighbor method based on the minimum 16S rRNA sequence similarity. The specific method involved extracting the 16S rRNA gene sequences from the whole prokaryotic genome of the Kyoto Encyclopedia of Genes and Genomes (KEGG) database and comparing them to those available in the SILVA SSU Ref NR database (BLAST bitscore > 1500) using the BLASTN algorithm to establish a correlation matrix.

3. Results

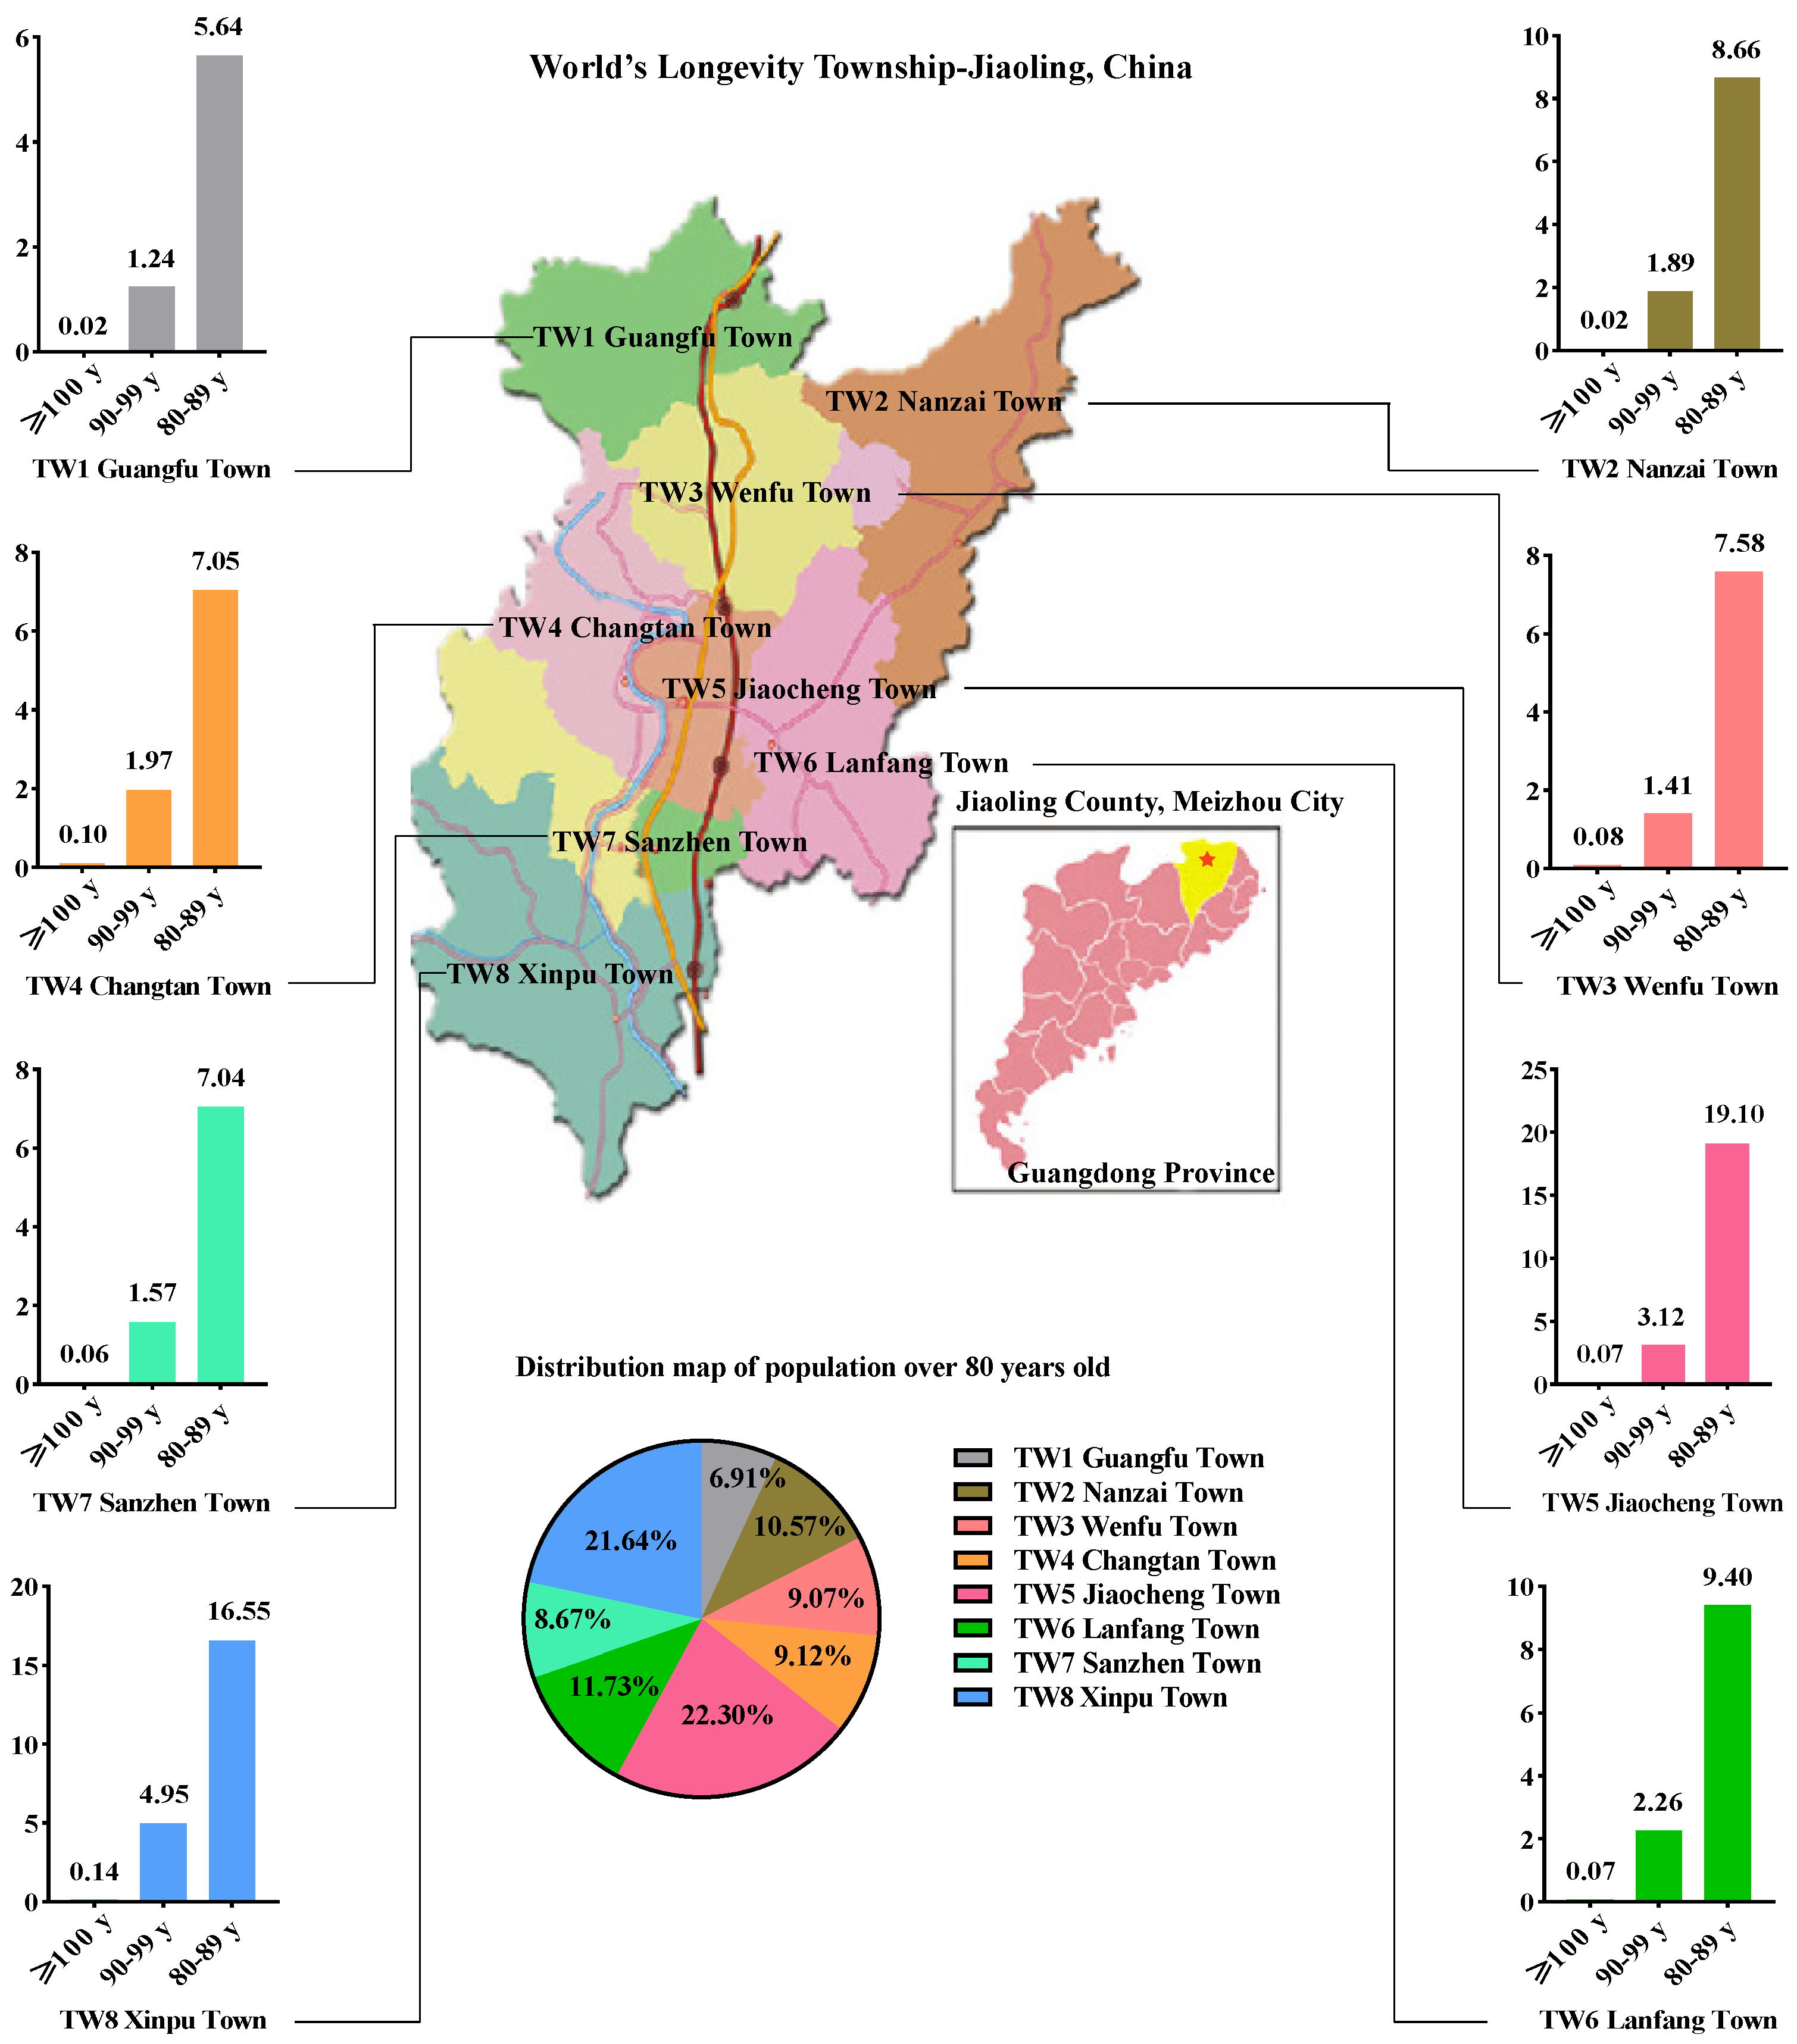
3.1. Characteristics of the Longevous Populations and Sample Sequencing

Jiaoling County is affiliated to Meizhou City, which is located in the northeast of Guangdong Province. In the eight towns of the county, the proportion of the population over the age of 80 (in a total population over the age of 80 approximately 8365 people) was 6.91%, 10.57%, 9.07%, 9.12%, 22.30%, 11.73%, 8.67%, and 21.64%, respectively. The largest and smallest elderly populations were found in Jiaocheng (TW5 samples) and Guangfu (TW1 samples), respectively (Figure 1). According to the proportion of the population aged 80–89, 90–99, and >100 to the total population over 80, Xinpu (TW8 samples) had the highest proportion of centenarians, followed by Changtan (TW4 samples), while Nanzhai (TW2 samples) had the lowest (Figure 1). The proportion of centenarians tended to increase from north to south along the Shiku River.
Bacterial genomic DNA was isolated from water samples of the eight towns and the 16S rRNA gene was sequenced using the Ion S5TMXL sequencing platform (by single-end sequencing), generating small-fragment libraries. By shearing and filtering the reads, an average of 85,015 reads per sample was obtained, with an average of 80,136 valid reads after quality control. The efficiency of quality control was 94.31%. The sequences were then clustered into OTUs at 97% identity, yielding 4601 OTUs that were finally annotated using the Silva132 database. Specifically, 100% OTUs were annotated to the bacterial domain level; 95.11% were annotated to the phylum level; 88.46% were annotated to the class level; 78.55% to the order level; 68.14% to the family level; and 46.84% to the genus level.

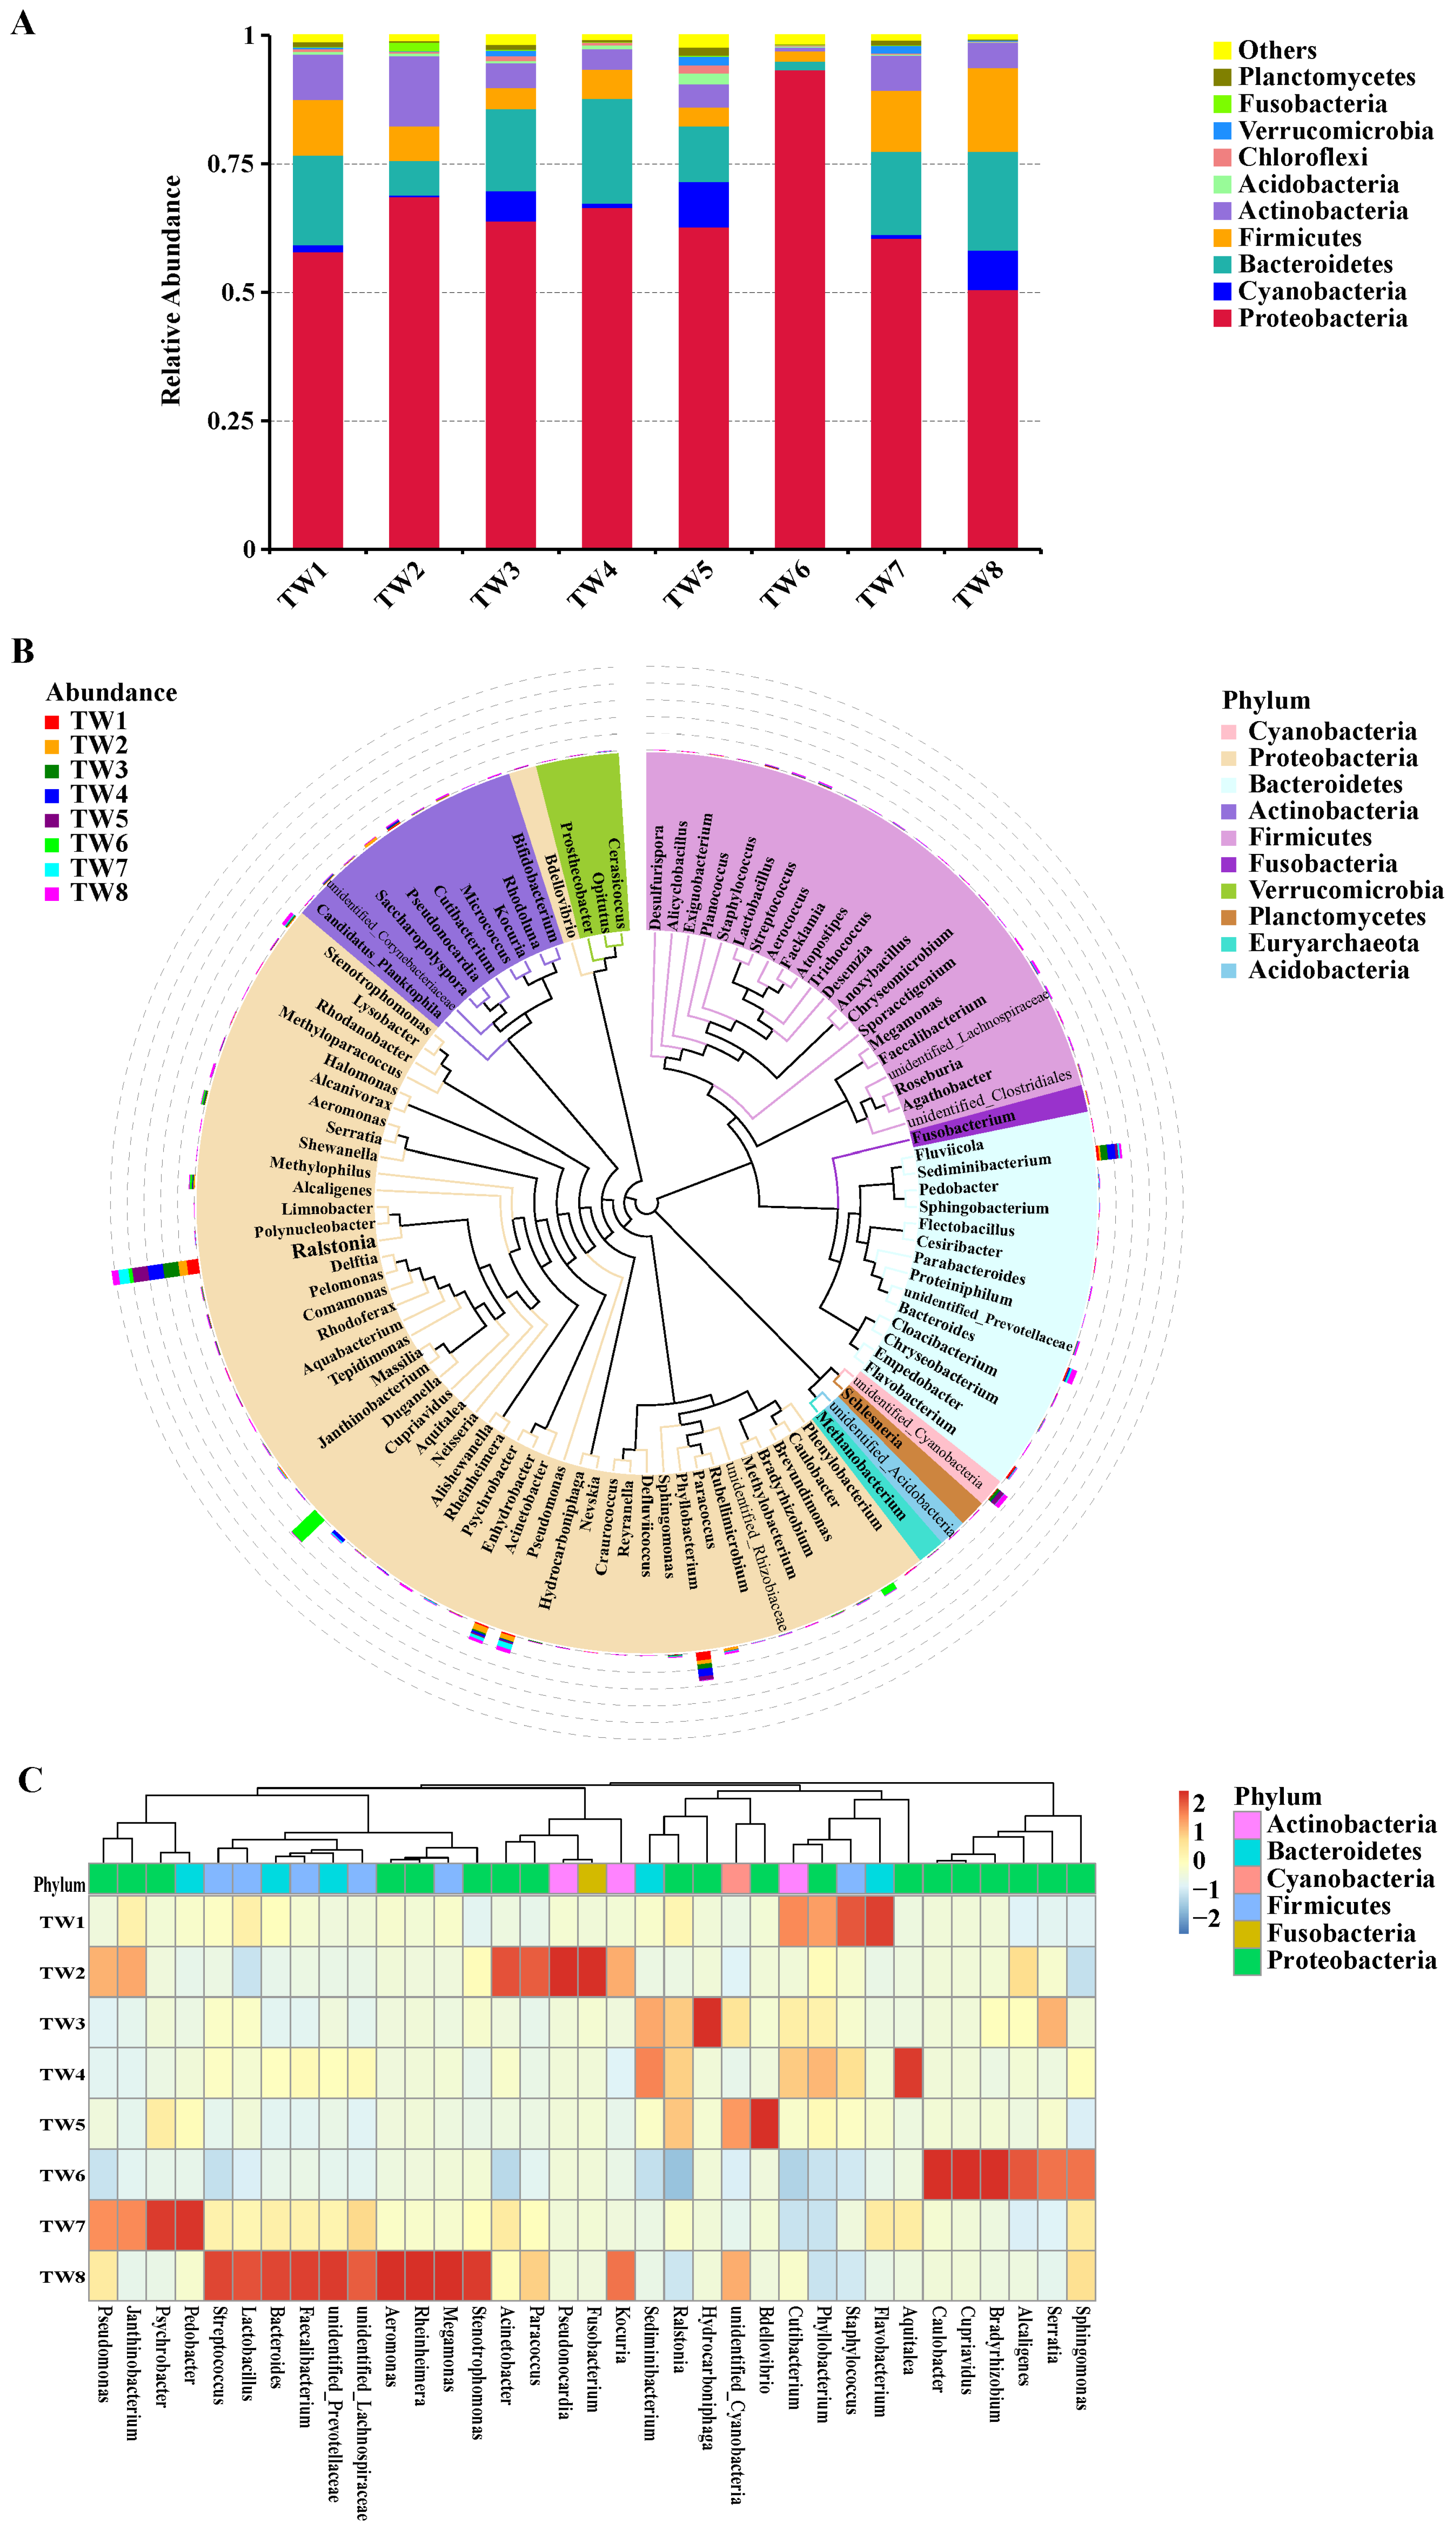
3.2. Composition and Structure of the Water Microbiota

Based on the OTU analysis and clustering, shared and unique OTUs were identified in different groups. Overall, 137 OTUs were shared in the TW1–TW8 samples, and the number of unique OTUs in each group was 399, 98, 246, 139, 900, 138, 217, and 143, respectively (Supplementary Materials Figure S1A). Based on the species annotation, the top ten most abundant bacteria at each classification level (phylum, class, order, family, and genus) were identified in each sample group, and a cumulative bar map of species relative abundance was generated to allow visual assessment of the relative bacterial abundance and their proportions at the different classification levels in each sample. The relative abundance at the phylum level is presented in a histogram (Figure 2A). The major abundant phyla were Proteobacteria, Cyanobacteria, Bacteroidetes, Firmicutes, Actinobacteria, Acidobacteria, Chloroflexi, Verrucomicrobia, Fusobacteria, and Planctomycetes. Among these, bacteria from Proteobacteria, Bacteroidetes, and Firmicutes were dominant at all taxonomic levels.
Based on the species annotation and abundance at the family level, the 35 most abundant families were identified and clustered at the species and sample levels to generate a heat map (Supplementary Materials Figure S1B). The top ten families in the samples were Burkholderiaceae, unidentified Cyanobacteria, Rhizobiaceae, Chromobacteriaceae, Chitinophagaceae, Pseudomonadaceae, Moraxellaceae, Caulobacteraceae, Xanthomonadaceae, and Pseudonocardiaceae, with different families being dominant in each group. Lactobacillaceae, Xanthomonadaceae, Streptococcaceae, Ruminococcaceae, Bacteroidaceae, Lachnospiraceae, Prevotellaceae, Alteromonadaceae, Aeromonadaceae, and Veillonellaceae were dominant in TW8, corresponding to Xinpu, which is the town with the highest proportion of centenarians. Fusobacteriaceae, Pseudonocardiaceae, Rhodobacteraceae, Micrococcaceae, Moraxellaceae, and Pseudomonadaceae were dominant in TW2, corresponding to Nanzhai, which is the town with the lowest proportion of centenarians.
Based on the species annotation and abundance at the genus level, the 35 most abundant genera were identified and clustered within the sample groups to generate a heat map (Figure 2C). The top ten genera in the samples were: unidentified Cyanobacteria, Cupriavidus, Ralstonia, Phyllobacterium, Aquitalea, Sediminibacterium, Pseudomonas, Acinetobacter, Caulobacter, and Stenotrophomonas. The dominant genera in TW8 were Lactobacillus, Streptococcus, Bacteroides, Faecalibacterium, Stenotrophomonas, Megamonas, Rheinheimera, Aeromonas, unidentified Lachnospiraceae, and unidentified Prevotellaceae. The dominant genera in TW2 were Fusobacterium, Pseudonocardia, Paracoccus, and Acinetobacter.
To further analyze the phylogenetic relationship of the species at the genus level, representative sequences of the top 100 genera were obtained using multiple sequence alignment. A phylogenetic tree is shown in Figure 2B. The analysis revealed that Ralstonia was the most abundant genus in different groups. For each classification result, the species representing the top ten genera with the highest relative abundance were selected for species-specific classification tree analysis (Supplementary Materials Figure S2). The analysis revealed that Stenotrophomonas sp., a dichloro-diphenyl-trichloroethane (DDT)-degrading bacterium, accounted for 1.518% of all species and 2.69% of the selected species. The percentages of S. acidaminiphila, S. koreensis, S. rhizophila, and S. sp PL35a2 S2 among the selected species were 0.01%, 0.29%, 0.67%, and 0.05%, respectively.

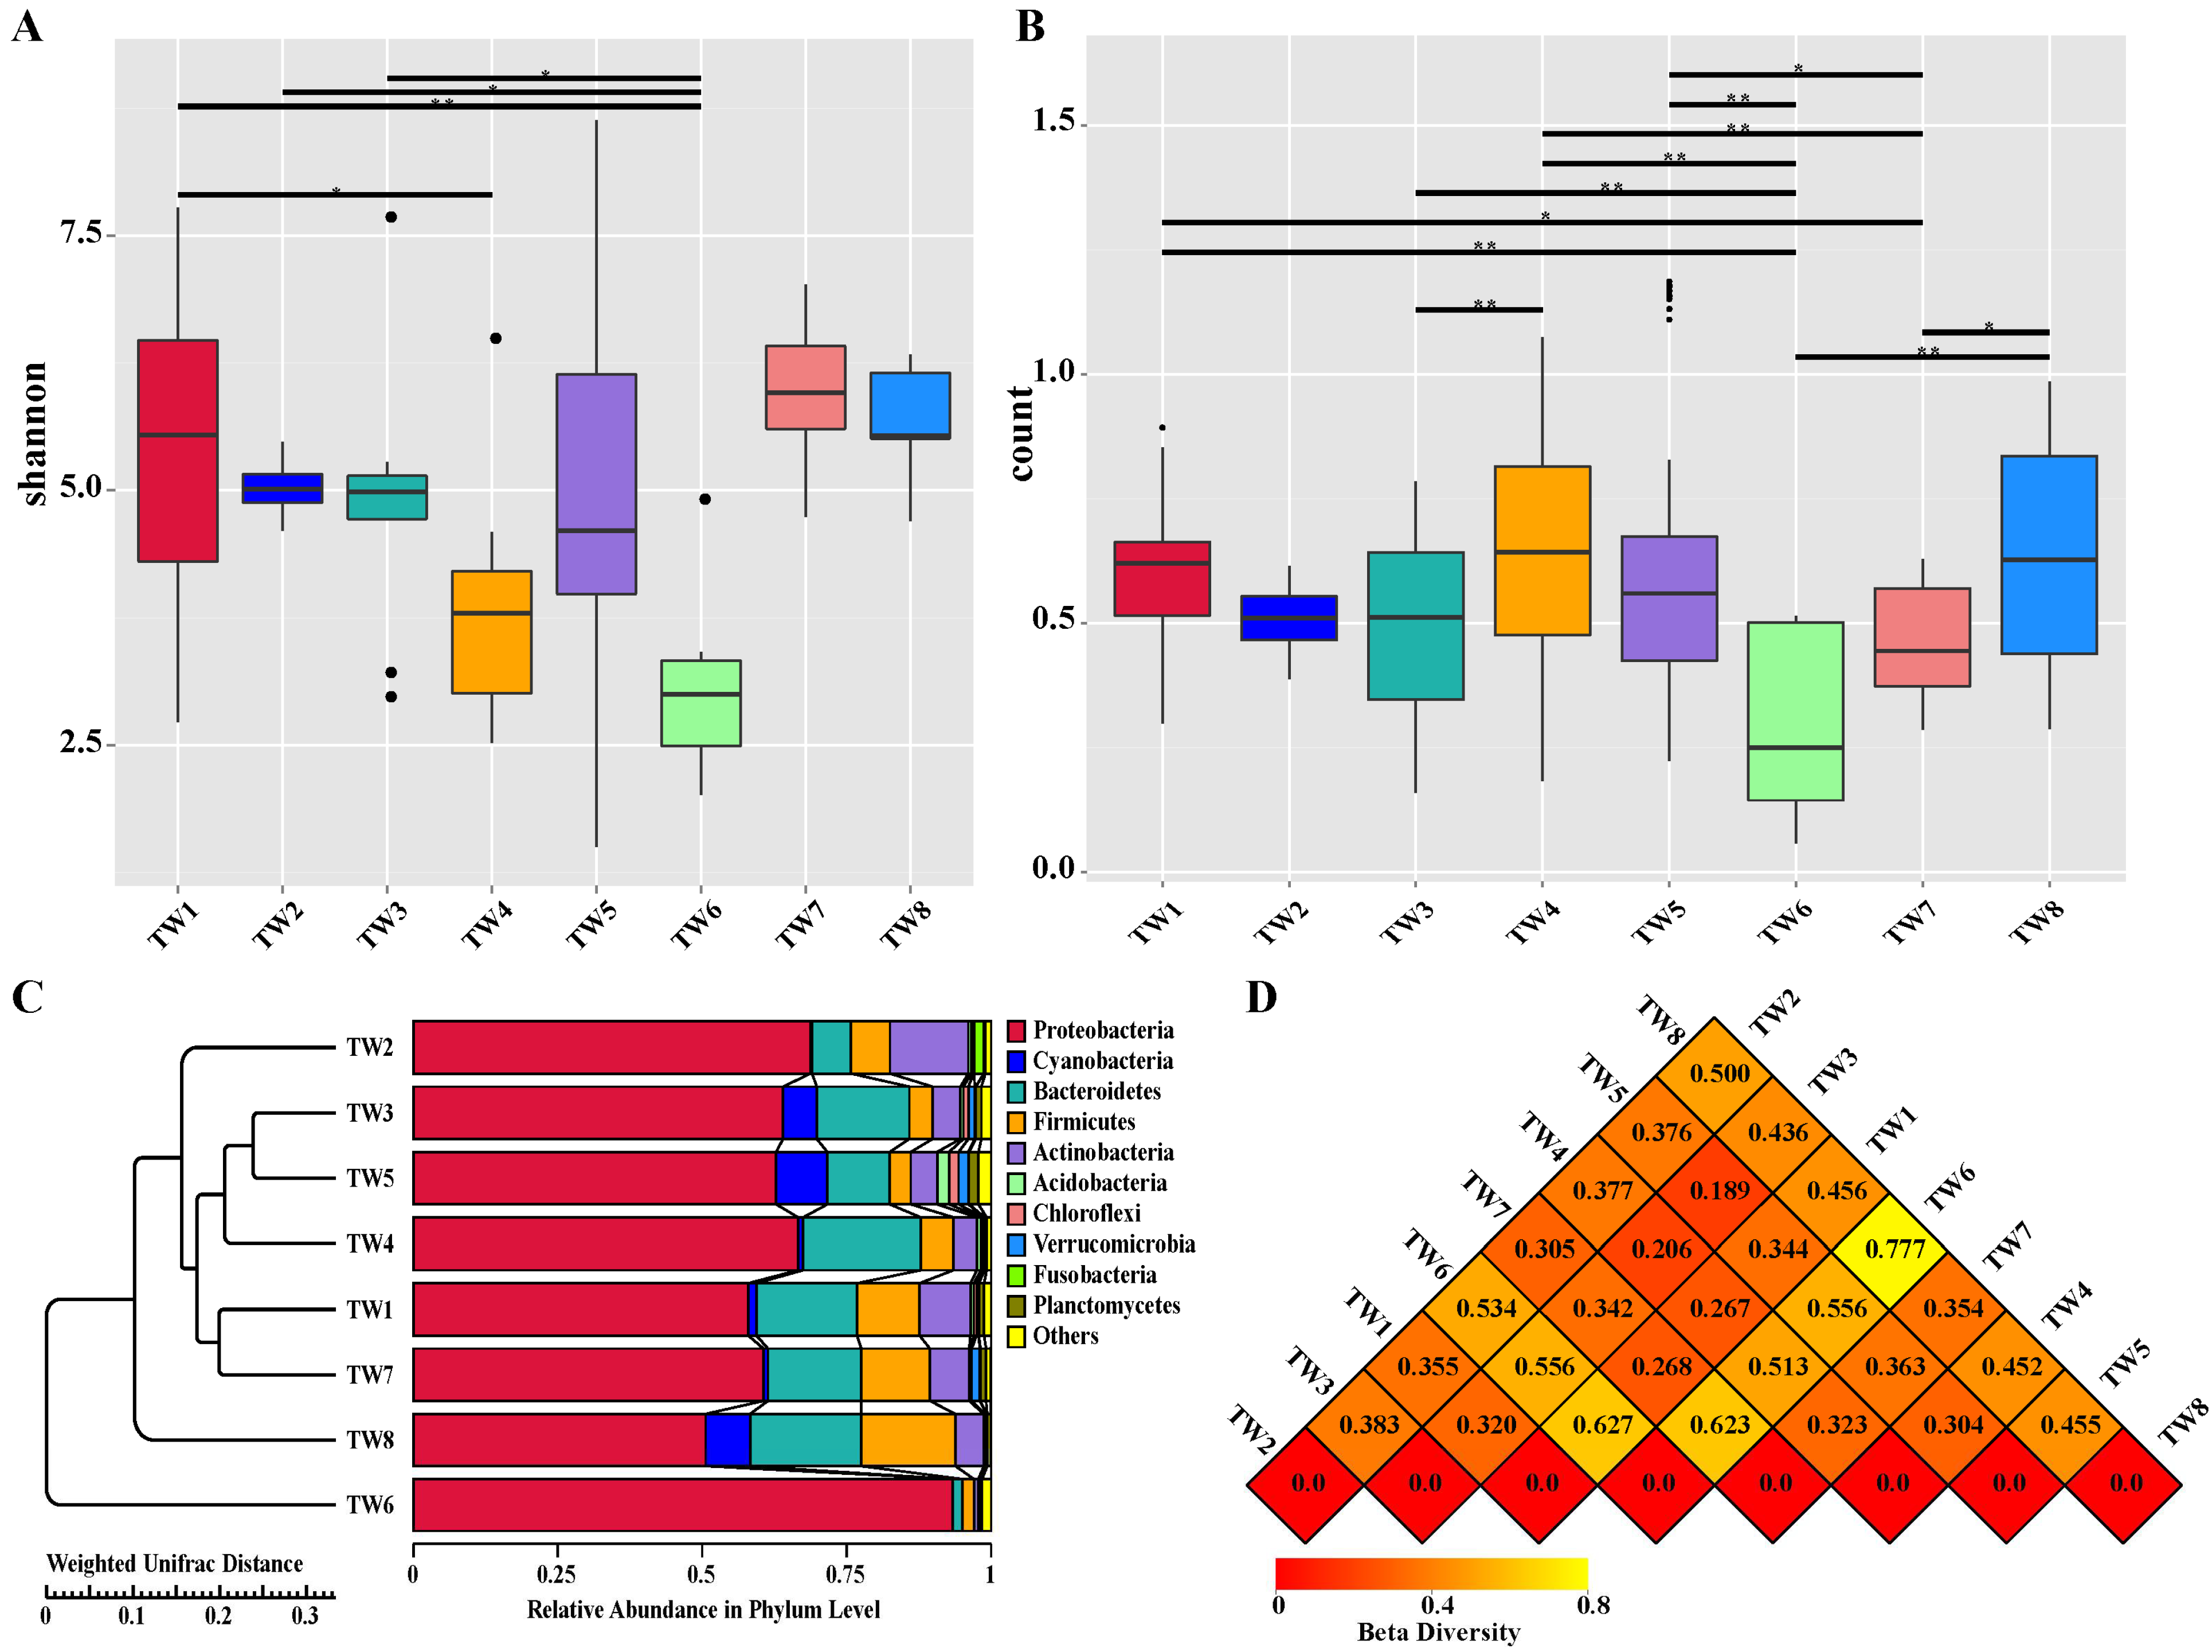
3.3. Alpha Diversity and Beta Diversity Analyses

Species diversity curves (dilution curves and hierarchical clustering curves) and species accumulation box plots were used to evaluate the differences in species richness and microbial community diversity between the sample groups. The rarefaction curve (Supplementary Materials Figure S3A) tended to be flat, indicating that the amount of sequencing data was sufficient for the analysis. Additional data would generate only a small number of new species (OTUs), and indirectly reflect the abundance of species in the sample. For the rank abundance curve (Supplementary Materials Figure S3B) in the horizontal dimension, the span of the curve gradually increased, indicating a higher richness of species; in the vertical dimension, the curve gradually flattened, indicating a more uniform species distribution. In the box plot of species accumulation (Supplementary Materials Figure S3C), the sample size increased and the box plot position tended to be flat. This meant that the species richness in the environment would not significantly increase with an increasing sample size, indicating that the sample size was sufficient for data analysis. The alpha diversity, assessed by the Shannon index, was significantly different between the TW6 group and the TW1, TW2, and TW3 groups (p < 0.05) (Figure 3A). The Wilcoxon rank-sum analysis revealed that the alpha diversity in the TW6 group was significantly lower than that in the other groups.
The beta diversity is a comparative analysis of the microbial community composition in different samples. The analysis based on the weighted Unifrac beta-Wilcoxon rank-sum test index (Figure 3B) revealed statistically significant differences between the TW6 group and the TW1, TW3, TW4, TW5, and TW8 groups (p < 0.05). Significant differences between the TW7 group and the TW1, TW4, TW5, and TW8 groups were also apparent (p < 0.05). To analyze the similarity between samples, the weighted Unifrac distance matrix was used for UPGMA cluster analysis, and the clustering results were integrated and displayed with the relative abundance of each sample at the phylum level (Figure 3C). The relatively small distance between the TW3 and TW5 groups, and the TW1 and TW7 groups, indicated a similar community structure. Therefore, samples with similar community structures tended to cluster together, while samples with very different communities were further apart. The TW6, TW8, and TW2 groups had the farthest distance and the largest community difference. The communities in each group exhibited certain inter-group differences, indicating the accuracy of grouping. The distance matrix heat map constructed based on the weighted Unifrac distance (Figure 3D) revealed a big difference between the TW2 and TW8 groups.

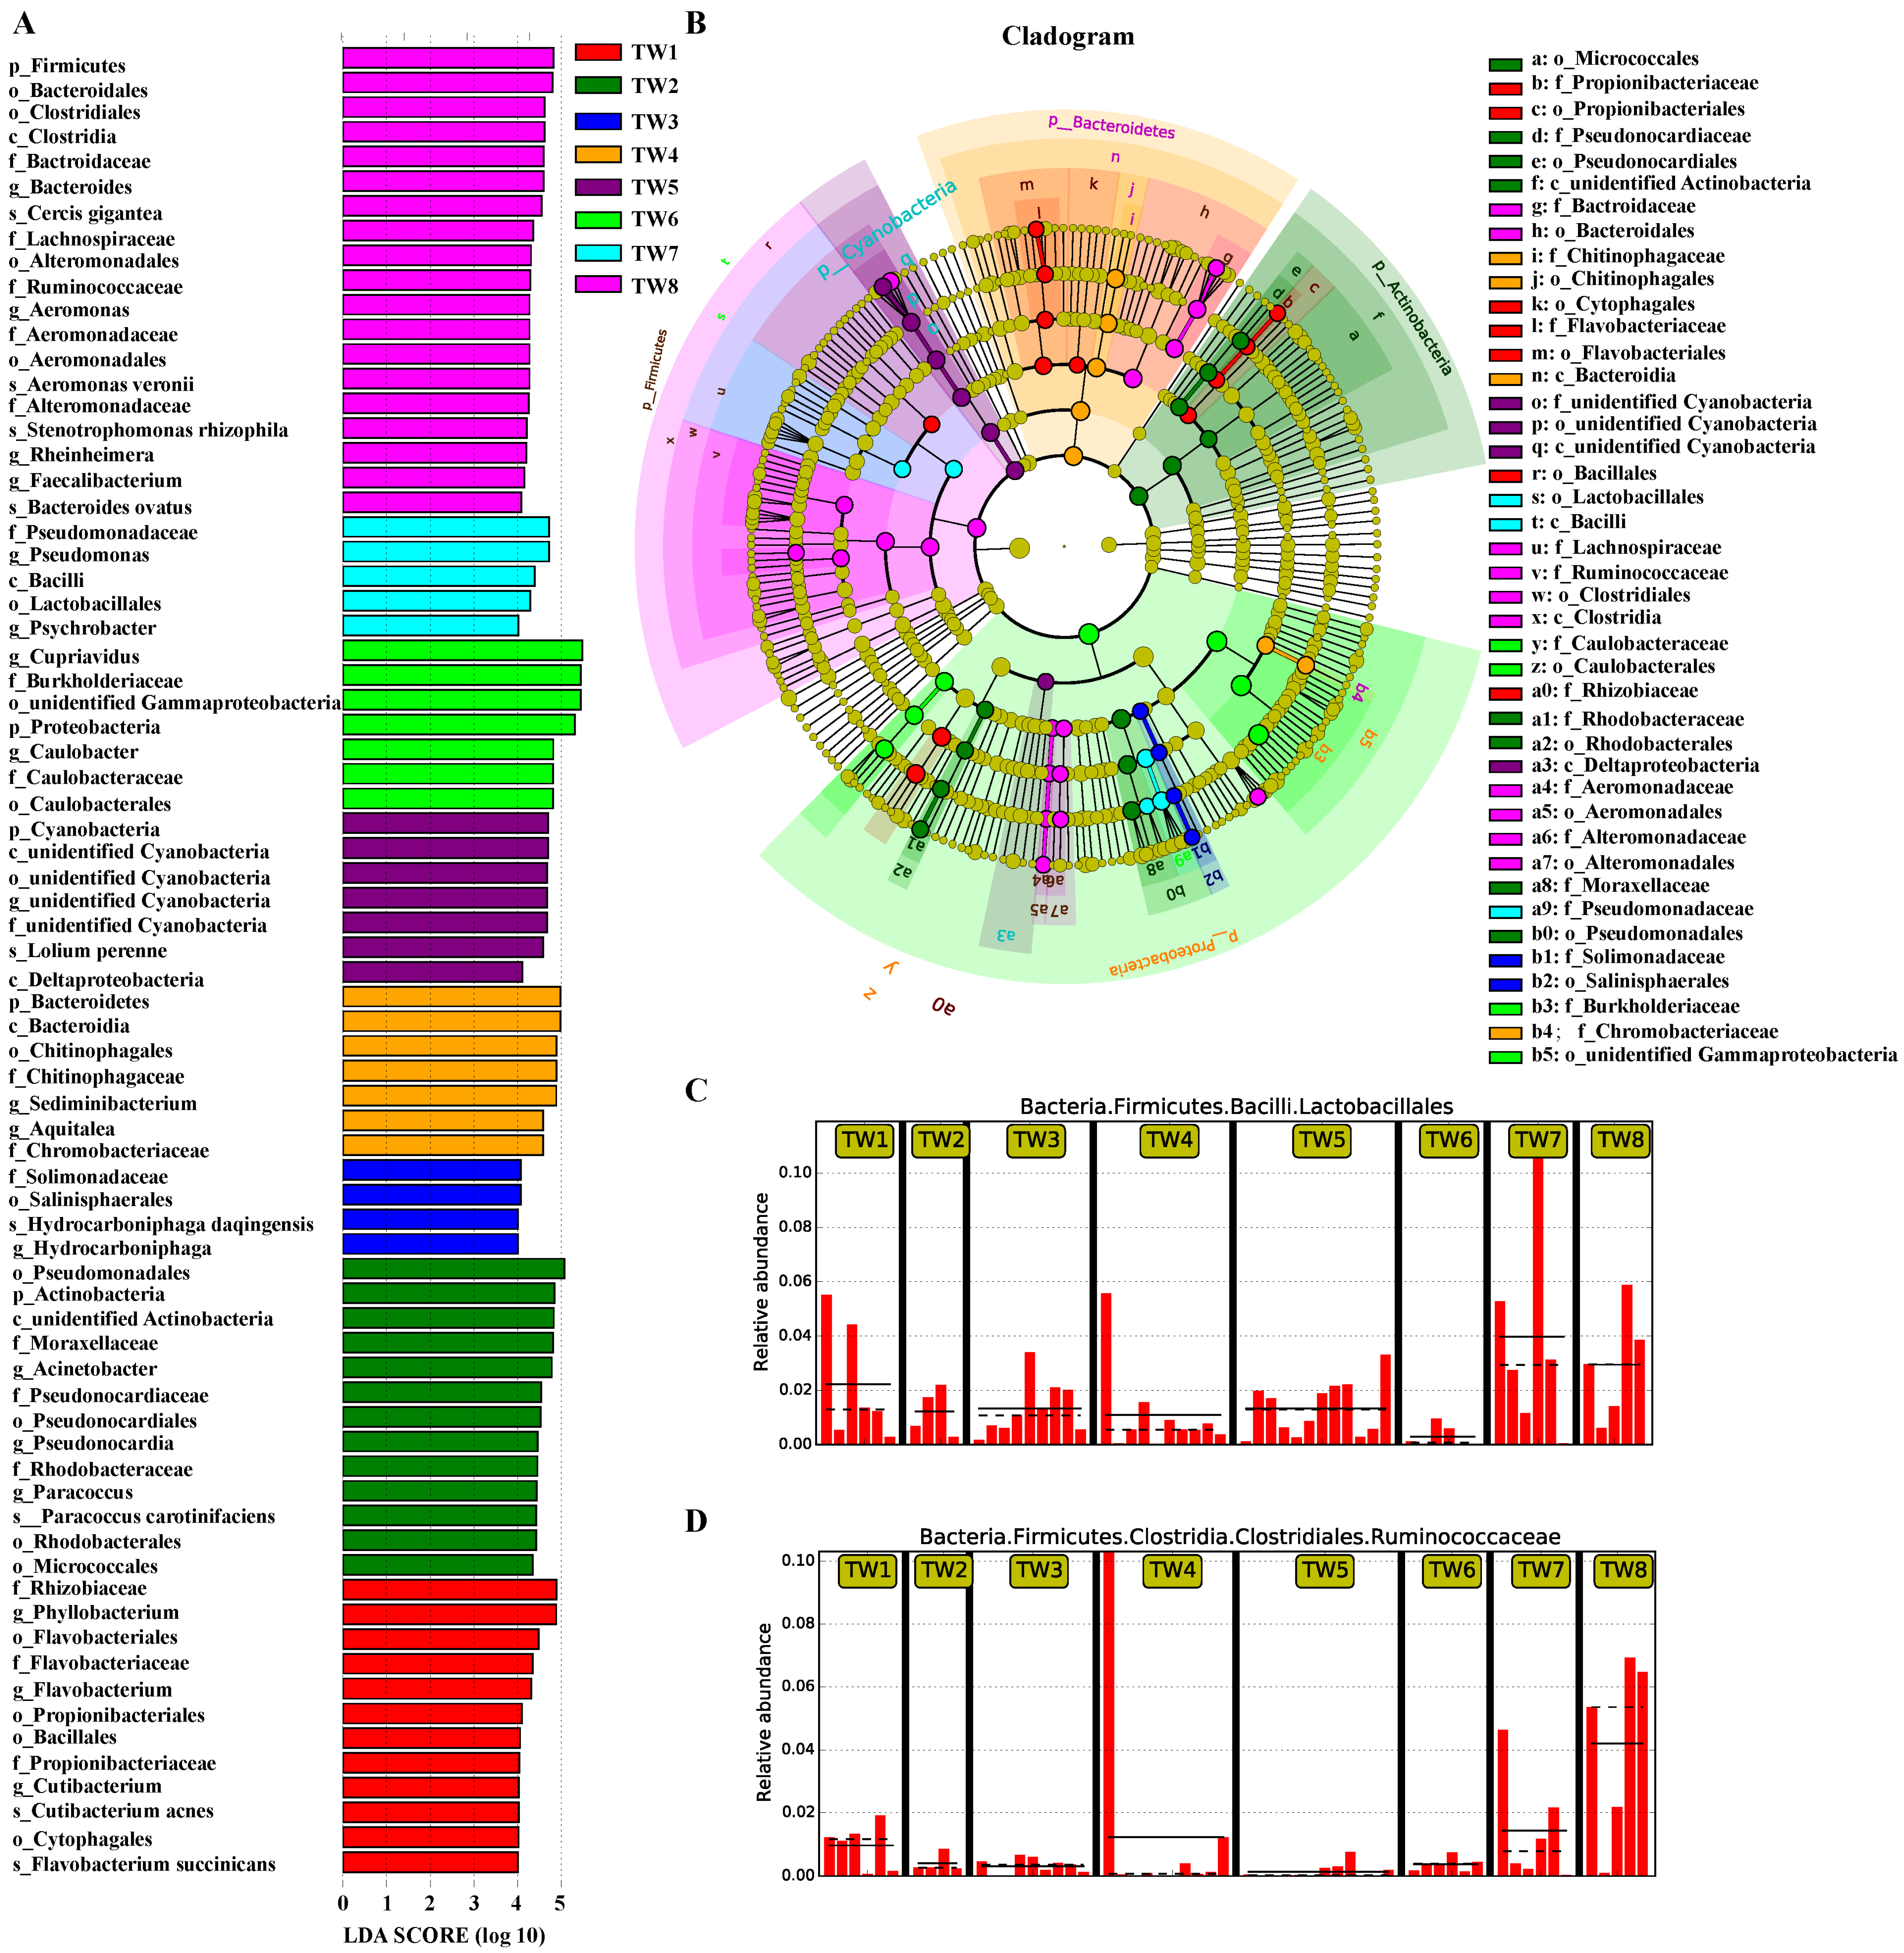
3.4. Significance Analysis of Species Differences between Groups

The alpha diversity index analysis of differences between groups is used to determine whether the overall community structure in different groups is significantly different. Then, the species responsible for this difference are identified using LEfSe and ternary plot analysis. The identified species constitutes a group biomarker. A histogram of the different species LDA value distribution by LEfSe analysis is shown in Figure 4A, and an evolutionary branch diagram of the different species is shown in Figure 4B. The former revealed biomarker genera with LDA scores greater than four, namely, Phyllobacterium, Flavobacterium, and Cutibacterium in TW1; Acinetobacter, Pseudonocardia, and Paracoccus in TW2; Hydrocarboniphaga in TW3; Sediminibacterium and Aquitalea in TW4; unidentified Cyanobacteria in TW5; Cupriavidus and Caulobacter in TW6; Pseudomonas, Lactobacillales (Figure 4C) and Psychrobacter in TW7; Bacteroides, Ruminococcaceae (Figure 4D), Aeromonas, Rheinheimera, and Faecalibacterium in TW8 (Figure 4).
Next, to identify differences in the dominant species in three groups of samples at each classification level (phylum, class, order, family, genus), the top ten species with the highest average abundance in the three groups of samples at the genus level were used to generate a ternary plot (ternary phase diagram) (Supplementary Materials Figure S4). The dominant genera were: Phyllobacterium in TW1; Acinetobacter and Pseudomonas in TW2; unidentified Cyanobacteria, Ralstonia, and Sediminibacterium in TW3; Aquitalea, Phyllobacterium, Ralstonia, and Sediminibacterium in TW4; unidentified Cyanobacteria and Ralstonia in TW5; Cupriavidus and Caulobacter in TW6; Pseudomonas in TW7; unidentified Cyanobacteria, Stenotrophomonas, and Pseudomonas in TW8. Overall, each group had different dominant genera.
To determine individual contributions to the above differences, a similarity percentage (Simper) analysis was performed. The analysis revealed the top ten genera and their abundances, showing their contribution to the difference between two groups (Supplementary Materials Figure S5). The top ten species contributing to the differences between two groups, with their abundance rankings from high to low, were: unidentified Cyanobacteria, Cupriavidus, Ralstonia, Phyllobacterium, Aquitalea, Sediminibacterium, Pseudomonas, Acinetobacter, Caulobacter, and Stenotrophomonas.

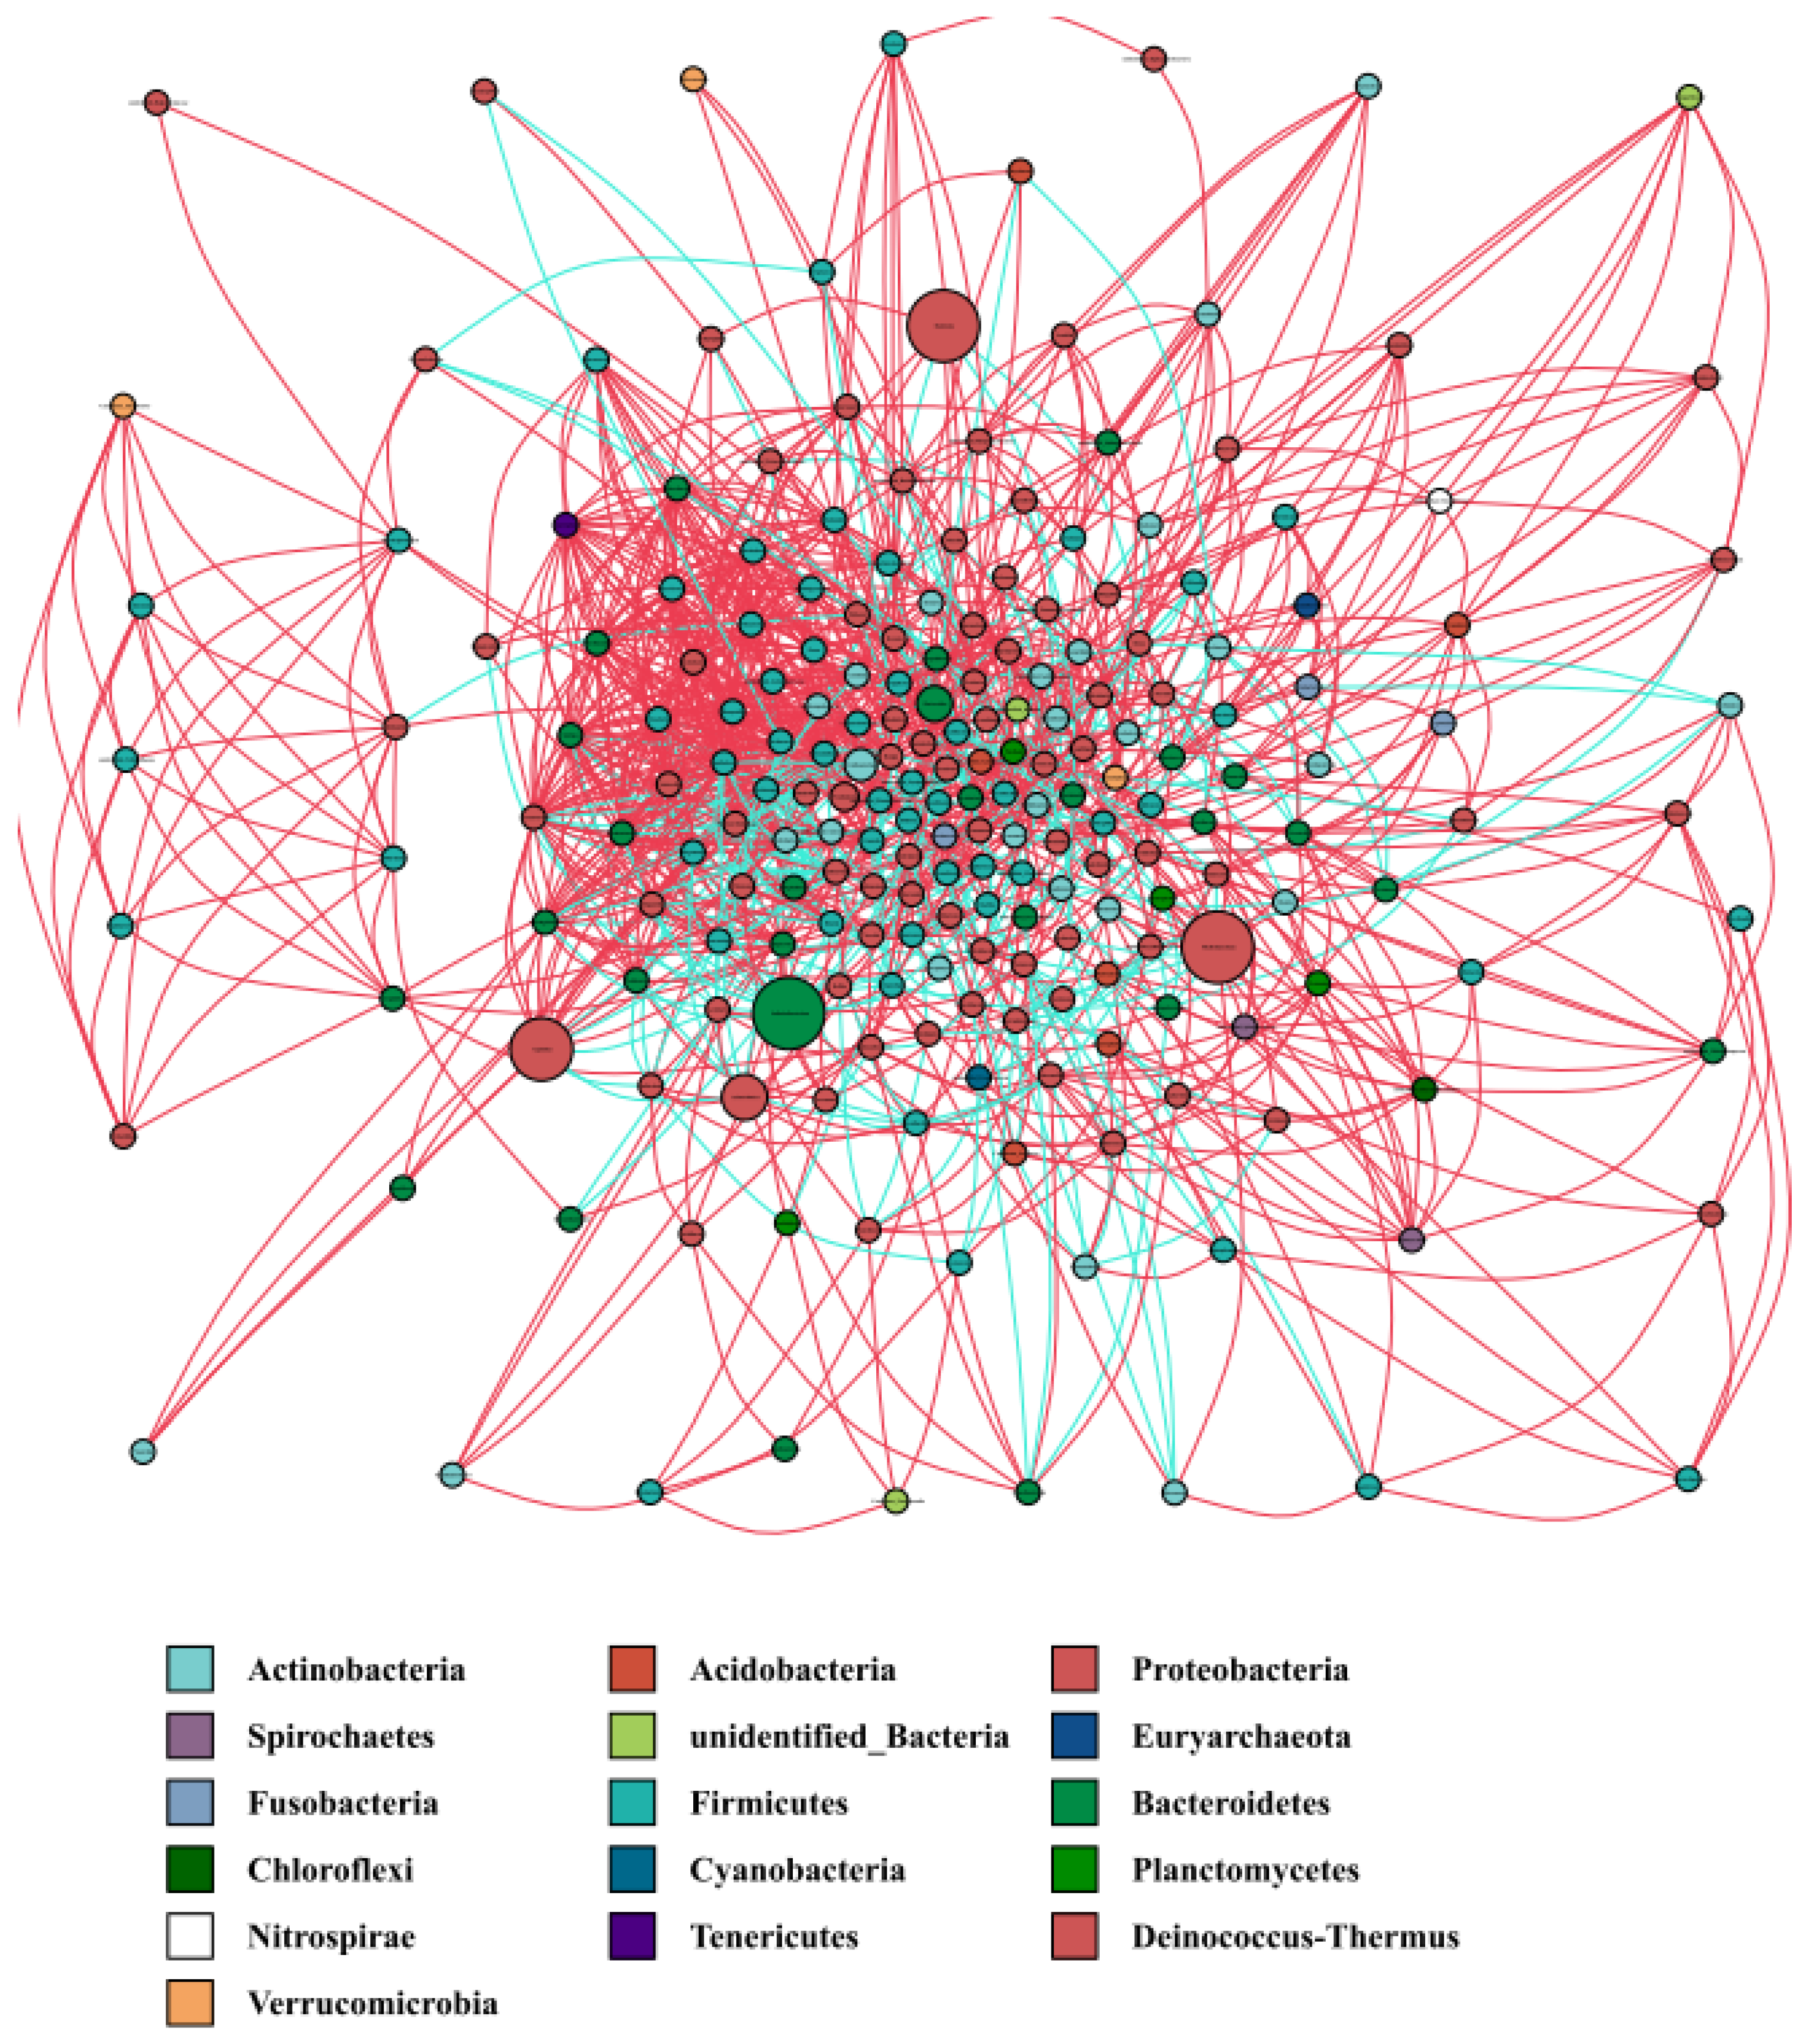
3.5. Co-Occurrence Network of the Water Microbiota

The species co-occurrence network diagram enables intuitive visualization of the impact of different environmental factors on microbial adaptability, as well as the dominant species and closely interacting populations of species that occupy a dominant position in a specific environment. These dominant species and populations often play a unique and important role in maintaining a stable structure and function of the environmental microbial community. Lactobacillus and Bifidobacterium are well-known probiotics. In the water microbiota co-occurrence network (Figure 5), the following bacteria were positively correlated with Lactobacillus: Subdoligranulum, Alloprevotella, Bacteroides, unidentified Prevotellaceae, Faecalibacterium, Qipengyuania, Brachybacterium, unidentified Erysipelotrichaceae, unidentified Acidimicrobiia, Novosphingobium, Dorea, Fusicatenibacter, Empedobacter, Mycobacterium, and Planococcus. In contrast, the following bacteria were negatively correlated with Lactobacillus: Tannerella, unidentified Gammaproteobacteria, Armatimonas, Nannocystis, and Blastopirellula. The following were positively correlated with Bifidobacterium: unidentified Ruminococcaceae, Lacibacter, Pseudomonas, Veillonella, and Prevotella. In contrast, the following were negatively correlated with Bifidobacterium: Corynebacterium, unidentified Rickettsiales, Serratia, unidentified Corynebacteriaceae, Bosea, Bdellovibrio, Brevibacterium, Alcanivorax, Ochrobactrum, and Methyloparacoccus. Hence, in addition to exerting a probiotic effect, Lactobacillus and Bifidobacterium could also exert a synergistic effect via positive and negative regulation of the strains mentioned above.

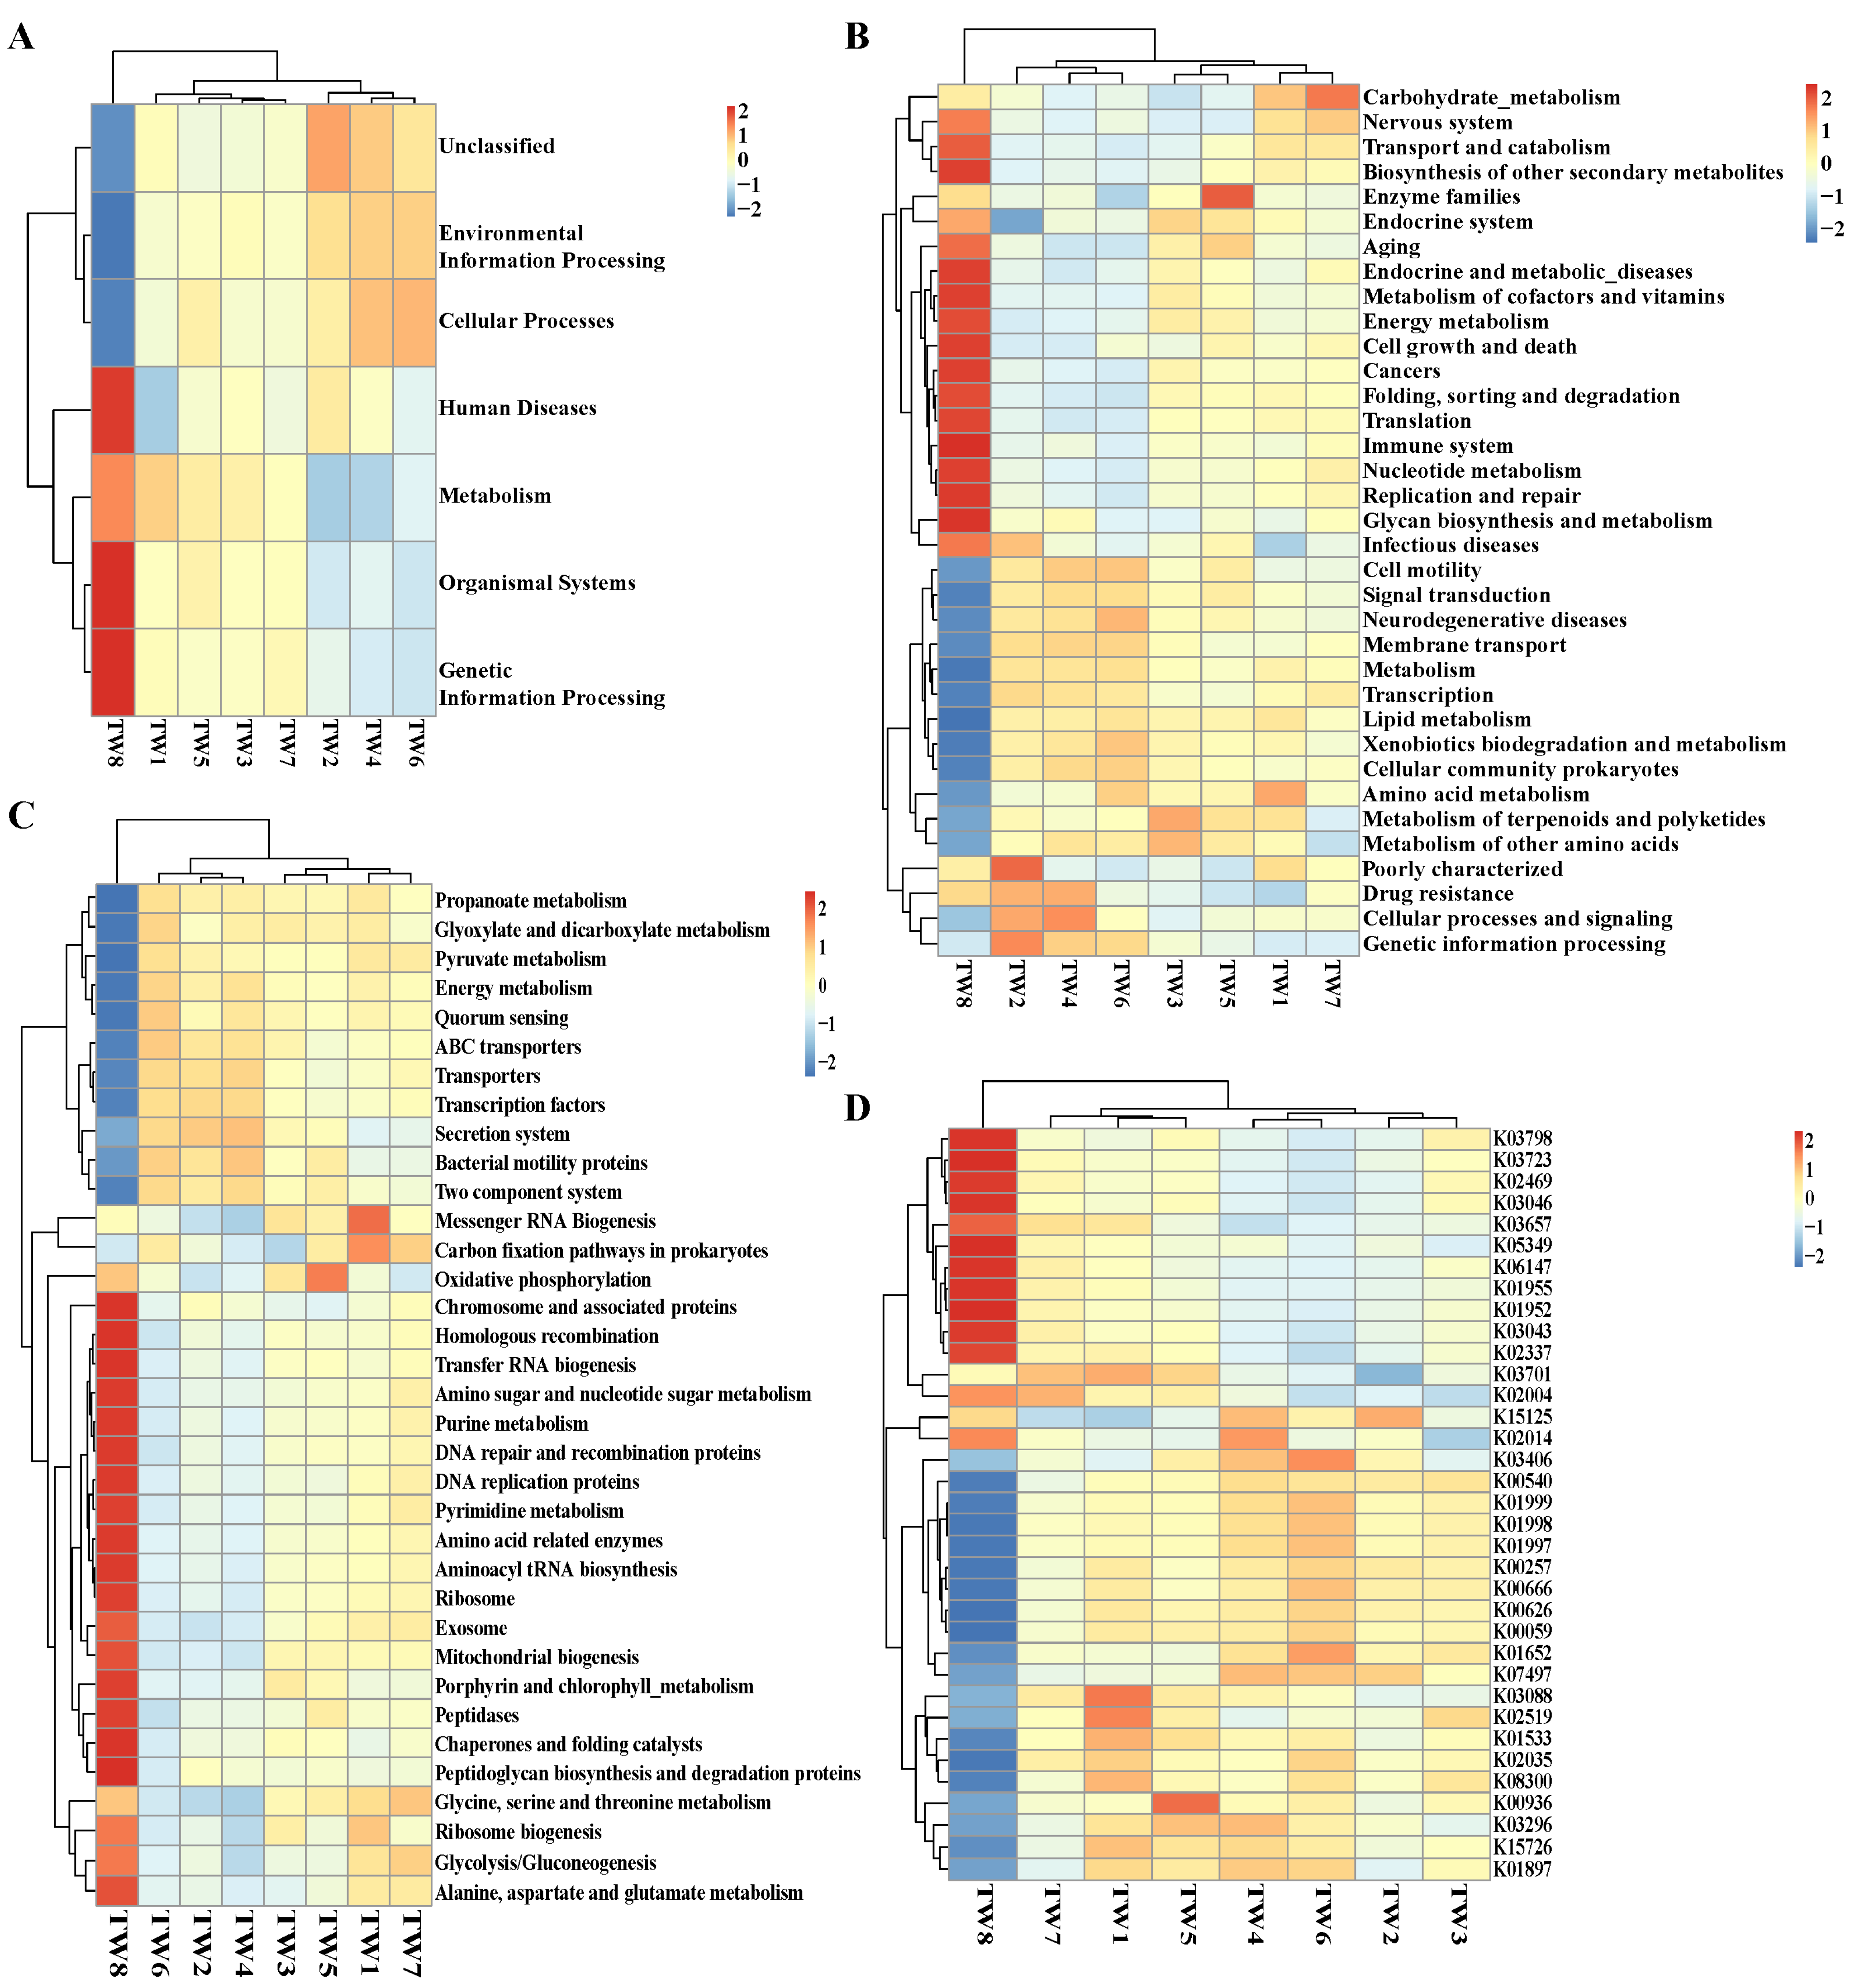
3.6. Predicted Functions of the Water Microbiota

Using the annotation data (Supplementary Materials Figure S6B), the top ten functional annotations for the most abundant bacteria at each annotation level were retrieved, and a histogram of relative functional abundance was generated to visualize the relatively most abundant features at different annotation levels (Supplementary Materials Figure S6A). The identified KEGG pathway annotations mainly focused on cellular processes, environmental information processing, genetic information processing, human diseases, metabolism, and organic systems. Among them, metabolism had the highest proportion, and organic systems had the lowest proportion. Based on the functional annotation and sample abundance information, the top 35 abundance features and their abundances in each sample were used to generate a heat map, and clustered at the level of functional differences. On the horizontal level 1 of the clustering heat map (Figure 6A), the TW8 group had the highest proportion of organic systems and genetic information processing. On the horizontal level 2 of the clustering heat map (Figure 6B), biosynthesis of other secondary metabolites, metabolism of cofactors and vitamins, immune system, and glycan biosynthesis and metabolism had a higher level of function in the TW8 group than in the others. On the horizontal level 3 of the clustering heat map (Figure 6C), the abundances of exosome, purine metabolism, glycolysis/gluconeogenesis, alanine, aspartate, and glutamate metabolism, amino acid-related enzymes, peptidases, amino sugar and nucleotide sugar metabolism, etc., were only relatively high in the TW8 group. The TW8 group also had unique features in the horizontal level k of the clustering heat map (Figure 6D). The abundances of K03798, K03723, K02469, K03046, K03657, K05349, K06147, K01955, K01952, K03043, and K02337 were higher in the TW8 group than in the other groups. Overall, the TW8 group showed unique functional characteristics at levels 1, 2, 3, and k.

4. Discussion

The prediction of local community compositions and functions [44] has improved the understanding of the soil microbial community under current and future changing climatic conditions [45], promoting research on water microbiota. In this study, we aimed to reveal the composition, diversity, and function of the water microbial community in the world’s longevity township of Jiaoling, China, and compare the microbiota composition between different towns. We have observed that Xinpu Town and Jiaocheng Town have the largest population over 80 years old. One of the reasons is that Jiaocheng Town is the seat of the county government of Jiaoling County. The urbanization rate is higher than that of other towns, so the population is relatively concentrated. Among them, Xinpu Town has the largest population over a hundred years old. According to our on-site investigation, we found that the environment in this area is closer to the natural environment, with high forest coverage, elegant landscapes and suitable climate. At the same time, as our research results show, we have also observed a high abundance of probiotic Lactobacillus in the water environment of Xinpu Town. We speculate that the reason for the longevity of centenarians may be related to their natural environment. Especially, there is a positive correlation with the abundance of probiotics in the water environment. Of course, these are only speculations based on our existing experimental results, and the probiotics need to be isolated for relevant verification tests in specific circumstances.
Based on the species annotation analysis, the dominant phyla in the samples were Proteobacteria, Cyanobacteria, Bacteroidetes, Firmicutes, Actinabacteria, and Acidobacteria. In terms of Proteobacteria, further analysis showed that it has different categories. Proteobacteria was divided into β-Proteobacteria and γ-Proteobacteria. β-Proteobacteria occupied a dominant position in freshwater and was considered a typical freshwater representative [46,47], while γ-Proteobacteria dominated in sediments. The significant increase in Proteobacteria is directly proportional to the total phosphorus and inorganic nitrogen content, that is, high abundance of Proteobacteria was associated with high nutrient availability [48,49]. Bacteroidetes was another major phylum. Many species in this phylum are related to the gut microbiota of humans [50] and animals [51]. Some species in this phylum have been proposed as indicators for detection of fecal contamination [52]. The relatively high abundance of Bacteroides may be due to untreated wastewater from residential areas. We have also observed that Flavobacteria belonging to Bacteroidetes are heterotrophic bacteria in freshwater [53,54], which play a key role in the carbon cycle (such as biodegradation) [55,56]. Another indicator affected by humans is Faecalibacterium belonging to Firmicutes [57]. However, the relatively high abundance of potential pathogenic bacteria Bacillales was not observed, further indicating that the water resources environment of longevity Township in Jiaoling is good. The dominant genera were Cyanobacteria. Cyanobacteria was a major planktonic bacterial species that can cause FHAB (freshwater harmful algal blooms) [58]. It is an important part of the freshwater ecosystem and plays an important role in nutrient metabolism and the energy cycle [59]. Interestingly, certain species were only dominant in specific areas, which may be closely related to the geographical environment [60,61,62]. This finding might emphasize the influence of the geographical conditions on the composition of the local microbial community.
The environmental microbiota is complex and diverse. This prompted us to question how they affect and are affected by other microorganisms in the local microbiota. Dominant species and populations often play a unique and important role in maintaining the stable structure and function of the microbial community in the environment [63]. Lactobacillus and Bifidobacterium are general probiotics that are widely distributed. For example, large numbers of Lactobacillus have been isolated from the environment (soil and water), food (fermented dairy products, fermented soy products, etc.) [64], and various organisms (human, animals, etc.) [65]. Their presence greatly affects human life and health. Probiotics are currently used to solve problems in various fields, including agriculture, aquaculture, the food processing industry, medical treatment, etc., and, recently, in cosmetics. Molecular methods, such as metagenomics (estimating microbial composition and genome capacity), metatranscriptomics (estimating gene expression), and metaproteomics (estimating protein synthesis), provide insights into the functional profile of the entire soil and water communities. The expression of most functional genes differs among different soil communities, and is driven by the interaction of the climate and soil conditions [66].
In terms of prediction of microbial community function, the high relative abundance of genes related to amino acid metabolism, carbohydrate metabolism, energy metabolism, and xenobiotics biodegradation and metabolism. These functions play an important role in nutrient metabolism and energy circulation. There are some correlations between the abundance of xenobiotic degradation and metabolism genes and the xenobiotic biodegradation and metabolism rate [67,68]. Biodegradation and metabolism genes could be used as indicators of the existence of xenobiotics and their metabolites. It has been reported that Pseudomonas can metabolize chemical pollutants in the environment, such as polycyclic aromatic hydrocarbons [69]. We observed a certain number of Pseudomonas in the water environment, which may indicate the accumulation of polycyclic aromatic hydrocarbons. Polycyclic aromatic hydrocarbons and their biodegradability have been found in many urban rivers [70,71]. Therefore, we must avoid the direct discharge of domestic wastewater into rivers, otherwise it will have a serious impact on human health and microbial ecology.

5. Conclusions

Our research showed that the spatial changes of the structure and composition of the water microbial community in the world’s longevity township of Jiaoling, China, were affected by regional variables. The composition of the bacterial community was mainly Proteobacteria, Cyanobacteria, Bacteroidetes, Firmicutes, Actinabacteria, and Acidobacteria. At the genus level, Cyanobacteria contributed the most to regional differences. We speculate that the reason for the longevity of centenarians may be related to their natural environment. Especially, there is a positive correlation with the abundance of probiotics in the water environment. Of course, these are only speculations based on our existing experimental results, and the probiotics need to be isolated for relevant verification tests in specific circumstances. These data provide a basis for understanding the significant differences in the composition and diversity of water microbial communities in Jiaoling, China. However, the role of these bacteria in health and longevity is unclear, and requires further investigation.

Supplementary Materials

The following are available online at https://www.mdpi.com/article/10.3390/d13080361/s1, Figure S1 Characteristics of water microbial species composition. (A) Distribution map of OTU of petals common and unique among different groups; (B) Clustering heat map of the composition abundance of the top 35 species of the microbiota among different groups at the family level. Figure S2 Species classification tree analysis (selected the top ten genera with the largest relative abundance). Figure S3 Alpha diversity and beta diversity. (A) The rarefaction curve; (B) Rank abundance curve; (C) Box plot of species accumulation. Figure S4 Differences in dominant species between the three groups of samples using a ternary plot (ternary phase diagram). (A-F) Differences in dominant species among the three groups of TW1-TW2-TW3, TW2-TW3-TW4, TW3-TW4-TW5, TW4-TW5-TW6, TW5-TW6-TW7, TW6-TW7-TW8 samples. (Selected top ten species with average abundance at the genus level among the three groups of samples). Figure S5 Simper analysis of contribution of species to differences between groups. (Simper is a decomposition of the Bray–Curtis difference index, used to quantify each species contribution to the difference between two groups. The top ten species and their abundances that contribute to the difference between the two groups). Figure S6 Functional predictive analysis. (A) Columnar stacked chart of functional relative abundance; (B) KEGG database annotation results.

Author Contributions

L.W.: Data curation, Conceptualization, Methodology, Formal analysis, Investigation, Writing-original draft, Writing-review and editing, Visualization. X.X.: Conceptualization, Methodology, Formal analysis, Investigation, Writing-review and editing. J.Z.: Conceptualization, Methodology, Resources, Writing-review and editing, Funding acquisition. Y.D.: Conceptualization, Methodology, Formal analysis, Writing-review and editing, Supervision, Validation. Q.W.: Conceptualization, Methodology, Resources, Writing-review and editing, Funding acquisition, Supervision, Validation. All authors have read and agreed to the published version of the manuscript.

Funding

This study was jointly supported by research grants from the Key-Area Research and Development Program of Guangdong Province (2018B020205002), the Guangdong Province Academy of Sciences Special Project for Capacity Building of Innovation Driven Development (2020GDASYL-20200301002) and Project by the Department of Science and Technology of Guangdong Province (2019QN01N107).

Institutional Review Board Statement

Not applicable.

Informed Consent Statement

Not applicable.

Data Availability Statement

The authors declare that all the data and the material used in this study are available within this article. All data generated or analysed during this study are available from the corresponding authors upon reasonable request.

Conflicts of Interest

The authors declare that they have no known competing financial interests or personal relationships that could have appeared to influence the work reported in this paper.

References

  1. Barak, Y.; Leitch, S.; Glue, P. The Great Escape. Centenarians’ exceptional health. Aging Clin. Exp. Res. 2020, 33, 513–520. [Google Scholar] [CrossRef] [PubMed]
  2. Balistreri, C.; Candore, G.; Accardi, G.; Buffa, S.; Bulati, M.; Martorana, A.; Colonna-Romano, G.; Lio, D.; Caruso, C. Centenarian offspring: A model for understanding longevity. Curr. Vasc. Pharmacol. 2013, 12, 718–725. [Google Scholar] [CrossRef] [PubMed]
  3. Costa, D.; Scognamiglio, M.; Fiorito, C.; Benincasa, G.; Napoli, C. Genetic background, epigenetic factors and dietary interventions which influence human longevity. Biogerontology 2019, 20, 605–626. [Google Scholar] [CrossRef] [PubMed]
  4. Gruber, J.; Kennedy, B.K. Microbiome and Longevity: Gut Microbes Send Signals to Host Mitochondria. Cell 2017, 169, 1168–1169. [Google Scholar] [CrossRef] [Green Version]
  5. Han, B.; Sivaramakrishnan, P.; Lin, C.-C.J.; Neve, I.A.; He, J.; Tay, L.W.R.; Sowa, J.N.; Sizovs, A.; Du, G.; Wang, J.; et al. Microbial Genetic Composition Tunes Host Longevity. Cell 2017, 169, 1249–1262.e13. [Google Scholar] [CrossRef] [Green Version]
  6. Caruso, C.; Aiello, A.; Accardi, G.; Ciaglia, E.; Cattaneo, M.; Puca, A. Genetic Signatures of Centenarians: Implications for Achieving Successful Aging. Curr. Pharm. Des. 2019, 25, 4133–4138. [Google Scholar] [CrossRef]
  7. Kenyon, C.J. The genetics of ageing. Nat. Cell Biol. 2010, 464, 504–512. [Google Scholar] [CrossRef]
  8. Melzer, D.; Pilling, L.C.; Ferrucci, L. The genetics of human ageing. Nat. Rev. Genet. 2019, 21, 88–101. [Google Scholar] [CrossRef]
  9. Joshi, P.K.; Pirastu, N.; Kentistou, K.A.; Fischer, K.; Hofer, E.; Schraut, K.E.; Clark, D.W.; Nutile, T.; Barnes, C.L.K.; Timmers, P.R.H.J.; et al. Genome-wide meta-analysis associates HLA-DQA1/DRB1 and LPA and lifestyle factors with human longevity. Nat. Commun. 2017, 8, 910. [Google Scholar] [CrossRef] [PubMed] [Green Version]
  10. Partridge, L.; Deelen, J.; Slagboom, P.E. Facing up to the global challenges of ageing. Nat. Cell Biol. 2018, 561, 45–56. [Google Scholar] [CrossRef] [PubMed]
  11. Bektas, A.; Schurman, S.; Sen, R.; Ferrucci, L. Aging, inflammation and the environment. Exp. Gerontol. 2018, 105, 10–18. [Google Scholar] [CrossRef] [PubMed]
  12. Pan, C.; Fan, Q.; Yang, J.; Deng, D. Health Inequality Among the Elderly in Rural China and Influencing Factors: Evidence from the Chinese Longitudinal Healthy Longevity Survey. Int. J. Environ. Res. Public Health 2019, 16, 4018. [Google Scholar] [CrossRef] [Green Version]
  13. Cheung, G.; Clair, V.W.-S.; Chacko, E.; Barak, Y. Financial difficulty and biopsychosocial predictors of loneliness: A cross-sectional study of community dwelling older adults. Arch. Gerontol. Geriatr. 2019, 85, 103935. [Google Scholar] [CrossRef]
  14. Leitch, S.; Glue, P.; Gray, A.; Greco, P.; Barak, Y. Comparison of Psychosocial Variables Associated With Loneliness in Centenarian vs. Elderly Populations in New Zealand. JAMA Netw. Open 2018, 1, e183880. [Google Scholar] [CrossRef]
  15. Freeman, S.; Armstrong, J.J.; Tyas, S.L.; Neufeld, E. Clinical characteristics and patterns of health deficits of centenarians receiving home care and long-term care services. Exp. Gerontol. 2017, 99, 46–52. [Google Scholar] [CrossRef]
  16. Jopp, D.S.; Park, M.-K.S.; Lehrfeld, J.; Paggi, M.E. Physical, cognitive, social and mental health in near-centenarians and centenarians living in New York City: Findings from the Fordham Centenarian Study. BMC Geriatr. 2016, 16, 1–10. [Google Scholar] [CrossRef] [Green Version]
  17. Lv, J.; Wang, W.; Krafft, T.; Li, Y.; Zhang, F.; Yuan, F. Effects of Several Environmental Factors on Longevity and Health of the Human Population of Zhongxiang, Hubei, China. Biol. Trace Element Res. 2010, 143, 702–716. [Google Scholar] [CrossRef]
  18. Tedone, E.; Arosio, B.; Gussago, C.; Casati, M.; Ferri, E.; Ogliari, G.; Ronchetti, F.; Porta, A.; Massariello, F.; Nicolini, P.; et al. Leukocyte telomere length and prevalence of age-related diseases in semisupercentenarians, centenarians and centenarians’ offspring. Exp. Gerontol. 2014, 58, 90–95. [Google Scholar] [CrossRef]
  19. Terry, D.F.; Wilcox, M.; McCormick, M.A.; Lawler, E.; Perls, T. Cardiovascular Advantages Among the Offspring of Centenarians. J. Gerontol. Ser. A Boil. Sci. Med. Sci. 2003, 58, M425–M431. [Google Scholar] [CrossRef] [PubMed] [Green Version]
  20. Bucci, L.; Ostan, R.; Cevenini, E.; Pini, E.; Scurti, M.; Vitale, G.; Mari, D.; Caruso, C.; Sansoni, P.; Fanelli, F.; et al. Centenarians’ offspring as a model of healthy aging: A reappraisal of the data on Italian subjects and a comprehensive overview. Aging 2016, 8, 510–519. [Google Scholar] [CrossRef] [PubMed] [Green Version]
  21. Li, S.; Nguyen, T.; Wong, E.M.; Dugué, P.-A.; Dite, G.S.; Armstrong, N.J.; Craig, J.M.; Mather, K.A.; Sachdev, P.S.; Saffery, R.; et al. Genetic and environmental causes of variation in epigenetic aging across the lifespan. Clin. Epigenetics 2020, 12, 158. [Google Scholar] [CrossRef]
  22. Vaupel, J.W. Biodemography of human ageing. Nat. Cell Biol. 2010, 464, 536–542. [Google Scholar] [CrossRef] [PubMed] [Green Version]
  23. Buettner, D.; Skemp, S. Blue Zones. Am. J. Lifestyle Med. 2016, 10, 318–321. [Google Scholar] [CrossRef] [PubMed]
  24. Yu, J.; Zhou, J.; Long, A.; He, X.; Deng, X.; Chen, Y. A Comparative Study of Water Quality and Human Health Risk Assessment in Longevity Area and Adjacent Non-Longevity Area. Int. J. Environ. Res. Public Health 2019, 16, 3737. [Google Scholar] [CrossRef] [Green Version]
  25. Fastame, M.C.; Hitchcott, P.K.; Mulas, I.; Ruiu, M.; Penna, M.P. Resilience in Elders of the Sardinian Blue Zone: An Explorative Study. Behav. Sci. 2018, 8, 30. [Google Scholar] [CrossRef] [Green Version]
  26. Longo, V.D.; Antebi, A.; Bartke, A.; Barzilai, N.; Brown-Borg, H.M.; Caruso, C.; Curiel, T.J.; de Cabo, R.; Franceschi, C.; Gems, D.; et al. Interventions to Slow Aging in Humans: Are We Ready? Aging Cell 2015, 14, 497–510. [Google Scholar] [CrossRef]
  27. Kim, S.; Jazwinski, S.M. The Gut Microbiota and Healthy Aging: A Mini-Review. Gerontology 2018, 64, 513–520. [Google Scholar] [CrossRef] [PubMed]
  28. Candela, M.; Biagi, E.; Maccaferri, S.; Turroni, S.; Brigidi, P. Intestinal microbiota is a plastic factor responding to environmental changes. Trends Microbiol. 2012, 20, 385–391. [Google Scholar] [CrossRef]
  29. Ticinesi, A.; Tana, C.; Nouvenne, A. The intestinal microbiome and its relevance for functionality in older persons. Curr. Opin. Clin. Nutr. Metab. Care 2019, 22, 4–12. [Google Scholar] [CrossRef]
  30. Loo, B.P.Y.; Lam, W.W.Y.; Mahendran, R.; Katagiri, K. How Is the Neighborhood Environment Related to the Health of Seniors Living in Hong Kong, Singapore, and Tokyo? Some Insights for Promoting Aging in Place. Ann. Am. Assoc. Geogr. 2017, 107, 812–828. [Google Scholar] [CrossRef]
  31. Lv, J.; Wang, W.; Li, Y. Effects of environmental factors on the longevous people in China. Arch. Gerontol. Geriatr. 2011, 53, 200–205. [Google Scholar] [CrossRef] [PubMed]
  32. Deng, Q.; Wei, Y.; Zhao, Y.; Han, X.; Yin, J. Understanding the Natural and Socioeconomic Factors behind Regional Longevity in Guangxi, China: Is the Centenarian Ratio a Good Enough Indicator for Assessing the Longevity Phenomenon? Int. J. Environ. Res. Public Health 2018, 15, 938. [Google Scholar] [CrossRef] [PubMed] [Green Version]
  33. Liu, Y.; Li, Y.; Jiang, Y.; Li, H.; Wang, W.; Yang, L. Effects of Soil Trace Elements on Longevity Population in China. Biol. Trace Element Res. 2013, 153, 119–126. [Google Scholar] [CrossRef]
  34. Huang, Y.; Rosenberg, M.; Hou, L.; Hu, M. Relationships among Environment, Climate, and Longevity in China. Int. J. Environ. Res. Public Health 2017, 14, 1195. [Google Scholar] [CrossRef] [Green Version]
  35. Favorito, J.E.; Grossl, P.R.; Davis, T.Z.; Eick, M.J.; Hankes, N. Soil-plant-animal relationships and geochemistry of selenium in the Western Phosphate Resource Area (United States): A review. Chemosphere 2021, 266, 128959. [Google Scholar] [CrossRef]
  36. van Bruggen, A.H.; Goss, E.M.; Havelaar, A.; van Diepeningen, A.D.; Finckh, M.; Morris, J.G. One Health-Cycling of diverse microbial communities as a connecting force for soil, plant, animal, human and ecosystem health. Sci. Total Environ. 2019, 664, 927–937. [Google Scholar] [CrossRef]
  37. Aßhauer, K.P.; Wemheuer, B.; Daniel, R.; Meinicke, P. Tax4Fun: Predicting functional profiles from metagenomic 16S rRNA. Bioinformatics 2015, 31, 2882–2884. [Google Scholar] [CrossRef] [PubMed]
  38. Rognes, T.; Flouri, T.; Nichols, B.; Quince, C.; Mahé, F. VSEARCH: A versatile open source tool for metagenomics. Peer J. 2016, 4, e2584. [Google Scholar] [CrossRef]
  39. Martin, M. Cutadapt removes adapter sequences from high-throughput sequencing reads. EMBnet. J. 2011, 17, 10–12. [Google Scholar] [CrossRef]
  40. Haas, B.J.; Gevers, D.; Earl, A.; Feldgarden, M.; Ward, D.V.; Giannoukos, G.; Ciulla, D.; Tabbaa, D.; Highlander, S.K.; Sodergren, E.; et al. Chimeric 16S rRNA sequence formation and detection in Sanger and 454-pyrosequenced PCR amplicons. Genome Res. 2011, 21, 494–504. [Google Scholar] [CrossRef] [Green Version]
  41. Wang, Q.; Garrity, G.M.; Tiedje, J.M.; Cole, J.R. Naive Bayesian Classifier for Rapid Assignment of rRNA Sequences into the New Bacterial Taxonomy. Appl. Environ. Microbiol. 2007, 73, 5261–5267. [Google Scholar] [CrossRef] [Green Version]
  42. Edgar, R.C. UPARSE: Highly accurate OTU sequences from microbial amplicon reads. Nat. Methods 2013, 10, 996–998. [Google Scholar] [CrossRef]
  43. Quast, C.; Pruesse, E.; Yilmaz, P.; Gerken, J.; Schweer, T.; Yarza, P.; Peplies, J.; Glöckner, F.O. The SILVA ribosomal RNA gene database project: Improved data processing and web-based tools. Nucleic Acids Res. 2012, 41, D590–D596. [Google Scholar] [CrossRef] [PubMed]
  44. Fierer, N.; Jackson, R.B. The diversity and biogeography of soil bacterial communities. Proc. Natl. Acad. Sci. USA 2006, 103, 626–631. [Google Scholar] [CrossRef] [Green Version]
  45. Bahram, M.; Hildebrand, F.; Forslund, S.K.; Anderson, J.L.; Soudzilovskaia, N.A.; van Bodegom, P.; Bengtsson-Palme, J.; Anslan, S.; Coelho, L.P.; Harend, H.; et al. Structure and function of the global topsoil microbiome. Nat. Cell Biol. 2018, 560, 233–237. [Google Scholar] [CrossRef] [PubMed]
  46. Hu, M.; Wang, X.; Wen, X.; Xia, Y. Microbial community structures in different wastewater treatment plants as revealed by 454-pyrosequencing analysis. Bioresour. Technol. 2012, 117, 72–79. [Google Scholar] [CrossRef]
  47. Liu, Z.; Huang, S.; Sun, G.; Xu, Z.; Xu, M. Phylogenetic diversity, composition and distribution of bacterioplankton community in the Dongjiang River, China. FEMS Microbiol. Ecol. 2012, 80, 30–44. [Google Scholar] [CrossRef] [Green Version]
  48. Fierer, N.; Bradford, M.; Jackson, R.B. Toward An Ecological Classification Of Soil Bacteria. Ecology 2007, 88, 1354–1364. [Google Scholar] [CrossRef]
  49. Zoppini, A.; Amalfitano, S.; Fazi, S.; Puddu, A. Dynamics of a benthic microbial community in a riverine environment subject to hydrological fluctuations (Mulargia River, Italy). Hydrobiology 2010, 657, 37–51. [Google Scholar] [CrossRef]
  50. Candela, M.; Consolandi, C.; Severgnini, M.; Biagi, E.; Castiglioni, B.; Vitali, B.; De Bellis, G.; Brigidi, P. High taxonomic level fingerprint of the human intestinal microbiota by Ligase Detection Reaction-Universal Array approach. BMC Microbiol. 2010, 10, 116. [Google Scholar] [CrossRef] [Green Version]
  51. Shanks, O.C.; Kelty, C.A.; Archibeque, S.; Jenkins, M.; Newton, R.J.; McLellan, S.; Huse, S.M.; Sogin, M.L. Community Structures of Fecal Bacteria in Cattle from Different Animal Feeding Operations. Appl. Environ. Microbiol. 2011, 77, 2992–3001. [Google Scholar] [CrossRef] [Green Version]
  52. Wéry, N.; Lhoutellier, C.; Ducray, F.; Delgenès, J.-P.; Godon, J.-J. Behaviour of pathogenic and indicator bacteria during urban wastewater treatment and sludge composting, as revealed by quantitative PCR. Water Res. 2008, 42, 53–62. [Google Scholar] [CrossRef] [PubMed]
  53. García-Armisen, T.; Inceoğlu, Ö.; Ouattara, N.K.; Anzil, A.; Verbanck, M.A.; Brion, N.; Servais, P. Seasonal Variations and Resilience of Bacterial Communities in a Sewage Polluted Urban River. PLoS ONE 2014, 9, e92579. [Google Scholar] [CrossRef] [PubMed]
  54. Michaud, L.; Caruso, C.; Mangano, S.; Interdonato, F.; Bruni, V.; Giudice, A.L. Predominance ofFlavobacterium, Pseudomonas, andPolaromonaswithin the prokaryotic community of freshwater shallow lakes in the northern Victoria Land, East Antarctica. FEMS Microbiol. Ecol. 2012, 82, 391–404. [Google Scholar] [CrossRef] [PubMed] [Green Version]
  55. Teeling, H.; Fuchs, B.M.; Becher, D.; Klockow, C.; Gardebrecht, A.; Bennke, C.M.; Kassabgy, M.; Huang, S.; Mann, A.J.; Waldmann, J.; et al. Substrate-Controlled Succession of Marine Bacterioplankton Populations Induced by a Phytoplankton Bloom. Science 2012, 336, 608–611. [Google Scholar] [CrossRef]
  56. Williams, T.J.; Wilkins, D.; Long, E.; Evans, F.; DeMaere, M.; Raftery, M.J.; Cavicchioli, R. The role of planktonicFlavobacteriain processing algal organic matter in coastal East Antarctica revealed using metagenomics and metaproteomics. Environ. Microbiol. 2012, 15, 1302–1317. [Google Scholar] [CrossRef] [PubMed]
  57. Zheng, G.; Yampara-Iquise, H.; Jones, J.E.; Carson, C.A. Development ofFaecalibacterium16S rRNA gene marker for identification of human faeces. J. Appl. Microbiol. 2009, 106, 634–641. [Google Scholar] [CrossRef]
  58. Paerl, H.W.; Gardner, W.S.; Havens, K.E.; Joyner, A.R.; McCarthy, M.J.; Newell, S.; Qin, B.; Scott, J.T. Mitigating cyanobacterial harmful algal blooms in aquatic ecosystems impacted by climate change and anthropogenic nutrients. Harmful Algae 2016, 54, 213–222. [Google Scholar] [CrossRef] [Green Version]
  59. Ni, J.; Yu, Y.; Feng, W.; Yan, Q.; Pan, G.; Yang, B.; Zhang, X.; Li, X. Impacts of algal blooms removal by chitosan-modified soils on zooplankton community in Taihu Lake, China. J. Environ. Sci. 2010, 22, 1500–1507. [Google Scholar] [CrossRef]
  60. Chen, X.; He, D.; Zhou, L.; Cao, Y.; Li, Z. Influence of hydropower stations on the water microbiota in the downstream of Jinsha River, China. Peer J. 2020, 8, e9500. [Google Scholar] [CrossRef]
  61. El Najjar, P.; Pfaffl, M.; Ouaini, N.; Nour, A.A.; El Azzi, D. Water and sediment microbiota diversity in response to temporal variation at the outlet of the Ibrahim River (Lebanon). Environ. Monit. Assess. 2020, 192, 201. [Google Scholar] [CrossRef]
  62. Zeglin, L.H. Stream microbial diversity in response to environmental changes: Review and synthesis of existing research. Front. Microbiol. 2015, 6, 454. [Google Scholar] [CrossRef] [PubMed] [Green Version]
  63. Ma, B.; Wang, H.; Dsouza, M.; Lou, J.; He, Y.; Dai, Z.; Brookes, P.C.; Xu, J.; Gilbert, J.A. Geographic patterns of co-occurrence network topological features for soil microbiota at continental scale in eastern China. ISME J. 2016, 10, 1891–1901. [Google Scholar] [CrossRef]
  64. Cavaillon, J.-M.; Legout, S. Centenary of the death of Elie Metchnikoff: A visionary and an outstanding team leader. Microbes Infect. 2016, 18, 577–594. [Google Scholar] [CrossRef] [Green Version]
  65. Biagi, E.; Franceschi, C.; Rampelli, S.; Severgnini, M.; Ostan, R.; Turroni, S.; Consolandi, C.; Quercia, S.; Scurti, M.; Monti, D.; et al. Gut Microbiota and Extreme Longevity. Curr. Biol. 2016, 26, 1480–1485. [Google Scholar] [CrossRef] [PubMed] [Green Version]
  66. Noronha, M.F.; Júnior, G.L.; Gilbert, J.A.; de Oliveira, V.M. Taxonomic and functional patterns across soil microbial communities of global biomes. Sci. Total Environ. 2017, 609, 1064–1074. [Google Scholar] [CrossRef] [PubMed]
  67. Kansole, M.M.R.; Lin, T.-F. Microcystin-LR Biodegradation by Bacillus sp.: Reaction Rates and Possible Genes Involved in the Degradation. Water 2016, 8, 508. [Google Scholar] [CrossRef] [Green Version]
  68. Pagé, A.P.; Yergeau, E.; Greer, C.W. Salix purpurea Stimulates the Expression of Specific Bacterial Xenobiotic Degradation Genes in a Soil Contaminated with Hydrocarbons. PLoS ONE 2015, 10, e0132062. [Google Scholar] [CrossRef] [Green Version]
  69. O’Mahony, M.M.; Dobson, A.; Barnes, J.D.; Singleton, I. The use of ozone in the remediation of polycyclic aromatic hydrocarbon contaminated soil. Chemosphere 2006, 63, 307–314. [Google Scholar] [CrossRef]
  70. Qian, X.; Liang, B.; Liu, X.; Liu, X.; Wang, J.; Liu, F.; Cui, B. Distribution, sources, and ecological risk assessment of polycyclic aromatic hydrocarbons in surface sediments from the Haihe River, a typical polluted urban river in Northern China. Environ. Sci. Pollut. Res. 2017, 24, 17153–17165. [Google Scholar] [CrossRef] [PubMed]
  71. Muangchinda, C.; Yamazoe, A.; Polrit, D.; Thoetkiattikul, H.; Mhuantong, W.; Champreda, V.; Pinyakong, O. Biodegradation of high concentrations of mixed polycyclic aromatic hydrocarbons by indigenous bacteria from a river sediment: A microcosm study and bacterial community analysis. Environ. Sci. Pollut. Res. 2016, 24, 4591–4602. [Google Scholar] [CrossRef]
Figure 1. Distribution map of the population over 80 years old in one of world’s longevity townships; Jiaoling, China.
Diversity 13 00361 g001
Figure 2. Composition and structure of water microbiota. (A) Columnar cumulative graph of the relative abundance of the top ten species of microbiota among the different groups at the phylum level; (B) The phylogenetic relationship of species at the genus level; (C) Cluster heat map of the composition abundance of the top 35 species of microbiota among different groups at the genus level.
Diversity 13 00361 g002
Figure 3. Alpha diversity and beta diversity. (A) Analysis of alpha diversity based on the Wilcoxon rank sum test of Shannon index; (B) Box plot of differences between beta diversity groups based on unweighted unifrac beta-Wilcox index; (C) Beta diversity analysis of UPGMA cluster tree based on unweighted unifrac distance; (D) Heat map of distance matrix drawn with weighted unifrac distance. (The smaller the coefficient value, the smaller the difference in diversity between two samples.) * (p < 0.05) and ** (p < 0.01).
Diversity 13 00361 g003
Figure 4. Significance analysis of species differences between groups. (A) Histogram of LDA value distribution of species with significant differences in abundance between groups; (B) Evolutionary clade of species with significant differences in abundance between groups; (C,D) Species with significant differences in abundance between groups-Lactobacillales and Ruminococcaceae.
Diversity 13 00361 g004
Figure 5. Co-occurrence network of water microbiota.
Diversity 13 00361 g005
Figure 6. Predicted functions. (AD) Clustering heat map of functional differences at level 1, level 2, level 3, and level k.
Diversity 13 00361 g006
Publisher’s Note: MDPI stays neutral with regard to jurisdictional claims in published maps and institutional affiliations.

