
Ecosystem Services Assessment, Trade-Off, and Bundles in the Yellow River Basin, China

Abstract
:1. Introduction
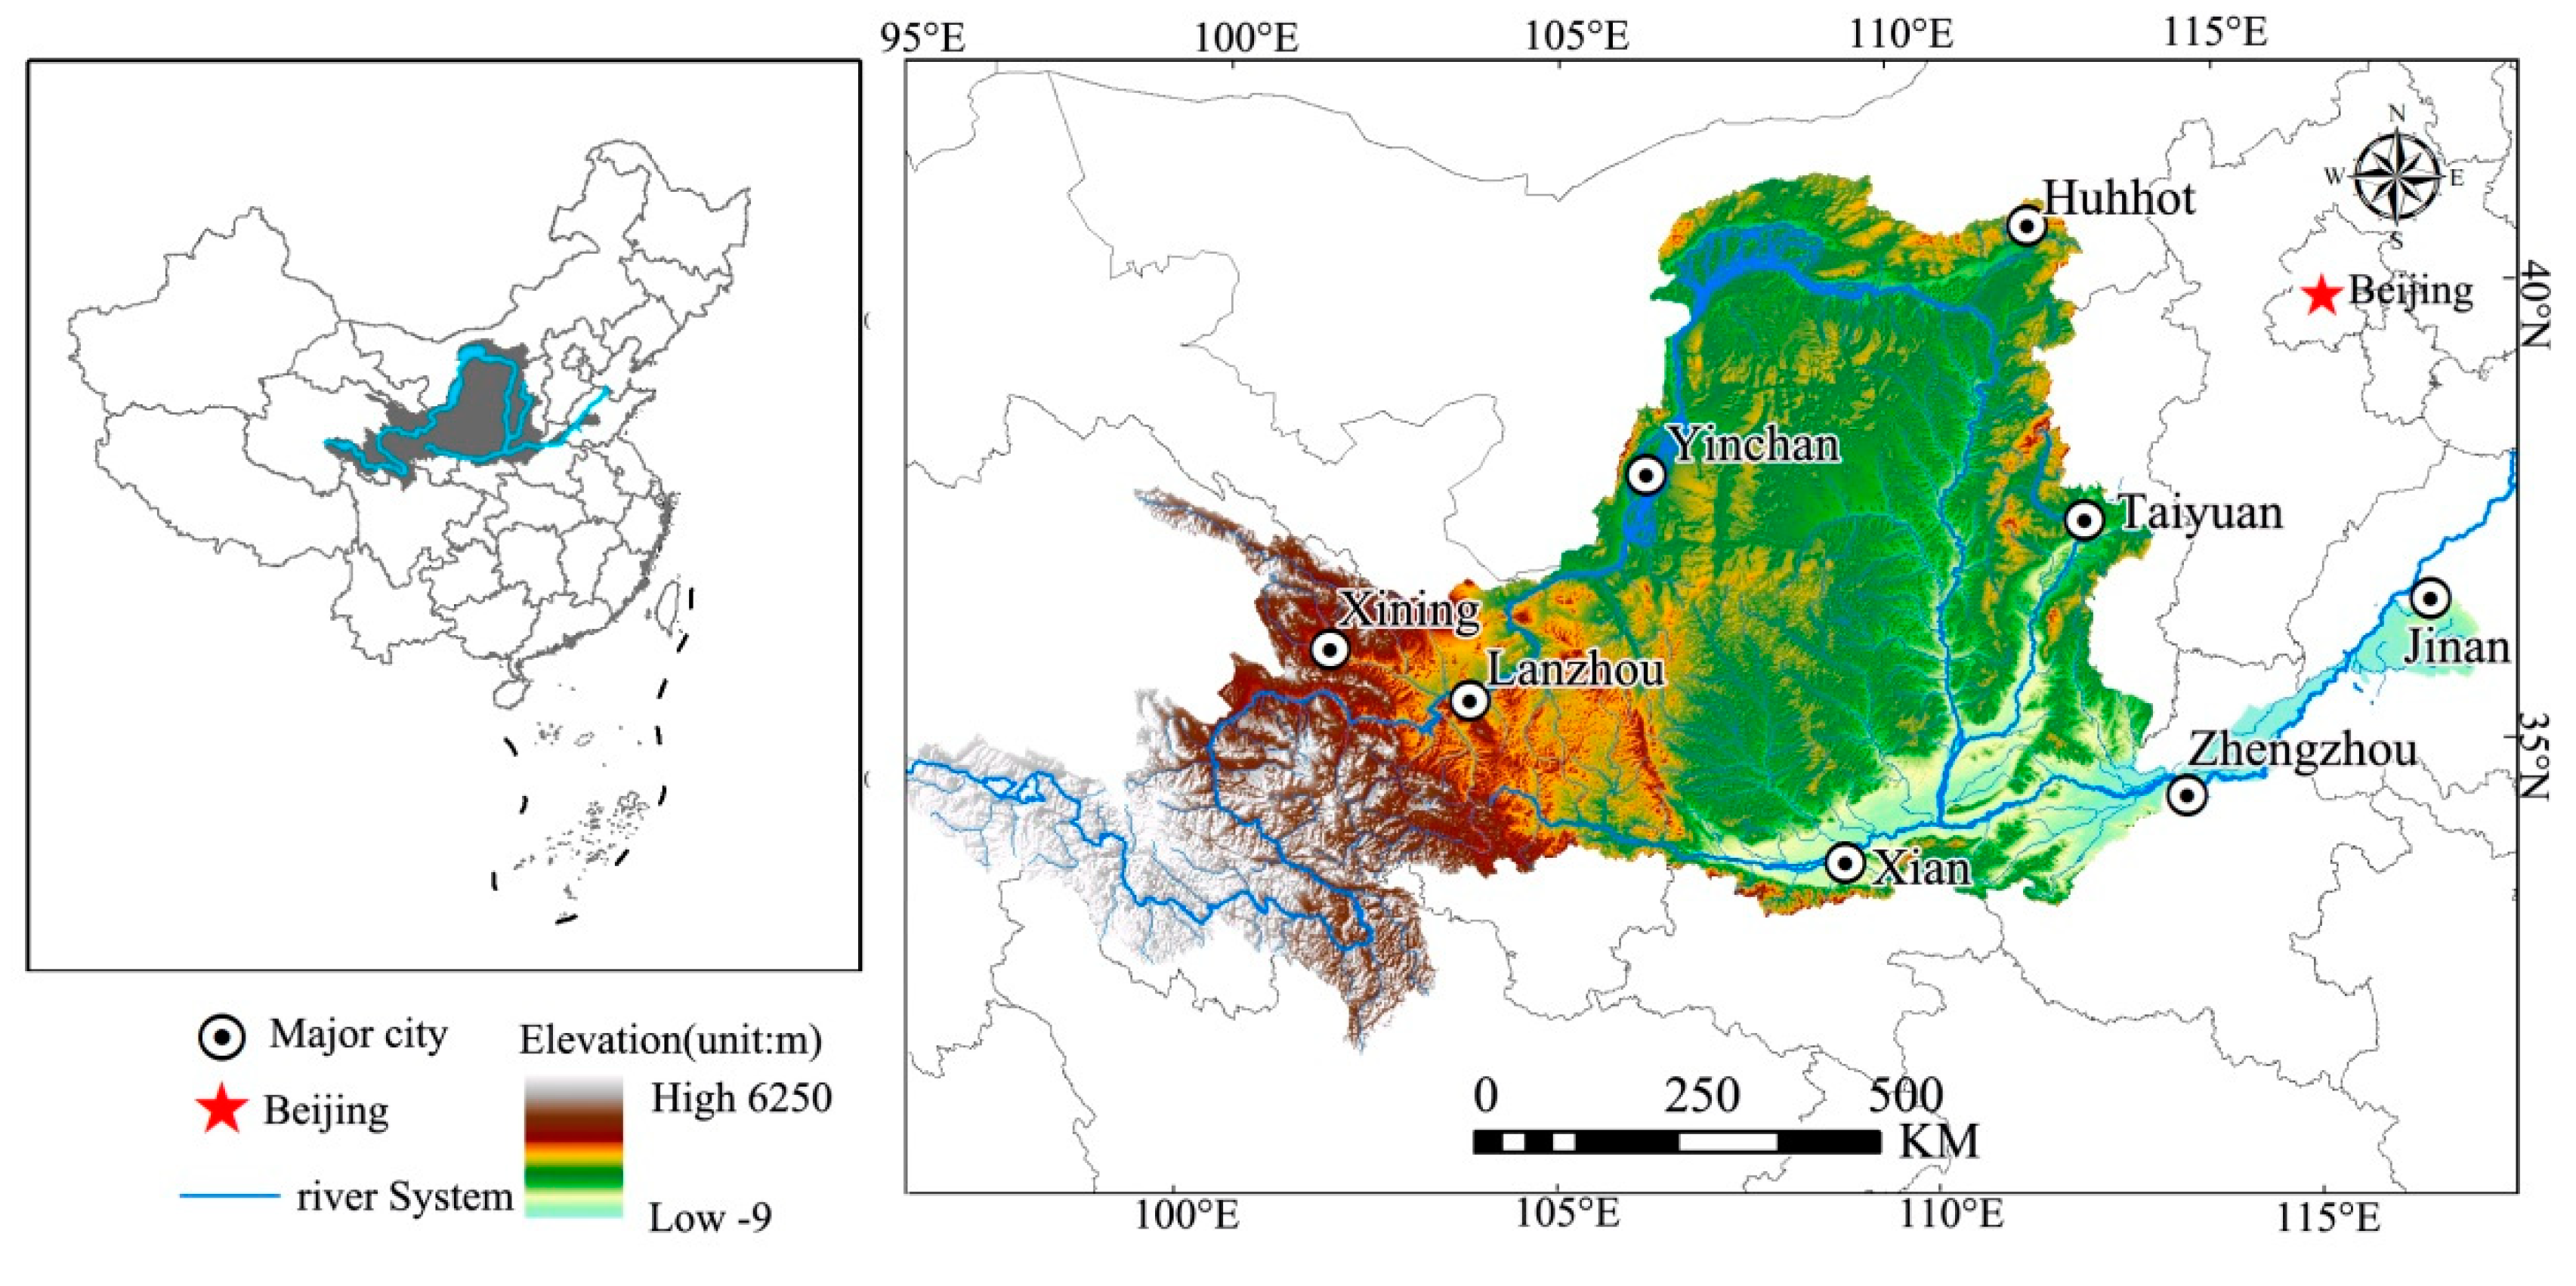
2. Study Area
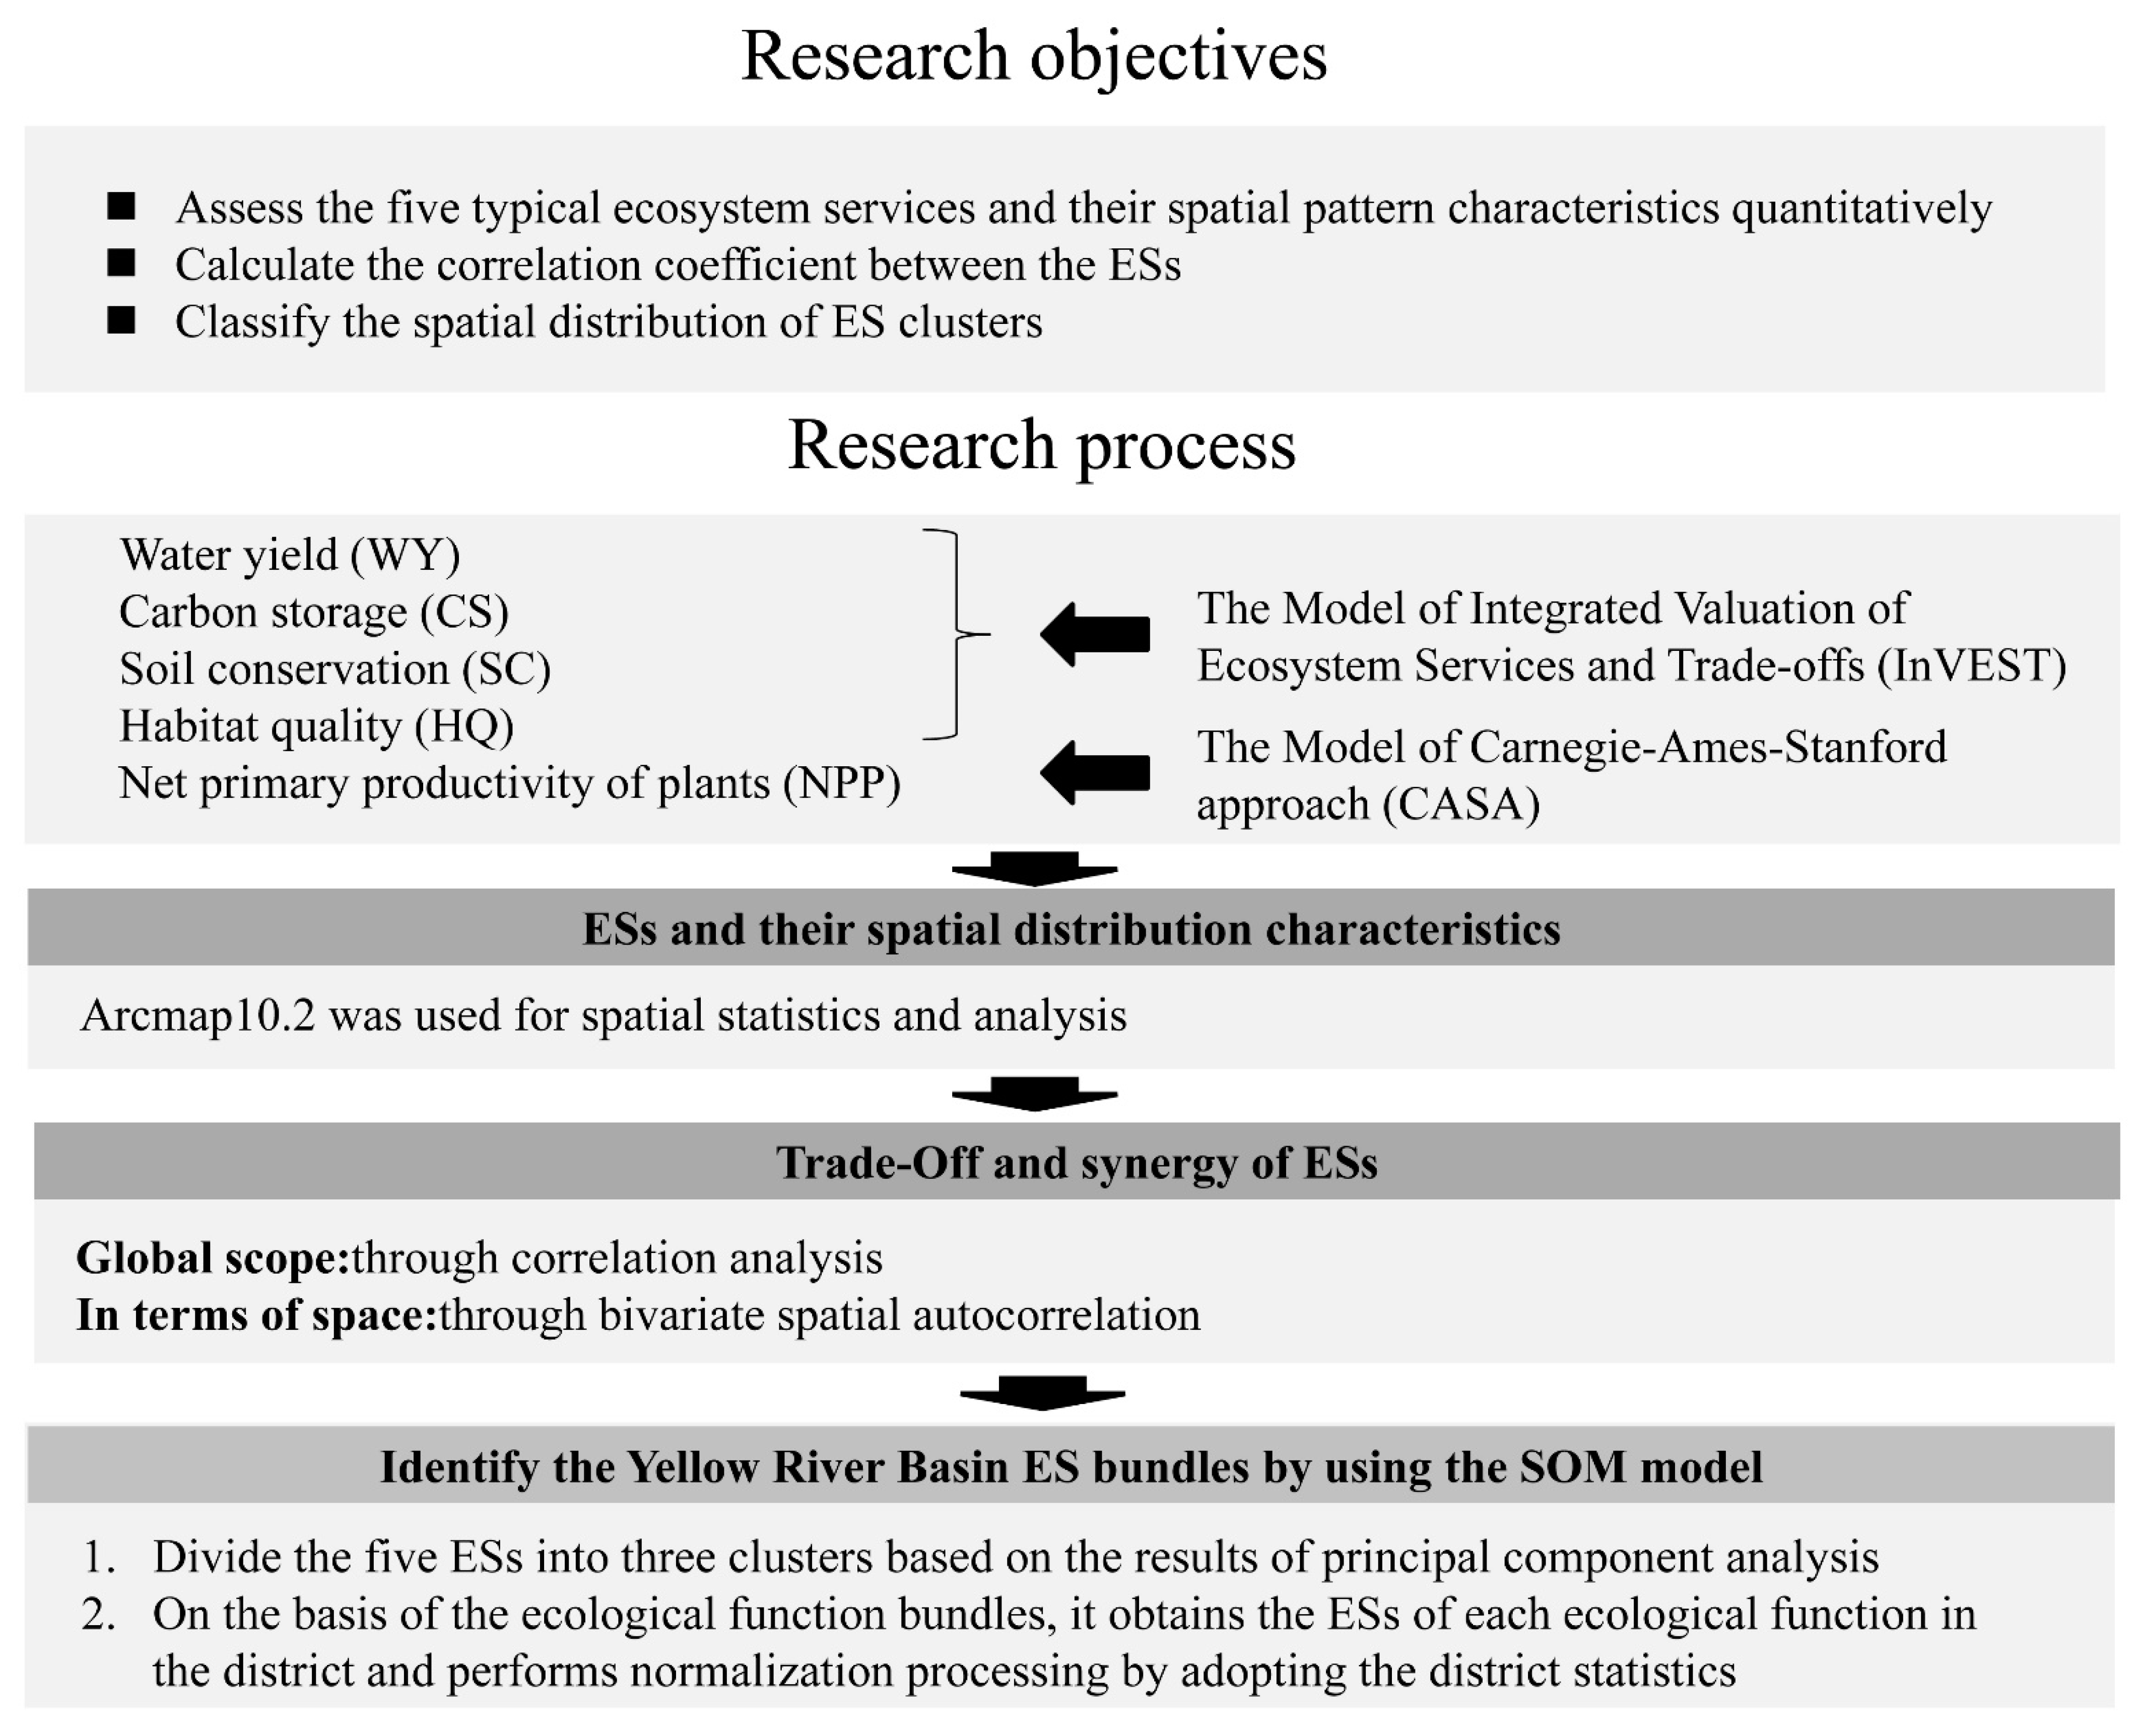
3. Data and Methodology
3.1. Data Sources
3.2. ES Quantification and Mapping
3.2.1. Net Primary Productivity (NPP)
3.2.2. Water Yield (WY)
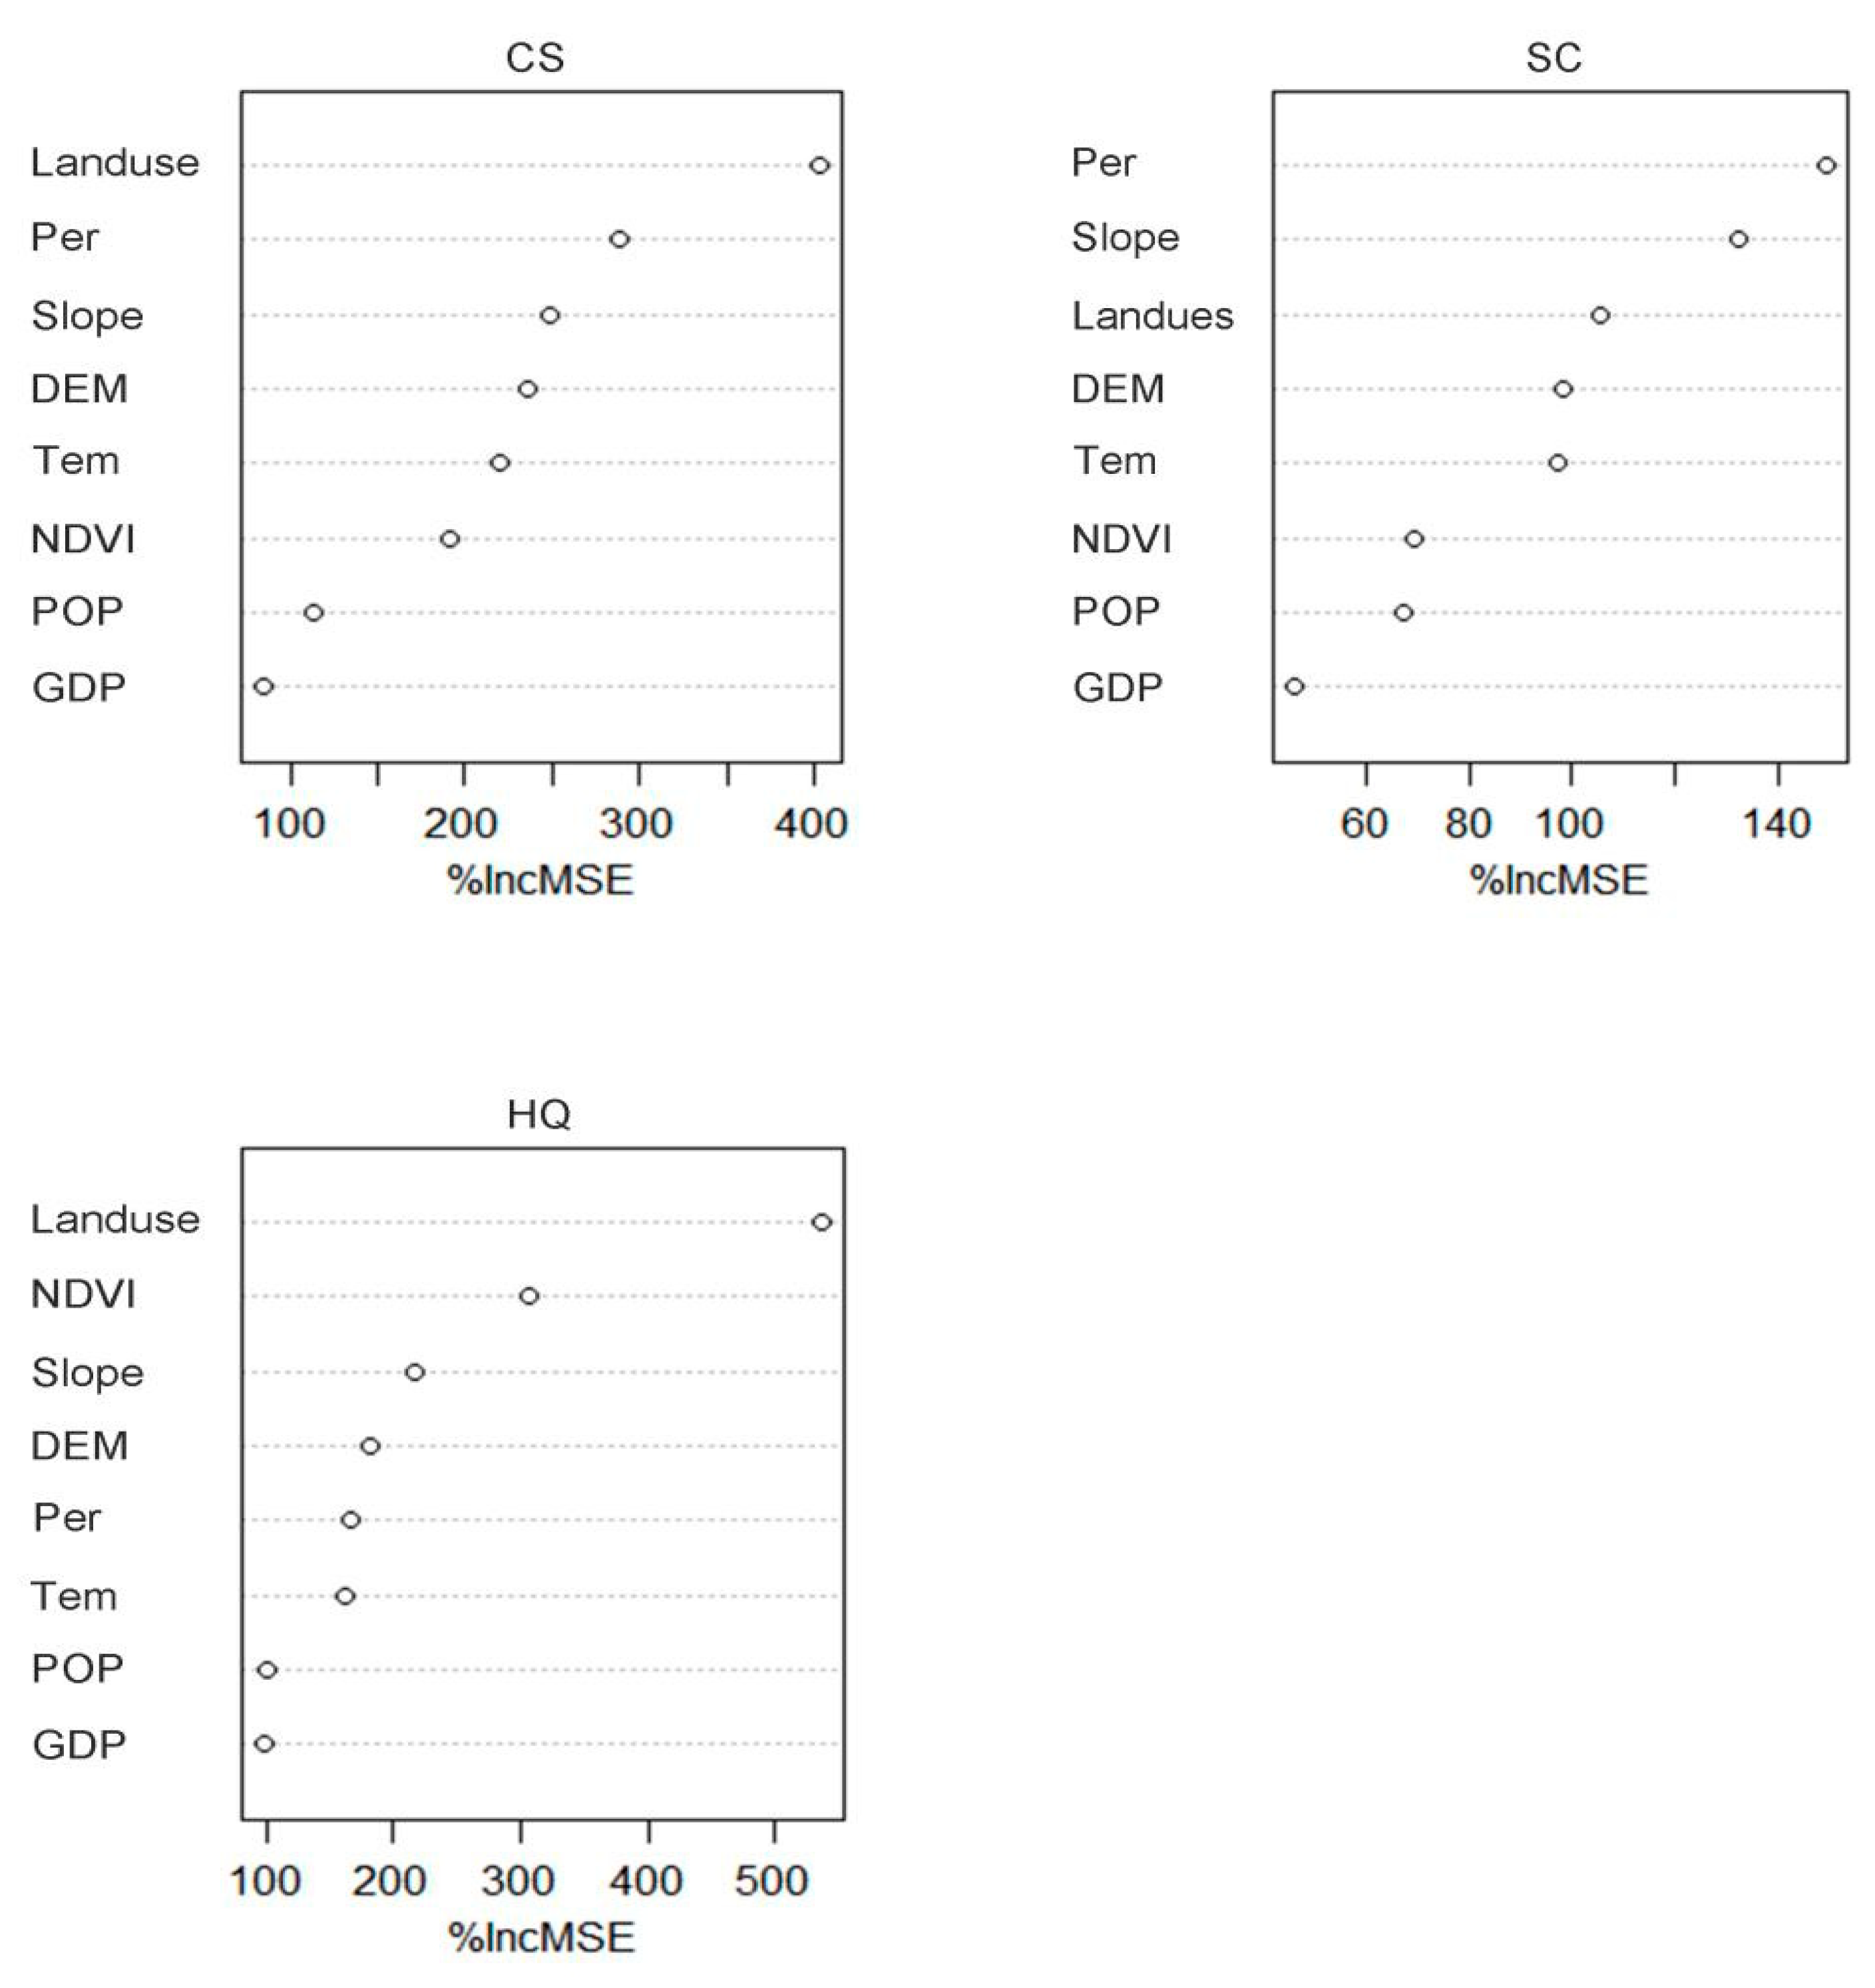
3.2.3. Carbon Storage (CS)
3.2.4. Soil Conservation (SC)
3.2.5. Habitat Quality (HQ)
3.3. Trade-Offs, Synergy, and Bundle Analysis among ESs
3.3.1. Correlation Analysis
3.3.2. Global Spatial Autocorrelation
3.3.3. Principal Component Analysis
3.3.4. SOM Method
4. Results and Analysis
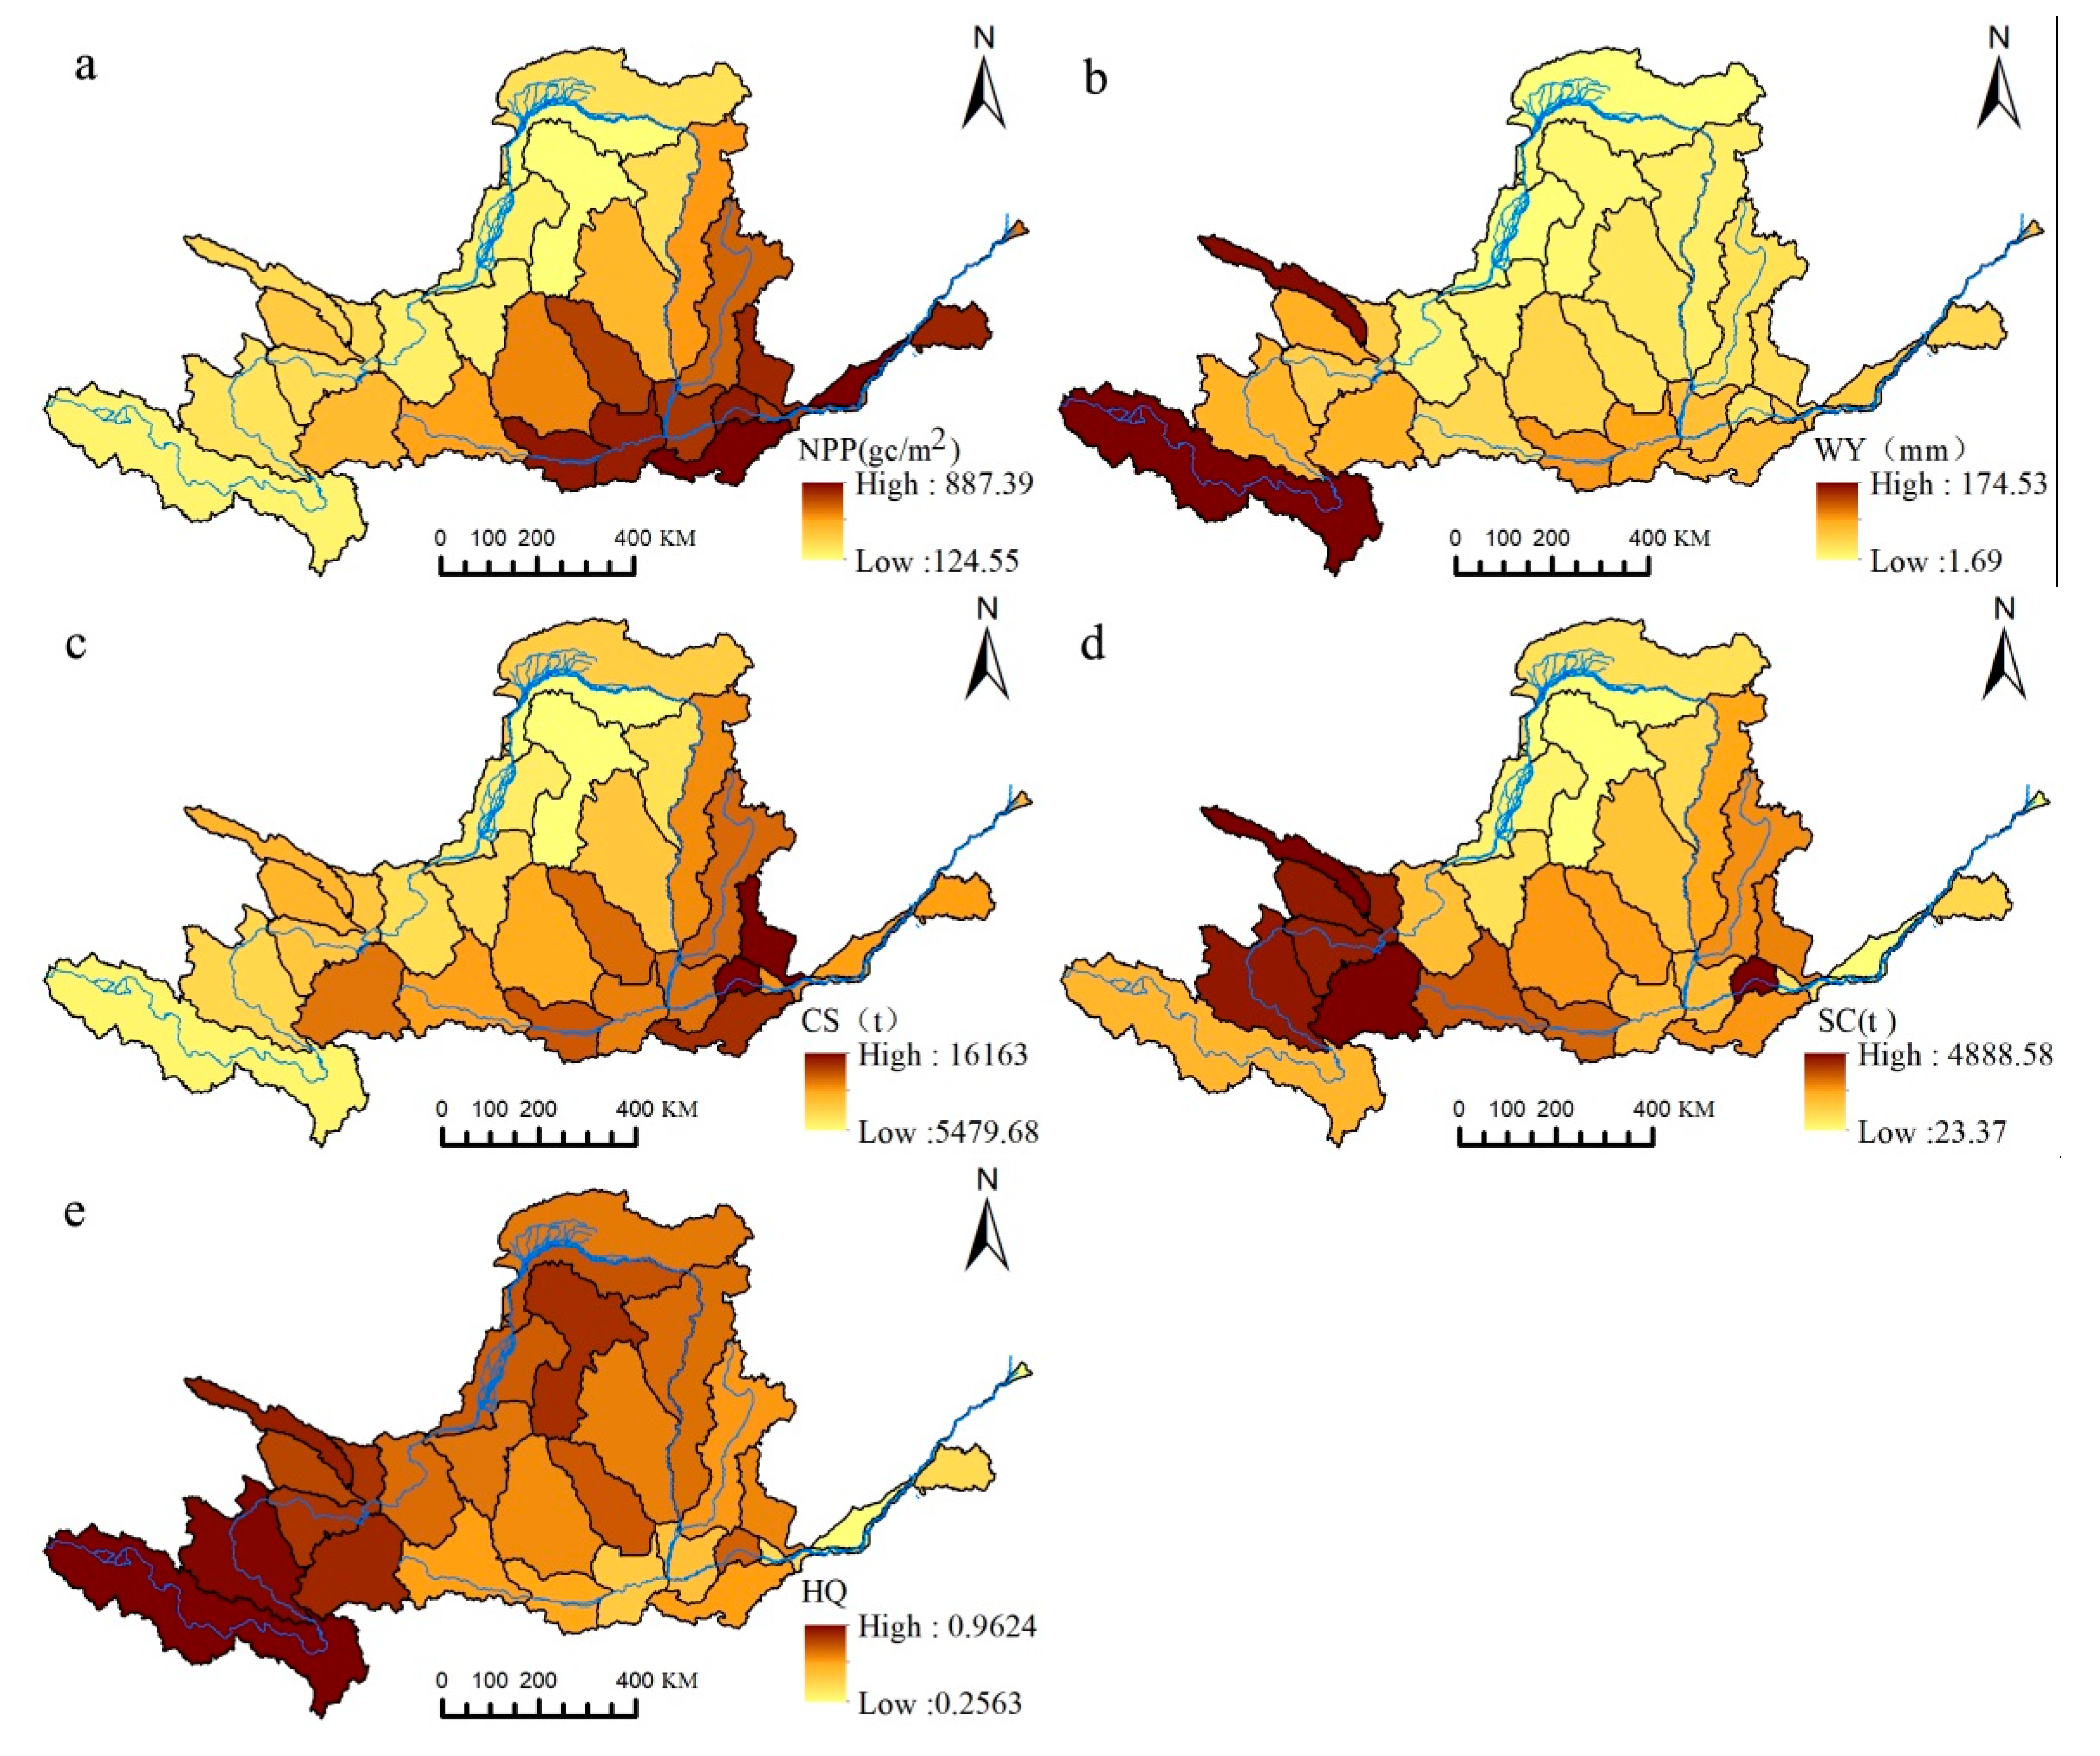
4.1. ESs and Their Spatial Distribution Characteristics
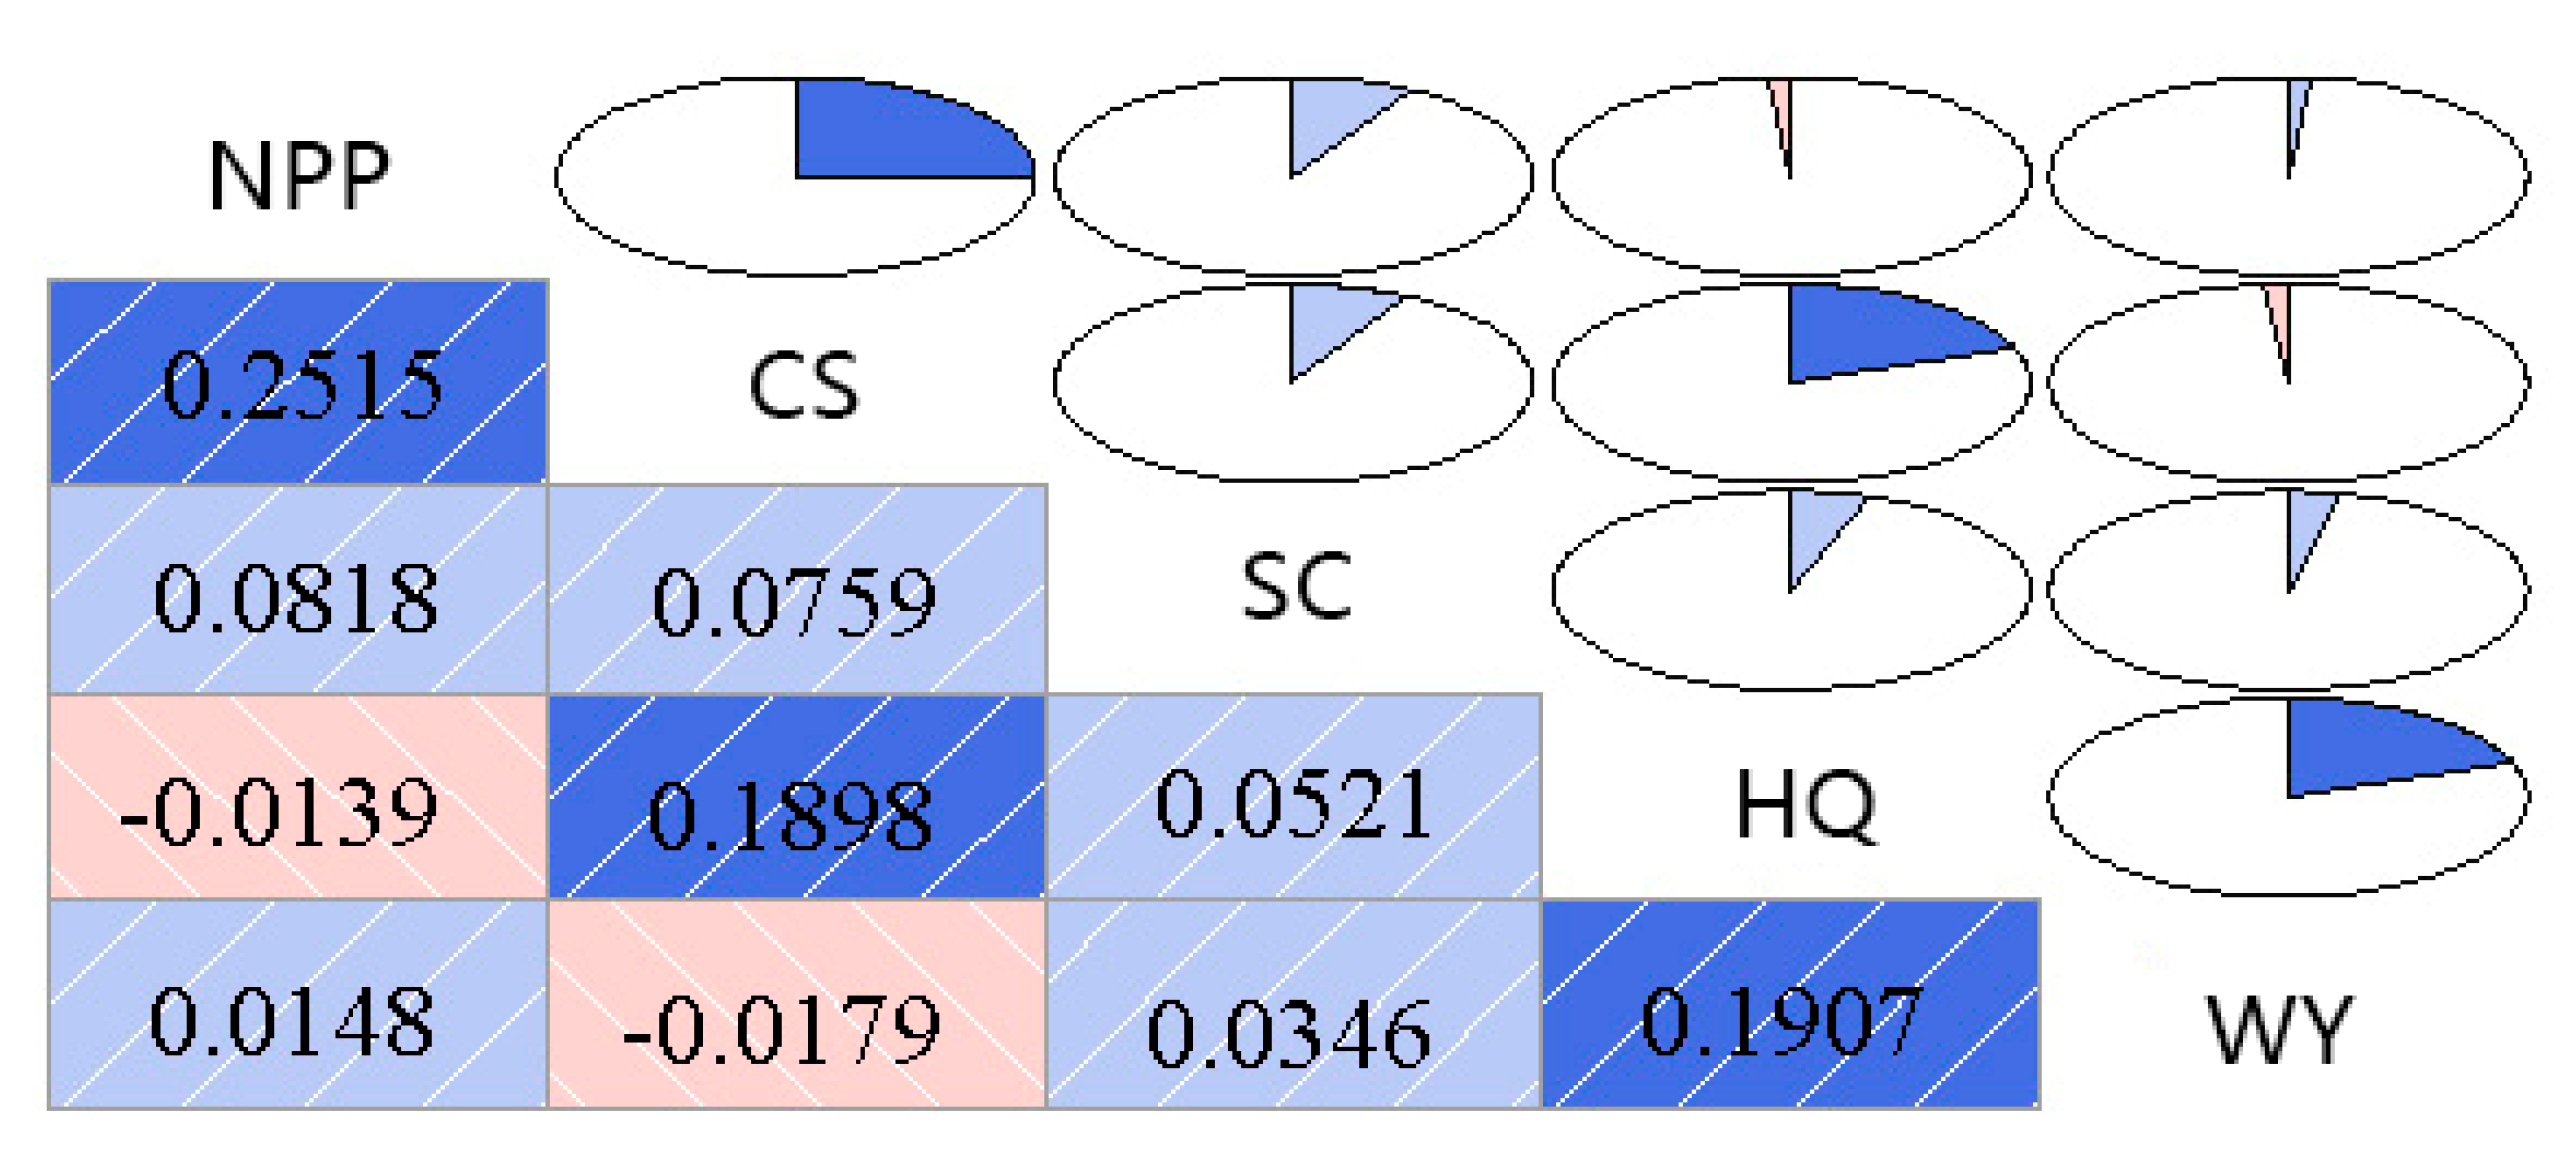
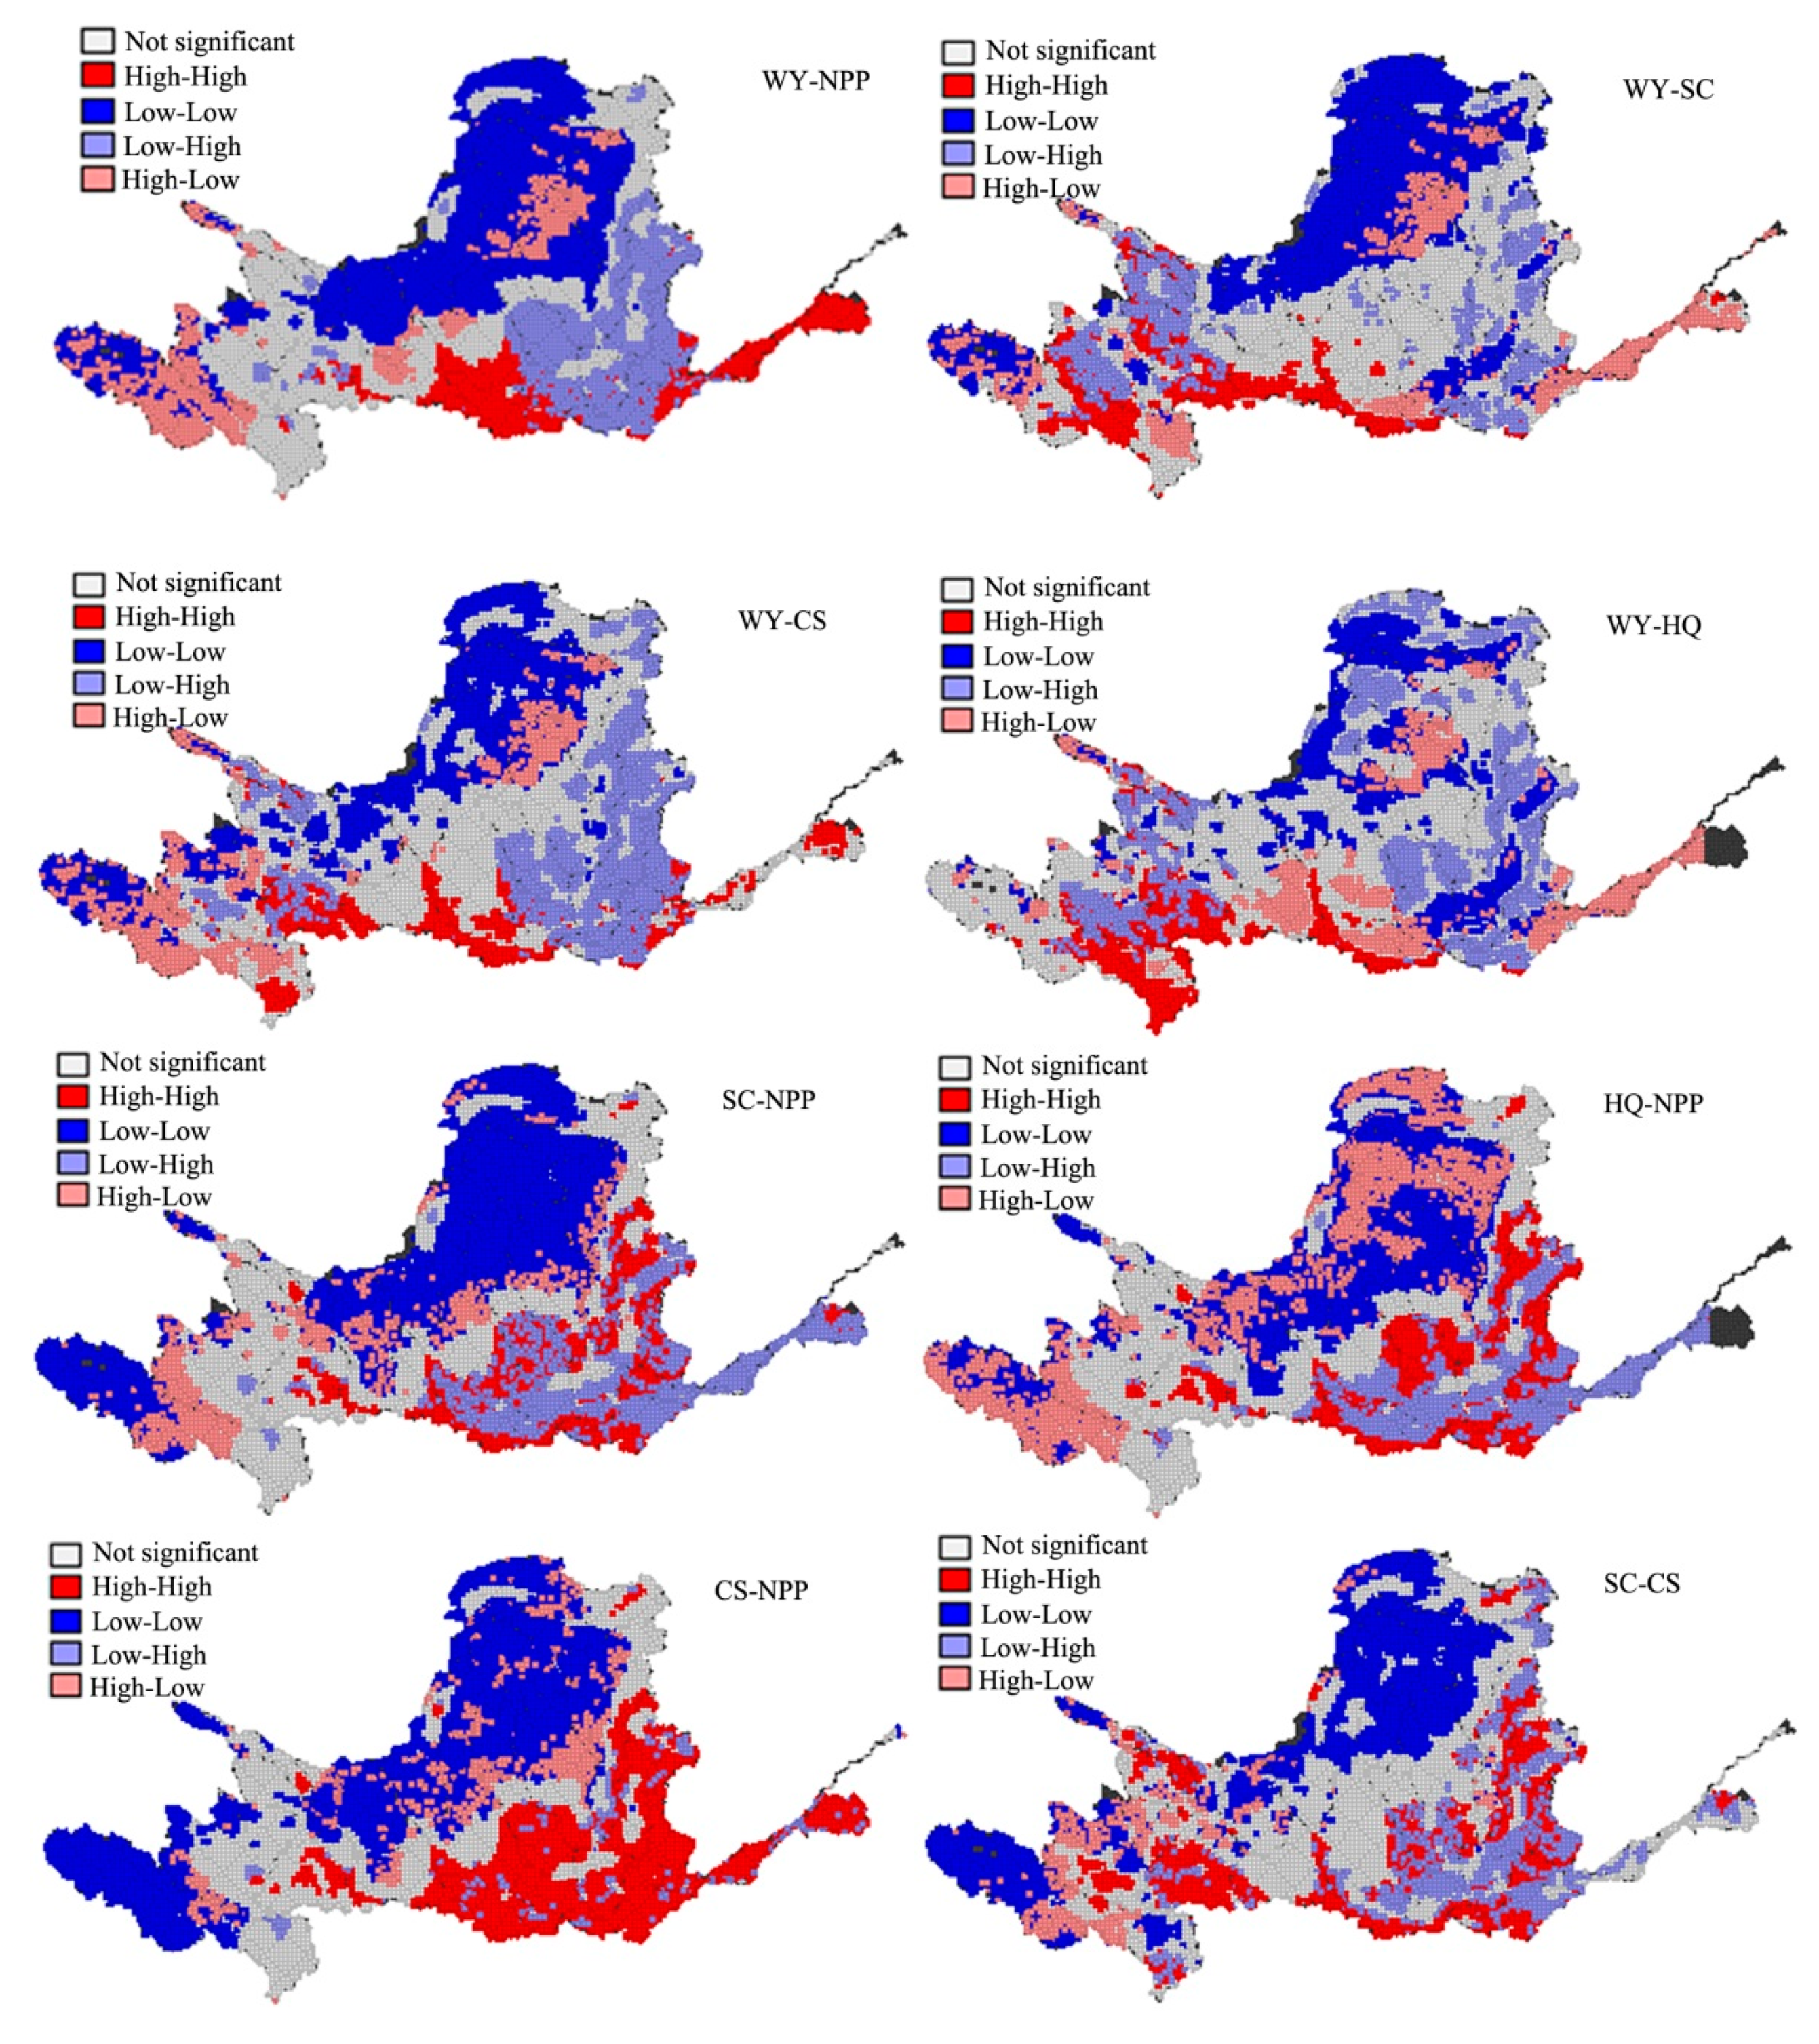
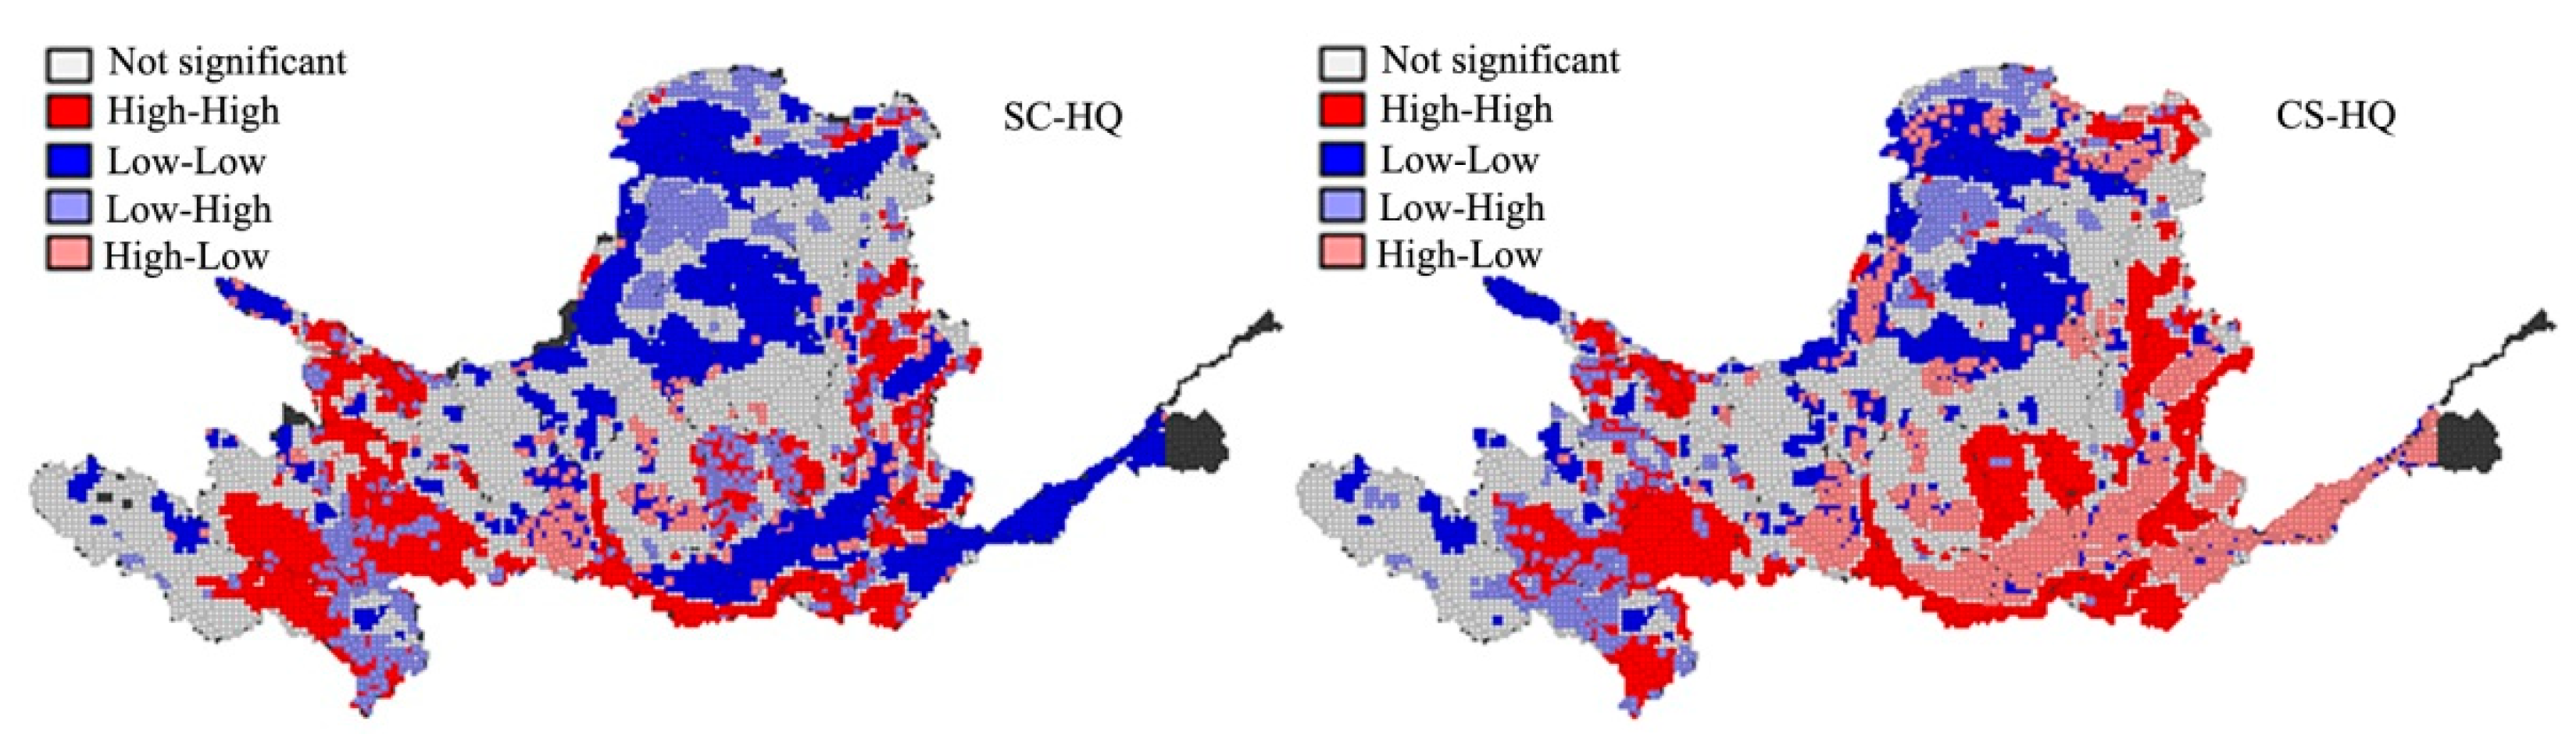
4.2. Trade-Off and Synergy of ESs in the Yellow River Basin
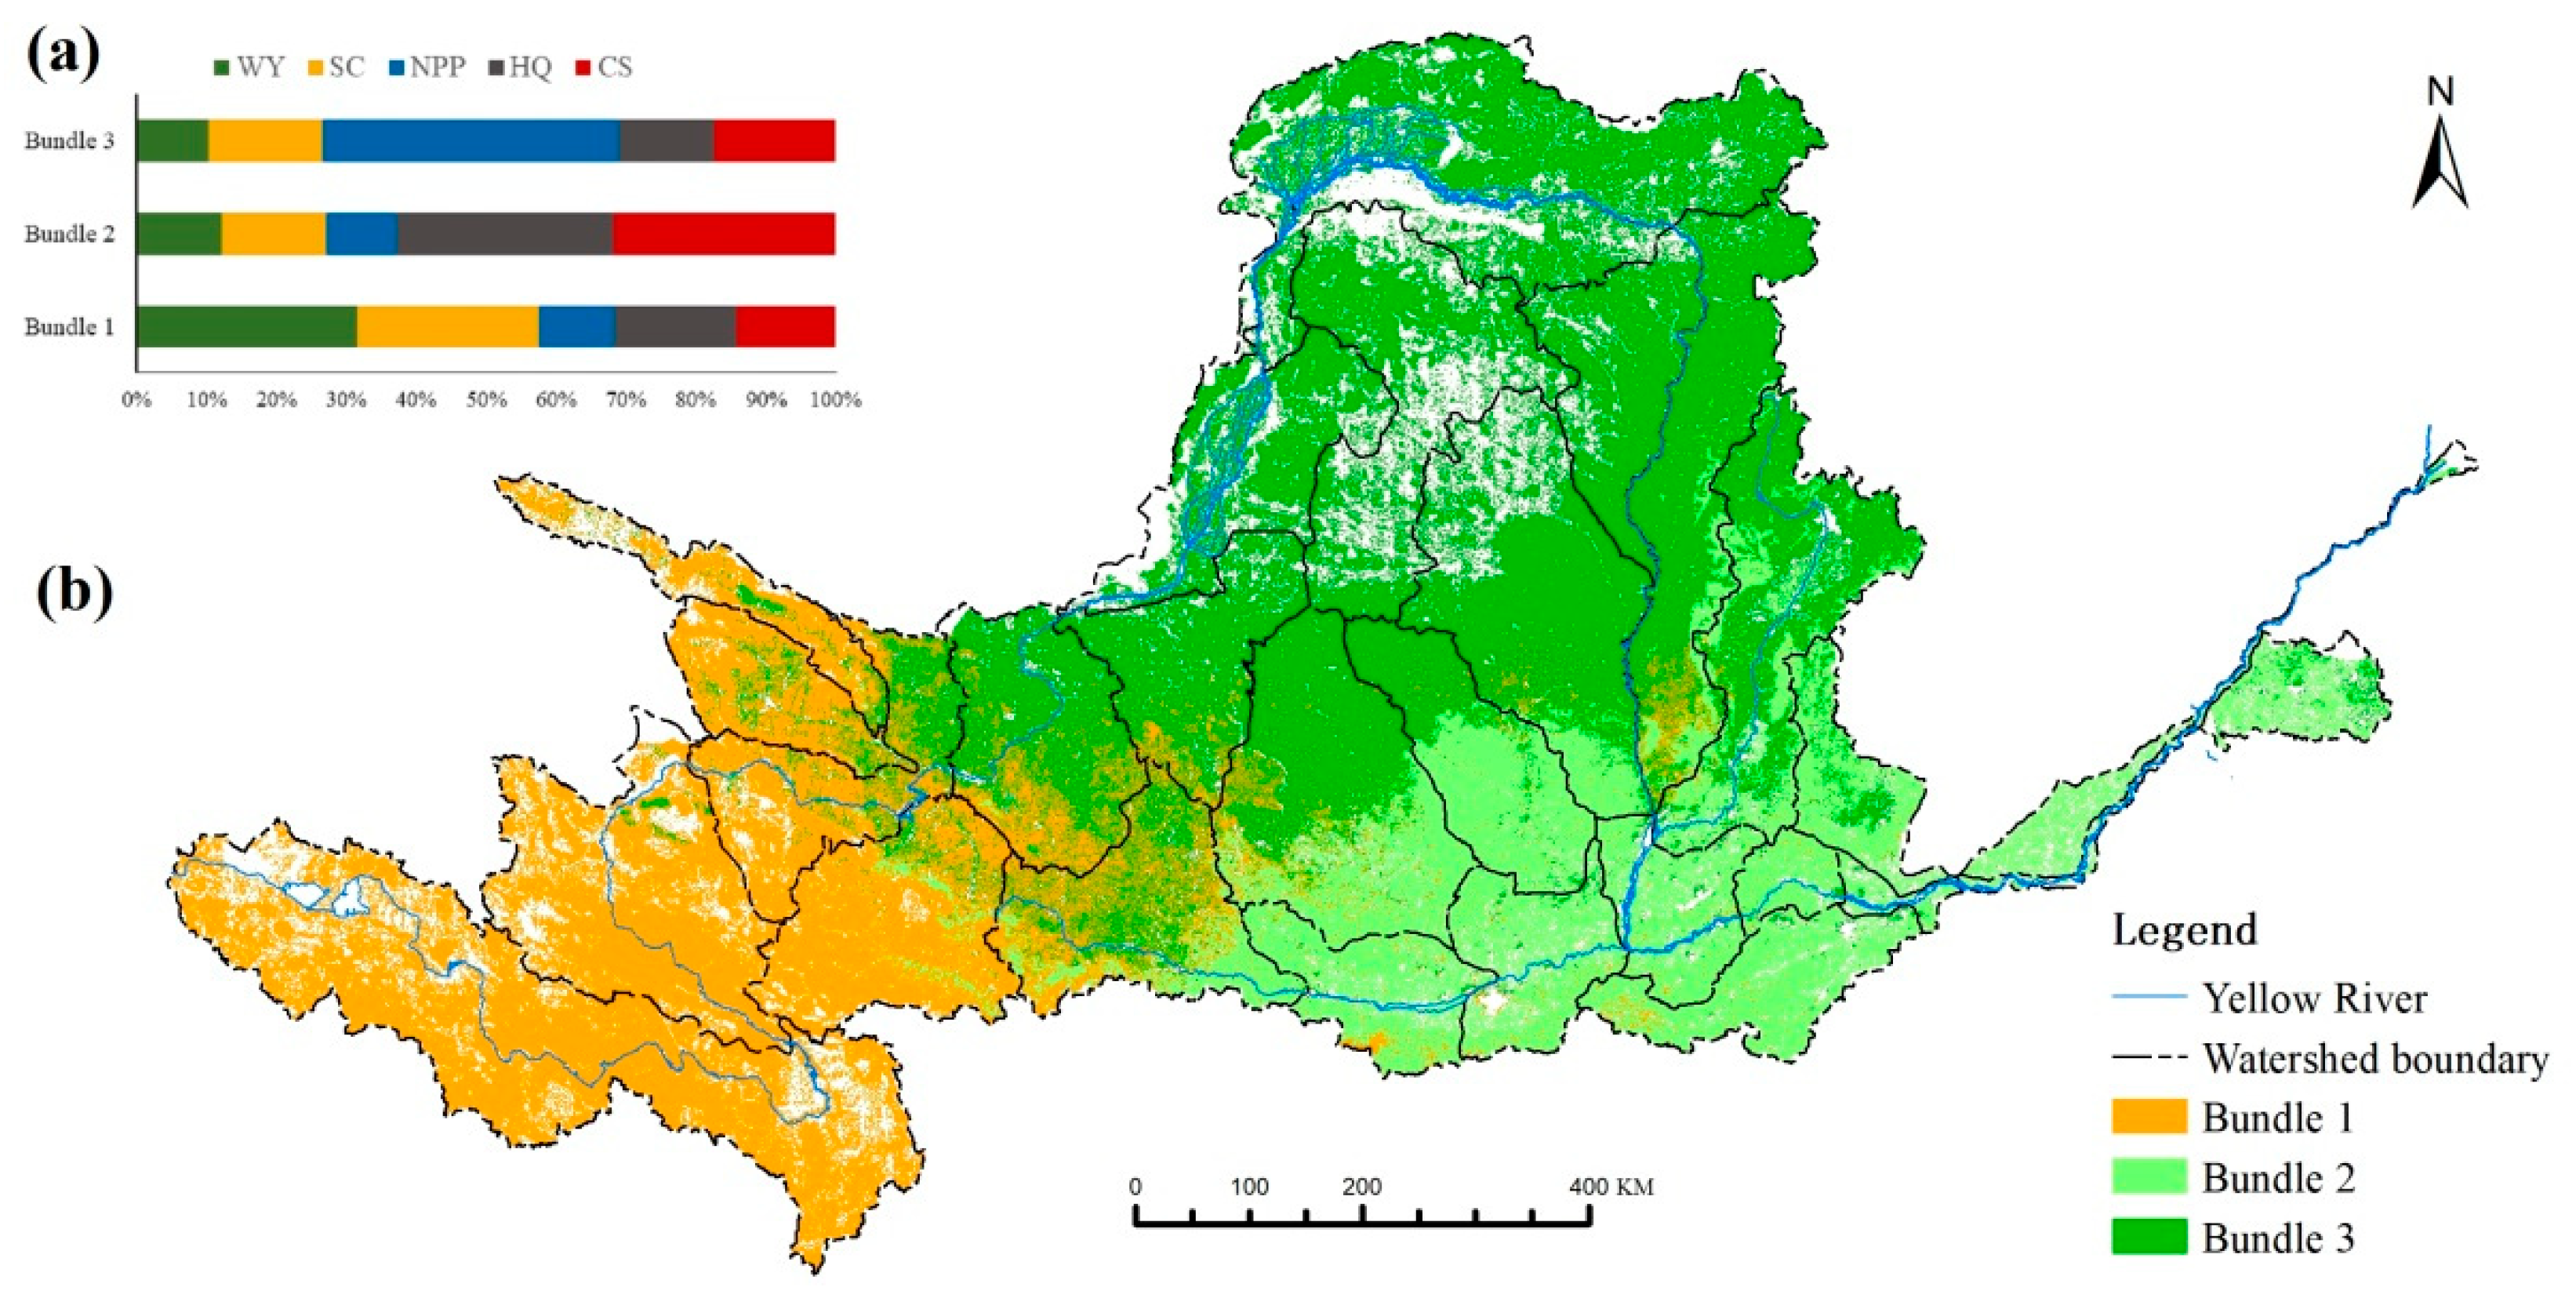
4.3. ES Bundles
4.3.1. Bundle 1: The Dominate Functional Area of WY and SC
4.3.2. Bundle 2: The Dominate Functional Area of HQ and CS
4.3.3. Bundle 3: The Dominate Functional Area of NPP
5. Discussion
5.1. The Trade-Off and Synergy Relationship of ESs
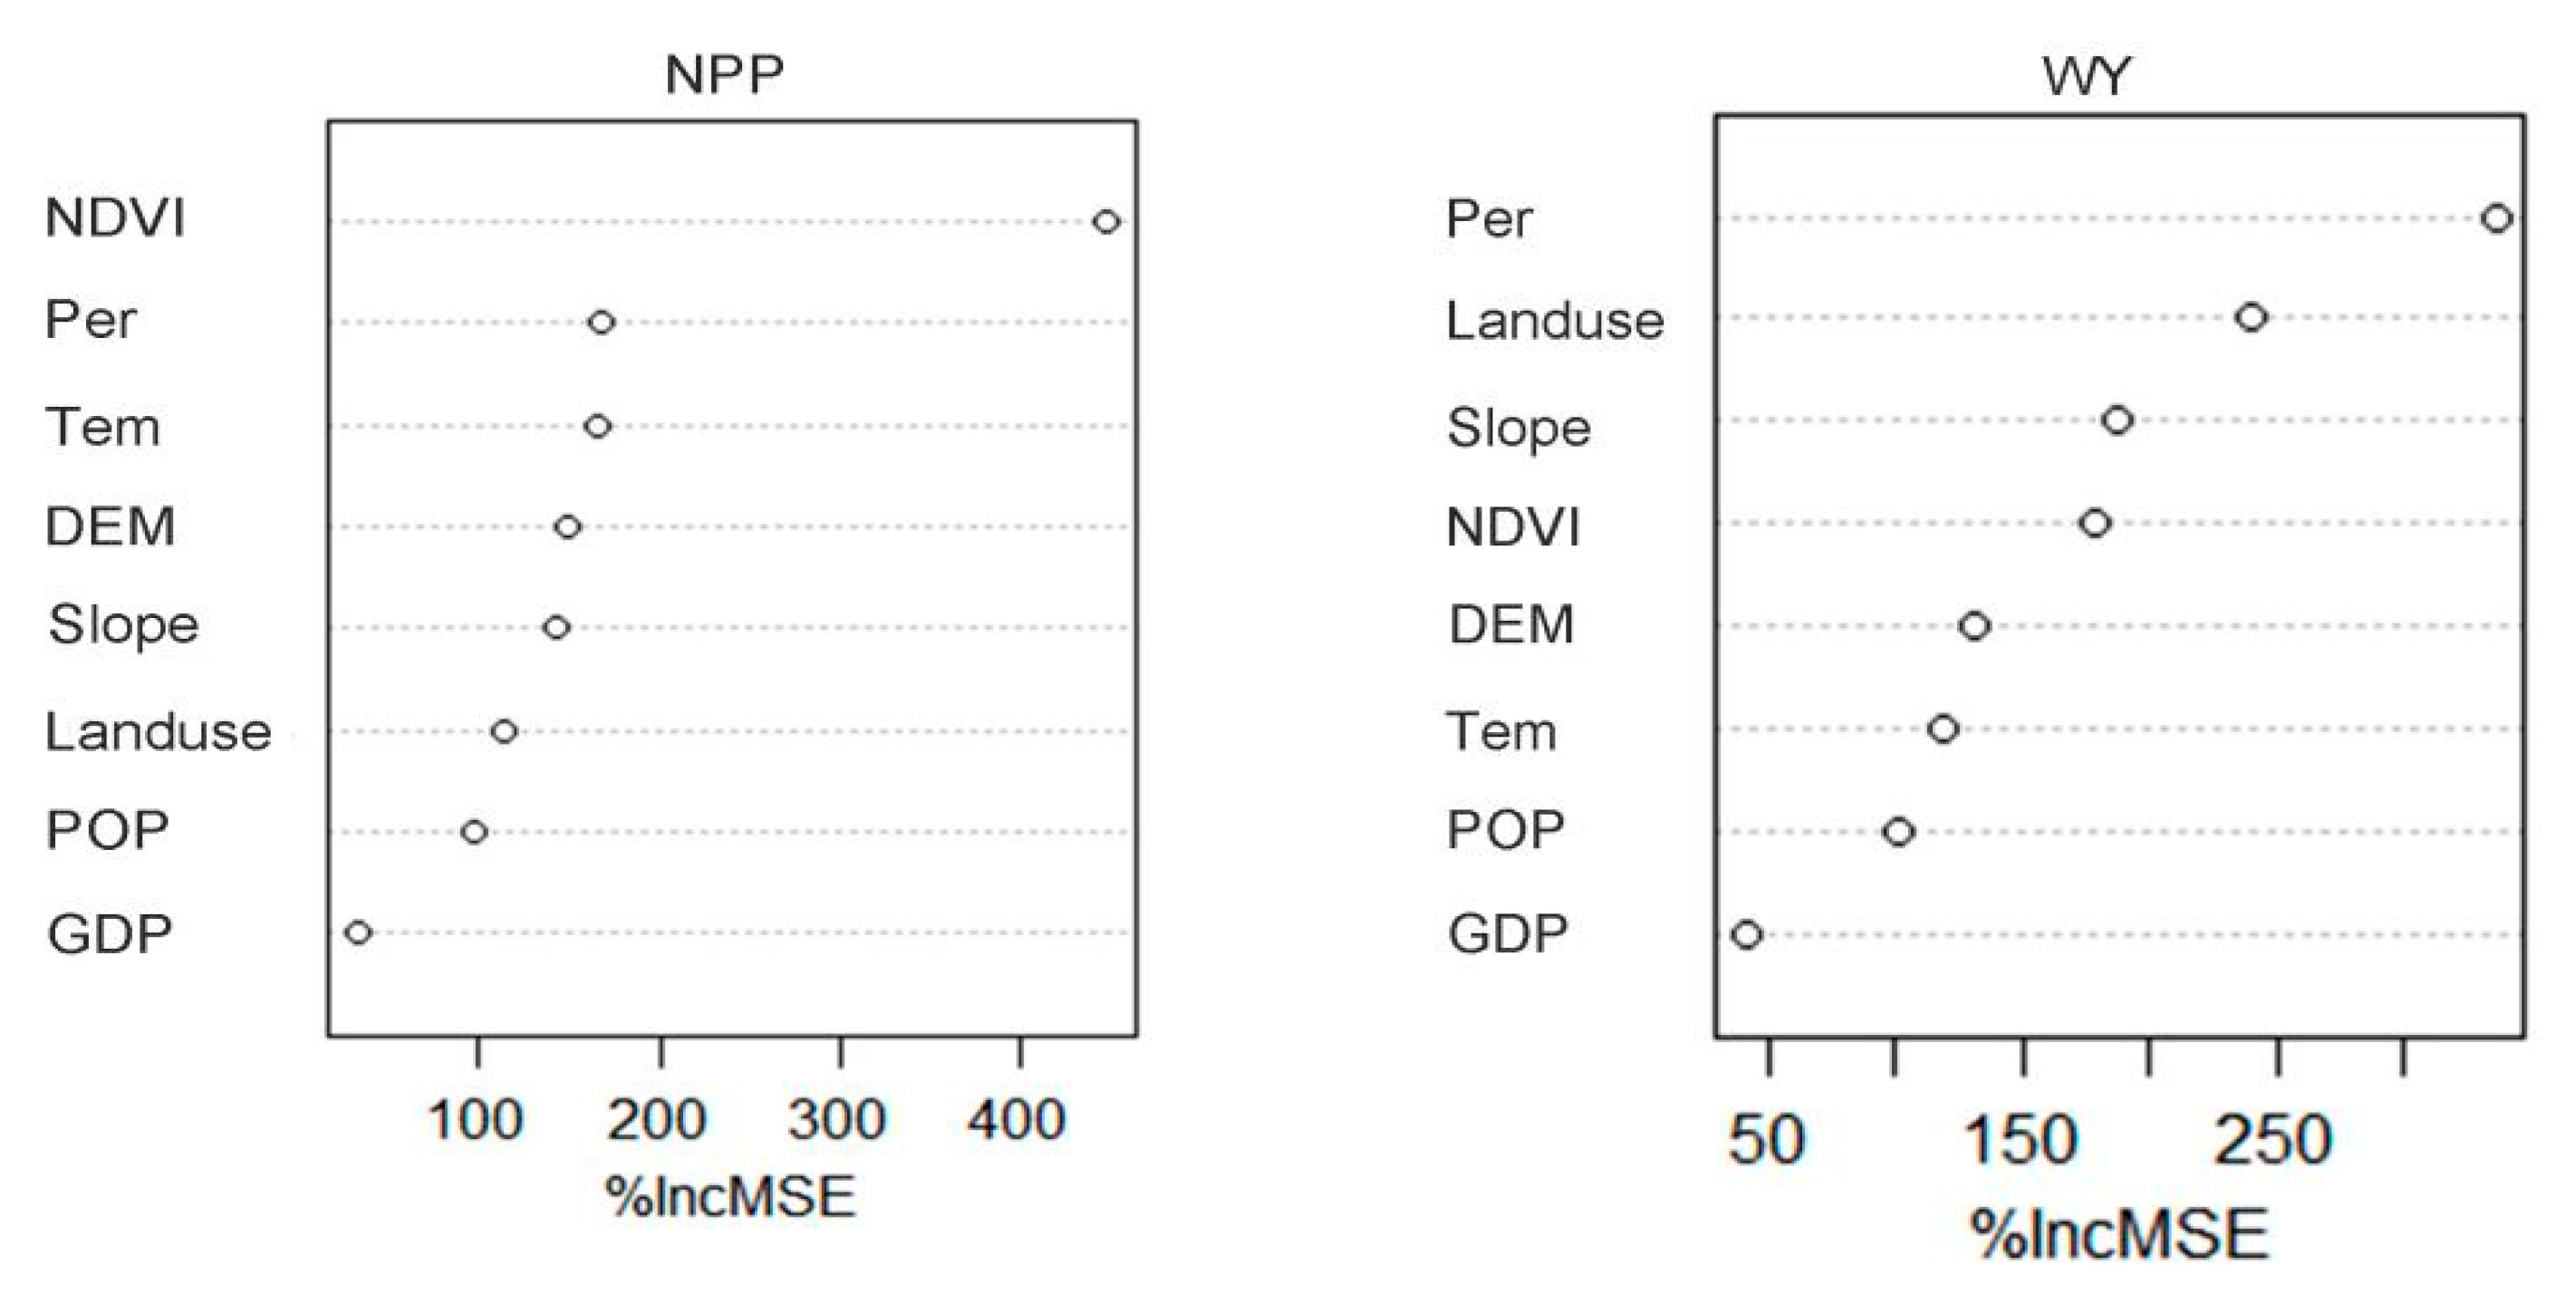
5.2. Factors Affecting the Spatial Distribution of ESs
5.3. Land Use Management Implications
6. Conclusions
Author Contributions
Funding
Institutional Review Board Statement
Informed Consent Statement
Data Availability Statement
Conflicts of Interest
References
- Sharm, R.; Rimal, B.; Baral, H.; Nehren, U.; Paudyal, K.; Sharma, S.; Rijal, S.; Ranpal, S.; Acharya, R.P.; Alenazy, A.A.; et al. Impact of land cover change on ecosystem services in a tropical forested landscape. Resources 2019, 8, 18–31. [Google Scholar] [CrossRef] [Green Version]
- MEA. Ecosystems and Human Well-Being: Current State and Trend: Synthesis; Island Press: Washington, DC, USA, 2005. [Google Scholar]
- Fu, B.J.; Zhang, L.W. Land-use change and ecosystem services: Concepts, methods and progress. Prog. Geogr. 2014, 33, 441–446. [Google Scholar]
- Acharya, R.P.; Maraseni, T.N.; Cockfield, G. An ecosystem services valuation research framework for policy integration in developing countries: A case study from Nepal. Sustainability 2020, 12, 8250–8265. [Google Scholar] [CrossRef]
- Costanza, R.; De Groot, R.; Braat, L.; Kubiszewski, I.; Fioramonti, L.; Sutton, P.; Farber, S.; Grassog, M. Twenty years of ecosystem services: How far have we come and how far do we still need to go? Ecosyst. Serv. 2017, 28, 1–16. [Google Scholar] [CrossRef]
- Wu, X.; Liu, S.; Zhao, S.; Hou, X.; Xu, J.; Dong, S.; Liu, G. Quantification and driving force analysis of ecosystem services supply, demand and balance in China. Sci. Total Environ. 2019, 652, 1375–1386. [Google Scholar] [CrossRef]
- Cord, A.F.; Brauman, K.A.; Chaplin-Kramer, R.; Huth, A.; Ziv, G.; Seppelt, R. Priorities to advance monitoring of ecosystem services using earth observation. Trends Ecol. Evol. 2017, 32, 416–428. [Google Scholar] [CrossRef] [PubMed]
- Lyu, R.F.; Zhang, J.M.; Xu, M.Q.; Li, J.J. Impacts of urbanization on ecosystem services and their temporal relations: A case study in Northern Ningxia, China. Land Use Policy 2018, 77, 163–173. [Google Scholar] [CrossRef]
- Mouchet, M.A.; Lamarque, P.; Martín-López, B.; Crouzat, E.; Gos, P.; Byczek, C.; Lavorela, S. An interdisciplinary methodological guide for quantifying associations between ecosystem services. Glob. Environ. Chang. 2014, 28, 298–308. [Google Scholar] [CrossRef]
- Deng, X.; Li, Z.; Gibson, J. A review on trade-off analysis of ecosystem services for sustainable land-use management. J. Geogr. Sci. 2016, 26, 953–968. [Google Scholar] [CrossRef] [Green Version]
- Howe, C.; Suich, H.; Vira, B.; Mace, G.M. Creating win-wins from trade-offs? Ecosystem services for human well-being: A meta-analysis of ecosystem service trade-offs and synergies in the real world. Glob. Environ. Chang. 2014, 28, 263–275. [Google Scholar] [CrossRef] [Green Version]
- Richards, D.R.; Friess, D.A. Characterizing coastal ecosystem service trade-offs with future urban development in a tropical city. Environ. Manag. 2017, 60, 961–973. [Google Scholar] [CrossRef]
- Trodahl, M.I.; Jackson, B.M.; Deslippe, J.R.; Metherell, A.K. Investigating trade-offs between water quality and agricultural productivity using the Land Utilisation and Capability Indicator (LUCI)-A New Zealand application. Ecosyst. Serv. 2017, 26, 388–399. [Google Scholar] [CrossRef]
- Tolessa, T.; Senbeta, F.; Kidane, M. The impact of land use/land cover change on ecosystem services in the central highlands of Ethiopia. Ecosyst. Serv. 2017, 23, 47–54. [Google Scholar] [CrossRef]
- Sun, Y.J.; Ren, Z.Y.; Hao, M.Y.; Duan, Y.F. Spatial and temporal changes in the synergy and trade-off between ecosystem services, and its influencing factors in Yanan, Loess Plateau. Acta Ecol. Sin. 2019, 39, 3443–3454. [Google Scholar]
- Fu, B.J.; Yu, D.D. Trade-off analyses and synthetic integrated method of multiple ecosystem services. Resour. Sci. 2016, 38, 0001–0009. [Google Scholar]
- Wang, B.; Zhao, J.; Hu, X.F. Analysis on trade-offs and synergistic relationships among multiple ecosystem services in the Shiyang River Basin. Acta Ecol. Sin. 2018, 38, 7582–7595. [Google Scholar]
- Jiang, C.; Li, D.; Wang, D.; Zhang, L. Quantification and assessment of changes in ecosystem service in the Three-River Headwaters Region, China as a result of climate variability and land cover change. Ecol. Indic. 2016, 66, 199–211. [Google Scholar] [CrossRef]
- Zoderer, B.M.; Tasser, E.; Erb, K.H.; Lupo Stanghellini, P.S.; Tappeiner, U. Identifying and mapping the tourists perception of cultural ecosystem services: A case study from an Alpine region. Land Use Policy 2016, 56, 251–261. [Google Scholar] [CrossRef]
- Rositano, F.; Bert, F.E.; Piñeiro, G.; Ferraro, D.O. Identifying the factors that determine ecosystem services provision in Pampean agroecosystems (Argentina) using a data-mining approach. Environ. Dev. 2017, 25, 3–11. [Google Scholar] [CrossRef] [Green Version]
- Cheng, G.D.; Li, X. Watershed science and its integrated research methods. Chin. Sci. Earth Sci. 2015, 45, 811–819. [Google Scholar]
- Chen, Q.; Chen, Y.H.; Wang, M.J.; Jiang, W.G.; Hou, P.; Li, Y. Analysis on the change of net primary productivity of vegetation and the driving factors of climate in the Yellow River Basin from 2001 to 2010. Chin. J. Appl. Ecol. 2014, 25, 2811–2818. [Google Scholar]
- Piao, S.L.; Fang, J.Y.; Guo, Q.H. Application of CASA model to the estimation of Chinese terrestrial net primary produtiovity. Acta Phytoecol. Sin. 2001, 25, 603–608. [Google Scholar]
- Zhu, W.Q.; Chen, Y.H.; Xu, D.; Li, J. Advances in terrestrial net primary productivity (NPP) estimation models. Chin. J. Ecol. 2005, 24, 296–300. [Google Scholar]
- Zhu, W.Q.; Pan, Y.Z.; Long, Z.H.; Chen, Y.H.; Li, J.; Hu, H.B. Estimating net primary productivity of terrestrial vegetation based on GIS and RS: A case study in Inner Mongolia, China. Natl. Remote Sens. Bull. 2005, 3, 300–307. [Google Scholar]
- Mu, S.J.; Li, J.L.; Zhou, W.; Yang, H.F.; Zhang, C.B.; Ju, W.M. Spatial-temporal distribution of net primary productivity and its relationship with climate factors in Inner Mongolia from 2001 to 2010. Acta Ecol. Sin. 2013, 33, 3752–3764. [Google Scholar]
- Sharp, R.; Tallis, H.; Ricketts, T.; Guerry, A.; Wood, S.A.; Chaplin-Kramer, R.; Nelson, E. The Natural Capital Projet. In VEST 3.6.0 User’s Guide; The Natural Capital Project, Stanford University: Stanford, CA, USA; University of Minnesota: Minneapolis, MN, USA; The Nature Conservancy: Arlington County, VA, USA; World Wildlife Fund: Gland, Switzerland, 2018. [Google Scholar]
- Zhang, L.; Dawes, W.R.; Walker, G.R. Response of mean annual evapotranspiration to vegetation changes at catch-ment scale. Water Resour. Res. 2001, 37, 701–708. [Google Scholar] [CrossRef]
- Yang, J.; Xie, B.P.; Zhang, D.G. Spatio-temporal variation of water yield and its response to precipitation and land use change in the Yellow River Basin based on InVEST model. Chin. J. Appl. Ecol. 2020, 31, 2731–2739. [Google Scholar]
- Xie, X.L.; Sun, B.; Zhou, H.Z.; Li, Z.P.; Li, A.B. Estimation and spatial distribution of soil organic carbon density and storage in China. Acta Pedol. Sin. 2004, 41, 35–43. [Google Scholar]
- Li, K.R.; Wang, S.Q.; Cao, M.K. Carbon storage of vegetation and soil in China. Sci. China 2002, 33, 72–80. [Google Scholar] [CrossRef]
- Chen, L.J.; Liu, G.H.; Li, H.G. Remote sensing dynamic monitoring of net primary productivity of vegetation in China. J. Remote Sens. 2002, 6, 129–136. [Google Scholar]
- Chuai, X.H.; Huang, X.J.; Lai, L.; Wang, W.J.; Peng, J.W.; Zhao, R.Q. Land use structure optimization based on carbon storage in several regional terrestrial ecosystems across China. Environ. Sci. Policy 2013, 25, 50–61. [Google Scholar] [CrossRef]
- Liu, D.Q.; Gong, J.; Zhang, J.Q.; Ma, X.C. Spatiotemporal variation of soil conservation function and its influencing factors in Bailongjiang Watershed in Gansu Province. Res. Soil Water Conserv. 2018, 25, 94–103. [Google Scholar]
- Bao, Y.B.; Liu, K.; Li, T.; Hu, S. Effects of land use change on habitat based on InVEST model-taking Yellow River wetland nature reserve in Shaanxi province as an example. Arid Zone Res. 2015, 32, 622–629. [Google Scholar]
- Zhong, L.N.; Wang, J. Evaluation on effect of land consolidation on habitat quality based on InVEST model. Trans. Chin. Soc. Agric. Eng. 2017, 33, 250–255. [Google Scholar]
- Liu, Y.; Bi, J.; Lü, J.S. Trade-off and synergy relationships of ecosystem services and the driving forces: A case study of the Taihu Basin, Jiangsu Province. Acta Ecol. Sin. 2019, 39, 7067–7078. [Google Scholar]
- Zhang, X.R.; Zhou, J.; Li, G.N.; Chen, C.; Li, M.; Luo, J. Spatial pattern reconstruction of regional habitat quality based on the simulation of land use changes from 1975 to 2010. J. Geogr. Sci. 2020, 30, 601–620. [Google Scholar] [CrossRef]
- Hou, Y.; Lu, Y.H.; Chen, W.P.; Fu, B.J. Temporal variation and spatial scale dependency of ecosystem service interactions: A case study on the central Loess Plateau of China. Landsc. Ecol. 2017, 32, 1201–1217. [Google Scholar] [CrossRef]
- Hu, X.; Hong, W.; Qiu, R.; Hong, T.; Chen, C.; Wu, C. Geographic variations of ecosystem service intensity in Fuzhou City, China. Sci. Total Environ. 2015, 512–513, 215–226. [Google Scholar] [CrossRef]
- Li, Y.J.; Zhang, L.W.; Qiu, J.X.; Yan, J.P.; Wan, L.W.; Wang, P.T.; Hu, N.; Cheng, W.; Fu, B. Spatially explicit quantification of the interactions among ecosystem services. Landsc. Ecol. 2017, 32, 1181–1199. [Google Scholar] [CrossRef]
- Ying, H.; Zhang, H.Y.; Zhao, J.J.; Shan, Y.; Zhang, Z.X.; Guo, X.Y.; Rihana, W.; Denga, G. Effects of spring and summer extreme climate events on the autumn phenology of different vegetation types of Inner Mongolia, China, from 1982 to 2015. Ecol. Indic. 2020, 111, 105974. [Google Scholar] [CrossRef]
- Kohonen, T.; Makisara, K. The Self-Organizing Feature Maps. Phys. Scr. 1989, 9, 168–172. [Google Scholar] [CrossRef]
- Tammi, I.; Mustajärvi, K.; Rasinmäki, J. Integrating spatial valuation of ecosystem services into regional planning and development. Ecosyst. Serv. 2017, 26, 329–344. [Google Scholar] [CrossRef] [Green Version]
- Jiang, C.; Zhang, H.; Zhang, Z. Spatially explicit assessment of ecosystem services in China’s Loess Plateau: Patterns, interactions, drivers, and implications. Glob. Planet. Chang. 2018, 161, 41–52. [Google Scholar] [CrossRef]
- Zhou, Z.X.; Li, J.; Guo, Z.Z.; Li, T. Trade-offs between carbon, water, soil and food in Guanzhong-Tianshui economic region from remotely sensed data. Int. J. Appl. Earth Obs. Geoinf. 2017, 58, 145–156. [Google Scholar] [CrossRef]
- Bennett, E.M.; Peterson, G.D.; Gordon, L.J. Understanding relationships among multiple ecosystem services. Ecol. Lett. 2009, 12, 1394–1404. [Google Scholar] [CrossRef]
- Wang, Y.H.; Dai, E.F. Spatial-temporal changes in ecosystem services and the trade-off relationship in mountain regions: A case study of Hengduan Mountain region in Southwest China. J. Clean. Prod. 2020, 264, 121573. [Google Scholar] [CrossRef]
- Peng, Y.X.; Wu, J.Z.; Luan, Z.P.; Feng, L. Evaluation of biodiversity in typical forest ecosystems in China: A review. For. Eng. 2013, 29, 4–10. [Google Scholar]
- Zhang, P.; Zhang, Y.; Yang, G.; Zheng, Z.; Liu, Y.; Tan, Z. Carbon storage and sequestration of tree layer in subtropical evergreen broadleaf forests in Ailao Mountain of Yunnan. Chin. J. Ecol. 2010, 29, 1047–1053. [Google Scholar]
- Yang, D.; Liu, W.; Tang, L.Y.; Chen, L.; Li, X.Z.; Xu, X.L. Estimation of water provision services for monsoon catchments of South China: Applicability of the InVEST model. Landsc. Urban Plan. 2019, 182, 133–143. [Google Scholar] [CrossRef]
- Lang, Y.Q.; Song, W.; Deng, X.Z. Projected land use changes impacts on water yields in the karst mountain areas of China. Phys. Chem. Earth 2018, 104, 66–75. [Google Scholar] [CrossRef]
- Liu, C.Y.; Zhu, K.W.; Liu, J.P. Evolution and prediction of land cover and biodiversity function in Chongqing section of Three Gorges Reservoir Area. Trans. Chin. Soc. Agric. Eng. 2017, 33, 258–267. [Google Scholar]
- El, K.H.; Zhang, H.; Zhang, P.C.; Mosandl, R. Soil erosion and surface runoff on different vegetation covers and slope gradients: A field experiment in Southern Shaanxi Province, China. Catena 2013, 105, 1–10. [Google Scholar]
- Zhao, M.M.; He, Z.B.; Du, J.; Chen, L.F.; Lin, P.F.; Fang, S. Assessing the effects of ecological engineering on carbon storage by linking the CA-Markov and InVEST models. Ecol. Indic. 2018, 98, 29–38. [Google Scholar] [CrossRef]
- Ma, L.B.; Bo, J.; Li, X.Y.; Fang, F.; Cheng, W.J. Identifying key landscape pattern indices influencing the ecological security of inland river basin: The middle and lower reaches of Shule River Basin as an example. Sci. Total Environ. 2019, 674, 424–438. [Google Scholar] [CrossRef] [PubMed]
- Brumm, K.J.; Jonas, J.L.; Prichard, C.G.; Watson, N.M.; Pangle, K.L. Land cover influences on juvenile Rainbow Trout diet composition and condition in Lake Michigan tributaries. Ecol. Freshw. Fish. 2019, 28, 11–19. [Google Scholar] [CrossRef] [Green Version]
- Yang, W.; Jin, Y.; Sun, T.; Yang, Z.; Cai, Y.; Yi, Y. Trade-offs among ecosystem services in coastal wetlands under the effects of reclamation activities. Ecol. Indic. 2017, 92, 354–366. [Google Scholar] [CrossRef]
- Yan, S.J.; Wang, X.; Cai, Y.P.; Li, C.H.; Yan, R.; Cui, G.N.; Yang, Z.F. An integrated investigation of spatiotemporal habitat quality dynamics and driving forces in the upper basin of miyun reservoir North China. Sustainability 2018, 10, 4625–4641. [Google Scholar] [CrossRef] [Green Version]
- Jiang, R.Z.; Li, X.Q.; Zhu, Y.A.; Zhang, Z.G. Spatial-temporal variation of NPP and NDVI correlation in wetland of Yellow River Delta based on MODIS data. Acta Ecol. Sin. 2011, 31, 6708–6716. [Google Scholar]
- Hamann, M.; Biggs, R.; Reyers, B. Mapping social-ecological systems: Identifying ‘green-loop’ and ‘red-loop’ dynamics based on characteristic bundles of ecosystem service use. Glob. Environ. Chang. 2015, 34, 218–226. [Google Scholar] [CrossRef]
- Paterson, A.; Bryan, B.A. Food-carbon trade-offs between agriculture and reforestation land uses under alternate market-based policies. Ecol. Soc. 2012, 17, 21. [Google Scholar] [CrossRef] [Green Version]
- Cumming, G.S.; Buerkert, A.; Hoffffmann, E.M.; Schlecht, E.; von Cramon-Taubadel, S.; Tscharntke, T. Implications of agricultural transitions and urbanization for ecosystem services. Nature 2014, 515, 50–57. [Google Scholar] [CrossRef] [PubMed]
- Seto, K.C.; Gneralp, B.; Hutyra, L.R. Global forecasts of urban expansion to 2030 and direct impacts on biodiversity and carbon pools. Proc. Natl. Acad. Sci. USA 2012, 109, 16083–16088. [Google Scholar] [CrossRef] [PubMed] [Green Version]
- Foley, J.A.; Ramankutty, N.; Brauman, K.A.; Cassidy, E.S.; Gerber, J.S.; Johnston, M.; Mueller, N.D.; O’Connell, C.; Ray, D.K.; West, P.C.; et al. Solutions for a cultivated planet. Nature 2011, 478, 337–342. [Google Scholar] [CrossRef] [PubMed] [Green Version]


| ES | Data Requirement Type | Unit | Data Sources |
|---|---|---|---|
| WY | Precipitation | mm | Geographic Data Cloud of Chinese Academy of Sciences |
| Potential evapotranspiration | mm | The Data Set of Global Potential Evapotranspiration and Global Drought Index | |
| Soil texture | int | HWSD Soil Database | |
| Available water content of plant | % | Generated from soil texture data | |
| Land use/cover type | int | Geographical national conditions monitoring cloud platform | |
| Catchment area/sub-catchment area distribution | int | DEM data generation | |
| Root depth of plant | mm | 1:1 million soil database of China | |
| Evapotranspiration coefficient | - | Food and Agriculture Organization of the United Nations, 1998 | |
| CS | Land use / cover type | int | Geographical national conditions monitoring cloud platform |
| Carbon density data of various land use types | t/hm2 | InVEST model, references | |
| SC | DEM | m | Geospatial Data Cloud |
| Rainfall erosivity | MJ·mm/(hm2·h·a) | Calculation based on rainfall data | |
| Soil erodibility factor | t·hm2/(MJ·mm) | Calculation based on soil texture data | |
| Land use /cover type | int | Geographical national conditions monitoring cloud platform | |
| Catchment area/sub-catchment area distribution map | int | DEM data generation | |
| Vegetation Management Factor | - | Calculation based on NDVI data | |
| Engineering measures factor | - | references | |
| HQ | Land use/ cover type | int | Geographical national conditions monitoring cloud platform |
| Major threats | - | InVEST model, references | |
| The weight of threat source factor | - | InVEST model, references | |
| Sensitivity of various land use types to stress factors | - | InVEST model, references | |
| NPP | Land use /cover type | int | Geographical national conditions monitoring cloud platform |
| NDVI | int | Earth resources observation and science center | |
| Meteorological data | int | Geographical national conditions monitoring cloud platform |
Publisher’s Note: MDPI stays neutral with regard to jurisdictional claims in published maps and institutional affiliations. |
© 2021 by the authors. Licensee MDPI, Basel, Switzerland. This article is an open access article distributed under the terms and conditions of the Creative Commons Attribution (CC BY) license (https://creativecommons.org/licenses/by/4.0/).
Share and Cite
Yang, J.; Xie, B.; Tao, W.; Zhang, D. Ecosystem Services Assessment, Trade-Off, and Bundles in the Yellow River Basin, China. Diversity 2021, 13, 308. https://doi.org/10.3390/d13070308
Yang J, Xie B, Tao W, Zhang D. Ecosystem Services Assessment, Trade-Off, and Bundles in the Yellow River Basin, China. Diversity. 2021; 13(7):308. https://doi.org/10.3390/d13070308
Chicago/Turabian StyleYang, Jie, Baopeng Xie, Wenqian Tao, and Degang Zhang. 2021. "Ecosystem Services Assessment, Trade-Off, and Bundles in the Yellow River Basin, China" Diversity 13, no. 7: 308. https://doi.org/10.3390/d13070308
APA StyleYang, J., Xie, B., Tao, W., & Zhang, D. (2021). Ecosystem Services Assessment, Trade-Off, and Bundles in the Yellow River Basin, China. Diversity, 13(7), 308. https://doi.org/10.3390/d13070308