Article

Dispersal of Silica-Scaled Chrysophytes in Northern Water Bodies

Department of Cell Ultrastructure, Limnological Institute, Siberian Branch of the Russian Academy of Sciences, 664033 Irkutsk, Russia
*
Author to whom correspondence should be addressed.
Diversity 2021, 13(7), 284; https://doi.org/10.3390/d13070284
Submission received: 29 April 2021 / Revised: 11 June 2021 / Accepted: 16 June 2021 / Published: 23 June 2021

Abstract

:
Silica-scaled chrysophytes have an ancient origin; nowadays they inhabit many northern water bodies. As the territories above the 60th parallel north were under the influence of glaciers during the Late Pleistocene, the local water bodies and their microalgal populations formed mainly during the Early Holocene. Now, the arctic, sub-arctic and temperate zones are located here and the water bodies in these regions have varying environmental characteristics. We analyzed the dispersal of silica-scaled chrysophytes in 193 water bodies in 21 northern regions, and for 135 of them determined the role of diverse environmental factors in their species composition and richness using statistical methods. Although the species composition and richness certainly depend on water body location, water temperature and conductivity, regions and individual water bodies with similar species composition can be significantly distant in latitudinal direction. Eighteen species and one variety from 165 taxa occurring here have clear affinities to fossil congeners; they have been encountered in all regions studied and amount to 6–54% of the total number of silica-scaled chrysophytes. We also compared the distribution of the species with a reconstruction of glacier-dammed lakes in the Northern Hemisphere in the Late Pleistocene–Early Holocene. The dispersal of silica-scaled chrysophytes in the northern water bodies could take place in the Late Pleistocene–Early Holocene over the circumpolar freshwater network of glacier-dammed lakes, the final Protista composition being subject to the environmental parameters of each individual water body and the region where the water body is located. This species dispersal scenario can also be valid for other microscopic aquatic organisms as well as for southerly water bodies of the Northern Hemisphere.

Graphical Abstract

1. Introduction

The golden algae of the class Chrysophyceae Pascher, families Paraphysomonadaceae Preisig and Hibberd, Mallomonadaceae Diesing and Synuraceae Lemmermann are able to form a scaled frustule of biogenic silica, and 250 such species are known in total [1]. Silica-scaled chrysophyceans are a ubiquitous group of algae and an important component of water bodies. They occur in all climatic zones, including the tropical [2,3,4,5] and arctic areas [6,7,8]. The highest species richness is, however, a feature of the temperate latitudes [9,10,11]. Inaccessibility and extreme climate are a limiting factor for such investigations in northern regions. At the same time, these organisms can dominate in the plankton of oligo- and mesotrophic waters in the North, contributing 60–80% of the total number and 50–70% of the total biomass of phytoplankton [12,13,14,15,16].
The taxonomic attribution of these organisms is based on the details of the fine structure of their silica scales visualized by means of transmission and scanning electron microscopy (TEM, SEM) [17,18,19] (Figure 1).
The siliceous elements of the frustule preserve their structure even when the cells are destroyed. They can be buried in sediments and act as evidence of the presence of a species in the ecosystem of a water body in the past. The genus Synura Ehrenberg was very likely formed before the Cambrian period of the Paleozoic era (330 mya) [20]. Ancient scales and bristles of Mallomonas Perty and Synura having various and complex structures were identified in the Eocene Giraffe Pipe sediments and in the Paleocene Wombat sediments in the area of the Lac de Gras kimberlite field in the Northwest Territories of Canada (64°44′ N, 109°45′ W; paleolatitude 62°–64° N) [21,22,23,24,25,26]. It turned out that some of the modern species identified by the structure of their scales were similar to, and some closely related to, the fossil taxa. Some fossil species are lacking a modern analogue and presumed extinct [25,26]. Data on the distribution of silica-scaled chrysophycean taxa in sediments, their abundance and stratigraphy are important for paleolimnology and paleoclimatology [27,28]. Such studies have become especially urgent due to the actual growth of silica-scaled chrysophycean populations in some boreal and arctic lakes over the last ten years, as the authors believe this could be evidence of global climate change [29,30] and CO2 concentration increase [31,32,33].
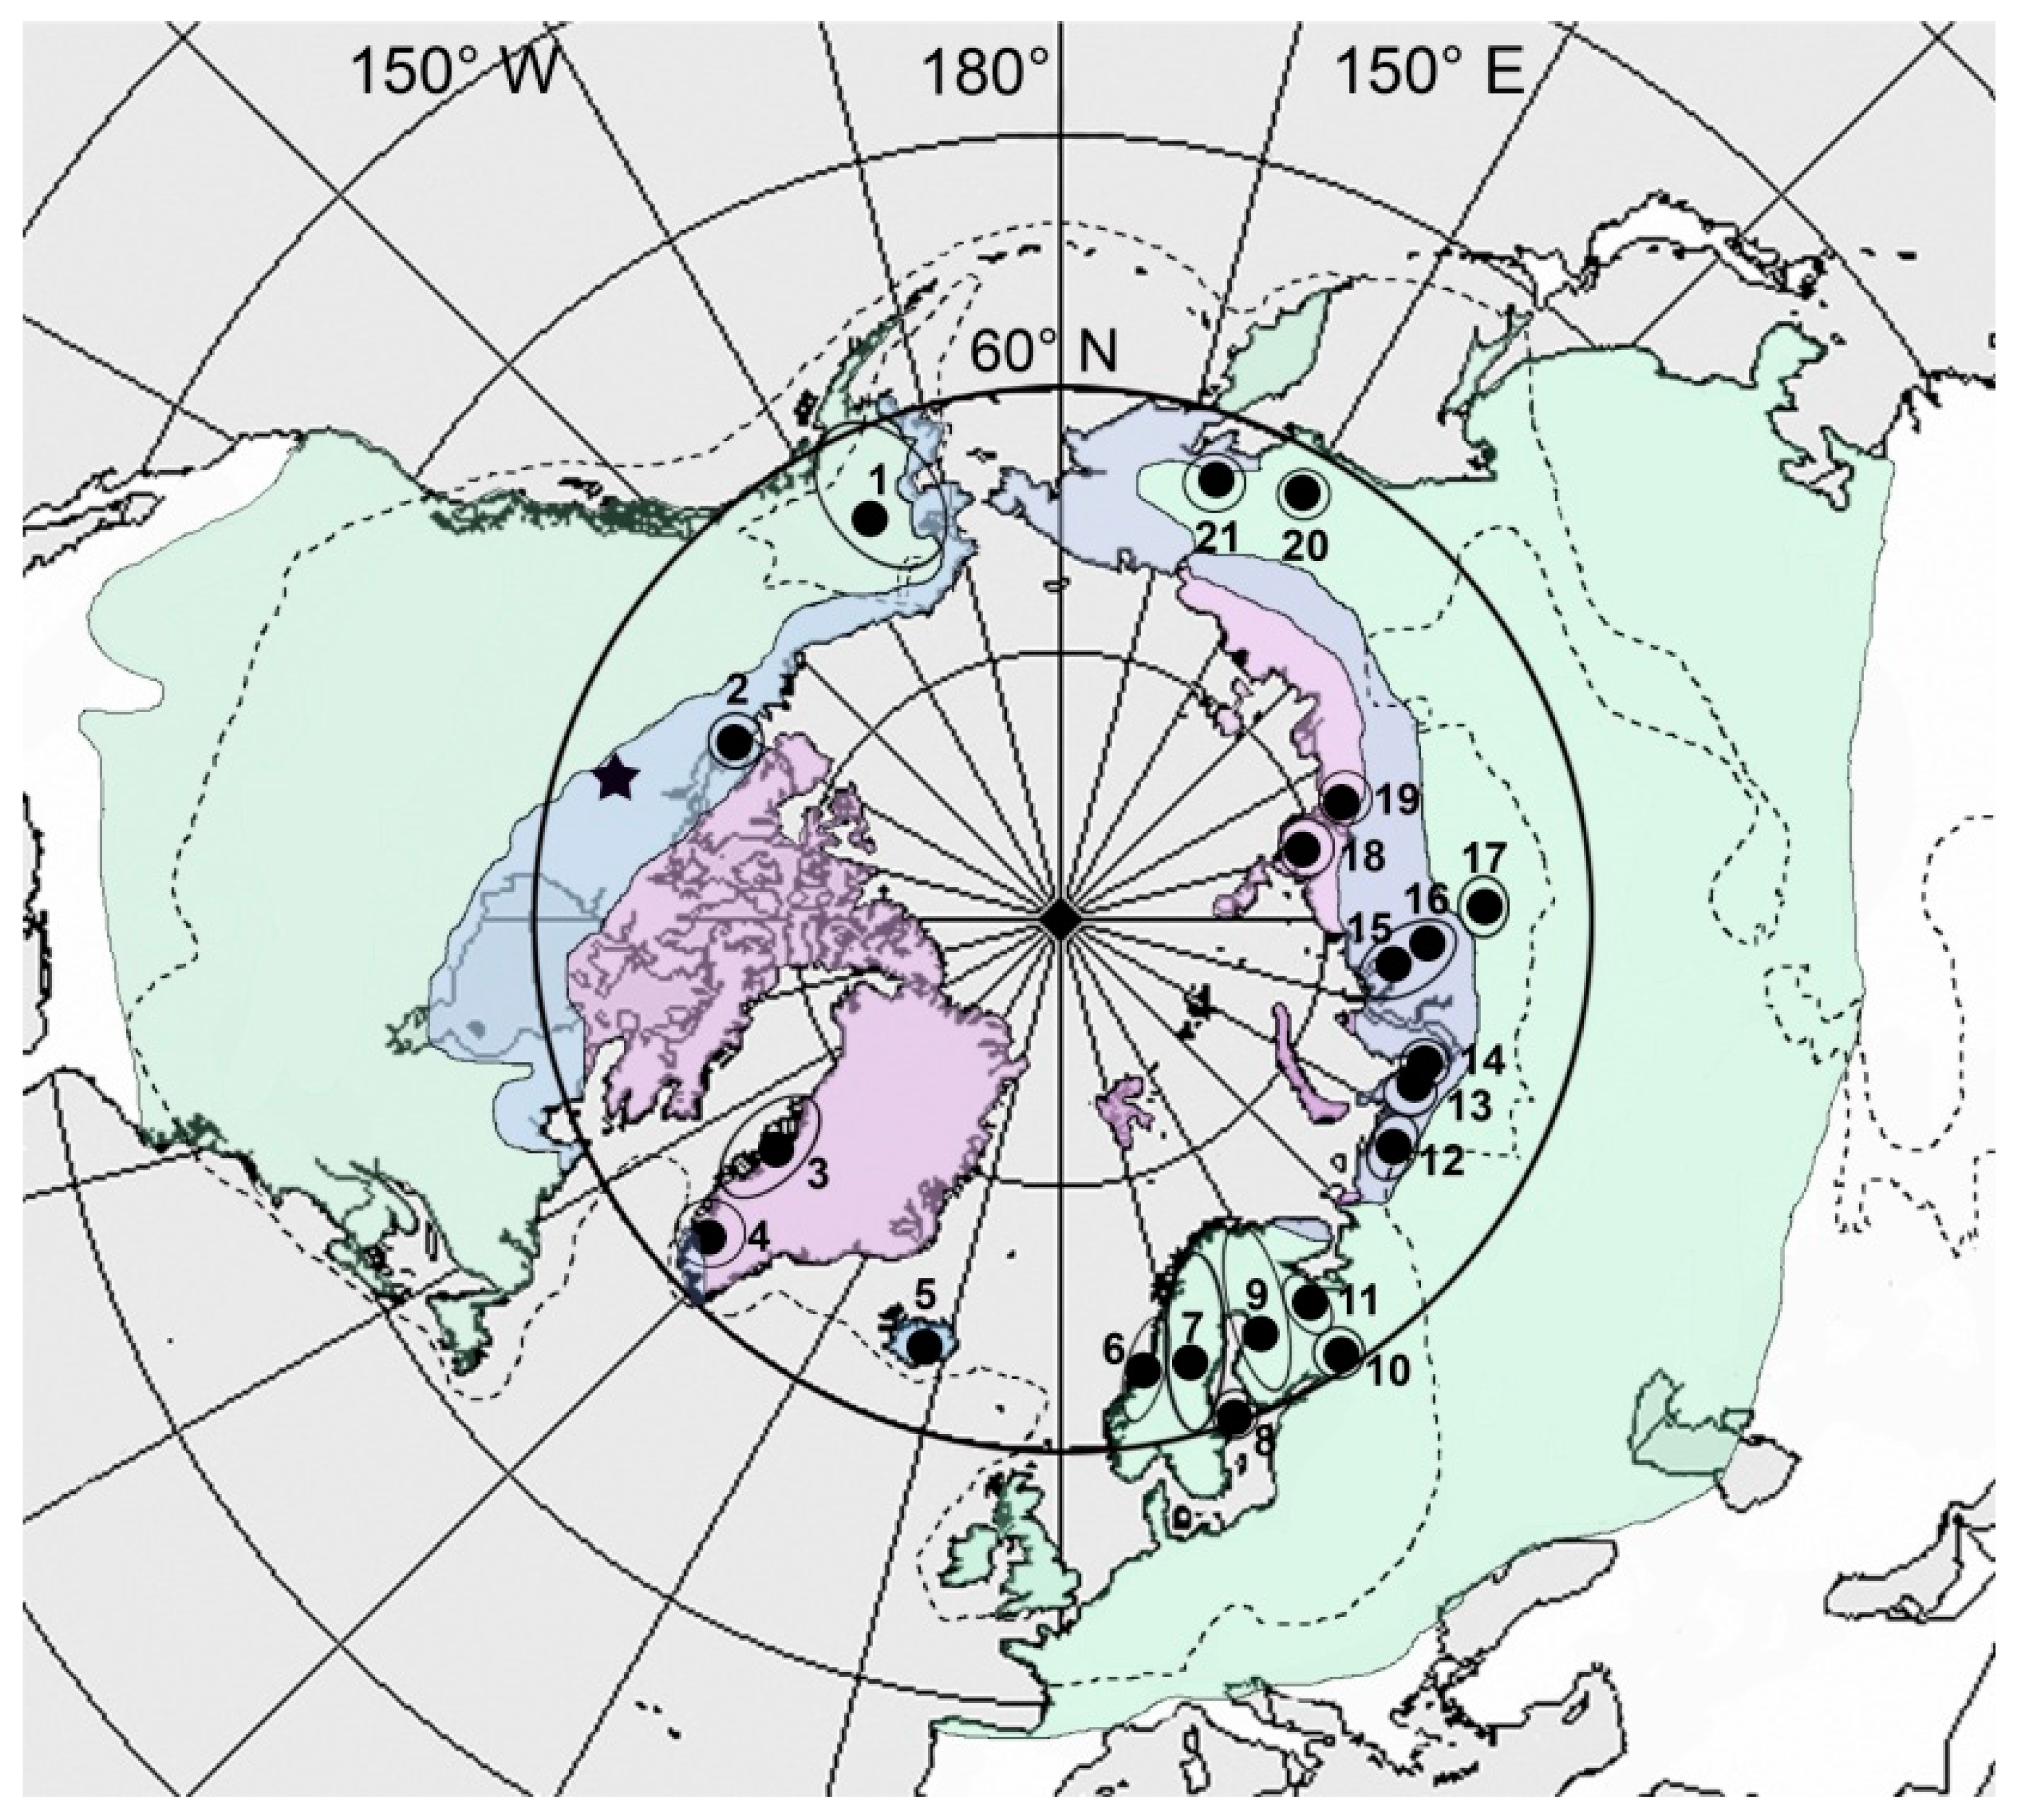
In recent years, investigations of factors and regularities of distribution of biodiversity of organisms at different levels of organization became especially relevant [34,35,36,37,38]. Such investigations are not only of ecological but also evolutionary importance [36]. Geographical, physicochemical, climatic and historical factors may be the most important for the distribution of protists [34,36,37,38]. The majority of these investigations deals with the analysis of biotopes either within one continent [36,37] or within one water body [34,38]. Although there are few studies studies on intercontinental factors and regularities influencing the distribution of protists [35,39,40]. Studies are of great interest due to the last Pleistocene glaciation 18,000–22,000 years ago when the Arctic region was covered with ice sheets [41,42,43,44,45,46,47,48] (Figure 2), with the exception of the Vashutkiny lakes [49,50].
Nowadays, three climatic zones (arctic, sub-arctic and temperate) are located above the 60th parallel north and near the Northern Polar Circle [48].
Since most of the modern lakes located here emerged after the deglaciation in the Early Holocene, we set up the following aims: (1) to compare the current taxonomic structure of silica-scaled chrysophytes in these water bodies; (2) to explore the degree to which these water bodies have inherited the ancient Eocene and Paleocene Protista of silica-scaled chrysophytes as a marker of the magnitude of dispersal of silica-scaled chrysophytes; (3) to identify the main factors that could determine species richness, species composition and dispersal of silica-scaled chrysophytes in northern water bodies.

2. Materials and Methods

2.1. Site Locations

The studied area is located between 18° and 165° W and between 0° and 154° E, above the 60th parallel north (Figure 2). The boundaries of distribution of ice sheets are given according to M.G. Grosswald (2009) [47]. The localization of glacier-dammed lakes throughout the period of their existence as well as the direction of rivers were reconstructed by the authors according to published data [45,84,85,86,87,88,89,90].
We analyzed our published data as well as the data of other authors (references in Table 1); the total number of analyzed water bodies where silica-scaled chrysophytes were found amounted to 193 (Supplementary Material S1).

2.2. Statistical Analysis

Data preparation and missing value corrections. A summary table of species and habitat parameters metadata (water temperature [T], pH, conductivity, sampling region and month) is given in Supplementary Material S1. All data were assembled into a table (Supplementary Material S1) whose rows correspond to the sampling sites and columns correspond to the measured parameters. The presence or absence of a species in the table is coded by 1 and 0. All characteristics are given as dependent variables (presence or absence of species in samples, and species richness) and explanatory variables (T, pH, conductivity, sampling region and month).
The statistical analysis of the impact of habitat parameters on the species richness and species composition of silica-scaled chrysophytes only included the water bodies where three or more species of algae were found (135 water bodies).
When combining data from different sources into one body of metadata, some features of the studied objects were found to be absent (e.g., T, pH, conductivity, or sampling month). We decided not to exclude samples with missing data from the multidimensional statistical analysis because this approach reduces statistical power and increases the systematic bias of the estimate [91,92,93]. We took the mean value for waters with unknown quantitative temperature, conductivity and/or pH values, and used random values from the list of known values for missing qualitative data (sampling month) according to the authors’ guidelines [94,95].
Analysis of the relationship between species composition andexplanatory variables. The explanatory variables in the analysis of variables (T, pH, conductivity, sampling month and sampling region) form 31 potential linear combinations (Supplementary Material S2). We applied the PERMANOVA analysis [96] based on the Jaccard dissimilarity metric matrix, carried out in the “vegan” package for the R programming language with user’s scripts [97] to detect the linear combination of explanatory variables that could reliably determine the species composition in the samples. Based on the algorithm proposed by [98], we calculated the R2 coefficient and Akaike information criterion for small sample sizes (AICc) for each linear combination of explanatory variables. The linear combination with the minimal AICc value contained a set of explanatory variables that reliably affected the species composition of algae in the samples. The other variables had no reliable influence on species richness.
In order to test the influence of the different number of localities within regions, a separate PERMANOVA analysis was carried out. A quantitative characteristic was used to define this factor, i.e., the number of samples entering the region, which was matched to each sample within the region. Such a check was necessary in order to exclude the possibility of revealing the reliability of the influence of the region on the species composition because of the different number of samples in the studied regions.
Data visualization and cluster analysis. The table indicating the presence or absence of species in individual waters (135 water bodies where three or more species occur) was visualized as a heat map in the “gplot” package of the R programming language.
We grouped samples into 21 regions (see Section 2.1) and made lists of species that occurred at least once in one water body within a region. The lists were summarized into a table in which 0 means the absence and 1 means the presence of a species in a region. The table was visualized as a heat map in the “gplot” package of the R programming language.
The average (UPGMA) method based on the Jaccard dissimilarity metric was used for clustering and ordering of rows and columns in the heat map.
Analysis of the impact of abiotic environmental factors on species richness. The impact of abiotic environmental factors (T, pH and conductivity) on species richness was determined by means of linear regression analysis with the following regression models: linear regression (y = ax + b); second degree polynomial (y = ax2 + bx + c); third degree polynomial (y = ax3 + bx2 + cx + d); exponential dependence (y = exp (ax + b)); logarithmic dependence (y = log (ax + b)). The best regression model was chosen by the AICc value (minimal AICc value for the best model) [99]. For the best regression model chosen, we calculated the R2 covariance coefficient and estimated its reliability by means of the F-test (F). We assumed that the regression model indicated interdependence at p < 0.05. The regression analysis and visualization were done using the standard function set of the R programming language according to the guidelines [99]. When analyzing the impact of conductivity, we used only the data of the water bodies where the conductivity corresponded to freshwater values.
To estimate the relationship of species richness with qualitative abiotic factors (sampling month and sampling region), we applied an analysis of variance (ANOVA) based on F. The impact of a factor was considered reliable at p < 0.05. Standard R programming language functions were used for the analysis. Additionally, ANOVA was carried out to analyze the relationship between species richness and number of samples entering the region. Such a check was necessary in order to exclude the possibility of revealing the reliability of the influence of the region on species richness due to an unequal number of samples in the regions.

3. Results and Discussion

3.1. Species List and Geographical Distribution

The studied regions were inhabited in total by 165 species and intraspecific taxa of silica-scaled chrysophytes (Supplementary Material S3). Some previously identified species were brought to synonymy, and the species composition is given in Supplementary Material S3 with due revision. More than one half of taxa (86 [52%]) are represented by Mallomonas. Paraphysomonas De Saedeleer, Synura, Spiniferomonas Takahashi, and Chrysosphaerella Lauterborn accounted for 29 species (18%), 27 species (16%), 17 species (11%) and 4 species (2%), respectively. The genus Neotessella Jo, Kim, Shin, Škaloud and Siver was represented by a single species N. lapponica, and the monospecific genus Polylepidomonas Preisig and Hibberd was represented by the species P. vacuolata.
The analysis of geographical types of species distribution according to J. Kristiansen (2000, 2008) [100,101] showed that 75 taxa (45%) were widespread and cosmopolitan, 50 (30%) were arctoboreal, and the rest were either bipolar, rare, or had a scattered distribution (Supplementary Material S3).
Representatives of 18 species occurred most frequently in the 21 regions, namely Mallomonas crassisquama (in 19 regions), Synura petersenii (in 19), M. akrokomos (in 18), Spiniferomonas trioralis (in 16), M. striata (in 15), Chrysosphaerella brevispina (in 15), C. coronacircumspina (in 15), M. acaroides (in 15), M. heterospina (in 15), Paraphysomonas vestita (in 14), M. alpina (in 14), Synura spinosa (in 14), M. tonsurata (in 13), M. caudata (in 13), M. punctifera (in 13), Spiniferomonas bourrellyi (in 13), M. elongata (in 12) and C. longispina (in 12). These taxa, according to the published data, occur in a wide range of geographical locations (Supplementary Material S3) and water temperatures, pH and conductivities (Supplementary Material S1).
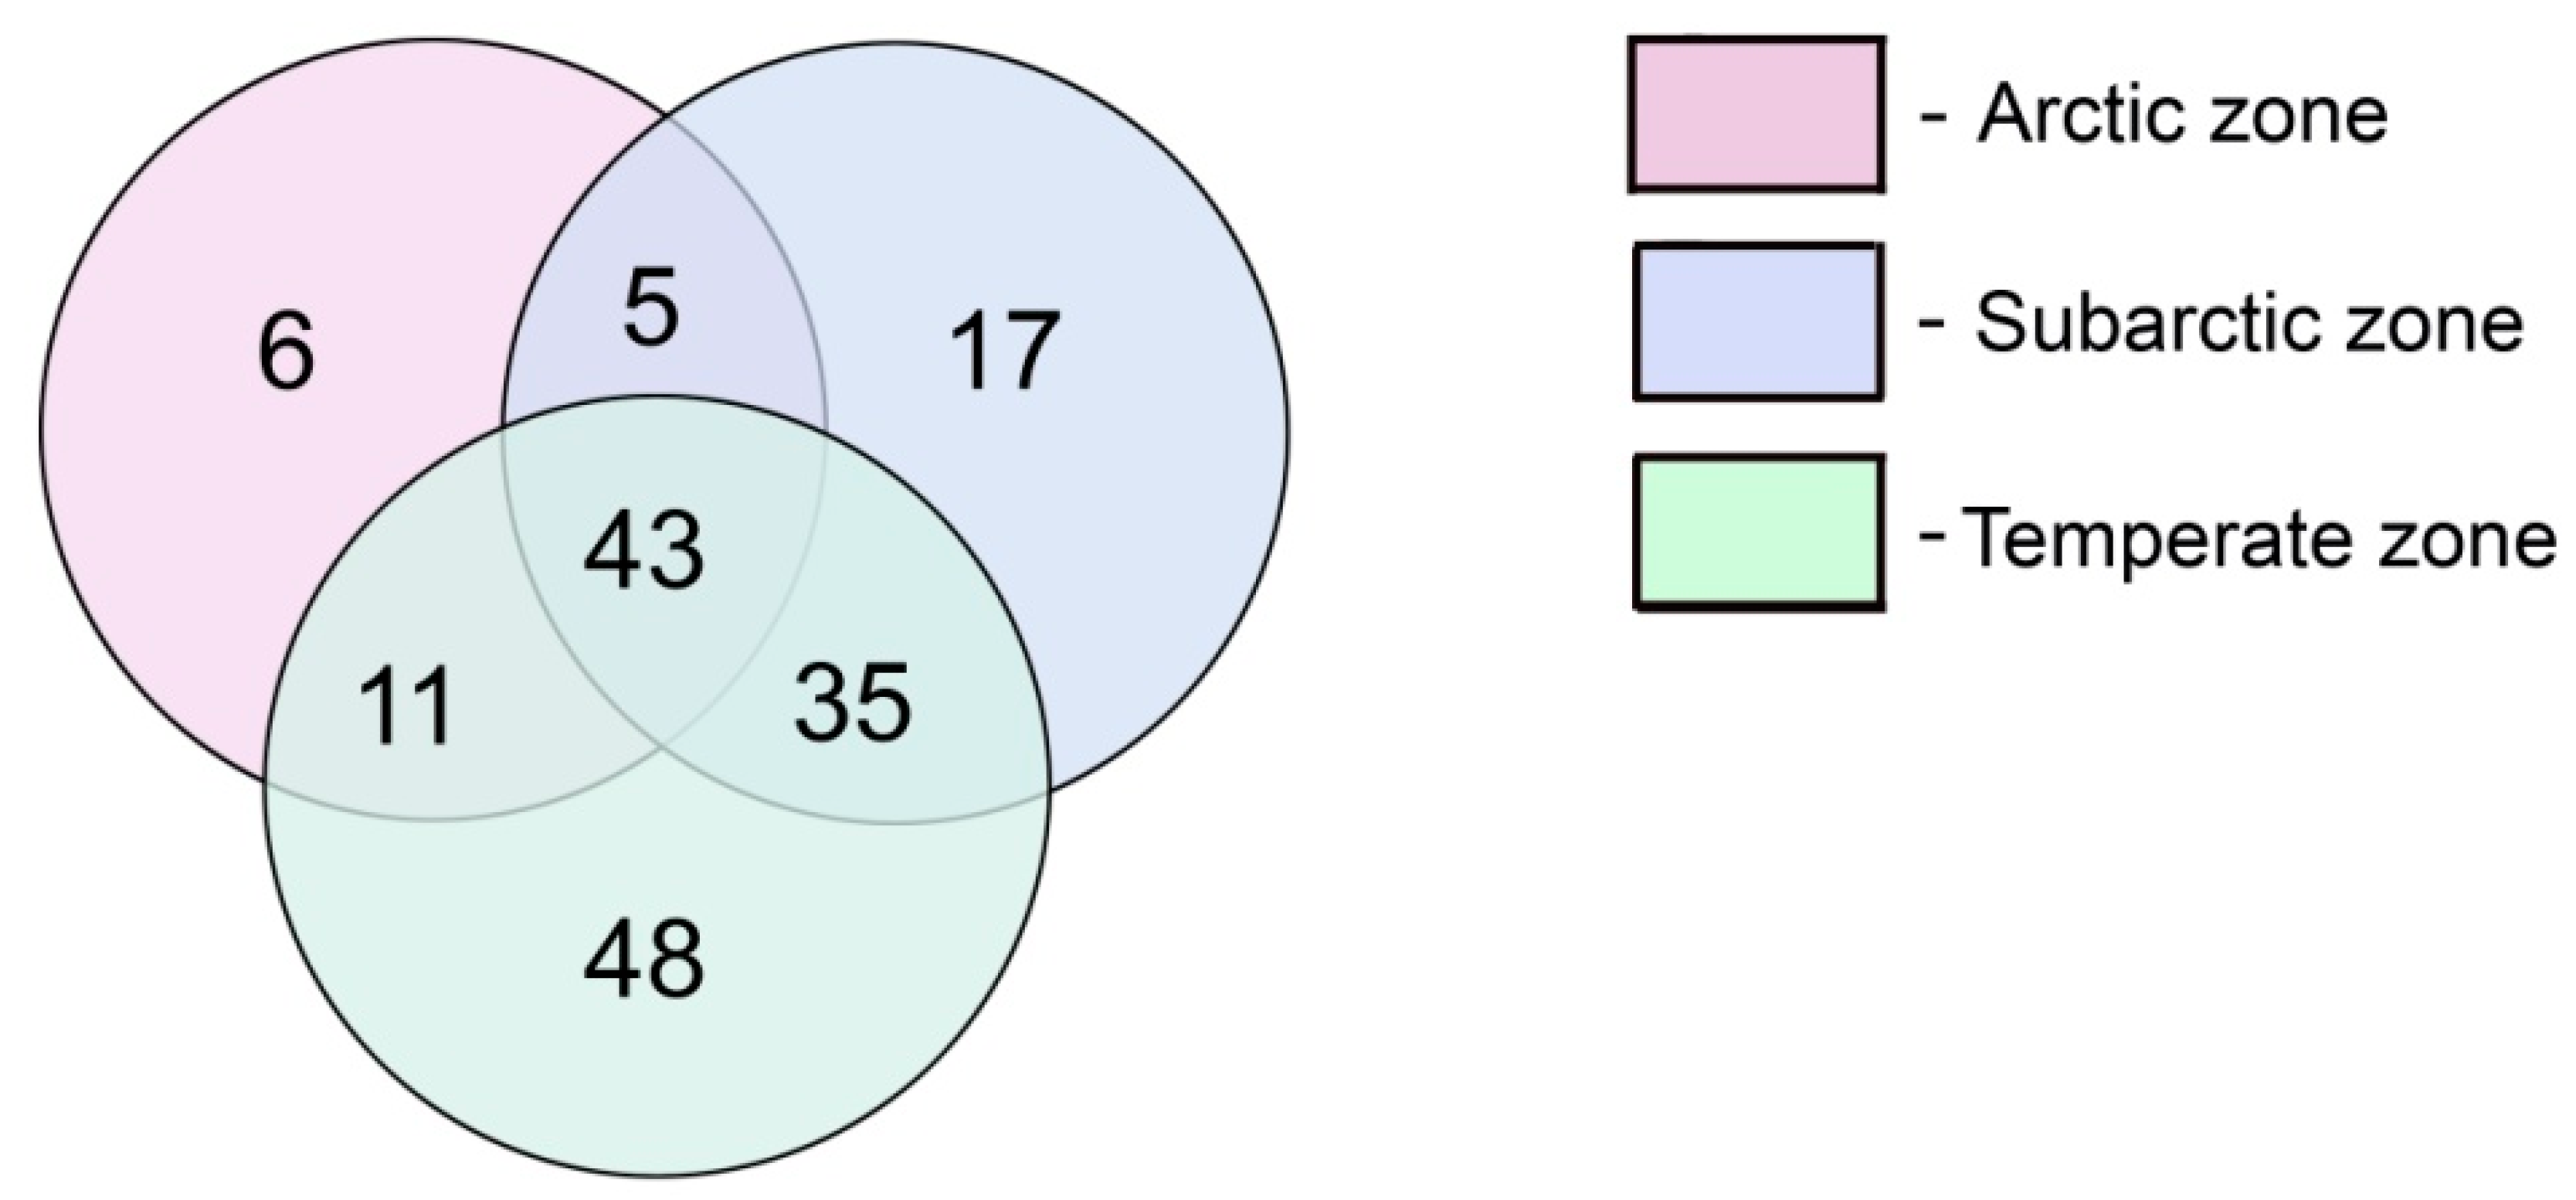
The analysis of species distribution based on climatic zones demonstrated that 43 of 165 taxa were present in water bodies of all three climatic zones—arctic, subarctic and temperate. Thirty-five taxa occurred in the subarctic and temperate zones; 48 taxa were encountered only in the temperate zone; 11 taxa were present in the arctic and temperate zones; 5 taxa were present in the arctic and subarctic zones; 17 taxa were present only in the subarctic zone; and 6 taxa were present only in the arctic zone (Figure 3). Additionally, T in the water bodies of the temperate, subarctic and arctic zones varied between 0 and 23 °C, 7.5 and 19.7 °C, and 7 and 15 °C, respectively, showing a pronounced zonality (Supplementary Material S1).
Thus, the geographical distribution analysis showed that silica-scaled chrysophytes have no strict distribution over the climatic zones in the northern regions, and 57% of species occur in the water bodies of 2–3 zones.

3.2. Fossil Species in Current Water Bodies

Eighteen species and one variety of silica-scaled chrysophytes having clear affinities to fossil congeners from Eocene [21,22,26] and Paleocene deposits [25] of Canada inhabited the studied regions. Seven species had a scale structure similar to a fossil taxon, these being Chrysosphaerella brevispina, C. coronacircumspina [21], Mallomonas insignis, M. asmundiae, Synura nygaardii, S. macracantha [26] and S. petersenii [25]. It is noteworthy that five of the seven species similar to a fossil taxon were also widespread or cosmopolitan species: Mallomonas insignis, M. asmundiae, Chrysosphaerella brevispina, C. coronacircumspina and S. petersenii, while two species, Synura macracantha and S. nygaardii, are arctoboreal. The Protista of silica-scaled chrysophytes from the analyzed regions (Figure 4 and Supplementary Material S3) were characterized by the presence of 11 species and one variety that had their scale structure closely related to the fossil taxa, namely: Mallomonas matvienkoae (=M. pleuriforamen P.A. Siver, Lott, B.Y. Jo, W. Shin, H.S. Kim and R.A. Andersen, in: Siver et al., 2015, Figure 5E). M. mangofera f. foveata (=Mallomonas GP1, in: Siver et al., 2015, Figure 7D), M. caudata (=M. pseudocaudata Siver and Wolfe, in: Siver et al., 2015, Figure 5H), M. oviformis (=Mallomonas GP19, in: Siver et al., 2015, Figure 5F), M. eoa (=Mallomonas GP2, in: Siver et al., 2015, Figure 7C), M. multisetigera (=M. ampla Siver and Lott, in: Siver et al., 2015, Figure 8D), M. paludosa (=Mallomonas aperturae, in: Siver, 2018, Figures 3–8), M. lelymene (?) (=M. giraffensis Siver and Wolfe, in: Siver et al., 2015, Figure 7H), M. alpina (=Mallomonas GP11, in: Siver et al., 2015, Figure 9D), Synura uvella (=S. recurvata Siver and Wolfe, in: Siver et al., 2015, Figure 5C) [26,102].
The fossil species M. lancea Siver, Lott and Wolfe had a scale structure that was simultaneously similar to two modern species, M. intermedia and M. corcontica [26]. The most frequently occurring of the fossil species in the current water bodies were M. alpina (in 14 of 21 regions studied), M. caudata (in 13) and S. uvella (in 9). Three species were arctoboreal: M. eoa, M. intermedia and M. lelymene. The remaining 8 species and one variety were either cosmopolitan or widespread (Supplementary Material S3).
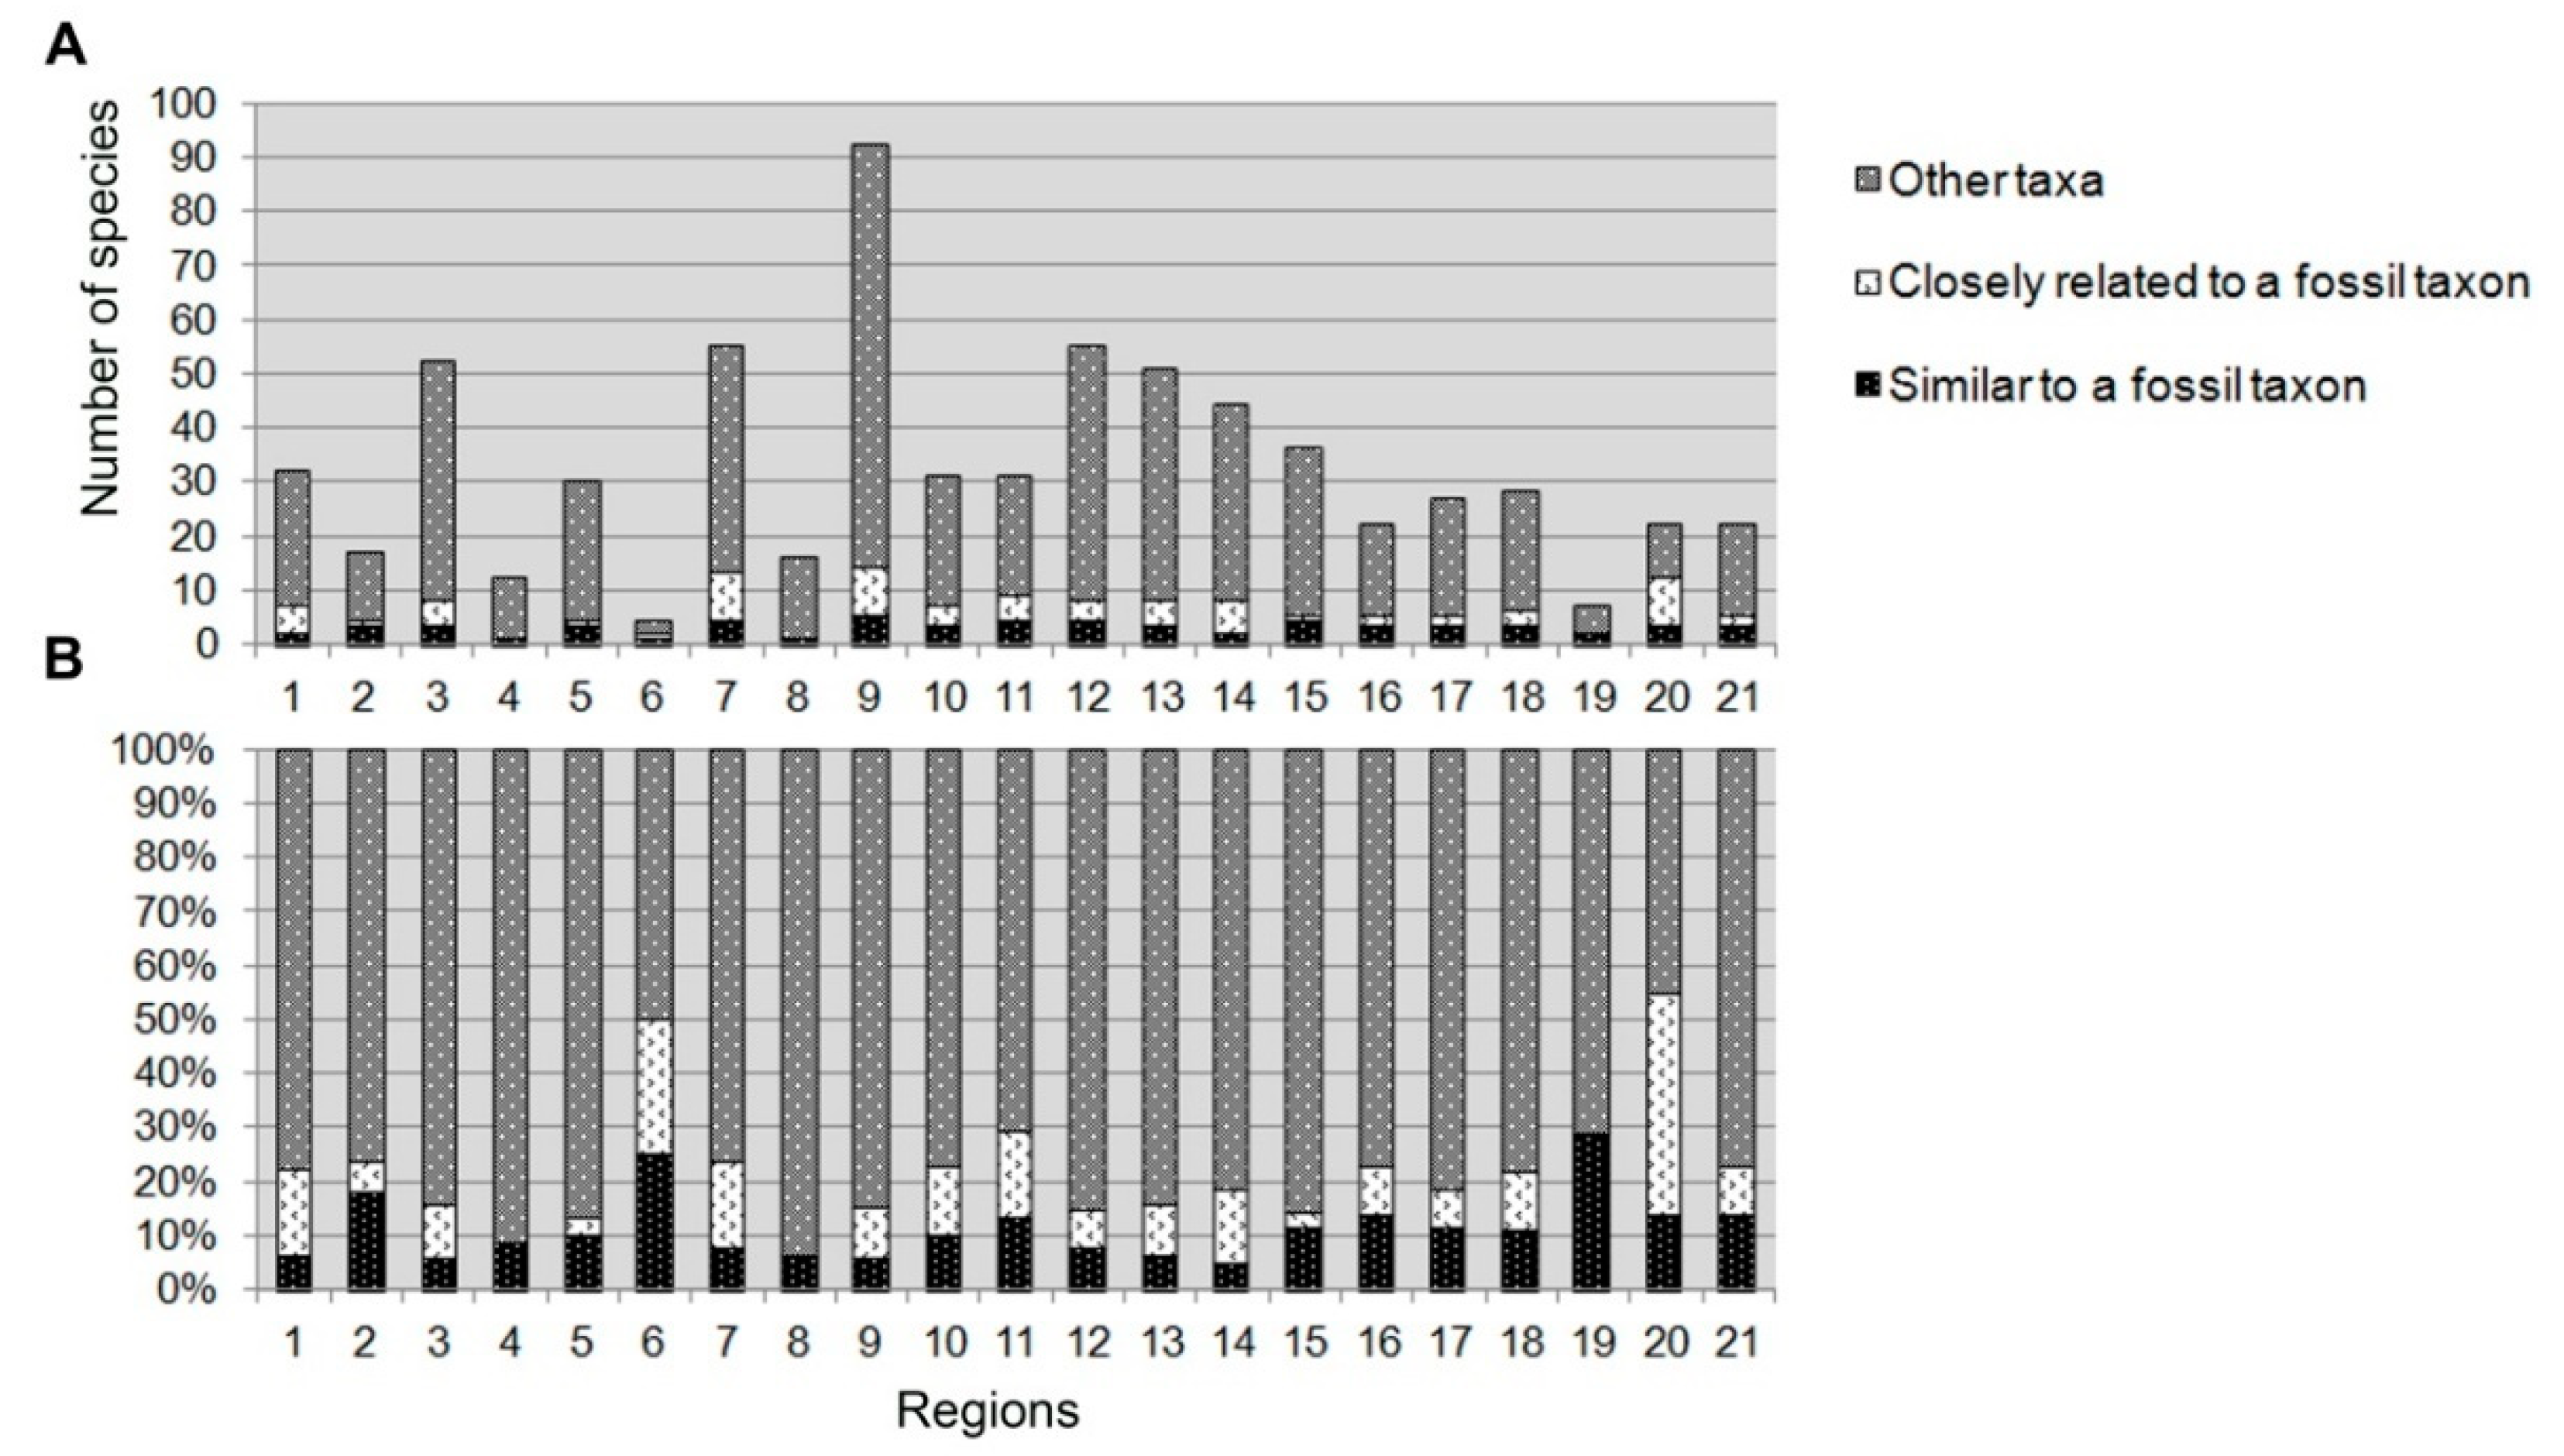
As can be seen from Figure 4A, most of the fossil species are included in the species lists of Regions 7 (Sweden), 9 (Finland) and 20 (Russia, Eastern Yakutia)—13, 14 and 12, respectively. The contribution of the fossil species to the Protista of silica-scaled chrysophytes varied between 6% and 54% by region, (Figure 4B), the biggest being in Region 20 (Russia, Eastern Yakutia), which is significantly distant from the Giraffe and Wombat kimberlite deposits (Figure 2). It reached 50% in Region 6, but only 4 species occurred there.
To sum up, all the regions are characterized not only by the presence of modern silica-scaled chrysophytes, but also by the presence of species having affinities to the Paleocene and Eocene Protista identified earlier in the western part of the Northern Hemisphere [25,26,102].

3.3. Regional Peculiarities of the Protista

A preliminary PERMANOVA analysis showed that the number of samples entering the region within the analyzed data set does not significantly affect the species composition at the sampling points (R2 = 0.0108, p = 0.0735 > 0.05). Therefore, in further analysis, we could neglect errors in the interpretation of the analysis result associated with a different number of localities within regions.
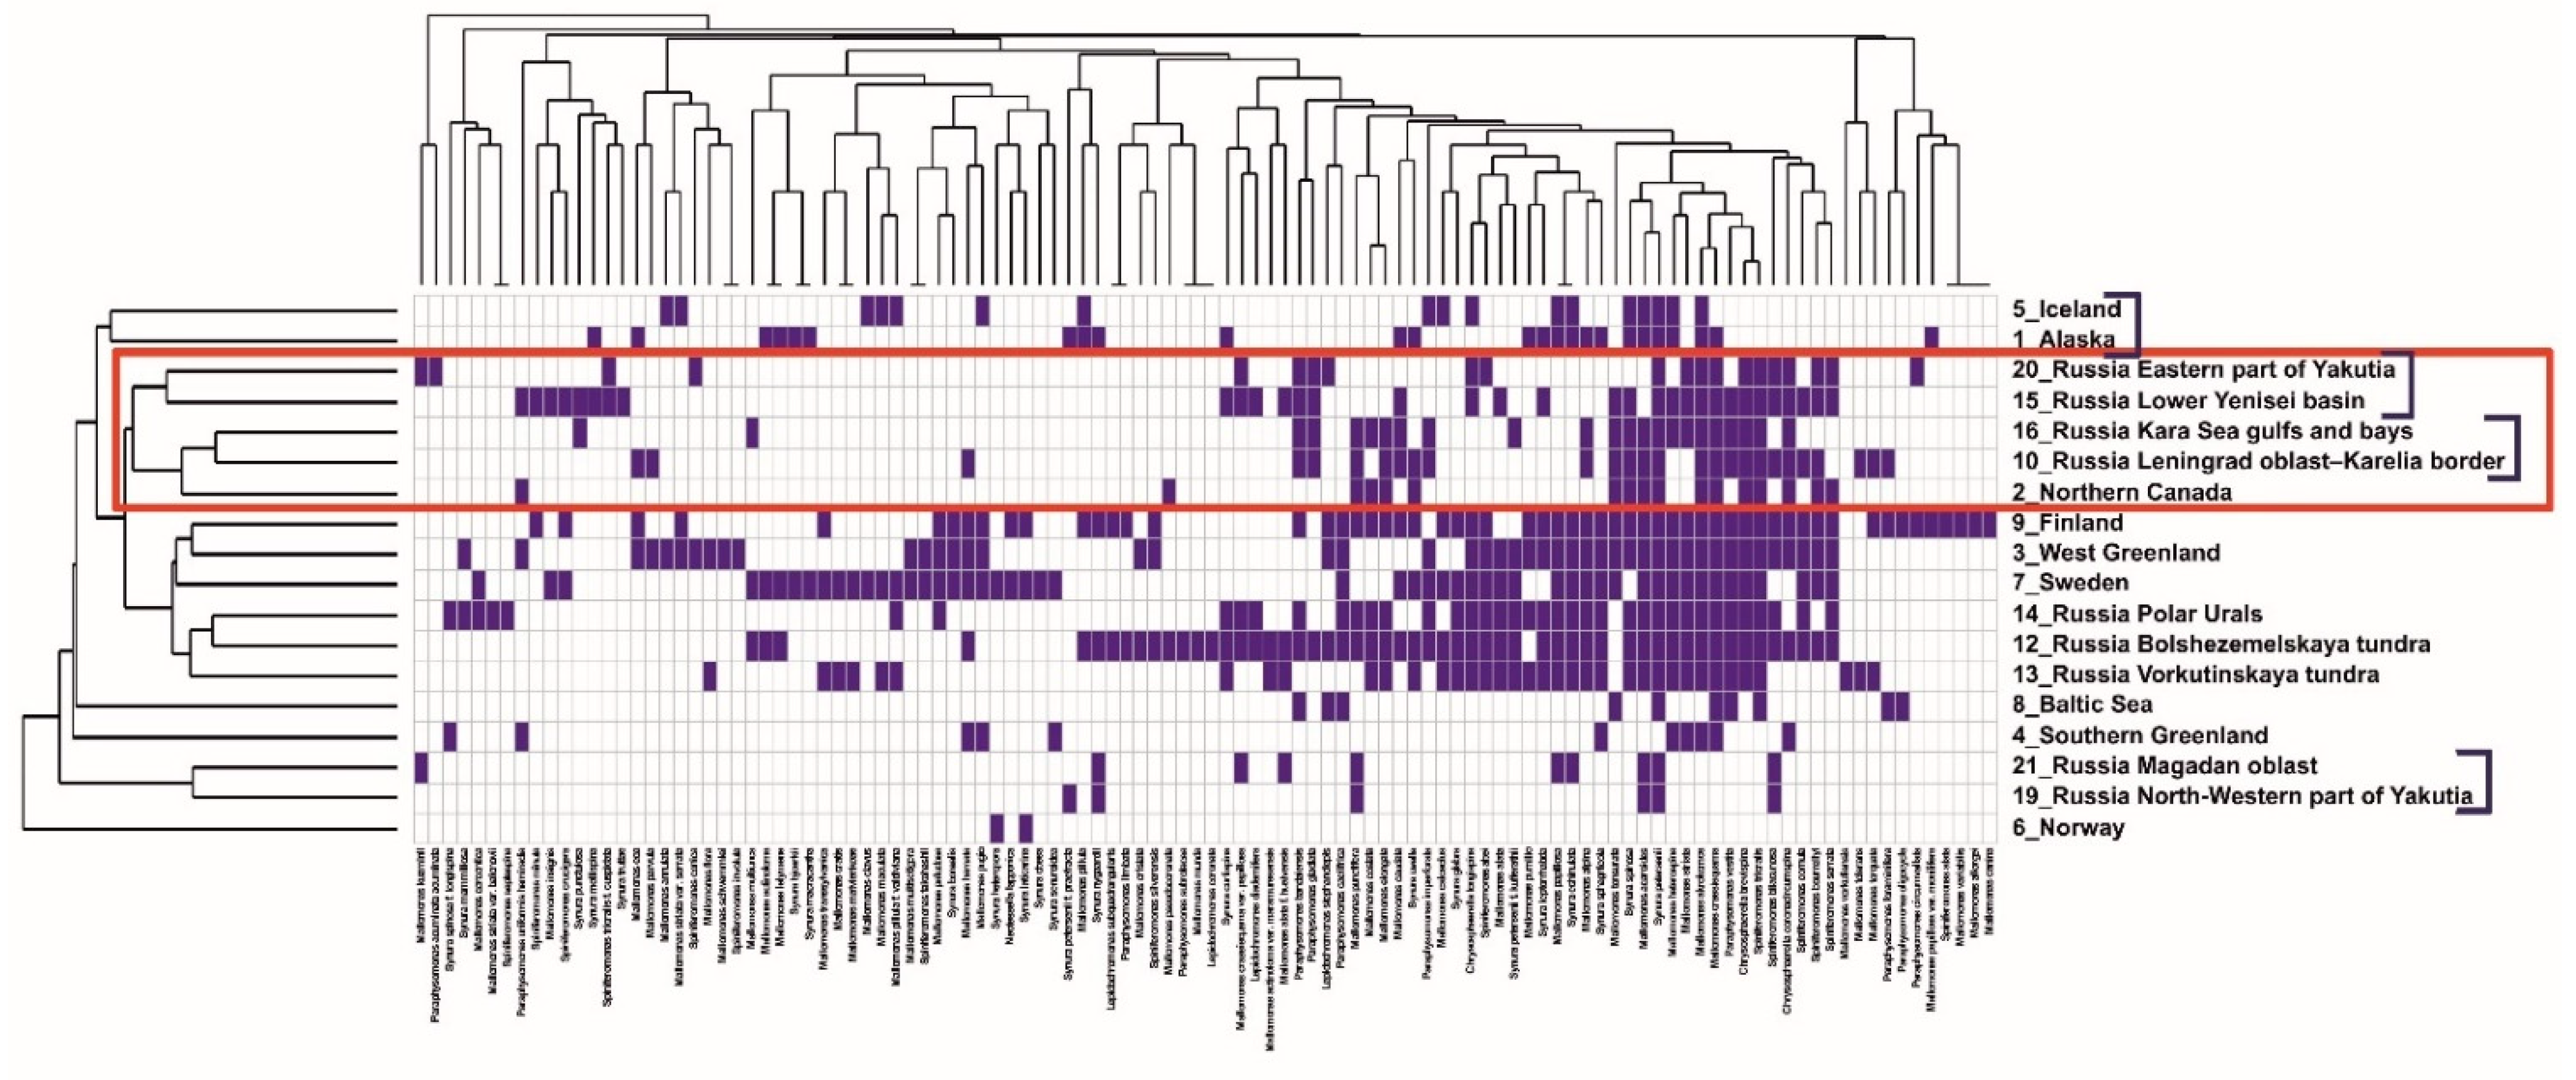
Table 2 shows a reliable influence of water body location (sampling region) on the species composition of silica-scaled chrysophytes (p < 0.05 from PERMANOVA analysis). This was also confirmed by the UPGMA dendrogram (Supplementary Material S4), which shows that water bodies of the same region usually cluster together, while the regions have different species compositions (Figure 5). Overall, each region had regional peculiarities in the flora.
We hereby discuss some examples from the species list (Supplementary Material S3) and the UPGMA dendrogram (Figure 5).
Waters of Region 9 (Finland) are the most studied; they have the highest species richness of silica-scaled chrysophytes (92 species; Table 1). The species Mallomonas mangofera, M. mangofera var. gracilis, M. scrobiculata, M. torquata var. simplex, M. trummensis, M. zellensis, Clathromonas subrotacea, Paraphysomonas circumvallata and P. caelifrica were found only in waters of this region. There were many arctoboreal species (30%).
Region 3 (West Greenland) is the closest to Finland in terms of the species composition of silica-scaled chrysophytes (Figure 5); there is also a variety of rare arctoboreal species like M. hamata, M. pillula f. exannulata, Mallomonas pillula var. latimarginali, M. schwemmlei, M. teilingii, M. cristata, M. duerrschmidtiae. Additionally, waters of the region abound in species of the genus Spiniferomonas, particularly in arctoboreal S. cornuta, S. conica, S. serrata, S. silverensis and rare S. involuta. The species Paraphysomonas stephanolepis and Synura mammillosa are also found only there.
Region 7 (Sweden) unites into the same cluster with those two regions (Figure 5). It is notable for a high total number of arctoboreal species (15 species, 27%); some of them, namely Clathromonas diademifera, C. elegantissima, Synura senuroidea, S. obesa, Mallomonas rasilis, M. pumilio var. dispersa and M. mangofera f. foveata, occur only in waters of Sweden. The species of the genera Mallomonas, Spiniferomonas and Synura are various. The rare arctoboreal species of genus Synura, namely S. bjoerkii and S. macracantha, that were previously found in waters of Alaska, also occur there.
The peculiarity of Region 1 (Alaska) is the absence of species of the genera Paraphysomonas, Lepidochromonas and Spiniferomonas. Waters of the region abound in species of the genus Synura, including rare arctoboreal species like S. mollispina, S. macracantha, S. bjoerkii and the rare bipolar species S. petersenii f. praefracta. Two of the abovementioned rare species, S. macracantha and S. bjoerkii, occur in the same water body located near the town of Napaskiak.
Region 12 (Russia, Bolshezemelskaya tundra), Region 14 (Russia, Polar Urals) and Region 13 (Russia, Vorkutinskaya tundra) have a high variety of species from the genera Synura and Spiniferomonas. There are no species of the genus Lepidochromonas in Region 13 and Region 14. Region 13 is rich in species of silica-scaled chrysophytes. The species Mallomonas vorkutiensis occurs only in that region.
The cladogram (Figure 5) shows two regions that differ considerably in the species composition of silica-scaled chrysophytes—Region 8 (Baltic Sea) and Region 4 (Southern Greenland). A feature of the first region is a variety of species of the genera Paraphysomonas and Lepidochromonas (11 species in total, comprising 69% of all species found there), with Lepidochromonas diademifera and L. elegantissima being found only in that region. Region 4 (Southern Greenland) differs in the absence of species of the genera Lepidochromonas and Spiniferomonas, and the genus Paraphysomonas is represented only by one ubiquitous species, P. uniformis hemiradia. On the other hand, the species M. doignonii has been described only in this region.
The rare arctoboreal species Paraphysomonas limbata and Spiniferomonas conica are found in Region 20, while Synura mollispina, S. papillosa, S. punctulosa, S. truttae, Spiniferomonas minuta and Mallomonas pseudomatvienkoae are found in Region 15.
The presence of the rare arctoboreal species Synura senuroidea is a regional feature of Region 5 (Iceland).
Thus, despite the presence of ubiquitous taxa as well as closely related and similar-to-fossil taxa in almost all regions, regional peculiarities can be traced in the flora of silica-scaled chrysophytes.

3.4. Differences in the Species Composition of Geographically Adjacent Water Bodies

According to the UPGMA dendrogram, individual water bodies/samples in any given region can differ in species composition and cluster apart regardless of the regional peculiarities of the flora (Supplementary Material S4).
We hereby examine the most-studied water bodies, e.g., those of Sweden (Region 7) in the area of Swedish Lapland. Small water bodies grouped by the author into five groups according to their geographic proximity were studied in this area [62]. Only four species were found in the group “Water bodies closest to Abisko” (Supplementary Material S4), while 23 species were identified in small reservoirs near the road towards Kiruna. The bedrock of these two groups belongs to the same type of phyllitic and quartzitic rocks [103]. The environment parameters differed between these two groups. T, pH and conductivity in the water bodies closest to Abisko were 12.1 °C, 7.8, and 125 μS cm−1, respectively, while these parameters were lower in the reservoirs near the road towards Kiruna, with T, pH and conductivity being 9–11 °C, 6.3–6.7 and 38–77 μS cm−1, respectively. Multiyear investigations by some authors [62,69,104,105,106,107] of the dependence of vegetation of some species of silica-scaled chrysophytes on specified pH values evidenced that even a moderate change in this parameter can influence both abundance and species diversity [62]. As the authors [62] noted, some species found in these groups of water bodies agreed with the traditional autecology [106] concerning the pH values. For example, species typical of slightly acidic and neutral pH values, i.e., acidophilic, acidobiontic and indifferent species Chrysosphaerella longispina, Mallomonas heterospina, M. caudata, M. crassisquama, Synura sphagnicola and S. echinulata occurred in the group “Reservoirs near the road towards Kiruna”. The alkaliphilic M. tonsurata and indifferent M. caudata were recorded in the group “Water bodies closest to Abisko”. As 40 μS cm−1 [106] is considered to be the optimal conductivity value at which maximum diversity of silica-scaled chrysophytes occurs, it is no surprise that the threefold increase in conductivity (up to 125 μS cm−1) significantly reduced species richness in the group “Water bodies closest to Abisko”. Differences in temperature seemed not to affect the species composition of silica-scaled chrysophytes in these water bodies as they were within the optimal values for vegetation, i.e., below 12 °C [106]. Only two of 25 species recorded were shared between these two groups of water bodies, the cosmopolitan Mallomonas caudata (closely related to the fossil taxa) and the widespread M. striata.
Although differences in species composition can be observed in waters with differing physical and chemical parameters, close water bodies with similar parameters can also differ in species richness and composition. We take the example of the waters of Region 14 (Russia, Polar Urals). The environmental parameters in the Bolshoye Schjuchie Lake and Usvaty Lake had similar values. T and pH were 13 °C and 7.0 in Bolshoye Schjuchie Lake, and 12.0 °C and 7.0 in Usvaty Lake, respectively. Ten species were recorded in Bolshoye Schjuchie Lake and seven in Usvaty Lake [76]. Nevertheless, only two species, Synura petersenii (species similar to a fossil taxon) and Mallomonas striata (widespread species), of 15 found there, were shared between these two lakes (Supplementary Material S3 and S4).
Thus, the water bodies located in the same latitude and in the same region having different or similar environment parameters can differ in species richness and composition.

3.5. Estimation of Environment Parameters Influencing Species Composition and Richness

The results of the PERMANOVA analysis with selection of the most reliable linear combination of abiotic factors affecting the species composition of algae (see Table 2, Supplementary Material S4) demonstrated that the minimal AICc value was observed at the sampling region and sampling water temperature combination (community ~ regions + T). The AICc value for this model (AICc = 526.46) was less than for the model including all qualitative and quantitative abiotic factors considered for this paper (AICc = 536.61; see Table 2). We may conclude that only two factors, T and sampling region, of all those considered (T, pH, conductivity, sampling month and sampling region), reliably affected the species composition. The factors T and sampling region can be permuted: regions + T и T + regions. The analysis of these two permutations (Table 2) showed that the sampling region was the factor with the highest R2 value, while the temperature played a much less considerable, although statistically significant, role.
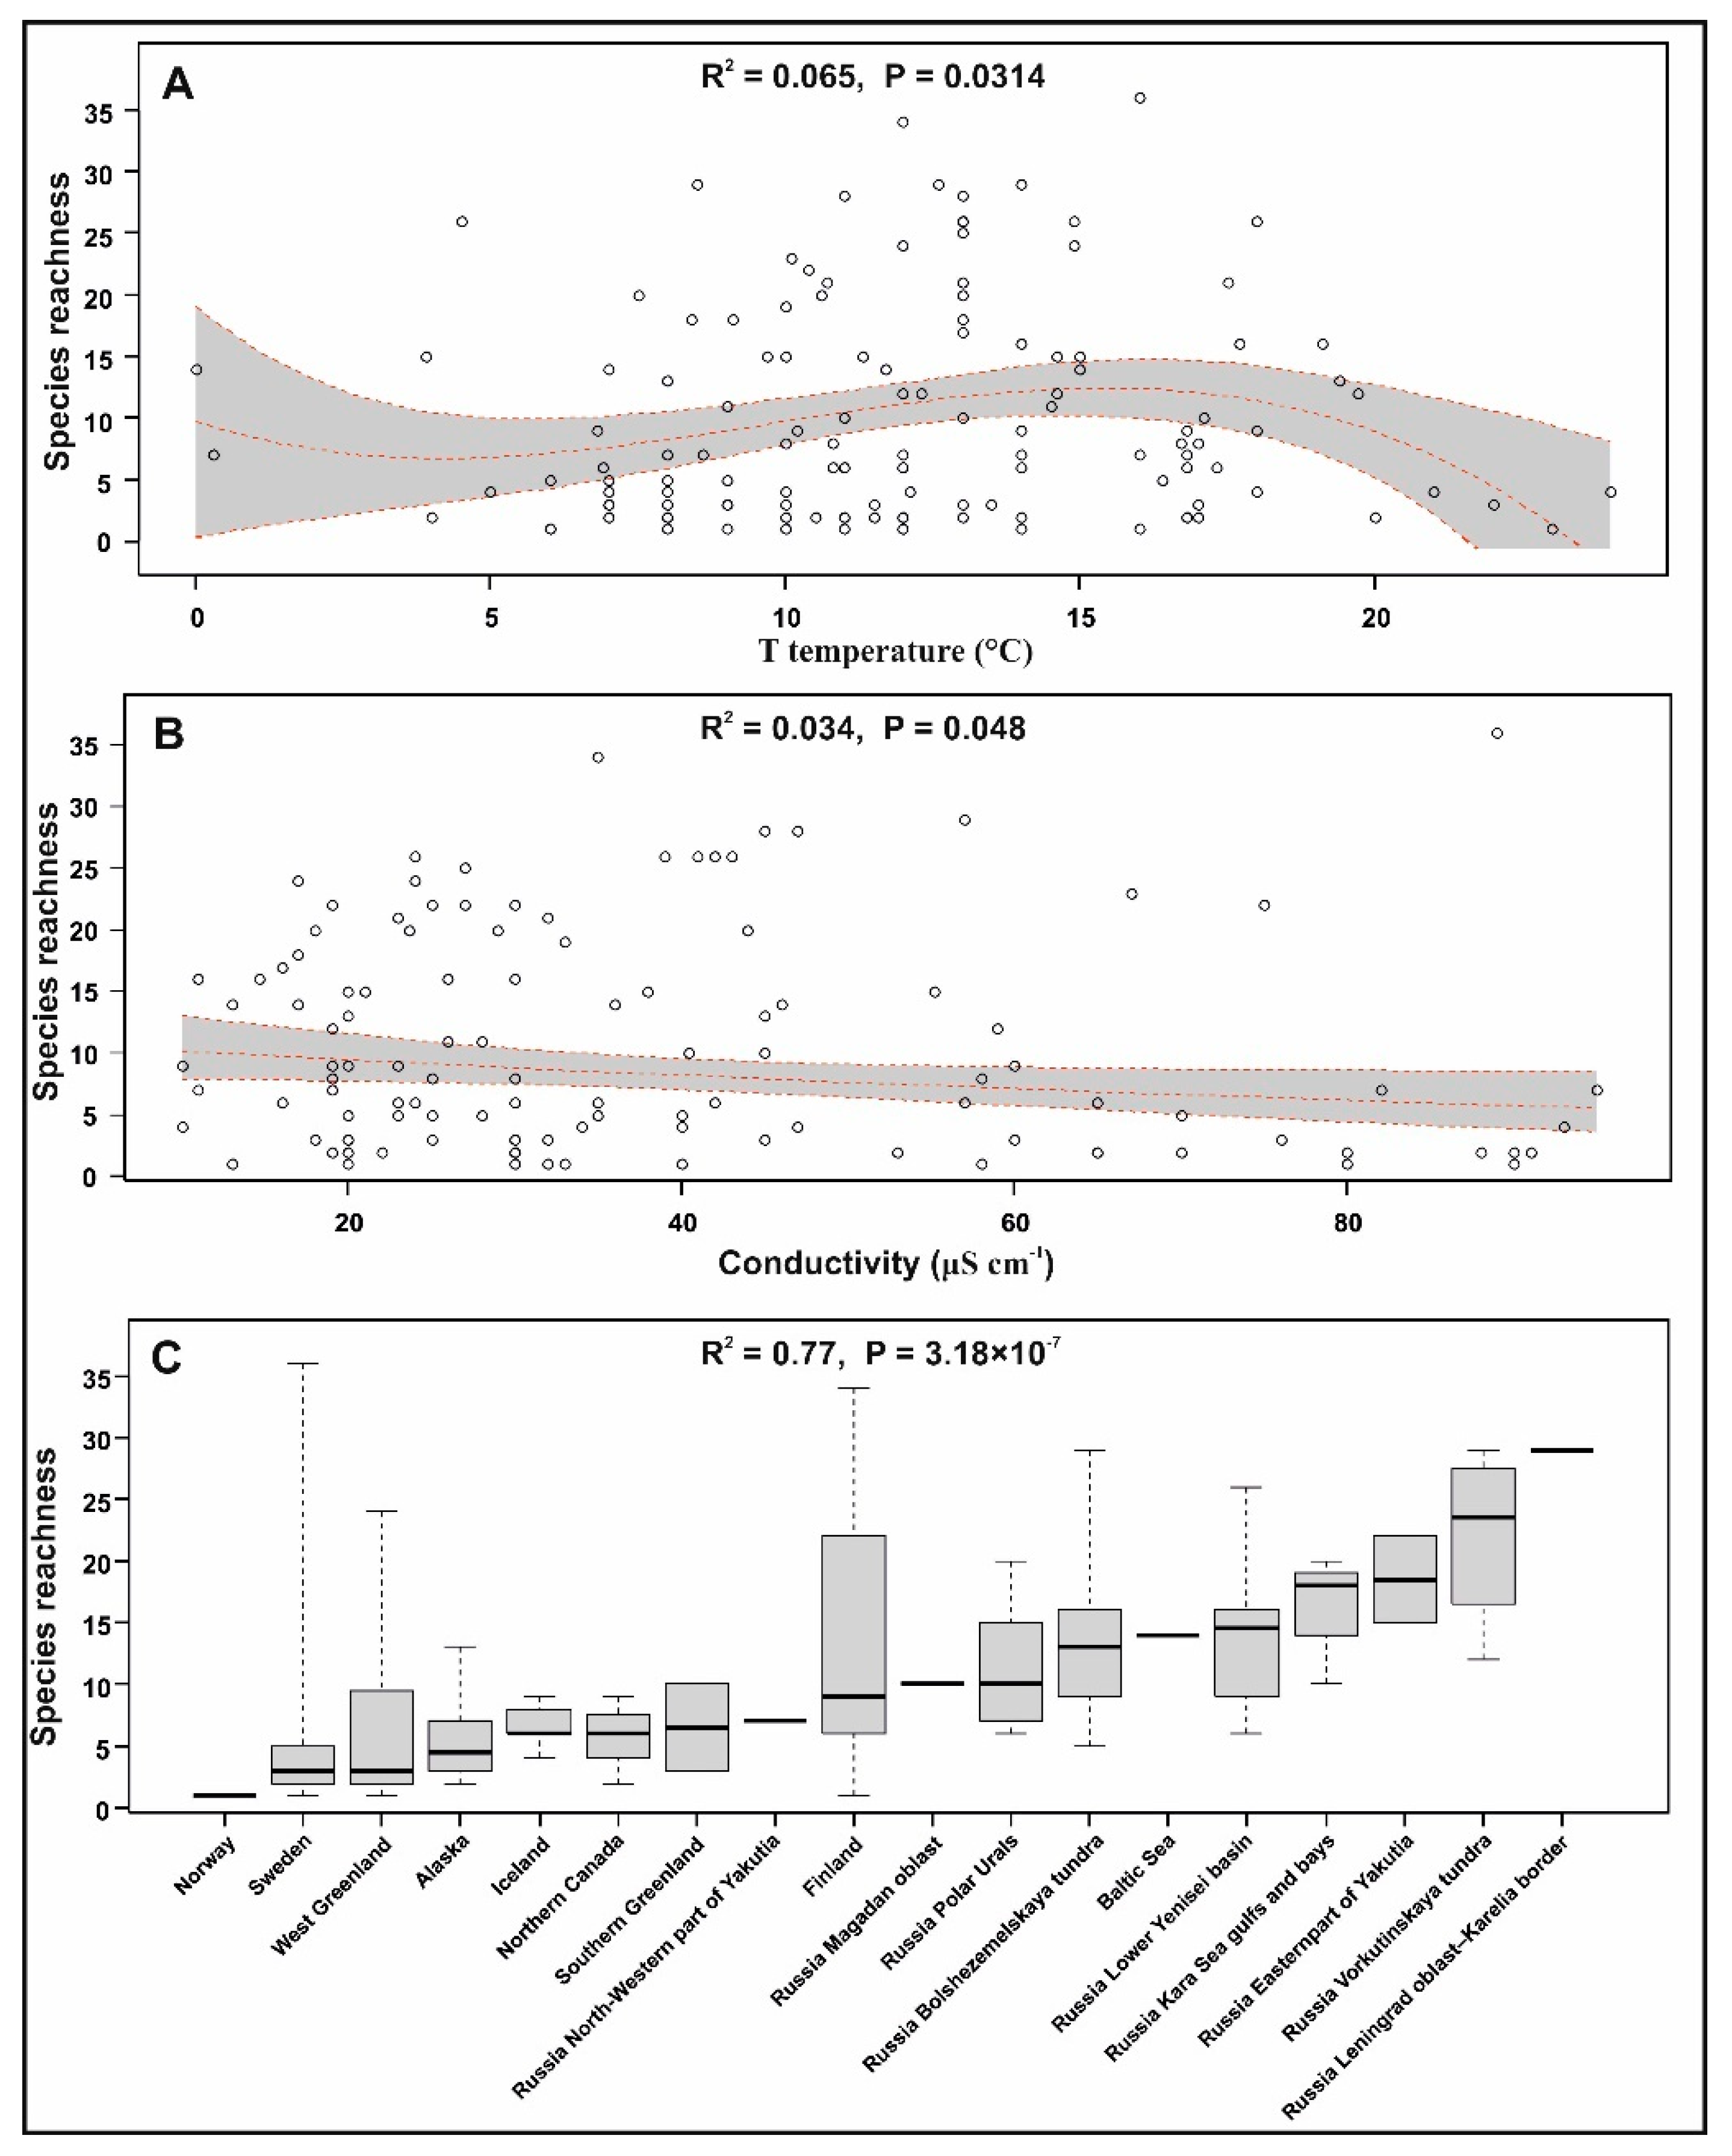
According to the regression and variance analyses (Figure 6), the species richness was reliably (p < 0.05) influenced by T, conductivity and sampling region, while pH and sampling month did not affect the species richness. We did not find an influence of the number of samples entering the region on species richness (ANOVA p = 0.487 > 0.05). Therefore, we can exclude the possibility of revealing the reliability of the influence of the region on species richness through an unequal number of samples in the regions.
The dependence between the species richness and T was described by a third-degree polynomial (species richness = −19.65 × T3 − 14.9 × T2 + 6.83 × T + 10.07; minimal AICc value; Figure 6A). We can see in Figure 6A that the highest values of species richness in waters located above 60° N were observed in the range 13–16 °C. Any change in these values towards increase or decrease led to an impoverishment of the species composition. The boundaries of T values recorded in analyzed water bodies of temperate (0–23 °C), subarctic (7.5–19.7 °C) and arctic (7–15 °C) zones evidenced an overlap of optimal temperatures. It is likely that this regularity could explain the presence of 57% species in the waters of 2–3 zones. The dependence between species richness and conductivity (Figure 6B) is described by a linear function (species richness = −0.04 × conductivity + 12.04; minimal AICc value). The maximal values of the species richness were observed at conductivity 20–35 μS cm−1; further increase in conductivity led to decrease in species richness.
According to the authors [30,31], the increase in abundance of silica-scaled chrysophytes in boreal and arctic lakes is related to global warming. Comparing the diversity of silica-scaled chrysophytes in the Baikal Region, we noted that the species richness of these organisms was considerably higher in warmer tributaries and streams than in the colder Lake Baikal, reducing from 66 taxa at 13 °C to 19 taxa at 5 °C [11,108]. These results contradict the traditional view that chrysophyceans are psychrophilic [109,110,111,112]. As for the lakes located above the 60th parallel north, the maximum species richness was observed at 13 to 14 °C. Given the fact that the temperature in the majority of the studied water bodies was below these values, we may suppose that the warming climate and gradual rise in temperature to the optimum values will first increase the species richness, but further rise in temperature will reduce it (see Figure 6A,D). The climate can thus be the factor that regulates both the abundance and the species richness of silica-scaled chrysophytes.
We did not detect any reliable impact of pH on species richness, although Siver and Lott (2012) [113] previously indicated a key role of pH and conductivity in the biogeographical distribution of silica-scaled chrysophytes in fresh waters of the east coast of North America in longitudinal gradient (29° to 48° N). This can be related with the nonlinear effect of pH on the species richness described in other papers [114]. It is likely that in our case, the unreliability of the effect of pH on species richness was related to an insufficient number of samples with known pH. It is to be noted that pH monitoring is important in areas under strong anthropogenic stress because air pollutants can cause acid depositions that in turn will shift pH towards increasing acidity [115,116]. In this case, pH values can change beyond the optimum for silica-scaled chrysophytes, leading to a drastic reduction of their species richness.
The statistical analysis thus allows the conclusion that the sampling region has a statistically significant effect both on species composition and on species richness and reinforces the assumption about regional peculiarities of florae. The other factor that significantly affected species composition and species richness was sampling T, the most favorable for the species richness of chrysophyceans being 13–16 °C. The conductivity, whose maximal values were 20–35 μS cm−1, was important only for species richness.

3.6. Similarity of the Species Composition of Geographically Distant Regions

As we can see from Figure 5, considerably distant regions cluster together from the perspective of similarity of the flora of silica-scaled chrysophytes.
The florae of Region 1 (Alaska) and Region 5 (Iceland) are similar due to the presence of nine identical widespread and ubiquitous species (see Supplementary Material S3).
The florae of Region 19 (Russia, North-Western part of Yakutia) and Region 21 (Russia, Magadan oblast) are similar due to the presence of five identical widespread species (see Supplementary Material S3).
The florae of Region 16 (Russia, Kara Sea gulfs and bays), Region 10 (Russia, Leningrad oblast–Karelia border) and Region 2 (Northern Canada) are similar due to an even representation of species within the genera Chrysosphaerella, Mallomonas, Spiniferomonas and Synura, Mallomonas species being the most abundant. Species of the genera Neotessella and Polylepidomonas do not occur in these regions. The presence of 12 identical widespread species is a common trait of Regions 16, 10 and 2 (see Supplementary Material S3).
There is a variety of species of the genus Spiniferomonas (six shared species) in Region 15 (Russia, Lower Yenisei basin) and Region 20 (Russia, Eastern part of Yakutia), but there are no species of the genera Polylepidomonas and Neotessella (see Supplementary Material S3).
Five geographically distant regions (22, 15, 16, 10 and 2) form the same clade (Figure 5). We examine in detail the examples of Region 16 (Russia, Kara Sea gulfs and bays) and Region 20 (Lakes Labynkyr and Vorota, Russia, Eastern Yakutia). These water bodies are separated by a distance of more than 2700 km and their environmental parameters are absolutely different.
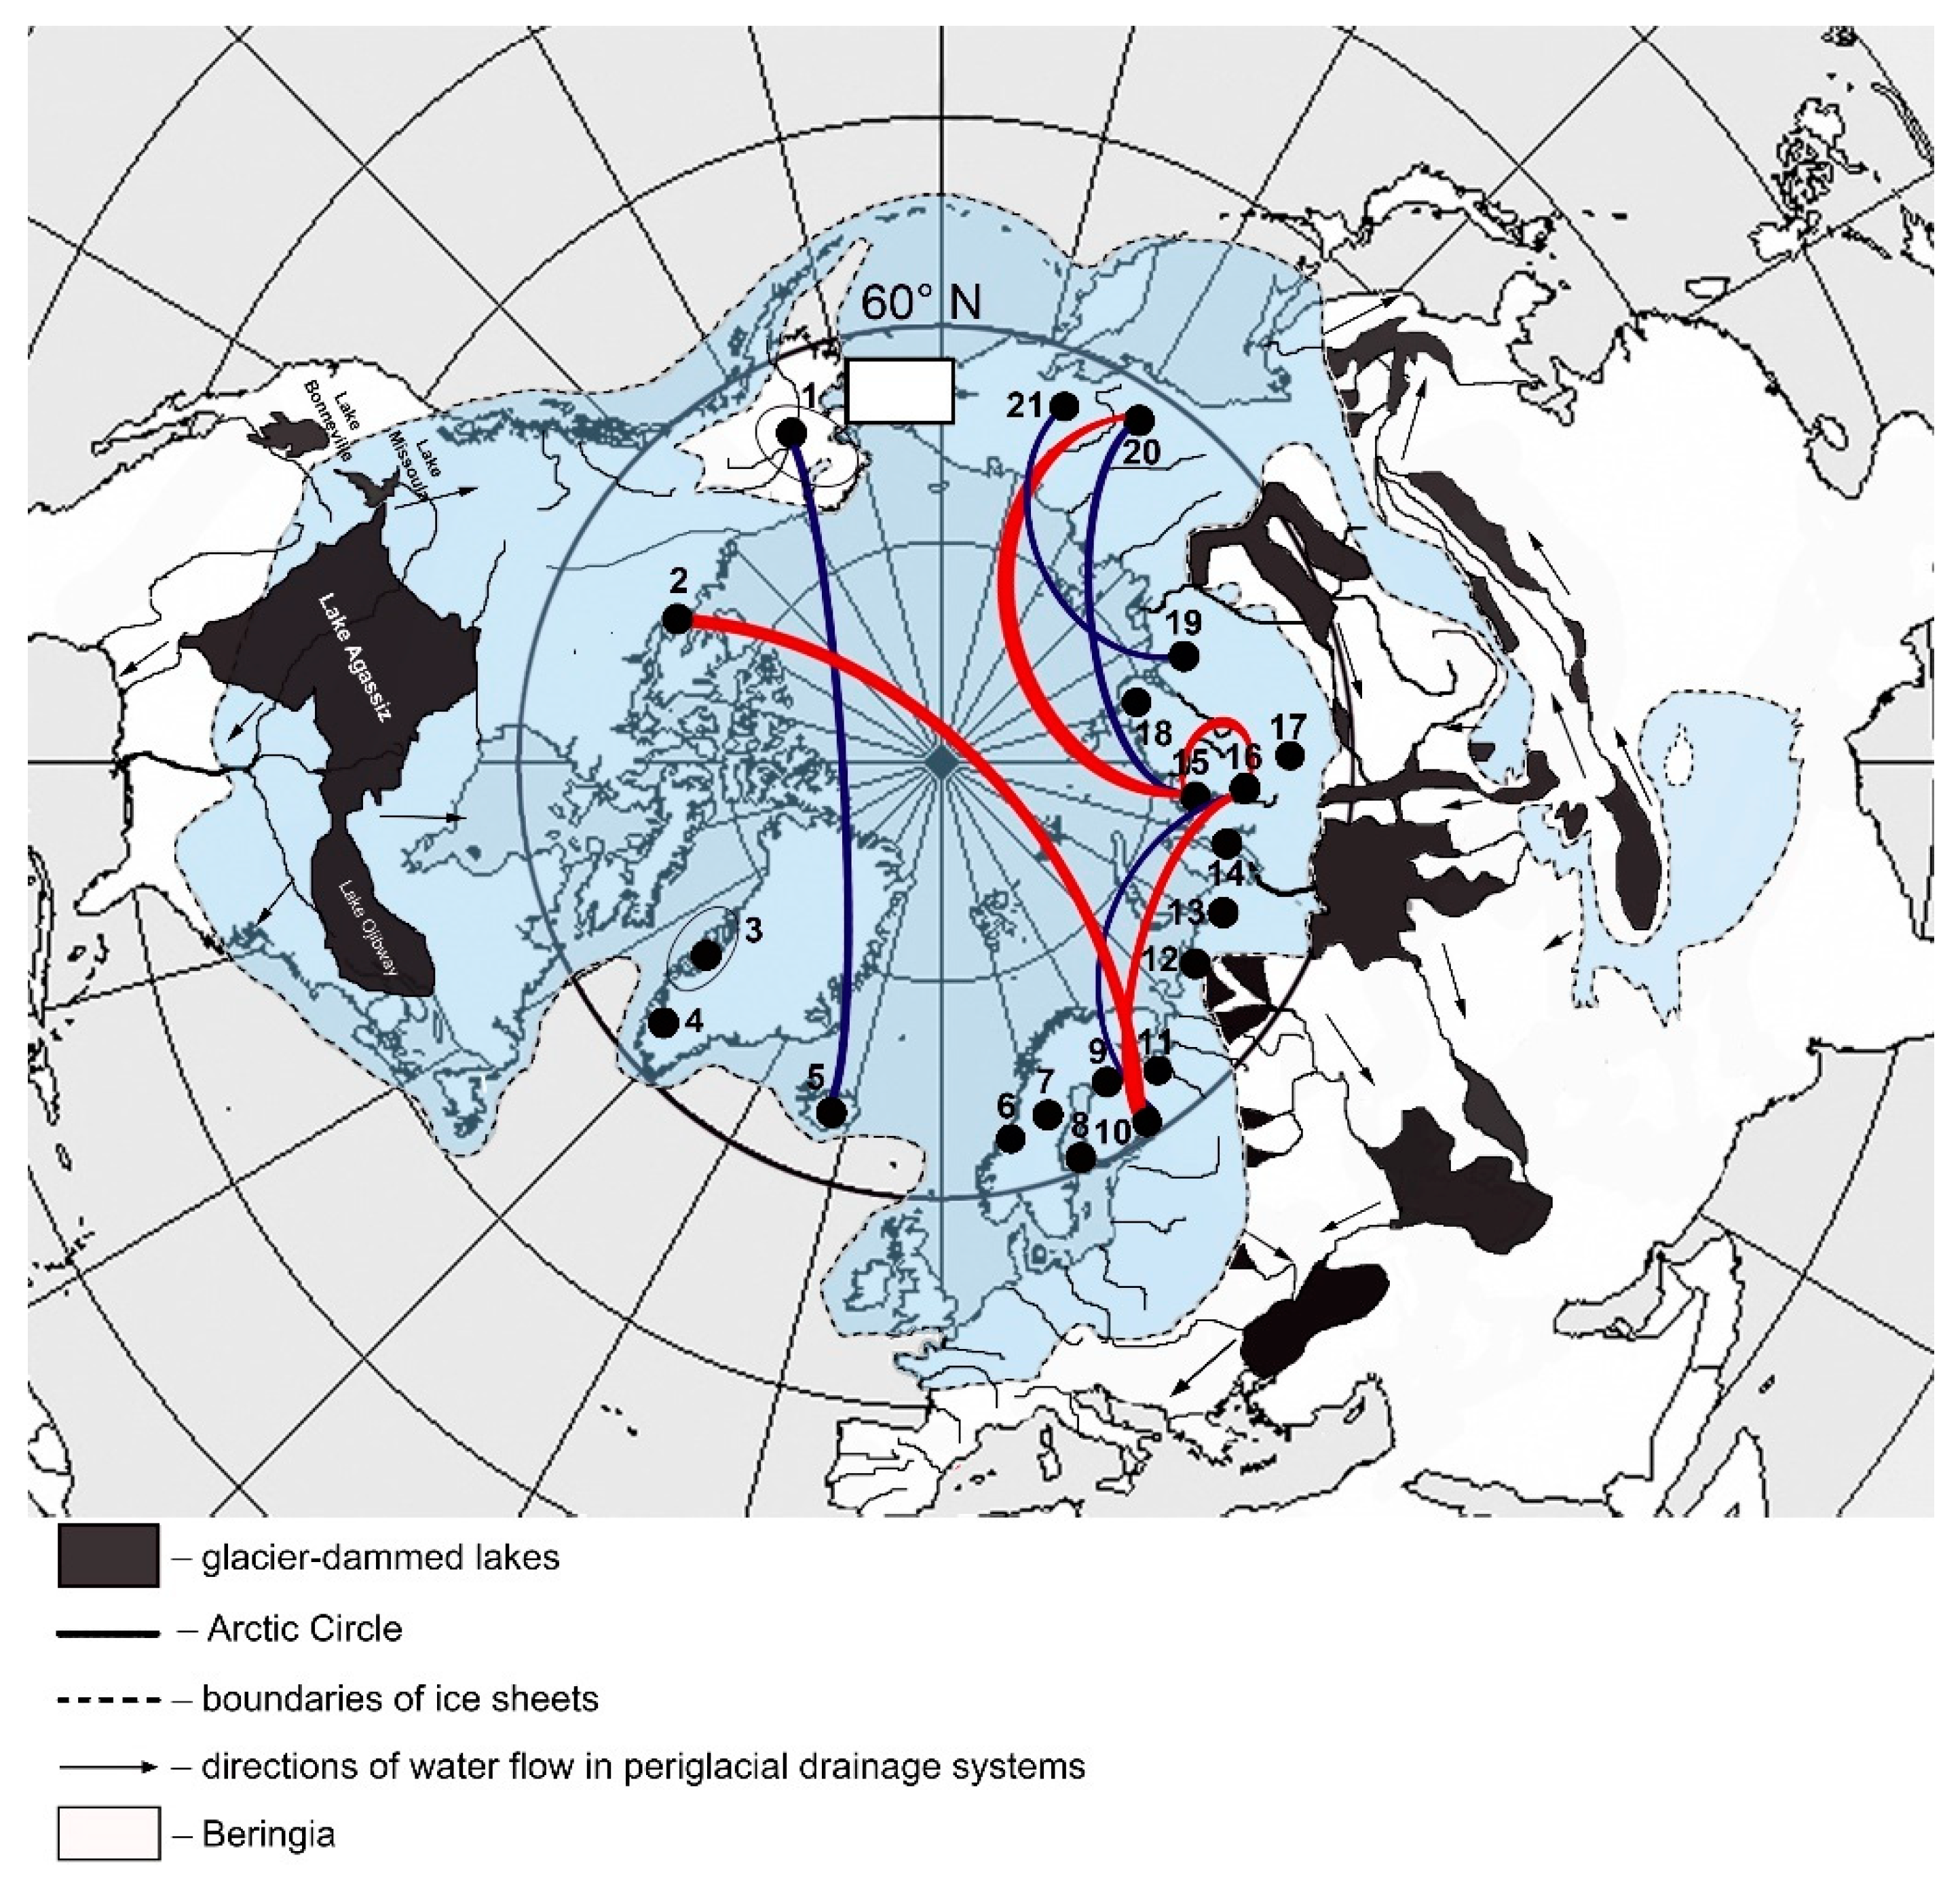
The Lakes Labynkyr and Vorota (Region 20) are located at the Pole of Cold of the Nothern Hemisphere and are under ice for about 260 days a year. The water of these lakes is ultrafresh, and T, pH and conductivity at the time of sampling were 9.7 °C, 7.6 and 54 µS cm −1 in Lake Vorota, and 15.6 °C, 6.8 and 35 µS cm −1 in Lake Labynkyr, respectively [82]. A mixing of marine and fresh water coming from the south takes place in the gulfs and bays of the Kara Sea. The maximum species richness of silica-scaled chrysophytes was recorded in the Lower Yenisei River and Yenisei Gulf (Table 1), where water temperature, pH and conductivity varied at the time of sampling between 8.1 °C and 11.6 °C, 7.9 and 8.2, 15.8 µS cm−1 and 1273 µS cm−1, respectively [80]. What then unites these areas? Why do they have a similar species composition of silica-scaled chrysophytes? The large Yenisei River, running into the Kara Sea, has as a tributary the Angara River, which nowadays flows from Lake Baikal. On the other hand, Lake Baikal was connected to the other large river, Lena, up to the Middle Pleistocene (800,000–700,000 years BP) [117]. This river has a vast watershed on the lowlands of Yakutia and runs into the Laptev Sea. Lake Baikal was free of ice during the last Pleistocene glaciation (Figure 7), but streams from glacier-dammed lakes could disseminate the Baikal microalgal flora, as evidenced by the identification of the Baikal-endemic diatom species Lindavia minuta (Skvortzow) by Nakov et al. in the phytoplankton of some lakes in the Transbaikalian region [118] and in Lake Khövsgöl [119,120,121,122].
Recently, this species was found not only in the phytoplankton, but also in the Holocene sediments of Lakes Vorota and Labynkyr [123]. It would be natural to assume that both diatoms and silica-scaled chrysophytes, as other microalgae, could share the same dispersal scenario. Hence, the species composition similarity of these two distant areas, the lakes of Yakutia and the gulfs of the Kara Sea, is no longer extraordinary.

3.7. Global Dispersal in Latitudinal Direction

The dispersal of silica-scaled chrysophytes is traditionally associated with two pathways, i.e., abiotic (transfer with water and wind) [100] and biotic [100,101,113,124]. Biotic factors include dispersal on the hair of mammals and the feathers and legs of aquatic birds [100,113,124]. The stomatocysts of silica-scaled chrysophytes can endure hostile environments including low temperature and drying, which can facilitate dispersal success [101]. However, we propose to more widely examine the abiotic dispersal scenario, or water transfer, as being the most extensive pathway.
The areas located above the 60th parallel north were covered with ice sheets during the last Pleistocene glaciation (18,000–22,000 years BP; see Figure 2). At the time, a system of glacier-dammed lakes went from east to west in the Northern Hemisphere [47,84,85,86,87,88,89,90] (see Figure 7).
The dispersal of species from one water body to another could be favored by catastrophic outbreaks of glacier-dammed lakes releasing a huge quantity of energy and matter [46,94]. The largest of the known glacier-dammed lakes were lakes Agassiz, Missoula and Bonneville, formed during the retreat of the Cordilleran ice complex and the Laurentide Ice Sheet in the territory of present-day United States, Canada and Alaska, approximately 13,500 years ago [86,89]. The melting of the Eurasian, Kara and East-Siberian ice sheets also formed large glacier-dammed lakes in the territory of Eurasia. These were Lake Darkhat (currently non-existent) and Lake Khövsgöl (still existent) in the territory of present-day Mongolia, the Khvalyn Basin of the Caspian Sea, the Chuya-Kuray Lake System and Lake Uymon in the Altai mountains, and the large Kaz-Ket system of ice-dammed lakes formed at the point of the present-day low water divide between the catchment areas of the rivers Yenissei and Ob at the upper reaches of the rivers Kaz and Ket [47,84,85,86,87,88,89,90]. The intercontinental dispersal of silica-scaled chrysophytes could take place along the north Beringia that emerged due to recession of the ocean level and retreat of the Cordilleran Ice Sheet. During the glaciation, it connected Northeast Asia and Northwest North America. Its territory is known to be covered by systems of small, interconnected lakes and rivers that could serve as routes for the dispersal of chrysophyceans [125]. The retreat and melting of the ice sheets in the Early Holocene favored water temperature, salinity and circulation changes in the respective parts of the Atlantic and Arctic Oceans [87,89]. This gave rise to the modern climatic zones, three of which are being examined in the paper (arctic, subarctic and temperate).
This probable dispersal scenario is, in our view, the main force facilitating the dispersal of microalgae after the last Pleistocene glaciation, although later biotic factors also could play a role. In addition, Finlay and Clarke (1999) [126] and Finlay (2002) [127], advanced the concept that, despite the “ubiquitous” dissemination of microalgae, they would be found only in the water bodies meeting the ecological requirements of a species, i.e., “the environment selects”. This concept correlates with our investigation and is quite convincing. First, many species of silica-scaled chrysophytes in the analyzed water bodies were cosmopolitan or widespread species (45%). Second, the majority of these species inhabited two–three zones (78 species of 165). The same characteristics were typical of the majority of the species, having clear affinities to fossil congeners. Thirteen species and one variety, and 18 species and one variety, were either cosmopolitan or widespread, respectively.
Only five of 18 species occurring in more than one half of the regions located above the 60th parallel north (see Supplementary Material S3) had clear affinities to fossil congeners. Table 3 shows that these species as well as the remaining 18 inhabit water bodies with high variability in environmental parameters. Such ecological plasticity could facilitate their survival during the glaciations and the subsequent successful dispersal.
On the other hand, the catastrophic change of habitats at the boundary between the Pleistocene and Holocene, as well as the subsequent geographical isolation, could favor the development of cryptic species or intraspecific taxa among both widespread and cosmopolitan species.

4. Conclusions

In this study, we applied statistical methods to analyze data on the chrysophycean flora of water bodies in 21 regions located above the 60th parallel north, defined the role of main environmental factors in determining species composition and richness and reconstructed the circumpolar freshwater network of ice-dammed lakes throughout the period of their existence and migration based on scattered data.
The taxa typical of two–three climatic zones, mostly widespread and cosmopolitan species, prevail in the analyzed regions. Despite certain differences in the species composition of individual regions, the core of the flora of silica-scaled chrysophytes consists of only 18 environmentally flexible species shared by most of the regions.
The main factor determining the species composition is the sampling region, i.e., each region located above the 60th parallel north has regional features in terms of the flora of silica-scaled chrysophytes. The present-day species composition of chrysophyceans in these regions credibly depends on water temperature and conductivity. There are the most optimal values of environmental parameters favorable for the maximum species richness of silica-scaled chrysophytes. Any deviation from these values in either direction impoverishes the species composition. The results obtained show that the species composition of silica-scaled chrysophytes can be similar in areas that are quite distant from each other in longitude direction.
The flora in the eastern part of the Northern Hemisphere, where large rivers flow northwards opposed to the western part of the Northern Hemisphere, was first pushed southwards by the glacier, then mixed in glacier-dammed lakes with southern species brought by rivers. When the glacier regressed, this flora invaded the new Holocene lakes. We assume that this scenario prevails in the dispersal of silica-scaled chrysophytes (and likely in that of other planktonic microorganisms) in northern water bodies.
Finally, this study supports the ubiquity hypothesis, “everything is everywhere: but the environment selects” [126,127,128,129], which is still being discussed both in the general microbial biogeography [130] and in phytoplankton studies [129]. We demonstrate through the example of silica-scaled chrysophytes in water bodies located above the 60th parallel north how the dispersal of “everything everywhere” can happen and exactly what kind of environmental factors select or limit the maximum species richness or change the species composition of these organisms.

Supplementary Materials

https://doi.org/10.6084/m9.figshare.12400739—Supplementary Material S1. Integrated Data Table including the species composition and hydrochemical parameters (pH, T, conductivity) of all 193 analyzed water bodies located above the 60th parallel north. https://doi.org/10.6084/m9.figshare.12400739—Supplementary Material S2. Results PERMANOVA analysis with estimates based on AICc for selection of the most optimal linear combination of abiotic factor affecting the species richness of chrysophytes. https://doi.org/10.6084/m9.figshare.12400739—Supplementary Material S3. Species list of silica-scaled chrysophytes and their distribution in study regions (numbered as in Table 1). Geographic distribution types according to Kristiansen (2000, 2008) [100,101]: (cp) cosmopolitan, (wd) widely distributed, (sc) scattered, (bp) bipolar, (r) rare, (ab) arctoboreal. Species occurring in fossil floras (from Siver et al., 2013, 2015) [25,26]: (*) species similar to a fossil taxon (relict species); (**) species closely related to the fossil taxa; (***) relict species M. lancea that is similar in scale structure to two modern species, M. intermedia and M. corcontica. https://doi.org/10.6084/m9.figshare.12400739—Supplementary Material S4. Heat map of species representation status in the regions. Painted boxes at the intersection of rows and columns say the species occur at least in one water body of the region. Rows and columns of the heat map are ordered according to clustering results. Left and upper parts show dendrograms of clustering of regions and species by similarity of representation status.

Author Contributions

Y.L. conceived and coordinated the study, A.B. collected data, Y.B. performed statistical analysis and participated in interpretation of the results. A.B. interpreted the results and wrote the first version of the manuscript. All authors contributed to the drafts and gave final approval for publication. All authors have read and agreed to the published version of the manuscript.

Funding

The investigation was done with financial support of the State Assignments of Limnological Institute Siberian Branch of Russian Academy of Sciences # 0279-2021-0008 (121032300186-9).

Institutional Review Board Statement

Not applicable.

Informed Consent Statement

Not applicable.

Data Availability Statement

The data presented in this study are openly available in FigShare repository at https://doi.org/10.6084/m9.figshare.12400739.

Acknowledgments

The authors acknowledge Grachev M.A. for the fruitful discussion and the anonymous reviewers for their remarks that improved the manuscript. The study was performed using microscopes of the Instrumental Center “Electron Microscopy” (http://www.lin.irk.ru/copp/) of the Shared Research Facilities for Research “Ultramicroanalysis”.

Conflicts of Interest

The authors declare no conflict of interest.

References

  1. Kristiansen, J.; Škaloud, P. Chrysophyta. Handbook of the Protists, 2nd ed.; Springer International Publishing: Cham, Switzerland, 2016; pp. 1–38. [Google Scholar]
  2. Dürrschmidt, M.; Croome, R. Mallomonadaceae (Chrysophyceae) from Malaysia and Australia. Nord. J. Bot. 1985, 5, 285–298. [Google Scholar] [CrossRef]
  3. Neustupa, J.; Řezácová, M. The genus Mallomonas (Mallomonadales, Synurophyceae) in several Southeast Asian urban water bodies–the biogeographical implications. Nova Hedwig. 2007, 84, 249–259. [Google Scholar] [CrossRef]
  4. Gusev, E.S.; Thant, N.T.H. Silica-scaled chrysophytes (Chrysophyceae and Synurophyceae) from Vietnam (Khanh Hoa and Quang Nam provinces). Nova Hedwig. 2011, 93, 191–199. [Google Scholar] [CrossRef]
  5. Gusev, E.S.; Kapustin, D.A.; Martynenko, N.A.; Guseva, E.E.; Kulikovskiy, M.S. Mallomonas gusakovii sp. nov. (Chrysophyceae, Synurales), a new species from Phu Quoc Island, Vietnam. Phytotaxa 2019, 406, 199–205. [Google Scholar] [CrossRef]
  6. Duff, K.E. Chrysophyte microfossils in arctic Siberian lakes. Chrysophytes: Progress and new horizons. Nova Hedwig. Beih. 1996, 114, 253–263. [Google Scholar]
  7. Kristiansen, J.; Düwel, L.; Wegeberg, S. Silica-scaled chrysophytes from the Taymyr Peninsula, Northern Siberia. Nova Hedwig. 1997, 65, 337–351. [Google Scholar] [CrossRef]
  8. Gusev, E.S.; Guseva, E.E.; Gabushev, V.A. Taxonomic composition of silica-scaled chrysophytes in rivers and lakes of Yakutia and Magadanskaya oblast (Russia). Nova Hedwig. Beih. 2018, 147, 105–117. [Google Scholar]
  9. Hällfors, G.; Hällfors, S. Records of chrysophytes with siliceous scales (Mallomonadaceae and Paraphysomonadaceae) from Finnish inland waters. Flagellates in freshwater ecosystems. Hydrobiologia 1988, 161, 1–29. [Google Scholar] [CrossRef]
  10. Nemcova, Y.; Kreidlová, J.; Kosová, A.; Neustupa, J. Lakes and pools of Aquitania region (France)–A biodiversity hotspot of Synurales in Europe. Nova Hedwig. 2012, 95, 1–24. [Google Scholar] [CrossRef]
  11. Bessudova, A.; Sorokovikova, L.M.; Tomberg, I.V.; Likhoshway, Y.V. Silica-scaled chrysophytes in large tributaries of Lake Baikal. Cryptogam. Algol. 2018, 39, 145–165. [Google Scholar] [CrossRef]
  12. McKenzie, C.; Kling, H. Scale-bearing Chrysophyceae (Mallomonadaceae and Paraphysomonadaceae) from Mackenzie Delta area lakes, Northwest Territories, Canada. Nord. J. Bot. 1989, 9, 103–112. [Google Scholar] [CrossRef]
  13. Kristiansen, J. Silica structures in the taxonomy and identification of scaled chrysophytes. Nova Hedwig. Beih. 1995, 112, 355–365. [Google Scholar]
  14. Forsström, L.; Sorvari, S.; Korhola, A.; Rautio, M. Seasonality of phytoplankton in subarctic Lake Saanajärvi in NW Finnish Lapland. Pol. Biol. 2005, 28, 846–861. [Google Scholar] [CrossRef]
  15. Rautio, M.; Dufresne, F.; Laurion, I.; Bonilla, S.; Vincent, W.F.; Christoffersen, K.S. Shallow freshwater ecosystems of the circumpolar. Écoscience 2011, 18, 204–222. [Google Scholar] [CrossRef]
  16. Charvet, S.; Vincent, W.F.; Lovejoy, C. Chrysophytes and other protists in High Arctic lakes: Molecular gene surveys, pigment signatures and microscopy. Polar Biol. 2012, 35, 733–748. [Google Scholar] [CrossRef]
  17. Preisig, H.R.; Hibberd, D.J. Ultrastructure and taxonomy of Paraphysomonas (Chrysophyceae) and related genera 2. Nord. J. Bot. 1982, 2, 601–638. [Google Scholar] [CrossRef]
  18. Voloshko, L.N.; Gavrilova, O.V. A checklist of silica-scaled chrysophytes in Russia with an emphasis on the flora of Lake Ladoga. Nova Hedwig. Beih. 2001, 122, 147–167. [Google Scholar]
  19. Němcová, Y.; Pichrtová, M. Shape dynamics of silica scales (Chrysophyceae, Stramenopiles) associated with pH. Fottea 2012, 12, 281–291. [Google Scholar] [CrossRef] [Green Version]
  20. Boo, S.M.; Kim, H.S.; Shin, W.; Boo, G.H.; Cho, S.M.; Jo, B.Y.; Kim, J.H.; Kim, J.H.; Yang, E.C.; Siver, P.A.; et al. Complex phylogeographic patterns in the freshwater alga Synura provide new insights into ubiquity vs. endemism in microbial eukaryotes. Mol. Ecol. 2010, 19, 4328–4338. [Google Scholar] [CrossRef]
  21. Siver, P.A.; Wolfe, A.P. Scaled chrysophytes in middle Eocene lake sediments from northwestern Canada, including descrip-tions of six new species. Nova Hedwig. Beih. 2005, 128, 295–308. [Google Scholar]
  22. Siver, P.A.; Wolfe, A.P. Eocene scaled chrysophytes with pronounced modern affinities. Int. J. Plant Sci. 2005, 166, 533–536. [Google Scholar] [CrossRef]
  23. Siver, P.A.; Wolfe, A.P. Tropical ochrophyte algae from the Eocene of Northern Canada: A biogeographical response to past global warming. Palaios 2009, 24, 192–198. [Google Scholar] [CrossRef] [Green Version]
  24. Siver, P.A.; Lott, A.M. Fossil species of Mallomonas from an Eocene maar lake with recessed dome structures: Early attempts at securing bristles to the cell covering? Nova Hedwig. 2012, 95, 517–529. [Google Scholar] [CrossRef]
  25. Siver, P.A.; Lott, A.M.; Wolfe, A.P. A summary of Synura taxa in early Cenozoic deposits from northern Canada. Nova Hedwig. Beih. 2013, 142, 181–190. [Google Scholar]
  26. Siver, P.A.; Jo, B.Y.; Kim, J.I.; Shin, W.; Lott, A.M.; Wolfe, A.P. Assessing the evolutionary history of the class Synurophyceae (Heterokonta) using molecular, morphometric, and paleobiological approaches. Am. J. Bot. 2015, 102, 921–941. [Google Scholar] [CrossRef] [Green Version]
  27. Wolfe, A.P.; Perren, B.B. Chrysophyte microfossils record marked responses to recent environmental changes in high- and mid-Arctic lakes. Can. J. Bot. 2001, 79, 747–752. [Google Scholar]
  28. Thienpont, J.R.; Rühland, K.M.; Pisaric, M.F.J.; Kokelj, S.V.; Kimpe, L.E.; Blais, J.M.; Smol, J.P. Biological responses to permafrost thaw slumping in Canadian Arctic lakes. Freshw. Biol. 2013, 58, 337–353. [Google Scholar] [CrossRef]
  29. Wolfe, A.P.; Siver, P.A. A hypothesis linking chrysophyte microfossils to lake carbon dynamics on ecological and evolutionary time scales. Glob. Planet. Chang. 2013, 111, 189–198. [Google Scholar] [CrossRef]
  30. Mushet, G.R.; Laird, K.R.; Das, B.; Hesjedal, B.; Leavitt, P.R.; Scott, K.A.; Simpson, G.L.; Wissel, B.; Wolfe, J.D.; Cumming, B.F. Regional climate changes drive increased scaled-chrysophyte abundance in lakesdownwind of Athabasca Oil Sands nitrogen emissions. J. Paleolimnol. 2017, 58, 419–435. [Google Scholar] [CrossRef] [Green Version]
  31. Schindler, D.W. The cumulative effects of climate warming and other human stresses on Canadian freshwaters in the new millennium. Can. J. Fish. Aquat. Sci. 2001, 58, 18–29. [Google Scholar] [CrossRef]
  32. Paterson, A.M.; Winter, J.G.; Nicholls, K.H.; Clarks, B.J.; Ramcharan, C.W.; Yan, N.D.; Somers, K.M. Long-term changes in phytoplankton composition in seven Canadian Sheet lakes in response to multiple anthropogenic stressors. Can. J. Fish. Aquat. Sci. 2008, 65, 846–861. [Google Scholar] [CrossRef]
  33. Rühland, K.M.; Paterson, A.M.; Smol, J.P. Hemispheric-scale patterns of climate-related shifts in planktonic diatoms from North American and European lakes. Glob. Change Biol. 2008, 14, 2740–2754. [Google Scholar] [CrossRef]
  34. Virta, L.; Soininen, J. Distribution patterns of epilithic diatoms along climatic, spatial and physicochemical variables in the Baltic Sea. Helgol. Mar. Res. 2017, 71, 16. [Google Scholar] [CrossRef]
  35. Passy, S.I.; Larson, C.A.; Jamoneau, A.; Budnick, W.; Heino, J.; Leboucher, T.; Tison-Rosebery, J.; Soininen, J. Biogeographical Patterns of Species Richness and Abundance Distribution in Stream Diatoms Are Driven by Climate and Water Chemistry. Am. Nat. 2018, 192, 605–617. [Google Scholar] [CrossRef] [PubMed] [Green Version]
  36. Boenigk, J.; Wodniok, S.; Bock, C.; Beisser, D.; Hempel, C.; Grossmann, L.; Lange, A.; Jensen, A. Geographic distance and mountain ranges structure freshwater protist communities on a European scale. Metabarcoding Metagenom. 2018, 2, e21519. [Google Scholar] [CrossRef] [Green Version]
  37. Bock, C.; Jensen, M.; Forster, D.; Marks, S.; Nuy, J.; Psenner, R.; Beisser, D.; Boenigk, J. Factors shaping community patterns of protists and bacteria on a European scale: Distribution patterns of protists and bacteria. Environ. Microbiol. 2020, 22, 3757–3771. [Google Scholar] [CrossRef]
  38. Teittinen, A.; Virta, L.; Li, M.; Wang, J. Factors influencing the biodiversity of three microbialgroups within and among islands of the Baltic Sea. FEMS Microb. Ecol. 2021, 97, fiab049. [Google Scholar] [CrossRef]
  39. Soininen, J.; Jamoneau, A.; Tison-Rosebery, J.; Passy, S.I. Global patterns and drivers of species and trait composition in diatoms. Glob. Ecol. Biogeogr. 2016, 25, 940–950. [Google Scholar] [CrossRef]
  40. Heino, J.; Mauricio Bini, L.; Karjalainen, S.M.; Mykrä, H.; Soininen, J.; Cardoso Galli Vieira, L.; Felizola Diniz-Filho, J.A. Geographical Patterns of Micro-Organismal Community Structure: Are Diatoms Ubiquitously Distributed across Boreal Streams? Oikos 2010, 119, 129–137. [Google Scholar] [CrossRef]
  41. Grosswald, M.G. The last Eurasian ice cover. MGI 1977, 30, 45–60. (In Russian) [Google Scholar]
  42. Grosswald, M.G. Glaciers of Continental Shelves; Kotlyakov, V.M., Ed.; Nauka: Moscow, Russia, 1983; p. 216. (In Russian) [Google Scholar]
  43. Grosswald, M.G. Glaciation of Antarctic type in the Northern Hemisphere (towards the global glaciation theory). MGI 1988, 63, 3–25. (In Russian) [Google Scholar]
  44. Grosswald, M.G. Paleohydrology of Eurasia during the last glaciation. MGI 1998, 84, 121–129. (In Russian) [Google Scholar]
  45. Grosswald, M.G. Hydrosphere Disasters in Eurasia and Glaciation in Arctic; Kotlyakov, V.M., Ed.; Scientific World: Moscow, Russia, 1999; p. 120. (In Russian) [Google Scholar]
  46. Grosswald, M.G.; Hughes, T.J. The Russian component of an Arctic Ice Sheet during the Last Glacial Maximum. Quat. Sci. Rev. 2002, 21, 121–146. [Google Scholar] [CrossRef]
  47. Grosswald, M.G. Glaciation in the North and Northeast Russia during the last great cold event. In Materials of Glaciological Studies; Kotlyakov, V.M., Ed.; Issue 106; Nauka: Moscow, Russia, 2009; p. 152. (In Russian) [Google Scholar]
  48. Alisov, B.P. Geographical types of climate. Meteorol. Hydrol. 1936, 6, 16–25. (In Russian) [Google Scholar]
  49. Zvereva, O.S.; Getsen, M.Y.; Iziurova, V.K. The system of relict lakes in the Bolshezemelskaya tundra. Rep. Sci. Acad. USSR 1964, 155, 677–679. (In Russian) [Google Scholar]
  50. Siver, P.A.; Voloshko, L.N.; Gavrilova, O.V.; Getsen, M.V. The scaled chrysophyte flora of the Bolshezemelskaya tundra. Nova Hedwig. 2005, 128, 125–150. [Google Scholar]
  51. Asmund, B.; Hilliard, D.K. Studies on Chrysophyceae from some ponds and lakes in Alaska. Hydrobiologia 1961, 7, 237–258. [Google Scholar] [CrossRef]
  52. Asmund, B.; Hillard, D.K. Studies on Chrysophyceae from some ponds and lakes in Alaska IV. Occurrence of a Mallomonopsis species in brackish water. Hydrobiologia 1965, 26, 521–526. [Google Scholar] [CrossRef]
  53. Asmund, B. Studies on Chrysophyceae from some ponds and lakes in Alaska. VI. Occurrence of Synura species. Hydrobiologia 1968, 31, 497–515. [Google Scholar] [CrossRef]
  54. Asmund, B.; Takahashi, E. Studies on Chrysophyceae from some ponds and lakes in Alaska. VIII. Mallomonas species examined with the electron microscope II. Hydrobiologia 1969, 34, 305–321. [Google Scholar] [CrossRef]
  55. Kristiansen, J. Silica-scaled chrysophytes from west Greenland: Disko island and the Søndre Strømfjord region. Nord. J. Bot. 1992, 12, 525–536. [Google Scholar] [CrossRef]
  56. Škaloud, P.; Škaloudová, M.; Procházková, A.; Němcová, Y. Morphological delineation and distribution patterns of four newly described species within the Synura petersenii species complex (Chrysophyceae, Stramenopiles). Europ. J. Physiol. 2014, 49, 213–229. [Google Scholar]
  57. Jacobsen, V.A. Scale-bearing Chrysophyceae (Mallomonadaceae and Paraphysomonadaceae) from West Greenland. Nord. J. Bot. 1985, 5, 381–398. [Google Scholar] [CrossRef]
  58. Nygaard, G. Freshwater phytoplankton from the Narssaq area, South Greenland. Bot. Tidsskr. 1978, 73, 191–238. [Google Scholar]
  59. Bradley, D.E. A study of Mallomonas, Synura, and Chrysosphaerella of Northern Iceland. J. Gen. Microbiol. 1964, 37, 321–333. [Google Scholar] [CrossRef] [Green Version]
  60. Nicholls, M.P. Observations on chrysophyceae from a Norwegian mountain lake. Brit. Phycol. J. 1981, 16, 373–378. [Google Scholar] [CrossRef]
  61. Němcová, Y. 2016. Available online: http://www.chrysophytes.eu/taxonomy/term/70122.10.20 (accessed on 23 December 2020).
  62. Pichrtová, M.; Janatková, K.; Němcová, Y. Silica-scaled chrysophytes from Abisko (Swedish Lapland). Nord. J. Bot. 2011, 29, 112–118. [Google Scholar] [CrossRef]
  63. Němcová, Y.; Nováková, S.; Řezáčová-Škaloudová, M. Synura obesa sp. nov. (Synurophyceae) and other silica scaled chrysophytes from Abisko (Swedish Lapland). Nova Hedwig. 2008, 86, 243–254. [Google Scholar] [CrossRef] [Green Version]
  64. Ikävalko, J.; Thomsen, H.A. Scale-covered and loricate flagellates (Chrysophyceae and Synurophyceae) from Baltic Sea ice. Nova Hedwig. Beih. 1994, 114, 147–160. [Google Scholar]
  65. Cronberg, G. Mallomonas variabilis, sp. nov. (Synurophyceae) with stomatocysts found in Lake Konnevesi, Finland. In Chrysophyte Algae; Sandgren, C.D., Smol, J.P., Eds.; Cambridge University Press: Cambridge, UK, 1995; pp. 333–344. [Google Scholar]
  66. Kristiansen, J. Flagellates from Finnish Lappland. Bot. Tidsskr. 1964, 59, 315–333. [Google Scholar]
  67. Eloranta, P. Notes on the scaled chrysophytes (Synuraceae, Chrysophyceae) in small lake in and near Salamasajärvi Ntional Park western Finland. Memo. Soc. Fauna Flora Fenn. 1985, 61, 77–83. [Google Scholar]
  68. Eloranta, P. Scaled chrysophytes (Chrysophyceae and Synurophyceae) from national park lakes in southern and central Finland. Nord. J. Bot. 1989, 8, 671–681. [Google Scholar] [CrossRef]
  69. Eloranta, P. Biogeography of chrysophytes in Finnish lakes. In Chrysophyte Algae: Ecology, Phylogeny and Development; Sandgren, C.D., Smo, J.P., Kristiansen, J., Eds.; Cambridge University Press: Cambridge, UK, 1995; pp. 214–231. [Google Scholar]
  70. Ikävalko, J. Contribution to the flora of silica-scaled flagellates in Mikkeli, central Finland. Nova Hedwig. 1994, 58, 475–505. [Google Scholar]
  71. Ikävalko, J. Observations on silica-scaled flagellates (Chrysophyceae and Synurophyceae) in the brackish water of Pojo Bay, SW coast of Finland. Ann. Bot. Fen. 1994, 31, 1–27. [Google Scholar]
  72. Voloshko, L.N.; Gavrilova, O.V.; Gromov, B.V. Diversity of Chrysophyta (Paraphysomonadaceae, Mallomonadaceae, Synuraceae) in Lake Ladoga. Phycology 2002, 12, 25–35. (In Russian) [Google Scholar]
  73. Voloshko, L.N.; Gavrilova, O.V. Algae blooming in waters of the Northwest Russia. In Phylum Chrysophyta–Golden Algae; KMK Publishing House: Moscow, Russia, 2006; pp. 144–177. (In Russian) [Google Scholar]
  74. Balonov, I.M. Golden algae of the family Synuraceae lemm. in waters of Karelia. Inland Water Biol. 1979, 42, 1–26. (In Russian) [Google Scholar]
  75. Voloshko, L.N. New species of the genus Mallomonas (Chrysophyta, Synurophyceae) from lakes of the Vorkuta tundra. Bot. Zhurn. 2012, 97, 1090–1098. (In Russian) [Google Scholar]
  76. Voloshko, L.N. The new taxa of the genus Mallomonas (Chrysophyta, Synurophyceae) from the glacial lakes of Polar Ural (Russia). Bot. Zhurn. 2009, 94, 1068–1076. (In Russian) [Google Scholar]
  77. Voloshko, L.N. The chrysophycean algae from glacial lakes of Polar Ural (Russia). Nova Hedwig. Beih. 2010, 136, 191–211. [Google Scholar] [CrossRef]
  78. Bessudova, A.Y.; Firsova, A.D.; Sorokovikova, L.M.; Tomberg, I.V. Silica-Scaled Chrysophytes of the Lower Yenissei River and Gulfs of the Kara Sea with Elements of Autecology; Likhoshway, Y.V., Ed.; Publishing house of the V.B. Sochava Institute of Geography SB RAS: Irkutsk, Russia, 2016; p. 110. (In Russian) [Google Scholar]
  79. Bessudova, A.; Bukin, Y.S.; Sorokovikova, L.M.; Firsova, A.D.; Tomberg, I.V. Silica-scaled Chrysophytes in Small Lakes of the Lower Yenisei Basin, the Arctic. Nova Hedwig. 2018, 107, 315–336. [Google Scholar] [CrossRef]
  80. Firsova, A.D.; Bessudova, A.Y.; Sorokovikova, L.M.; Tomberg, I.V.; Likhoshway, Y.V. The diversity of chrysophycean algae in an arctic zone of river and sea water mixing, Russia. Am. J. Plant Sci. 2015, 6, 2439–2452. [Google Scholar] [CrossRef] [Green Version]
  81. Balonov, I.M.; Kuzmina, A.E. Golden algae. In Proceeding of Limnological Institute, RAS of the Academy of Sciences of USSRP; Votintsev, K.K., Ed.; Hydrochemical and Hydrobiological Studies of the Khantay Reservoir, Nauka, Siberian Branch: Novosibirsk, Russia, 1986; pp. 59–70. (In Russian) [Google Scholar]
  82. Bessudova, A.; Tomberg, I.V.; Firsova, A.D.; Kopyrina, L.I.; Likhoshway, Y.V. Silica-scaled chrysophytes in lakes Labynkyr and Vorota of the Sakha (Yakutia) Republic, Russia. Nova Hedwig. Beih. 2019, 148, 35–48. [Google Scholar] [CrossRef]
  83. Kuzmina, A.E.; Kuzmin, G.V. First data on golden algae of the family Synuraceae Lemm. In Magadan Oblast; Books of Abstract of the X All-Soviet Union Workshop «Biological Problems of North» Part 2; Magadan, Russia, 1983; pp. 258–259. (In Russian) [Google Scholar]
  84. Thorleifson, L.H. Review of Lake Agassiz History. In Sedimentology, Geomorphology, and History of the Central Lake Agassiz Basin; Teller, J.T., Thorleifson, L.H., Matile, G., Brisbin, W.C., Eds.; Field Trip Guidebook B2; Geological Association of Canada Annual Meeting: St. John’s, NL, Canada, 1996; pp. 55–84. [Google Scholar]
  85. Teller, J.T.; Boyd, M.; Yang, Z.R.; Kor, P.S.G.; Fard, A.M. Alternative routing of Lake Agassiz overflow during the Younger Dryas: New dates, paleotopography, and a reevaluation. Quat. Sci. Rev. 2005, 24, 1890–1905. [Google Scholar] [CrossRef]
  86. Rudoy, A.N. Ice-dammed lakes and glacial debris super-flows in the Altay and the Sayan Mountains in late Wurm: A review. In Proceedings of the Mudflows: Disasters, Risk, Forecast, Protection, Pyatigorsk, Russia, 22–29 September 2008; pp. 313–316. (In Russian). [Google Scholar]
  87. Rudoy, A.N.; Zemtsov, V.A. New results of modelling hydraulic characteristics of diluvial streams from the Late Quaternary Chuya-Kuray. Ice Snow 2010, 109, 111–118. (In Russian) [Google Scholar]
  88. Rudoy, A.N. A Late Pleistocene ice-dammed lake in the Abai basin in the Upper Koksa valley. Bull. Tomsk. Polutechnic Univ. 2011, 318, 8–13. (In Russian) [Google Scholar]
  89. Michalek, J.M. Examining the progression and termination of Lake Agassiz. Mich. State Univ. 2013, 1–24. [Google Scholar]
  90. Lepper, K.; Buell, A.W.; Fisher, T.G.; Lowell, T.V. A chronology for glacial Lake Agassiz shorelines along Upham’s namesake transect. Quat. Res. 2013, 80, 88–98. [Google Scholar] [CrossRef]
  91. Raghunathan, T.E. What do we do with missing data? Some options for analysis of incomplete data. Annu. Rev. Public Health 2004, 25, 99–117. [Google Scholar] [CrossRef] [Green Version]
  92. Nakagawa, S.; Freckleton, R.P. Missing inaction: The dangers of ignoring missing data. Trends Ecol. Evol. 2008, 23, 592–596. [Google Scholar] [CrossRef] [PubMed]
  93. Brown, C.M.; Arbour, J.H.; Jackson, D.A. Testing of the effect of missing data estimation and distribution in morphometric multivariate data analyses. Syst. Biol. 2012, 61, 941–954. [Google Scholar] [CrossRef]
  94. Nakagawa, S.; Freckleton, R.P. Model averaging, missing data and multiple imputation: A case study for behavioural ecology. Behav. Ecol. Sociobiol. 2011, 65, 103–116. [Google Scholar] [CrossRef]
  95. Newgard, C.D.; Lewis, R.J. Missing data: How to best account for what is not known. JAMA 2015, 314, 940–941. [Google Scholar] [CrossRef] [PubMed]
  96. Anderson, M.J. A new method for non-parametric multivariate analysis of variance. Austral. Ecol. 2001, 26, 32–46. [Google Scholar]
  97. Dyson, K. Custom Community Ecology Helper R Scripts [Internet]. 2018. Available online: https://github.com/kdyson/R_Scripts (accessed on 23 December 2020).
  98. Dyson, K. Vegetation communities on commercial developments are heterogenous and determined by development and landscaping decisions, not socioeconomics. PLoS ONE 2019, 14, e0222069. [Google Scholar]
  99. Kassambara, A. Practical Guide to Principal Component Methods in R: PCA, M (CA), FAMD, MFA, HCPC, Factoextra. STHDA. 2017. Available online: http://www.sthda.com/english/articles/31-principal-component-methods-in-r-practical-guide/ (accessed on 18 November 2020).
  100. Kristiansen, J. Cosmopolitan chrysophytes. Syst. Geog. Plants 2000, 70, 291–300. [Google Scholar] [CrossRef]
  101. Kristiansen, J. Dispersal and biogeography of silica-scaled chrysophytes. Biodiv. Conserv. 2008, 17, 419–426. [Google Scholar] [CrossRef]
  102. Siver, P.A. Mallomonas aperturae sp. nov. (Synurophyceae) reveals that the complex cell architecture observed on modern synurophytes was well established by the middle Eocene. Phycologia 2018, 57, 273–279. [Google Scholar] [CrossRef] [Green Version]
  103. Němcová, Y.; Neustupa, J.; Novakova, S.; Kalina, T. Silica-scaled chrysophytes of the Czech Republic. Acta Univ. Carol. Geol. 2003, 47, 285–346. [Google Scholar]
  104. Siver, P.A. The distribution of chrysophytes along environmental gradients: Their use as biologicalindicators. In Chrysophyte Algae; Sandgren, C.D., Smol, J.P., Kristiansen, J., Eds.; Cambridge University Press: Cambridge, UK, 1995; pp. 232–268. [Google Scholar]
  105. Kristiansen, J. Golden Algae: A Biology of Chrysophytes; A.R.G. Gantner Verlag: Königstein, Germany, 2005; p. 167. [Google Scholar]
  106. Siver, P.A. Synurophyte Algae. In Freshwater Algae of North America: Ecology and Classification, 2nd ed.; Academic Press: Boston, MA, USA, 2015; pp. 607–651. [Google Scholar]
  107. Siver, P.A.; Lott, A.M. The scaled chrysophyte flora in freshwater ponds and lakes from Newfoundland, Canada, and their relationship to environmental variables. Cryptogam. Algol. 2017, 38, 325–347. [Google Scholar] [CrossRef]
  108. Bessudova, A.; Domysheva, V.M.; Firsova, A.D.; Likhoshway, Y.V. Silica-scaled chrysophytes of Lake Baikal. Acta Biol. Sib. 2017, 3, 47–56. [Google Scholar] [CrossRef] [Green Version]
  109. Moore, J.W. Factors influencing the diversity, species composition ans abundance of phytoplankton in twenty one arctic and Subarctic lakes. Int. Rev. Ges. Hydrobiol. Hydrogr. 1979, 64, 591–601. [Google Scholar] [CrossRef]
  110. Alexander, V.; Stanley, D.W.; Daley, R.I.; McRoy, C.P. Primary producers. In Limnology of Tundra Ponds; Hobbie, J.E., Ed.; Dowden, Hutchinson and Ross, Inc.: Stroudsburg, PA, USA, 1980; pp. 179–223. [Google Scholar]
  111. Starmach, K. Chrysophyceae and Haptophyceae; Gustav Fischer, Verlag: Jena, Germany, 1985. [Google Scholar]
  112. Kristiansen, J.; Preisig, H.R. Chrysophyte and Haptophyte Algae. 2 Teil/Part 2: Synurophyceae. In Freshwater Flora of Central Europe; Budel, B., Gartner, G., Krienitz, L., Preisig, H.R., Schagerl, M., Eds.; Springer: Berlin/Heidelberg, Germany, 2007; p. 252. [Google Scholar]
  113. Siver, P.A.; Lott, A.M. Biogeographic patterns in scaled chrysophytes from east coast of North America. Freshw. Biol. 2012, 57, 451–466. [Google Scholar] [CrossRef]
  114. Kwiatkowski, R.E.; Roff, J.C. Effects of acidity on the phytoplankton and primary productivity of selected northern Ontario lakes. Can. J. Bot. 1976, 54, 2546–2561. [Google Scholar] [CrossRef]
  115. Locke, A.; Sprules, W.G. Effects of acidic pH and phytoplankton on survival and condition of Bosmina longirostris and Daphnia pulex. Hydrobiologia 2000, 437, 187–196. [Google Scholar] [CrossRef]
  116. Moldan, F.; Cosby, B.J.; Wright, R.F. Modeling past and future acidification of Swedish lakes. AMBIO 2013, 42, 577–586. [Google Scholar] [CrossRef] [PubMed] [Green Version]
  117. Matz, V.D.; Ufimtsev, G.F.; Mandelbaum, M.M. Cenozoic of the Baikal Rift Basin: Structure and Geological History; Academic Publishing House Geo: Novosibirsk, Russia, 2001; p. 252. (In Russian) [Google Scholar]
  118. Bondarenko, N.A.; Genkal, S.I. On the discovery of Baikal endemic algae in mountain lakes in Transbaikalia. Bot. J. 2005, 90, 1398–1411. (In Russian) [Google Scholar]
  119. Kozhova, O.M.; Zagorenko, G.F.; Ladeyschikova, E.N. Features of phytoplankton oz. Khubsugul. Hydrobiol. J. 1977, 13, 77–82. (In Russian) [Google Scholar]
  120. Edlund, M.B.; Soninkhishig, N.; Stoermer, E.F. The diatom (Bacillariophyta) flora of Lake Hövsgöl National Park, Mongolia. In The Geology, Biodiversity and Ecology of Lake Hövsgöl (Mongolia); Goulden, C., Sitnikova, T., Gelhaus, J., Boldgiv, B., Eds.; Backhuys Publishers: Leiden, The Netherlands, 2006; pp. 145–177. [Google Scholar]
  121. Dorofeyuk, N.I.; Tsetsegmaa, D. Summary of the Flora of Algae of Mongolia; Science: Moscow, Russia, 2002; p. 282. (In Russian) [Google Scholar]
  122. Genkal, S.I.; Popovskaya, G.I.; Belikh, O.I.; Firsova, A.D. New and interesting diatoms in plankton of Lake Khubsugul: Centrophyceae. Inland Water Biol. 2005, 4, 3–8. (In Russian) [Google Scholar]
  123. Usoltseva, M.; Kopyrina, L.; Titova, L.; Morozov, A.; Firsova, A.; Zakharova, Y.; Bashenkhaeva, M.; Maslennikova, M.; Likhoshway, Y. Finding of a putative Lake Baikal endemic, Lindavia minuta, in distant lakes near the Arctic pole in Yakutia (Russia). Diatom Res. 2020, 35, 141–153. [Google Scholar] [CrossRef]
  124. Schlichting, H.E. The role of waterfowl in the dispersal of algae. Trans. Am. Micros. Soc. 1960, 79, 160–166. [Google Scholar] [CrossRef]
  125. Hopkins, D.M. History of Sea Level in Beringia for the Last 250,000 Years, Beringia in the Cenozoic Era; Far East Branch of the Academy of Sciences of the USSR: Vladivostok, Russia, 1976; pp. 9–25. (In Russian) [Google Scholar]
  126. Finlay, B.J.; Clarke, K.J. Ubiquitous dispersal of microbial species. Nature 1999, 400, 828. [Google Scholar] [CrossRef]
  127. Finlay, B.J. Global dispersal of free-living microbial eukaryote species. Science 2002, 296, 1061–1063. [Google Scholar] [CrossRef] [Green Version]
  128. Becking, B. Geobiologie of Inleiding tot de Milieukunde; Van Stockum & Zoon: The Hague, The Netherlands, 1934. [Google Scholar]
  129. O’Malley, M.A. ‘Everything is everywhere: But the environment selects’: Ubiquitous distribution and ecological determinism in microbial biogeography. Stud. Hist. Philos. Biol. Biomed. Sci. 2008, 39, 314–325. [Google Scholar] [CrossRef] [PubMed]
  130. Padisák, J.; Vasas, G.; Borics, G. Phycogeography of freshwater phytoplankton: Traditional knowledge and new molecular tools. Hydrobiologia 2016, 764, 3–27. [Google Scholar] [CrossRef]
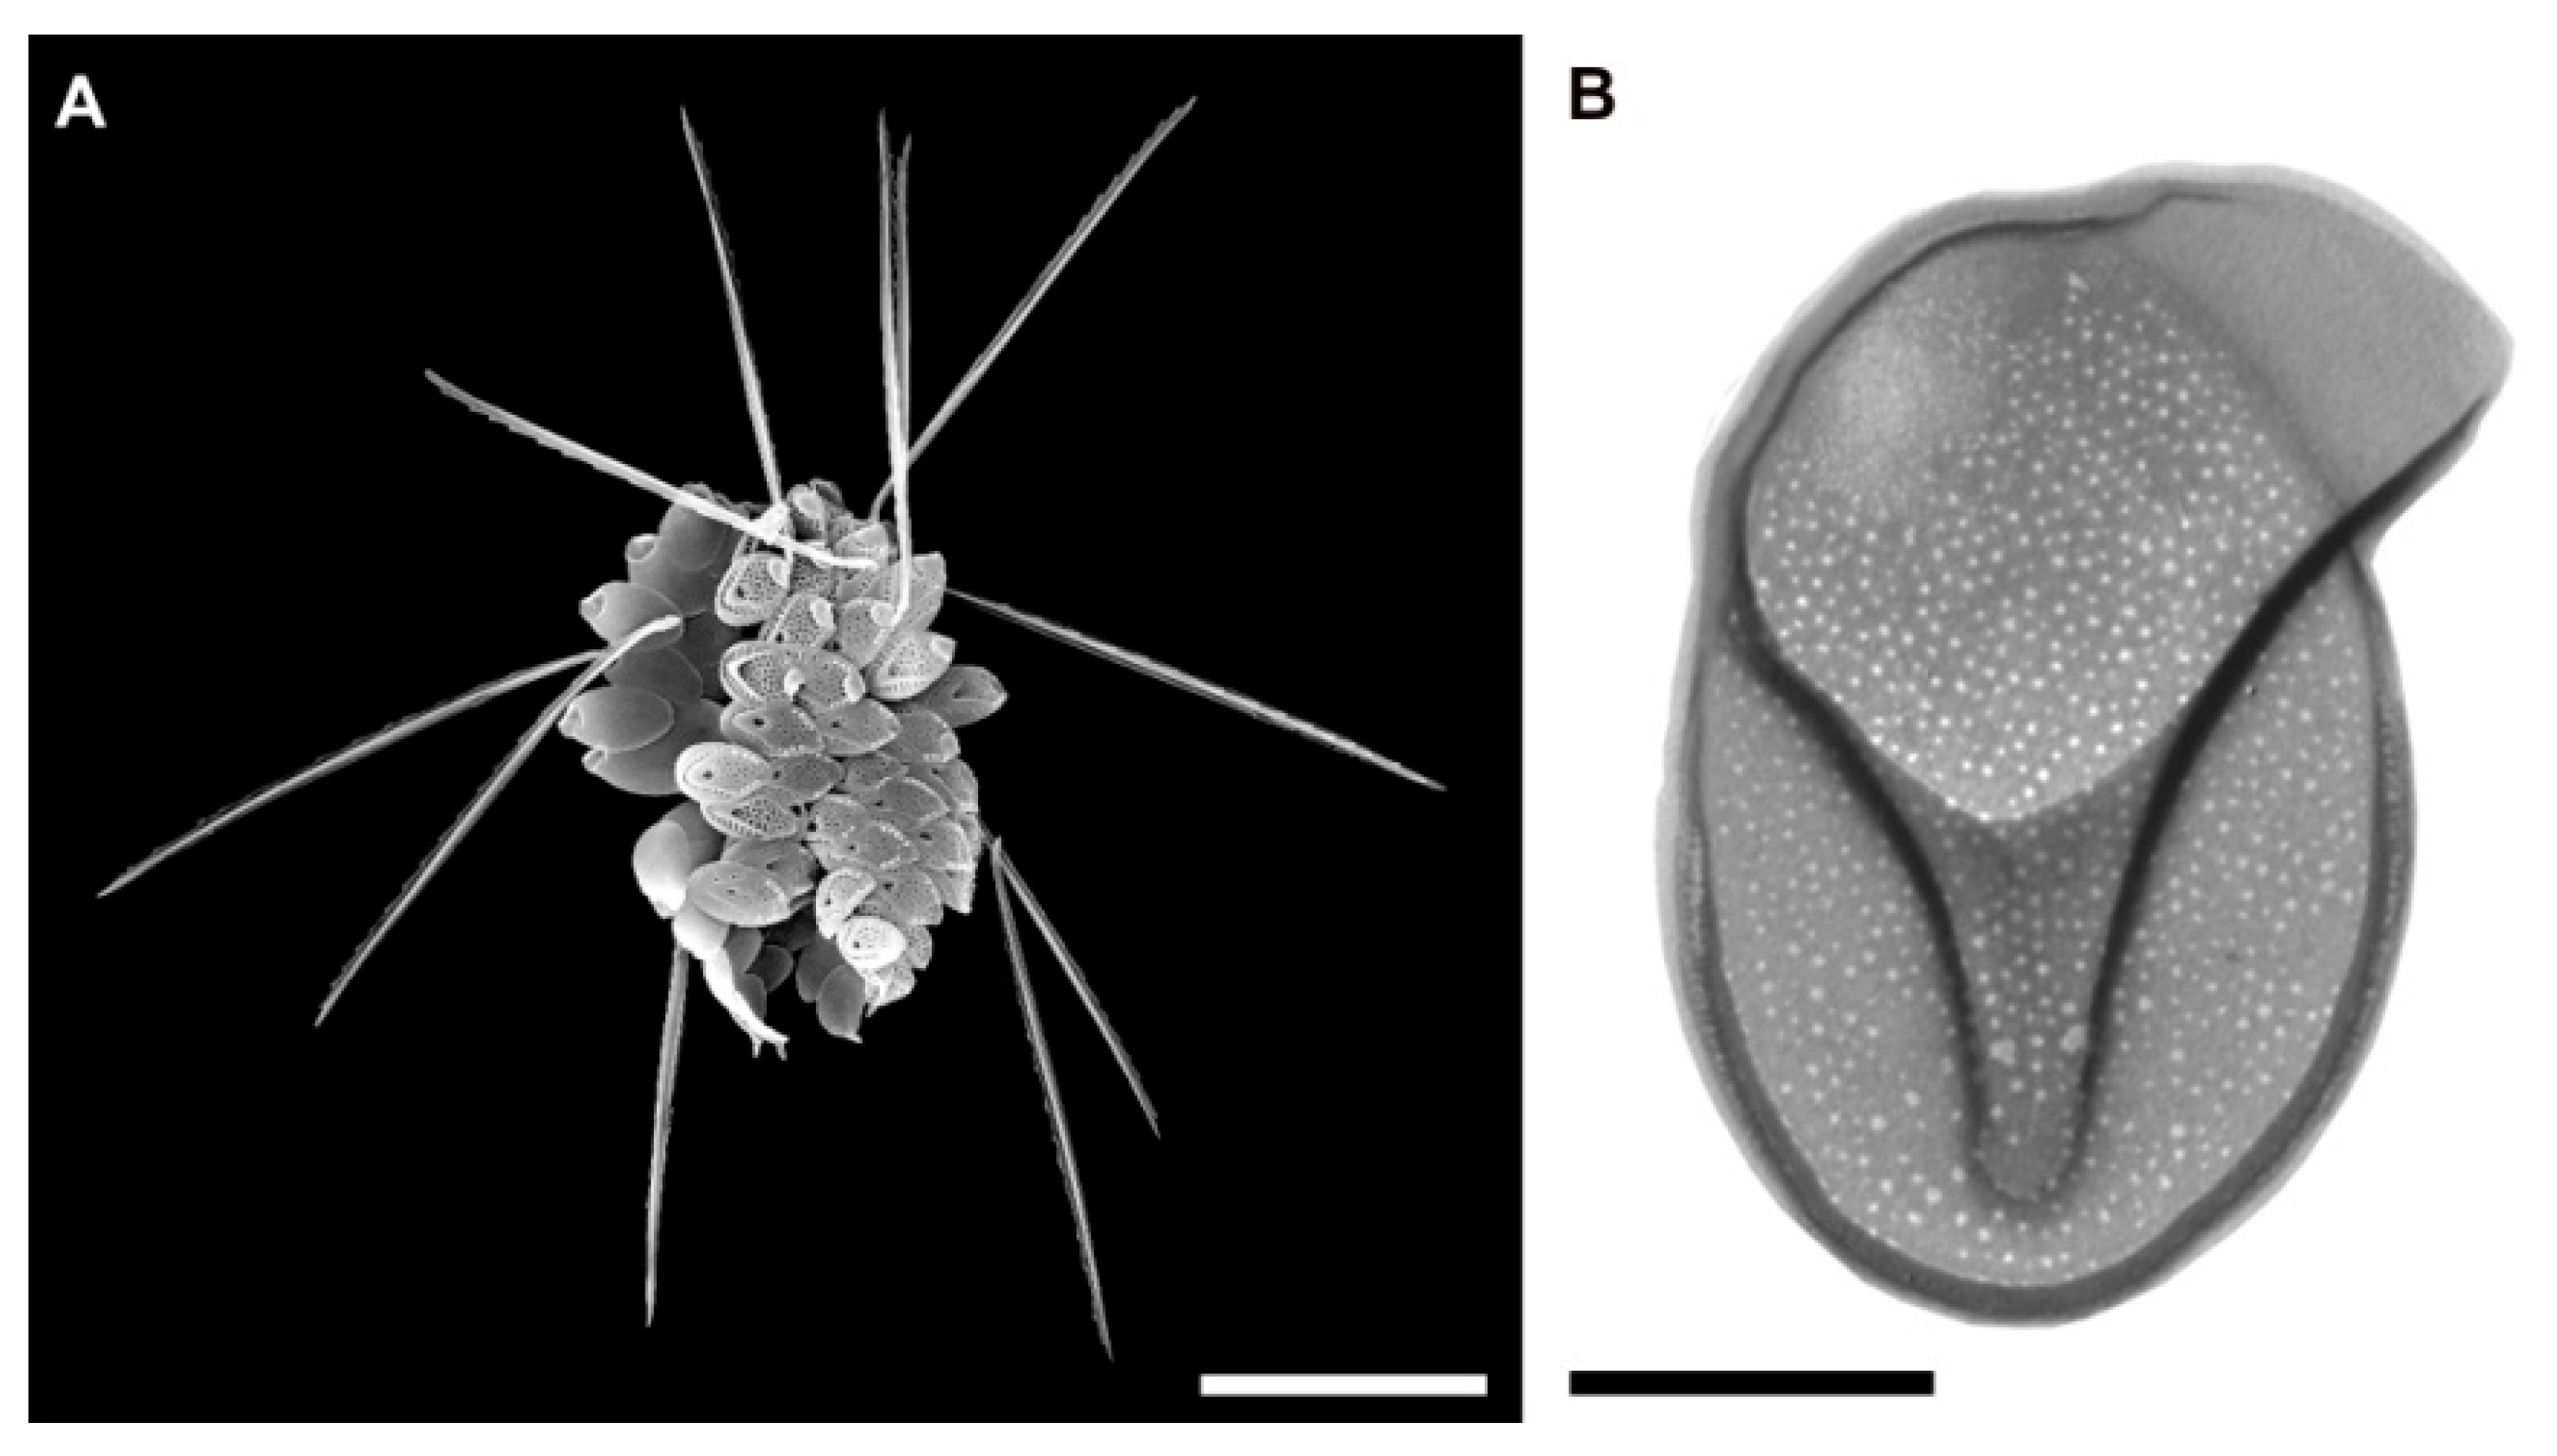
Figure 1. Micrographs of silica-scaled chrysophytes of the genus Mallomonas (ASEM; B—TEM). (A) Cell of Mallomonas crassisquama var. papillosa; (B) scale of M. vannigera. Scale: (A) 10 µm; (B) 2 µm.
Diversity 13 00284 g001
Figure 2. Map of the studied regions (numbers correspond to Table 1). Climatic zones are set up according to B.P. Alisov (1936) [48]: rose—arctic; blue—subarctic; green—temperate; solid line—Northern Polar Circle. Boundaries of the Pleistocene glaciation (dotted line) are given according to M.G. Grosswald (2009) [47]; the star shows the location of the Giraffe and Wombat kimberlite deposits [21,26]. The map was generated using the free software QGis v. 3.14.16 and edited in free image editor GIMP 2.10.0.
Diversity 13 00284 g002
Figure 3. Distribution of 165 species and intraspecific taxa of silica-scaled chrysophytes among the climatic zones (see Figure 2).
Diversity 13 00284 g003
Figure 4. Number of species to a fossil taxon, species closely related to the fossil taxa (to Siver et al., 2013; 2015) [25,26], and other species of silica-scaled chrysophytes in the analyzed regions. The numbers of the regions correspond to those given in Figure 2 and Table 1; data on species occurrence are given in the references in Table 1. (A) Number of species; (B) Percentage of species.
Diversity 13 00284 g004
Figure 5. Heat map of species representation status in the regions. Painted boxes at the intersection of rows and columns indicate that the species occurs in at least one water body in the region. Rows and columns of the heat map are ordered according to clustering results. Left and upper parts show dendrograms of clustering of regions and species by similarity of representation status.
Diversity 13 00284 g005
Figure 6. Impact of qualitative abiotic factors on species richness. (A) Dependence of the species richness on water temperature (T) described by third degree polynomial (species richness = −19.65 × T3 − 14.9 × T2 + 6.83 × T + 10.07); circles show data of real observations, central dashed line shows the main dependence, upper and lower dashed line and gray sector show the 96% confidence interval. (B). Dependence of the species richness on conductivity described by a linear function (species richness = −0.04 × conductivity + 12.04); circles show data of real observations, central dashed line shows the main dependence, upper and lower dashed line and gray sector show the 96% confidence interval. (C) Dependence of the species richness on sampling region factor visualized as boxplots.
Diversity 13 00284 g006
Figure 7. Circumpolar freshwater network. Distribution of ice sheets during maximum glaciation according to M.G. Grosswald (2009) [47] and of ice-dammed lakes throughout their existence and migration according to Thorleifson (1996) [84], Grosswald (1999) [45], Teller et al. (2005) [85], Rudoy (2008) [86], Rudoy and Zemtsov (2010) [87], Rudoy, (2011) [88], Michalek (2013) [89] and Lepper et al. (2013) [90]. The blue and red lines correspond to clustering of regions similar in representation status of the species shown in Figure 5. The map was generated using the free software QGis v. 3.14.16 and edited in free image editor GIMP 2.10.0.
Diversity 13 00284 g007
Table 1. Regions above the 60th parallel north, in which silica-scaled chrysophytes have been found.
No.RegionClimatic ZonesLocalityCoordinatesReferencesNumber of Water Bodies in the RegionVariation of the Number of Taxa in Water Bodies of a RegionTotal Number of Taxa in the Region
1.AlaskaTemperateAlaska60°20′–68°6′ N,
154°5′–165°45′ W
[51,52,53,54]150 to 1332
2.Northern CanadaSubarcticNorthern Canada68°20′–69°30′ N, 132°30′–133°50′ W[12]90 to 917
3.West GreenlandArcticDisko Island
Oqaq Island
district S. Nipisat Island Strømfjord
67°–69° N[55,56]520 to 953
63°40′–64°25′ N, 50°10′–52° W[57]210 to 24
4.Southern GreenlandArcticSouthern Greenland60°91′24″ N,
46°04′76″ W
[58]23 to 1012
5.IcelandSubarcticNorthern Iceland65°41′42″ N,
18°7′15″ W
[59]104 to 830
South-West64°11′49″ N,
21°8′13″ W
[13]11
6.Sweden–Norway borderTemperateSweden–Norway border69°05′ N,
20°87′ E
[14]124
Central NorwayCentral Norway62°15′ N, 0°15′ E[60]12
Barduelva
Norway
69°0′50″ N,
18°29′5″ E
[56] 1
a pond in Nygårdsparken, Bergen60°23′10″ N,
5°19′28″ E
[56]
7.SwedenTemperateSweden63°35′36″ N,
19°50′11″ E
[61]27 to 3555
Sweden67°75′66″–68°43′30″ N, 18°23′96″–20°09′29″ E[56]101 to 2
Swedish Lapland68°20′–68°26′ N, 18°15′–19°6′ E[62]52 to 23
68°21′N, 18°49′E[63]81 to 4
8.Baltic SeaTemperateBaltic Sea59°58′–64°15′ N, 20°25′–25°27′ E[64]11414
9.FinlandTemperateFinland64°31′12″ N,
26°16′59″ E
[9]1411 to 3792
Finland62°36′3.0456″ N, 26°32′51.27″ E[65]120
Finland61°75′65″–62°88′11″ N,
25°49′72″–26°48′58″ E
[64]81 to 2
Finnish Lapland69°45′–69°46′ N,
27°0′–27°1′ E
[66]16
Western Finland62°7′–63°29′ N,
24°36′–26°48′ E
[67]103 to 9
Southern and central Finland61°42′–63°17′ N,
22°9′–25°28′ E
[68,69]426 to 22
Southern and central Finland61°37′–61°43′ N, 26°54′–26°44′ E[70]821 to 34
Southwestern coast of Finland60°2′30.75″ N, 23°29′36.46″ E[71]149
10.Russia, Leningrad oblast–Karelia borderTemperateRussia, Leningrad oblast–Karelia border60°48′7.4304″ N, 31°30′48.1212″ E[18,72,73]12631
61°46′23.24″ N, 35°19′12.46″ E[73]110
11.Russia, KareliaTemperateRussia, Karelia61°7′–64°27′ N,
33°0′–35° 25′ E
[74]263131
12.Russia, Bolshezemelskaya tundraSubarcticVashutkini lake Kharbey
Vash.-Kharbey
67°57′49.64″ N, 61°31′08.58″ E[50]185 to 2955
13.Russia, Vorkutinskaya tundraSubarcticVorkuta tundra67°23′35″ N,
63°15′80″ E
[50,75]412 to 2851
14.Russia, Polar UralsSubarcticRussia, Polar Urals67°17′–68°07′ N,
65°30–66°04′ E
[76,77]96 to 1944
15.Russia, Lower Yenisei basinSubarcticRussia, Lower Yenisei basin66°35′–73°23′ N, 75°17′–86°34′ E[78,79]60 to 2536
16.Russia, Kara Sea gulfs and baysSubarcticRussia, Kara Sea gulfs and bays69°58′ N–73°23′ N,
80°28′ E–83°32′ E
[78,80]410 to 1822
17.Russia, Khantay ReservoirTemperateRussia, Khantay Reservoir67°40′4″ N,
87°45′32″ E
[81]40 to 2527
18.Russia, Taymyr PeninsulaArcticRussia, Taymyr Peninsula74°37′ N, 101°45′ E[6,7]130 to 1528
19.Russia, North-Western part of YakutiaArcticRussia, Yakutia73°05′ N, 113°59′ E[8]177
20.Russia, Eastern part of YakutiaTemperateRussia, Yakutia62°26′–62°33′ N, 143°33′–143°39′ E[82]213 to 2022
21.Russia, Magadan oblastTemperateRussia, Magadan oblast62°34′33″ N,
154°2′13″ E
[8,83]120 to 1022
Table 2. Results PERMANOVA analysis with estimates based on AICc for selection of the most optimal linear combination of abiotic factor affecting the species richness of chrysophytes in samples.
Influence ModelAICc Information CriterionTotal R2Residual R2
Best influence model: community ~ regions + T526.460.3150.685
Total influence model: community ~ T + pH + conductivity + month + regions536.610.3760.624
Best influence model of the factors on the species composition of communities in water bodies—the combined influence of the facts of the sampling region and the temperature factor at the time of sampling. The individual value of R2 is indicated for the corresponding factor in the formula
Factor + FormulaFactor R2Residual R2p
Regions
community ~ regions + T
0.300790.699210.000999
Regions
community ~ T + regions
0.2950.7050.000999
T
community ~ regions + T
0.014210.985790.000999
T
community ~ T + regions
0.020.980.000999
Table 3. Species of silica-scaled chrysophyceans found in the majority of the water bodies located above the 60th parallel north (see Table 1 for references).
No.TaxonT, °CpHConductivity, µS cm−1
1.Chrysosphaerella brevispina3.9–19.75.5–8.310–708
2.C. coronacircumspina4.5–17.75–8.410–708
3.C. longispina4.5–215–7.613–146
4.Paraphysomonas vestita3.9–19.75–8.113–708
5.Spiniferomonas bourrellyi4.5–19.15–8.311–246
6.S. trioralis3.9–19.75–8.410–708
7.Mallomonas acaroides0.3–185.5–8.319–708
8.M. akrokomos0.3–19.45–8.410–708
9.M. alpina5–19.75.5–819–708
10.M. caudata3.7–175–8.119–708
11.M. crassisquama0.3–205–8.417–709
12.M. elongata8.5–16.85.5–8.321–664
13.M. heterospina6.8–19.75.5–814–708
14.M. punctifera8.4–17.75–8.319–708
15.M. striata3.9–185.5–8.120–708
16.M. tonsurata6.8–16.85–8.416–708
17.Synura spinosa0.3–18.75.5–8.116–664
18.S. petersenii0.3–19.75–8.513–708
Publisher’s Note: MDPI stays neutral with regard to jurisdictional claims in published maps and institutional affiliations.