
Dynamic Response of Soil Enzymes and Microbial Diversity to Continuous Application of Atrazine in Black Soil of a Cornfield without Rotation in Northeast China

Abstract
:1. Introduction
2. Materials and Methods
2.1. Research Site and Soil
2.2. Determination of Atrazine Residues in the Soil
2.3. Determination of Soil Enzyme Activity
2.4. Culturable Soil Microbial Biomass
2.5. Soil Phospholipid Fatty Acid Analysis
2.6. Statistical Analysis
3. Results
3.1. The Residue of Atrazine in the Soil
3.2. Effect of Atrazine on Soil Enzyme Activity
3.3. Effects of Atrazine on Soil Culturable Microorganisms
3.4. Soil PLFA Analysis and Changes in Microbial Community Composition
3.5. Correlation between Soil Microbial Community Composition and Environmental Factors
4. Discussion
5. Conclusions
Author Contributions
Funding
Institutional Review Board Statement
Data Availability Statement
Conflicts of Interest
References
- Gysin, H.; Knüsli, E. Chemistry and the herbicidal properties of triazine derivatives. Adv. Pest Control Res. 1960, 3, 615–623. [Google Scholar]
- Szewczyk, R.; Kuśmierska, A.; Bernat, P. Ametryn removal by Metarhizium brunneum: Biodegradation pathway proposal and metabolic background revealed. Chemosphere 2018, 190, 174–183. [Google Scholar] [CrossRef] [PubMed]
- Metzger, B.A.; Soltani, N.; Raeder, A.J.; Hooker, D.C.; Robinson, D.E.; Sikkema, P.H. Effect of hybrid varieties, application timing, and herbicide rate on field corn tolerance to tolpyralate plus atrazine. Weed Sci. 2019, 67, 475–484. [Google Scholar] [CrossRef]
- Barchanska, H.; Sajdak, M.; Szczypka, K.; Swientek, A.; Tworek, M.; Kurek, M. Atrazine, triketone herbicides, and their degradation products in sediment, soil and surface water samples in Poland. Environ. Sci. Pollut. Res. 2016, 24, 644–658. [Google Scholar] [CrossRef] [PubMed]
- Barrios, R.E.; Akbariyeh, S.; Liu, C.; Gani, K.M.; Kovalchuk, M.T.; Li, X.; Li, Y.; Snow, D.; Tang, Z.; Gates, J.; et al. Climate change impacts the subsurface transport of atrazine and estrone originating from agricultural production activities. Environ. Pollut. 2020, 265 Pt A, 115024. [Google Scholar] [CrossRef]
- Ghirardelli, A.; Otto, S.; Masin, R.; Bano, C.; Altissimo, L.; Russo, S.; Zanin, G. Thirty-year monitoring of s-triazine herbicide contamination in the aquifer north of Vicenza (north-east Italy). Sci. Total. Environ. 2021, 752, 141647. [Google Scholar] [CrossRef]
- Fan, X.; Song, F. Bioremediation of atrazine: Recent advances and promises. J. Soils Sediments 2014, 14, 1727–1737. [Google Scholar] [CrossRef]
- Jablonowski, N.D.; Köppchen, S.; Hofmann, D.; Schäffer, A.; Burauel, P. Persistence of 14C-labeled atrazine and its residues in a field lysimeter soil after 22years. Environ. Pollut. 2009, 157, 2126–2131. [Google Scholar] [CrossRef] [Green Version]
- Huang, H.; Zhang, C.; Rong, Q.; Li, C.; Mao, J.; Liu, Y.; Chen, J.; Liu, X. Effect of two organic amendments on atrazine degradation and microorganisms in soil. Appl. Soil Ecol. 2020, 152, 103564. [Google Scholar] [CrossRef]
- Imfeld, G.; Vuilleumier, S. Measuring the effects of pesticides on bacterial communities in soil: A critical review. Eur. J. Soil Biol. 2012, 49, 22–30. [Google Scholar] [CrossRef]
- Muñoz-Leoz, B.; Ruiz-Romera, E.; Antigüedad, I.; Garbisu, C. Tebuconazole application decreases soil microbial biomass and activity. Soil Biol. Biochem. 2011, 43, 2176–2183. [Google Scholar] [CrossRef]
- Fang, H.; Lian, J.; Wang, H.; Cai, L.; Yu, Y. Exploring bacterial community structure and function associated with atrazine biodegradation in repeatedly treated soils. J. Hazard. Mater. 2015, 286, 457–465. [Google Scholar] [CrossRef] [PubMed]
- Howell, C.C.; Semple, K.T.; Bending, G.D. Isolation and characterisation of azoxystrobin degrading bacteria from soil. Chemosphere 2014, 95, 370–378. [Google Scholar] [CrossRef]
- Vargha, M.; Takats, Z.; Márialigeti, K. Degradation of atrazine in a laboratory scale model system with Danube river sediment. Water Res. 2005, 39, 1560–1568. [Google Scholar] [CrossRef]
- Bhardwaj, P.; Singh, K.R.; Jadeja, N.B.; Phale, P.S.; Kapley, A. Atrazine Bioremediation and Its Influence on Soil Microbial Diversity by Metagenomics Analysis. Indian J. Microbiol. 2020, 60, 388–391. [Google Scholar] [CrossRef]
- Douglass, J.F.; Radosevich, M.; Tuovinen, O.H. Microbial attenuation of atrazine in agricultural soils: Biometer assays, bacterial taxonomic diversity, and catabolic genes. Chemosphere 2017, 176, 352–360. [Google Scholar] [CrossRef] [Green Version]
- Fan, X.; Chang, W.; Sui, X.; Liu, Y.; Song, G.; Song, F.; Feng, F. Changes in rhizobacterial community mediating atrazine dissipation by arbuscular mycorrhiza. Chemosphere 2020, 256, 127046. [Google Scholar] [CrossRef]
- Liu, Y.; Fan, X.; Zhang, T.; He, W.; Song, F. Effects of the long-term application of atrazine on soil enzyme activity and bacterial community structure in farmlands in China. Environ. Pollut. 2020, 262, 114264. [Google Scholar] [CrossRef] [PubMed]
- Sun, J.; Yang, L.; Wei, J.; Quan, J.; Yang, X. The responses of soil bacterial communities and enzyme activities to the edaphic properties of coal mining areas in Central China. PLoS ONE 2020, 15, e0231198. [Google Scholar] [CrossRef] [PubMed]
- Chen, X.; Hao, B.; Jing, X.; He, J.S.; Ma, W.; Zhu, B. Minor responses of soil microbial biomass, community structure and enzyme activities to nitrogen and phos-phorus addition in three grassland ecosystems. Plant Soil 2019, 444, 21–37. [Google Scholar] [CrossRef]
- Wilkinson, S.; Anderson, J.; Scardelis, S.; Tisiafouli, M.; Taylor, A.; Wolters, V. PLFA profiles of microbial communities in decomposing conifer litters subject to moisture stress. Soil Biol. Biochem. 2002, 34, 189–200. [Google Scholar] [CrossRef]
- Ganguly, R.K.; Chakraborty, S.K. Qualitative assessment of paper mill waste valorisation through combinatorial PLFA markers and spectroscopical analysis: An ecotechnology towards waste to resource transformation. Environ. Technol. Innov. 2021, 23, 101532. [Google Scholar] [CrossRef]
- Liu, J.; Zhou, J.H.; Guo, Q.N.; Ma, L.Y.; Yang, H. Physiochemical assessment of environmental behaviors of herbicide atrazine in soils associated with its degrada-tion and bioavailability to weeds. Chemosphere 2020, 262, 127830. [Google Scholar] [CrossRef] [PubMed]
- Graymore, M.; Stagnitti, F.; Allinson, G. Impacts of atrazine in aquatic ecosystems. Environ. Int. 2001, 26, 483–495. [Google Scholar] [CrossRef]
- Douglass, J.F.; Radosevich, M.; Tuovinen, O.H. Molecular analysis of atrazine-degrading bacteria and catabolic genes in the water column and sediment of a created wetland in an agricultural/urban watershed. Ecol. Eng. 2015, 83, 405–412. [Google Scholar] [CrossRef]
- El Sebaï, T.; Devers-Lamrani, M.; Changey, F.; Rouard, N.; Martin-Laurent, F. Evidence of atrazine mineralization in a soil from the Nile Delta: Isolation of Arthrobacter sp TES6, an at-razine-degrading strain. Int. Biodeterior. Biodegrad. 2011, 65, 1249–1255. [Google Scholar] [CrossRef]
- Zhao, X.; Ma, F.; Feng, C.; Bai, S.; Yang, J.; Wang, L. Complete genome sequence of Arthrobacter sp. ZXY-2 associated with effective atrazine degradation and salt adaptation. J. Biotechnol. 2017, 248, 43–47. [Google Scholar] [CrossRef]
- Li, K.-B.; Cheng, J.-T.; Wang, X.-F.; Zhou, Y.; Liu, W.-P. Degradation of Herbicides Atrazine and Bentazone Applied Alone and in Combination in Soils. Pedosphere 2008, 18, 265–272. [Google Scholar] [CrossRef]
- Gil-Sotres, F.; Trasar-Cepeda, C.; Leirós, M.; Seoane, S. Different approaches to evaluating soil quality using biochemical properties. Soil Biol. Biochem. 2005, 37, 877–887. [Google Scholar] [CrossRef]
- Zhang, Q.; Zhu, L.; Wang, J.; Xie, H.; Wang, J.; Wang, F.; Sun, F. Effects of fomesafen on soil enzyme activity, microbial population, and bacterial community composition. Environ. Monit. Assess. 2014, 186, 2801–2812. [Google Scholar] [CrossRef]
- Chen, F.-S.; Fahey, T.J.; Yu, M.-Y.; Gan, L. Key nitrogen cycling processes in pine plantations along a short urban–rural gradient in Nanchang, China. For. Ecol. Manag. 2010, 259, 477–486. [Google Scholar] [CrossRef]
- A Lockington, R.; Rodbourn, L.; Barnett, S.; Carter, C.J.; Kelly, J.M. Regulation by carbon and nitrogen sources of a family of cellulases in Aspergillus nidulans. Fungal Genet. Biol. 2002, 37, 190–196. [Google Scholar] [CrossRef]
- Yan, B.; Wang, X.; Sun, Y.; Fan, B.; Shi, L.; Liu, G. Vegetation rehabilitation increases soil enzyme activities in degraded land via carbon supply and nitrogen retention. Eur. J. Soil Biol. 2020, 98, 103186. [Google Scholar] [CrossRef]
- Xiong, D.; Gao, Z.; Fu, B.; Sun, H.; Tian, S.; Xiao, Y.; Qin, Z. Effect of pyrimorph on soil enzymatic activities and respiration. Eur. J. Soil Biol. 2013, 56, 44–48. [Google Scholar] [CrossRef]
- Zhang, W.; Zhang, M.; An, S.; Lin, K.; Li, H.; Cui, C.; Fu, R.; Zhu, J. The combined effect of decabromodiphenyl ether (BDE-209) and copper (Cu) on soil enzyme activities and microbial community structure. Environ. Toxicol. Pharmacol. 2012, 34, 358–369. [Google Scholar] [CrossRef]
- Thapa, V.R.; Ghimire, R.; Acosta-Martínez, V.; Marsalis, M.A.; Schipanski, M.E. Cover crop biomass and species composition affect soil microbial community structure and enzyme activities in semiarid cropping systems. Appl. Soil Ecol. 2021, 157, 103735. [Google Scholar] [CrossRef]
- Zhang, W.; Zhu, J.; Zhou, X.; Li, F. Effects of shallow groundwater table and fertilization level on soil physico-chemical properties, enzyme activities, and winter wheat yield. Agric. Water Manag. 2018, 208, 307–317. [Google Scholar] [CrossRef]
- Li, H.; Yao, J.; Gu, J.; Duran, R.; Roha, B.; Jordan, G.; Liu, J.; Min, N.; Lu, C. Microcalorimetry and enzyme activity to determine the effect of nickel and sodium butyl xanthate on soil microbial community. Ecotoxicol. Environ. Saf. 2018, 163, 577–584. [Google Scholar] [CrossRef]
- Nim, Y.S.; Wong, K.-B. The Maturation Pathway of Nickel Urease. Inorganics 2019, 7, 85. [Google Scholar] [CrossRef] [Green Version]
- Cheng, H.; Zhang, D.; Huang, B.; Song, Z.; Ren, L.; Hao, B.; Liu, J.; Zhu, J.; Fang, W.; Yan, D.; et al. Organic fertilizer improves soil fertility and restores the bacterial community after 1,3-dichloropropene fumigation. Sci. Total. Environ. 2020, 738, 140345. [Google Scholar] [CrossRef] [PubMed]
- Nsabimana, D.; Haynes, R.; Wallis, F. Size, activity and catabolic diversity of the soil microbial biomass as affected by land use. Appl. Soil Ecol. 2004, 26, 81–92. [Google Scholar] [CrossRef]
- Wang, C.; Xiao, R.; Guo, Y.; Wang, Q.; Cui, Y.; Xiu, Y.; Ma, Z.; Zhang, M. Changes in soil microbial community composition during Phragmites australis straw decomposition in salt marshes with freshwater pumping. Sci. Total. Environ. 2021, 762, 143996. [Google Scholar] [CrossRef]
- Cheng, J.; Lee, X.; Gao, W.; Chen, Y.; Pan, W.; Tang, Y. Effect of biochar on the bioavailability of difenoconazole and microbial community composition in a pesti-cide-contaminated soil. Appl. Soil Ecol. 2017, 121, 185–192. [Google Scholar] [CrossRef]
- Díaz-López, M.; García, C.; Garrido, I.; Navarro, S.; Vela, N.; Nicolás, E.; Fenoll, J.; Bastida, F. Solarization-based pesticide degradation results in decreased activity and biomass of the soil microbial community. Geoderma 2019, 354, 113893. [Google Scholar] [CrossRef]
- Fernández-Gómez, M.J.; Nogales, R.; Insam, H.; Romero, E.; Goberna, M. Role of vermicompost chemical composition, microbial functional diversity, and fungal com-munity structure in their microbial respiratory response to three pesticides. Bioresour. Technol. 2011, 102, 9638–9645. [Google Scholar] [CrossRef] [PubMed]
- Sun, G.; Du, Y.; Yin, J.; Jiang, Y.; Zhang, D.; Jiang, B.; Li, G.; Wang, H.; Kong, F.; Su, L.; et al. Response of microbial communities to different organochlorine pesticides (OCPs) contamination levels in contaminated soils. Chemosphere 2019, 215, 461–469. [Google Scholar] [CrossRef] [PubMed]
- Udiković-Kolić, N.; Scott, C.; Martin-Laurent, F. Evolution of atrazine-degrading capabilities in the environment. Appl. Microbiol. Biotechnol. 2012, 96, 1175–1189. [Google Scholar] [CrossRef] [PubMed]
- Omotayo, A.E.; Ilori, M.; Radosevich, M.; Amund, O.O. Metabolism of Atrazine in Liquid Cultures and Soil Microcosms byNocardioidesStrains Isolated from a Contaminated Nigerian Agricultural Soil. Soil Sediment Contam. Int. J. 2013, 22, 365–375. [Google Scholar] [CrossRef]
- Miura, T.; Makoto, K.; Niwa, S.; Kaneko, N.; Sakamoto, K. Comparison of fatty acid methyl ester methods for characterization of microbial communities in forest and arable soil: Phospholipid fraction (PLFA) versus total ester linked fatty acids (EL-FAME). Pedobiologia 2017, 63, 14–18. [Google Scholar] [CrossRef]
 : Treat 1;
  : Treat 2.
: Treat 1; : Treat 2.
: Treat 2.
: Treat 1; : Treat 2.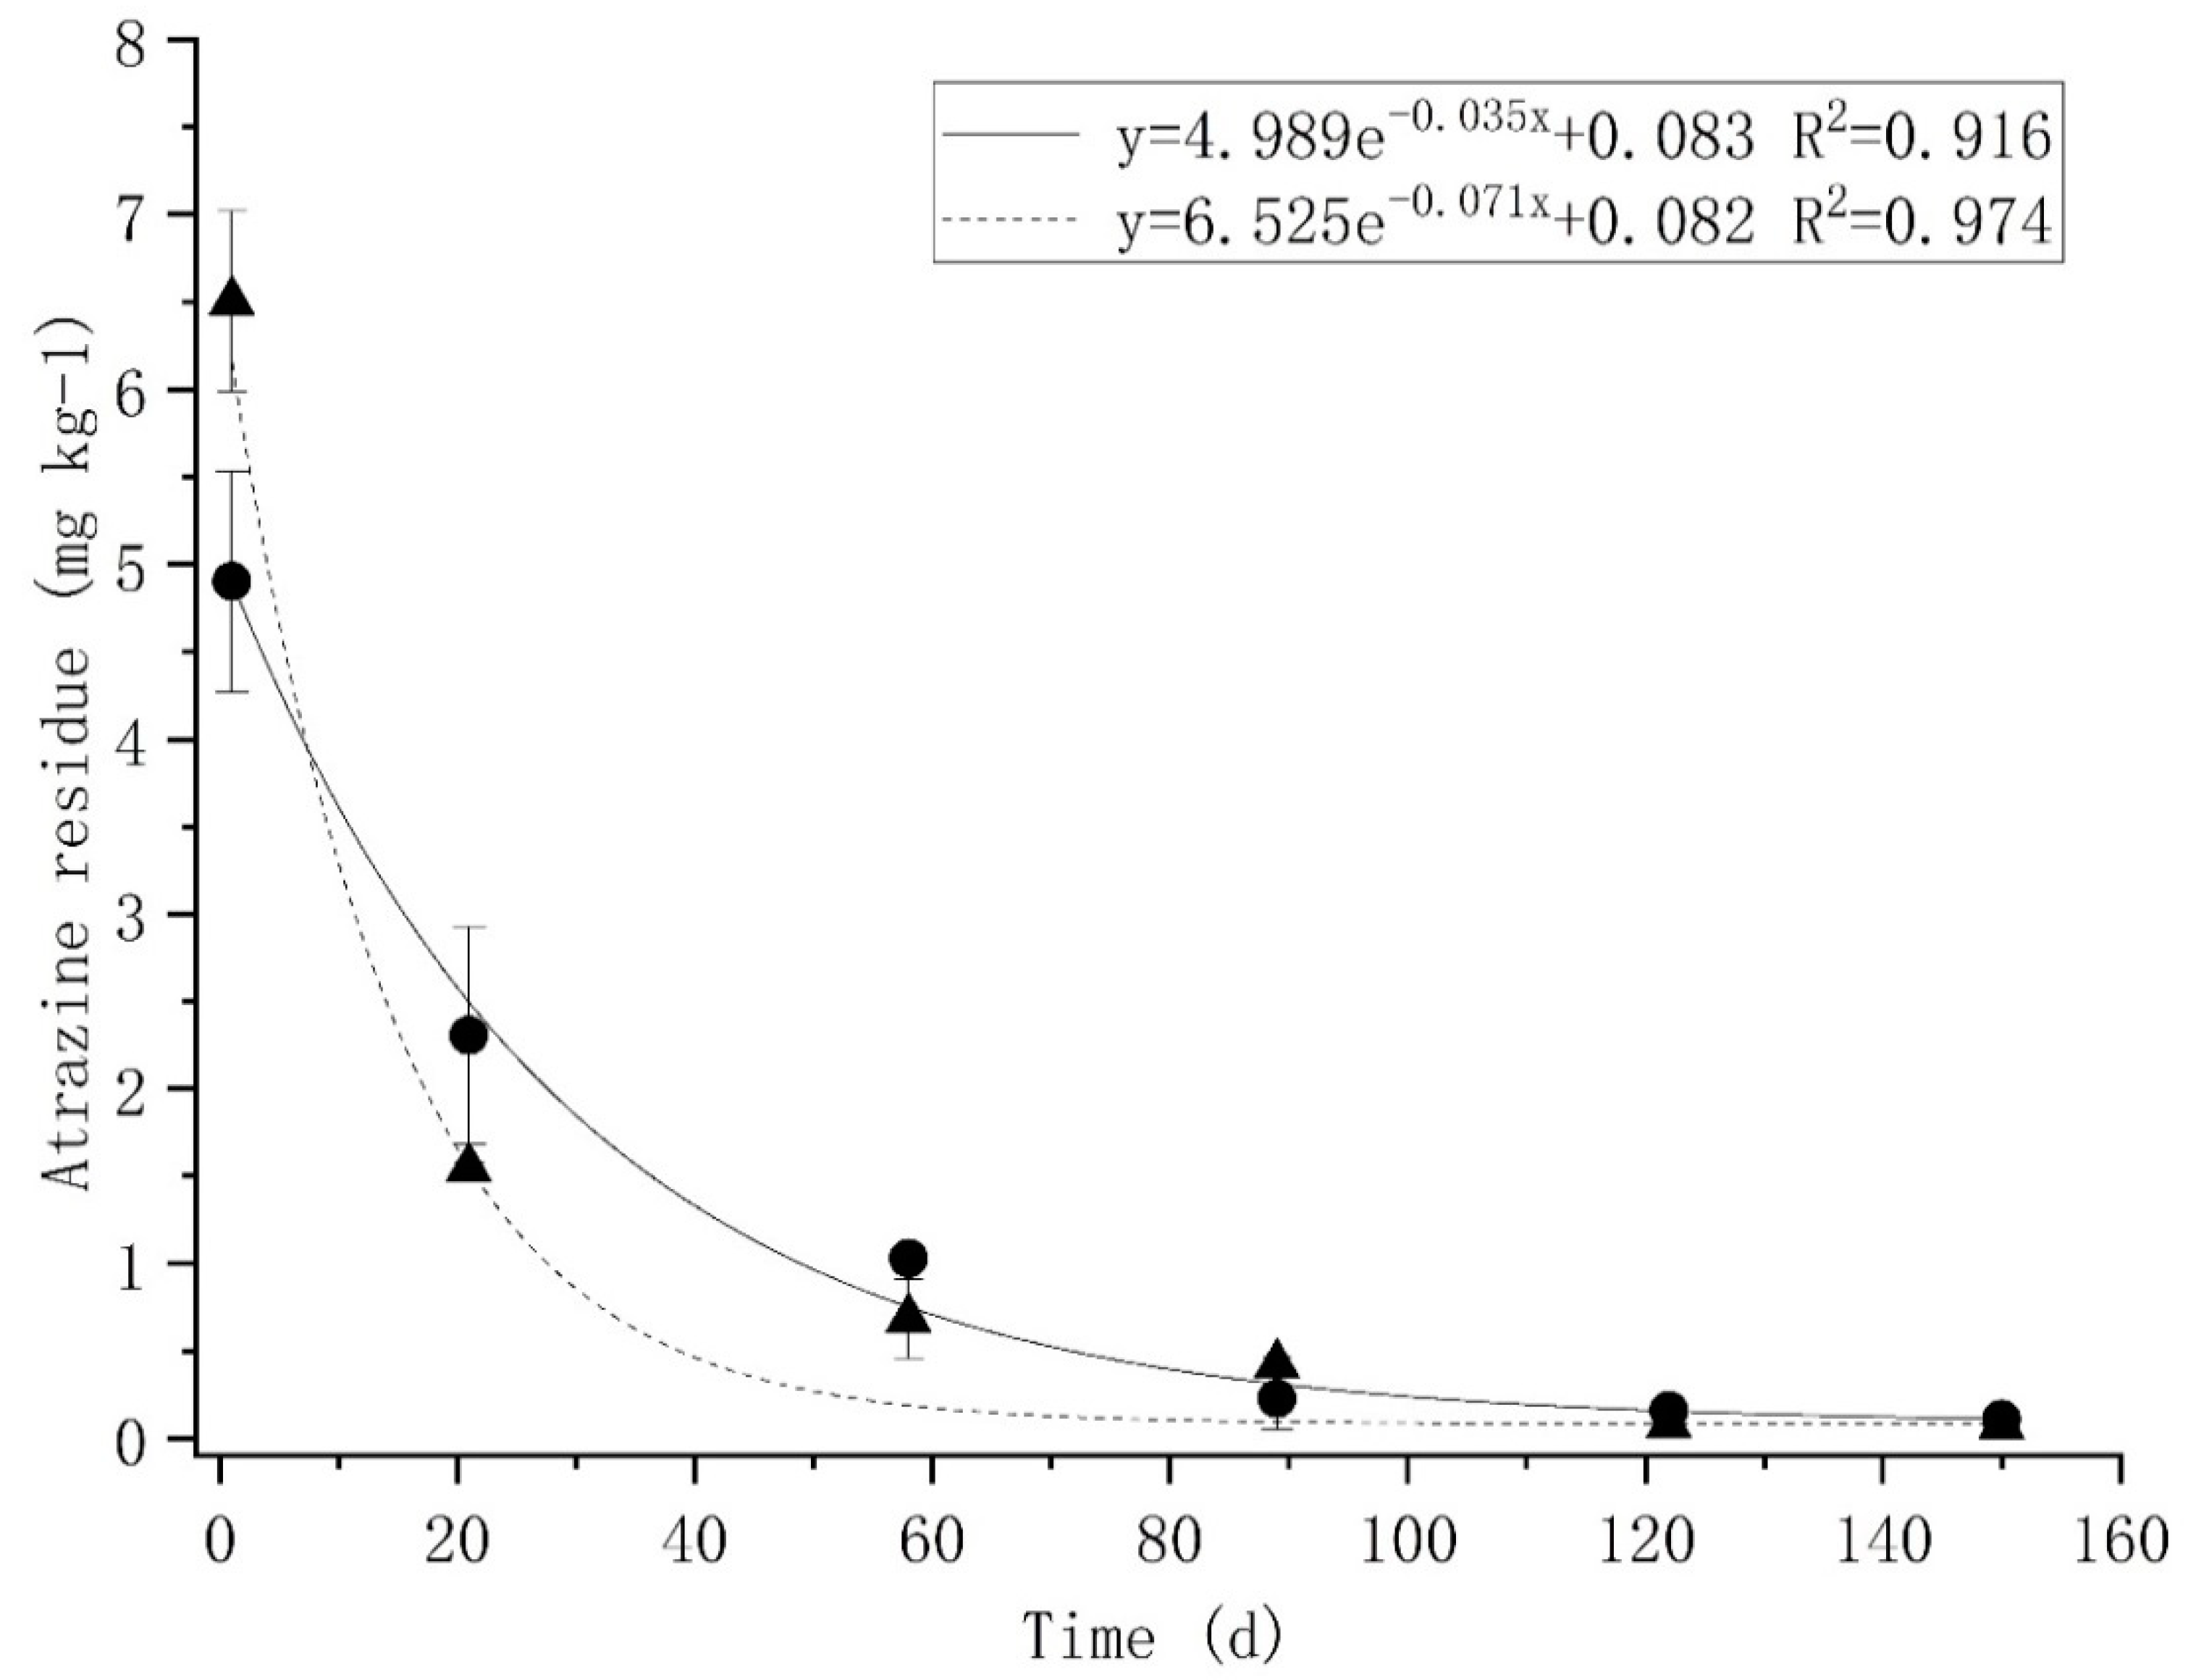
 : CK; : Treat 1; : Treat 2.
: CK; : Treat 1; : Treat 2.
: CK; : Treat 1; : Treat 2.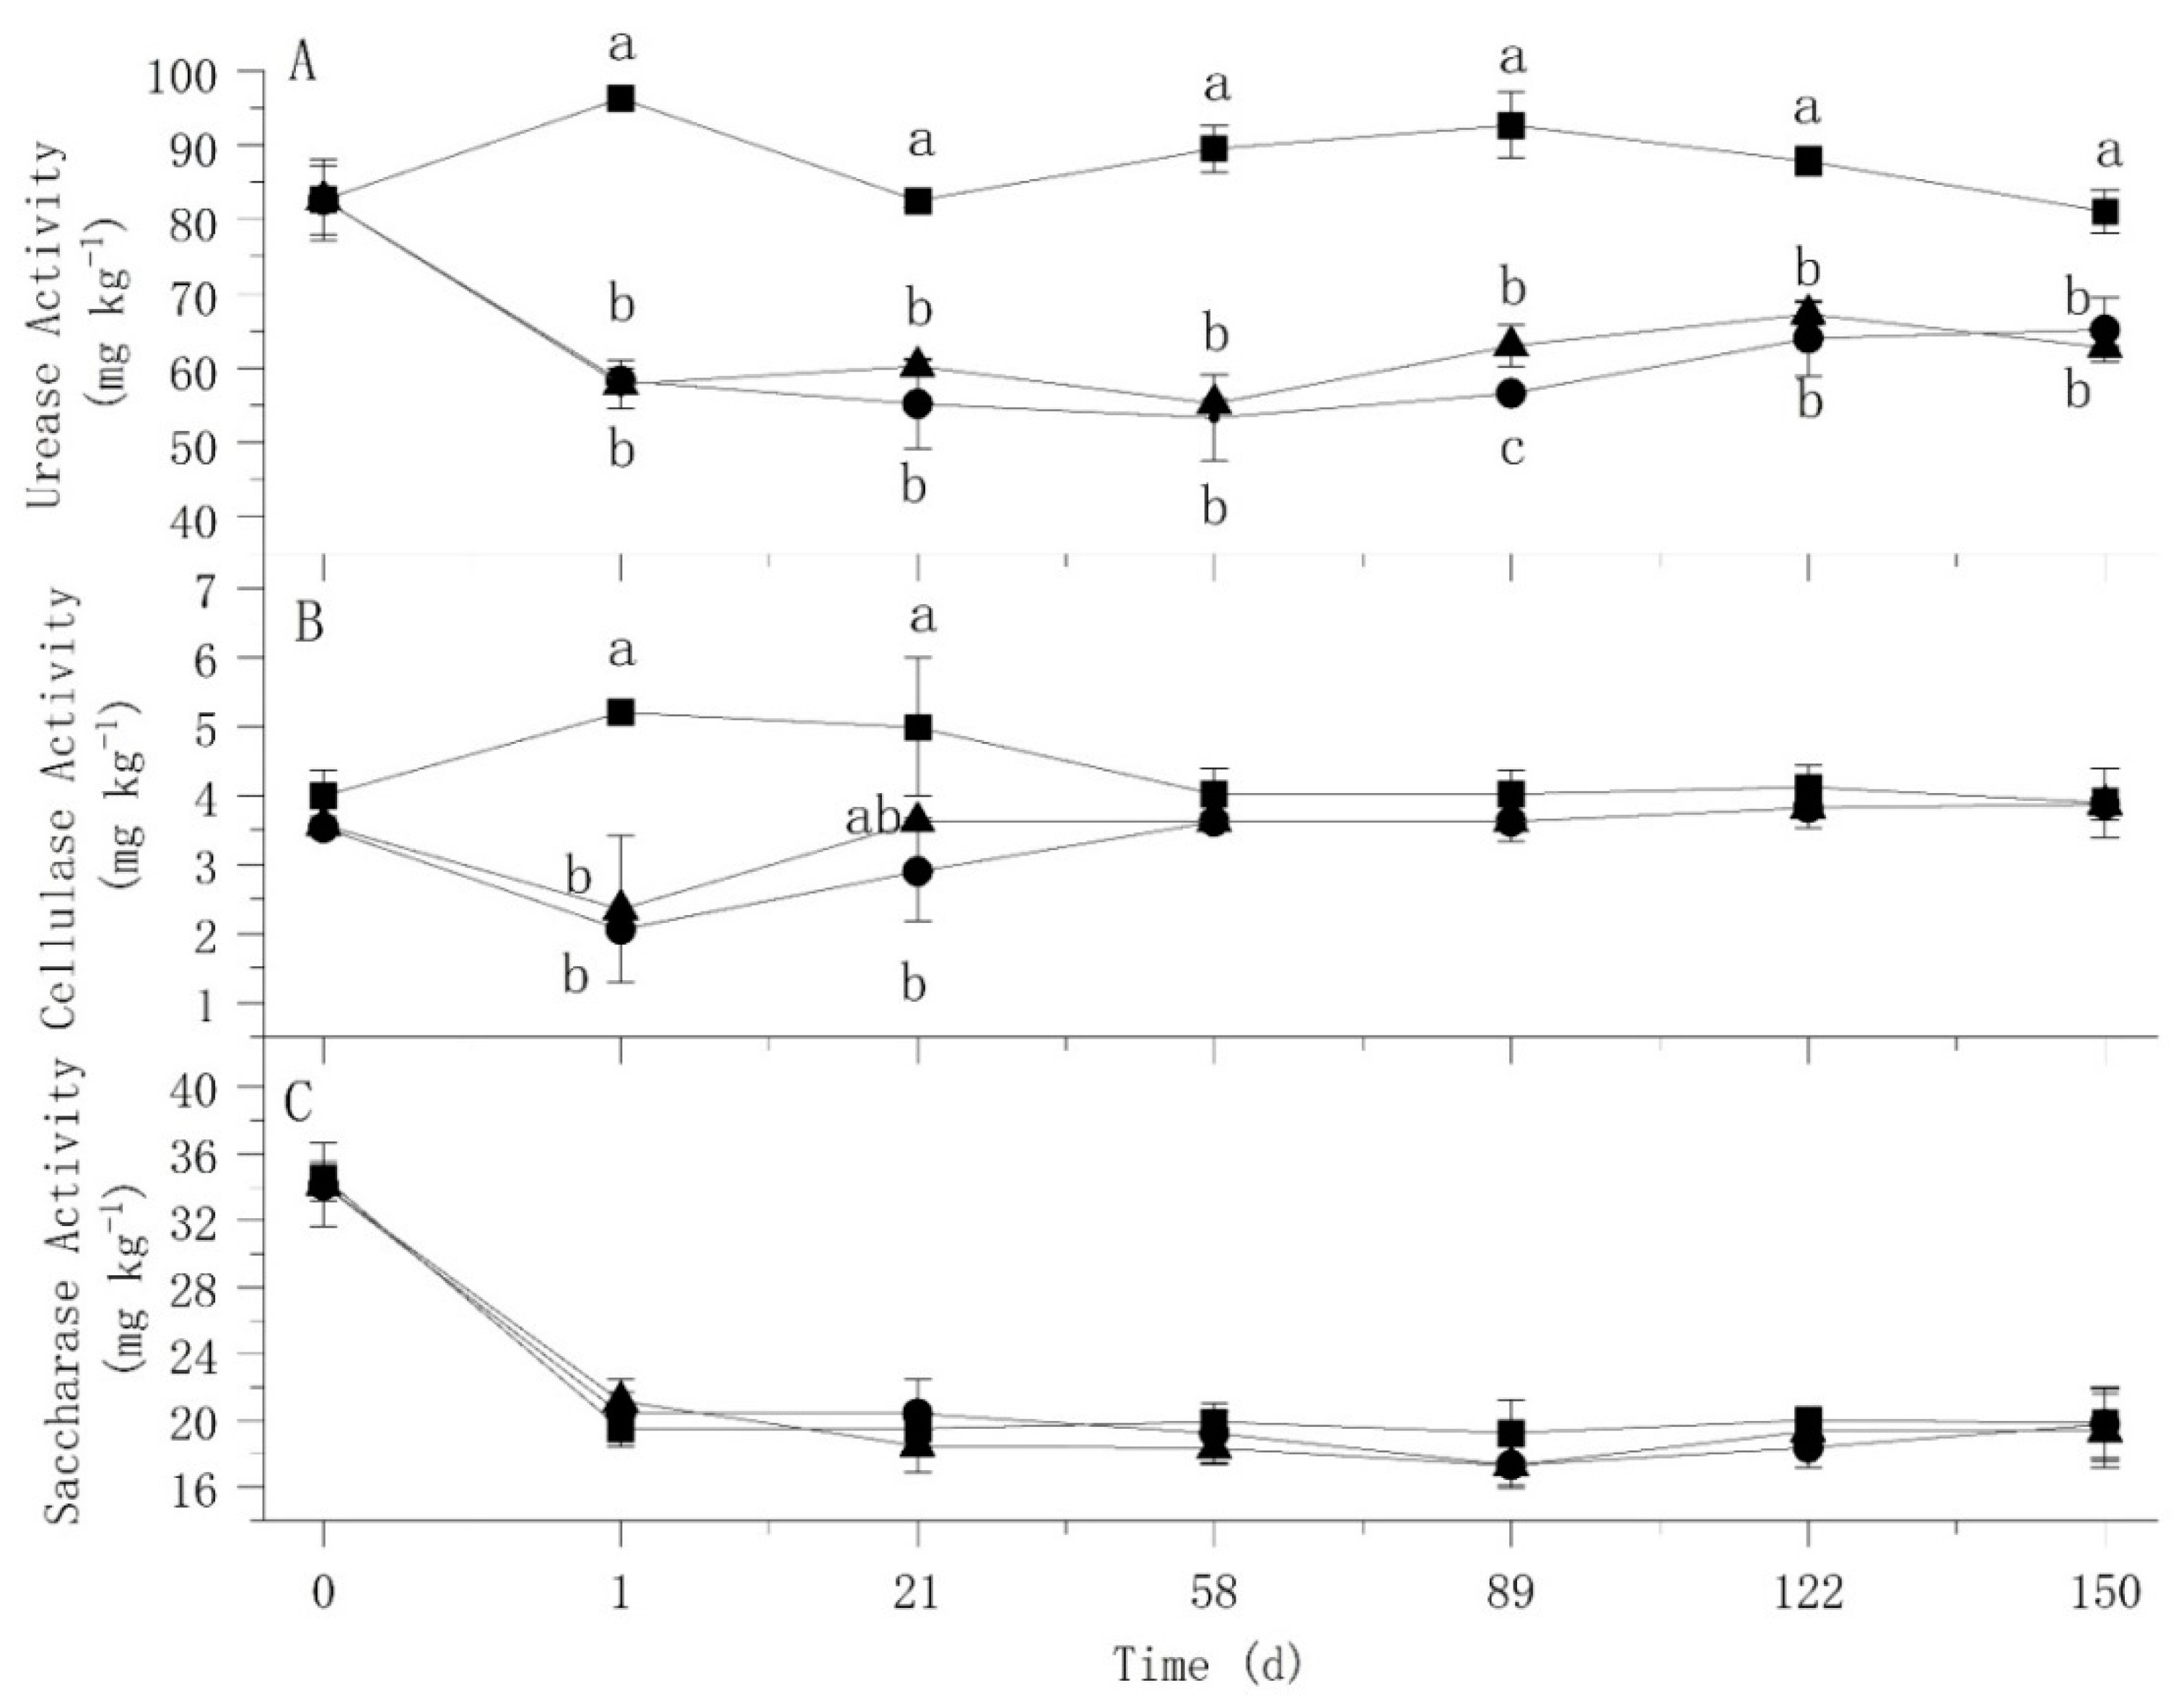 : Control; : Treat 1; : Treat 2.
: Control; : Treat 1; : Treat 2.
: Control; : Treat 1; : Treat 2.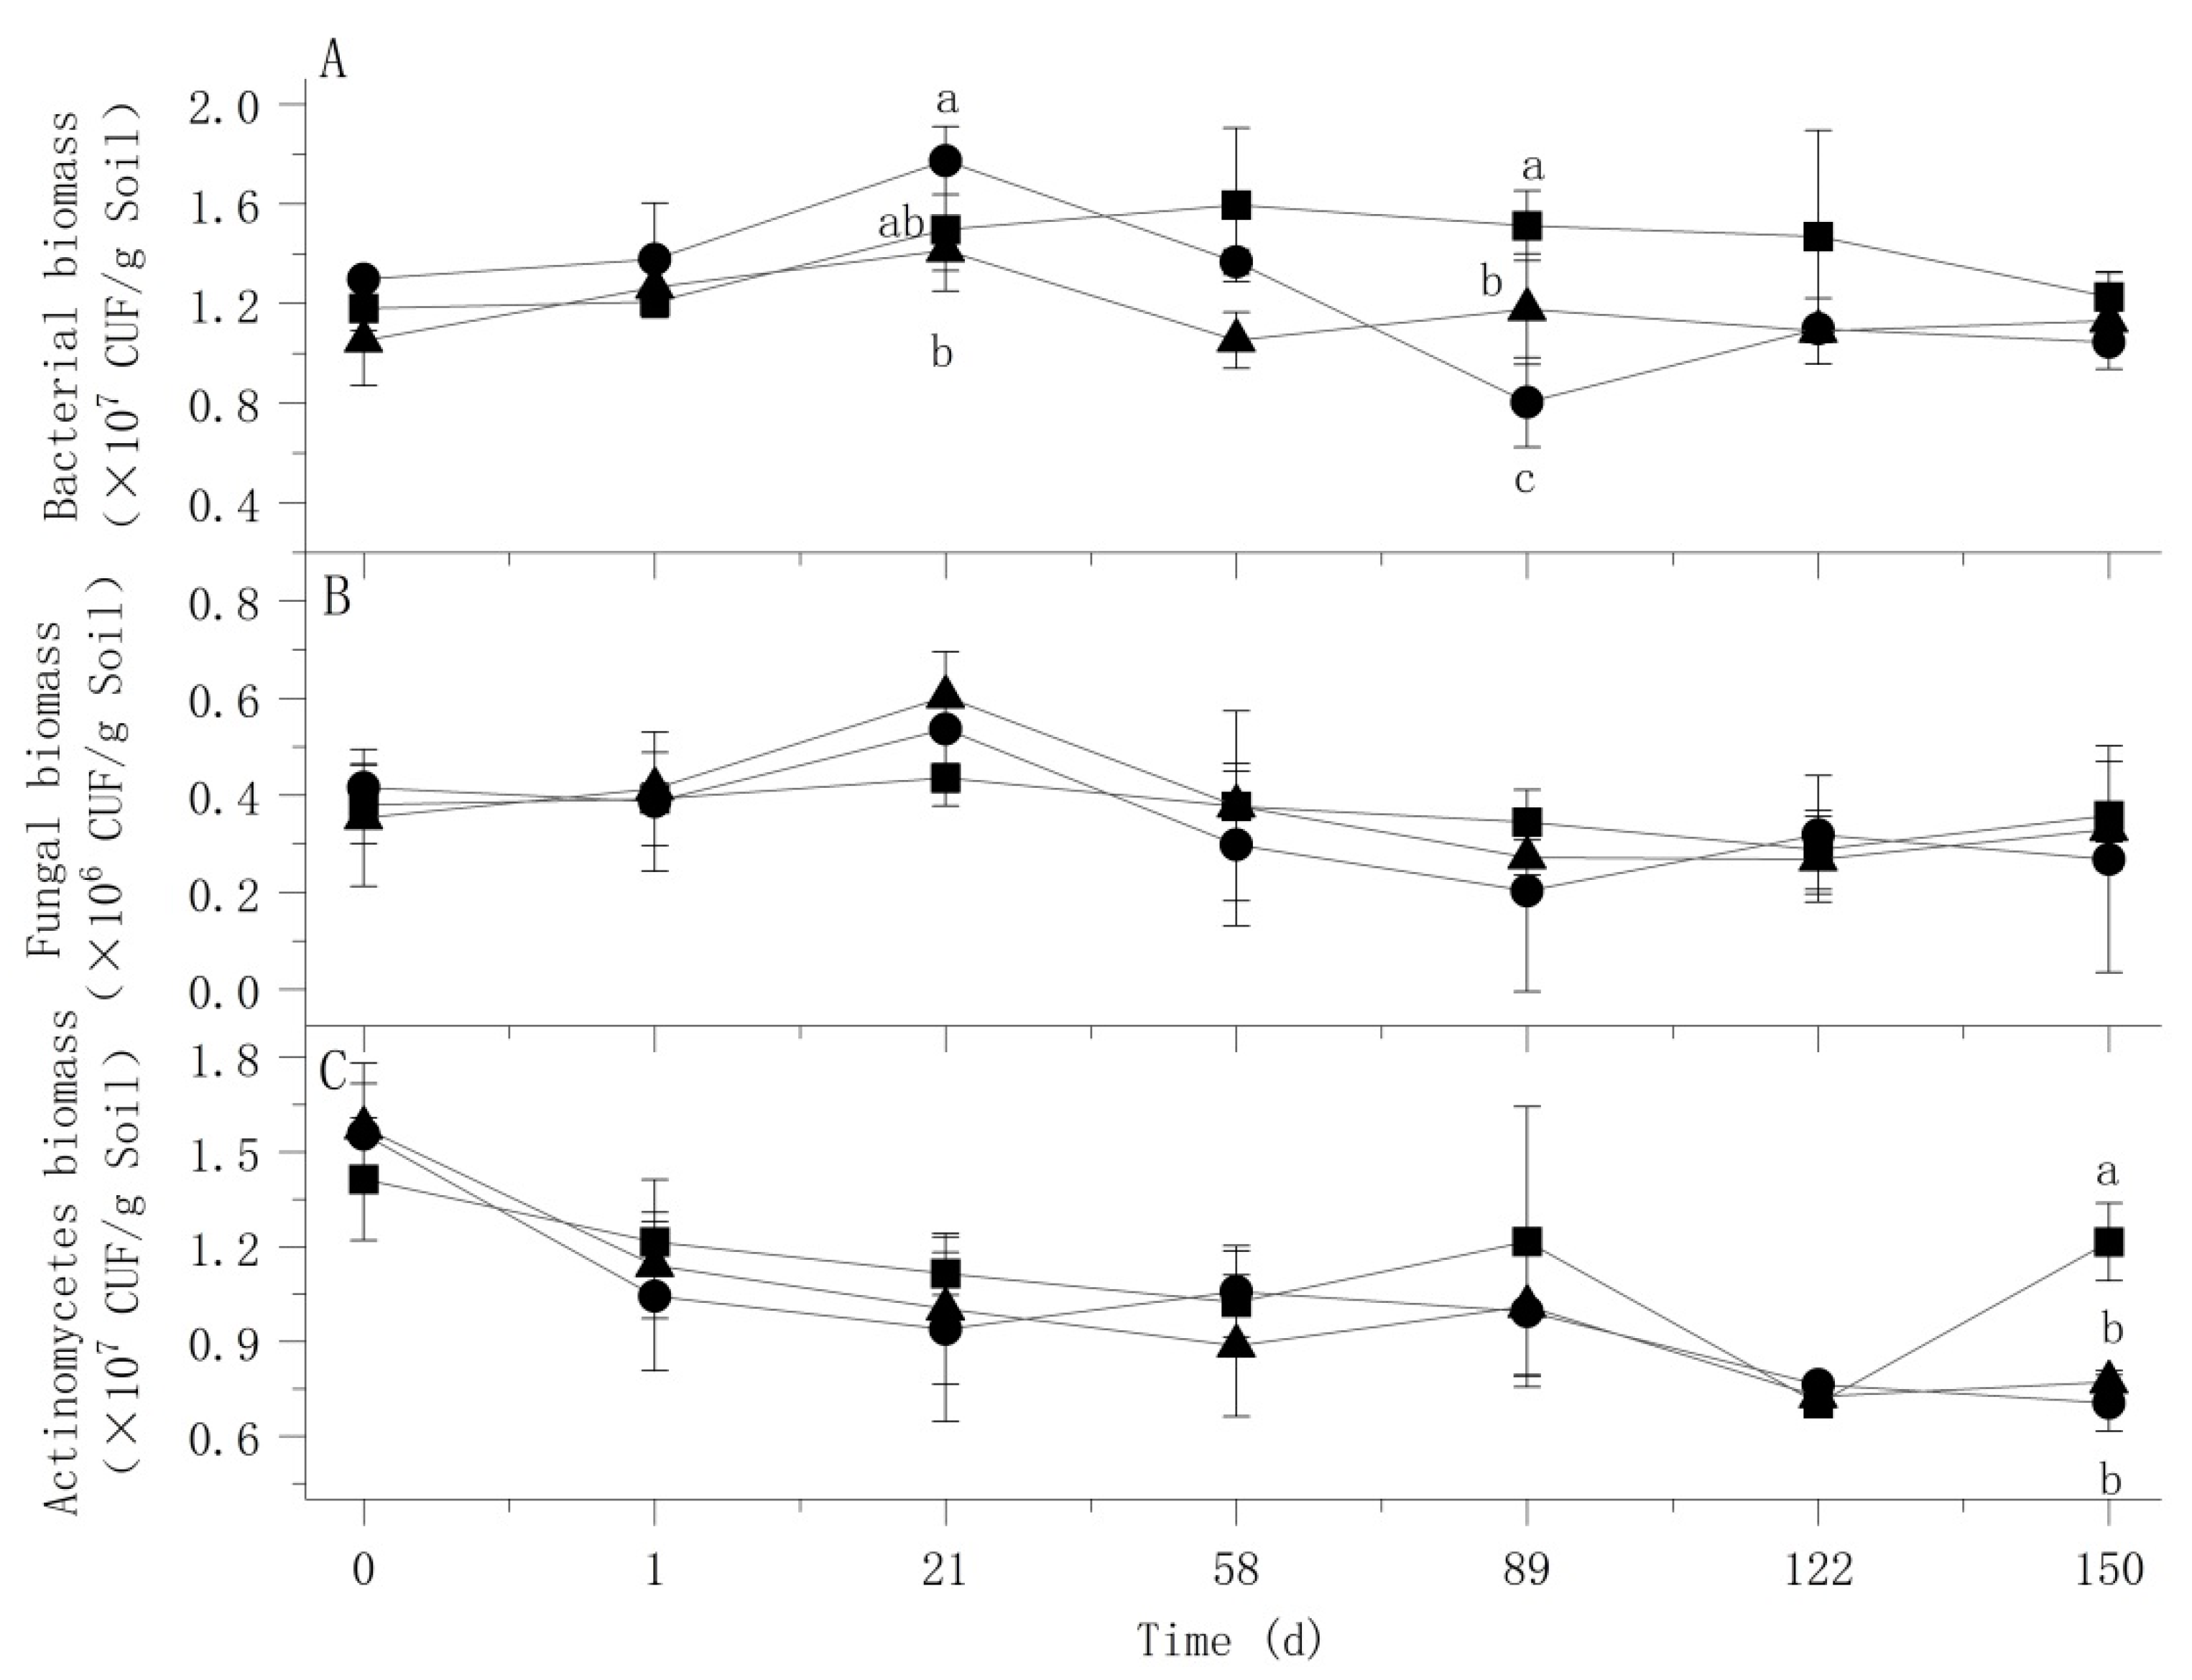 : Control; : Treat 1; : Treat 2.
: Control; : Treat 1; : Treat 2.
: Control; : Treat 1; : Treat 2.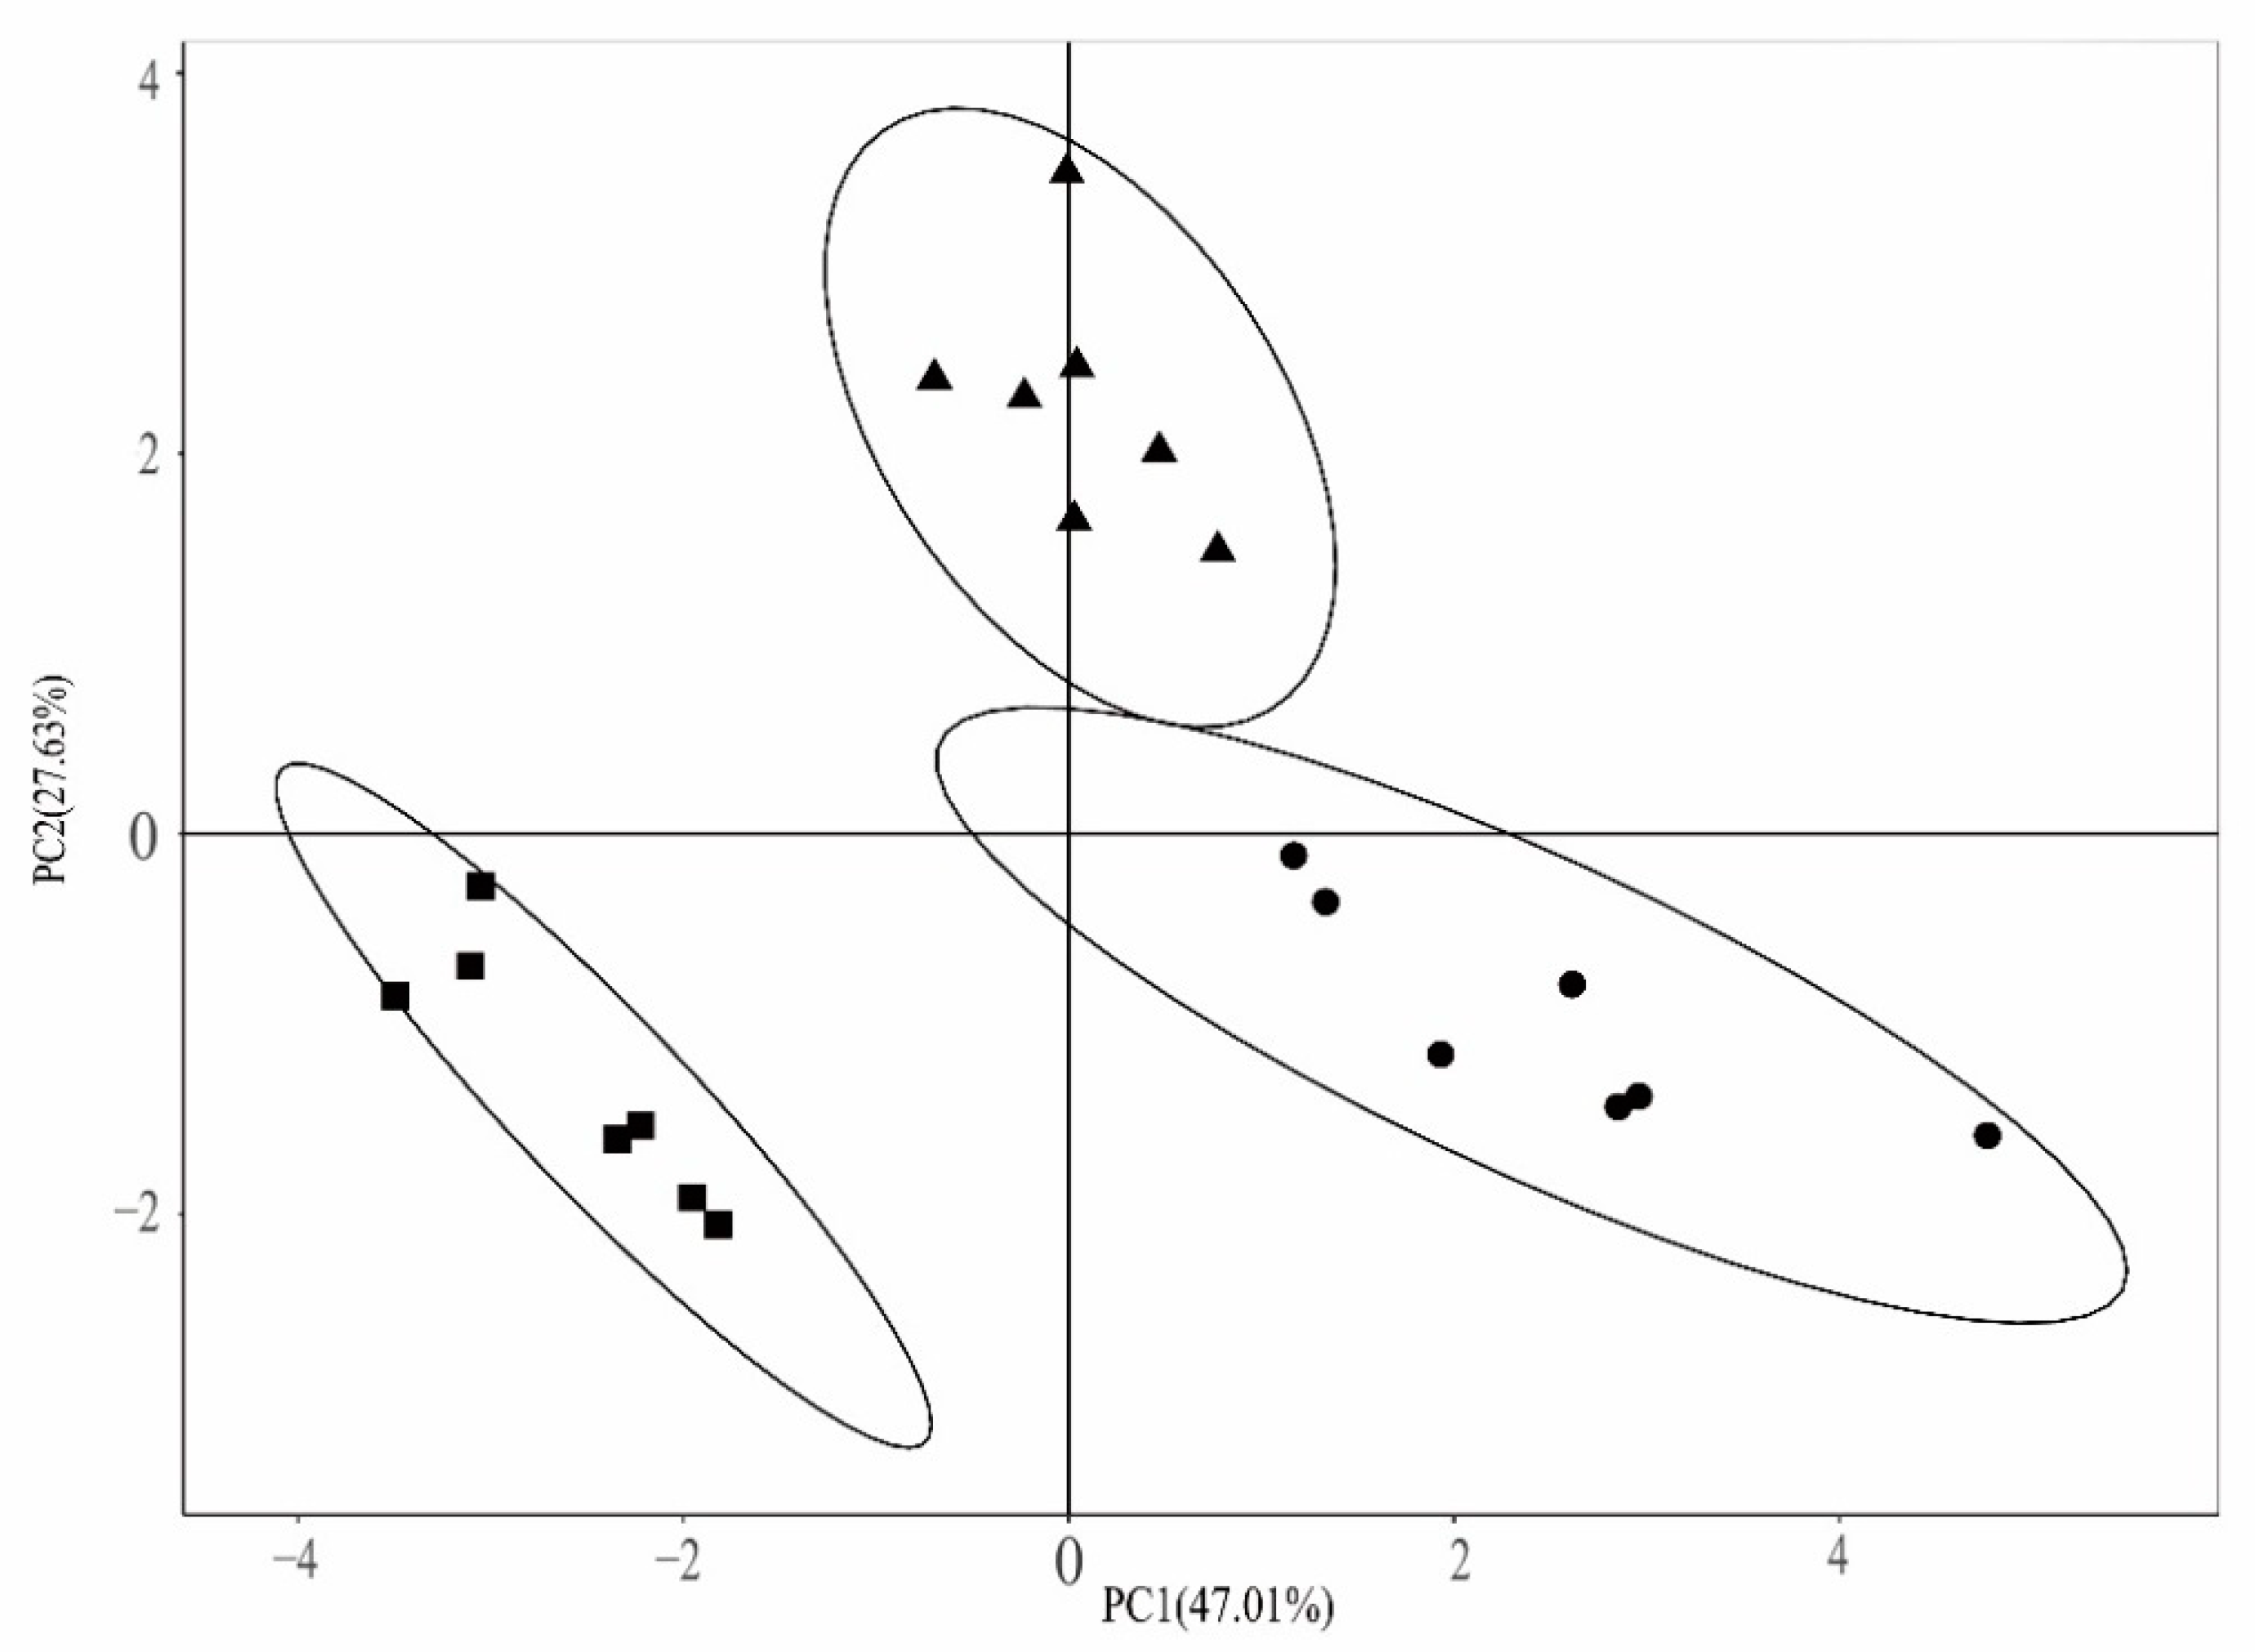 : Control; : Treat 1; : Treat 2.
: Control; : Treat 1; : Treat 2.
: Control; : Treat 1; : Treat 2. : Control; : Treat 1; : Treat 2.
: Control; : Treat 1; : Treat 2.
: Control; : Treat 1; : Treat 2.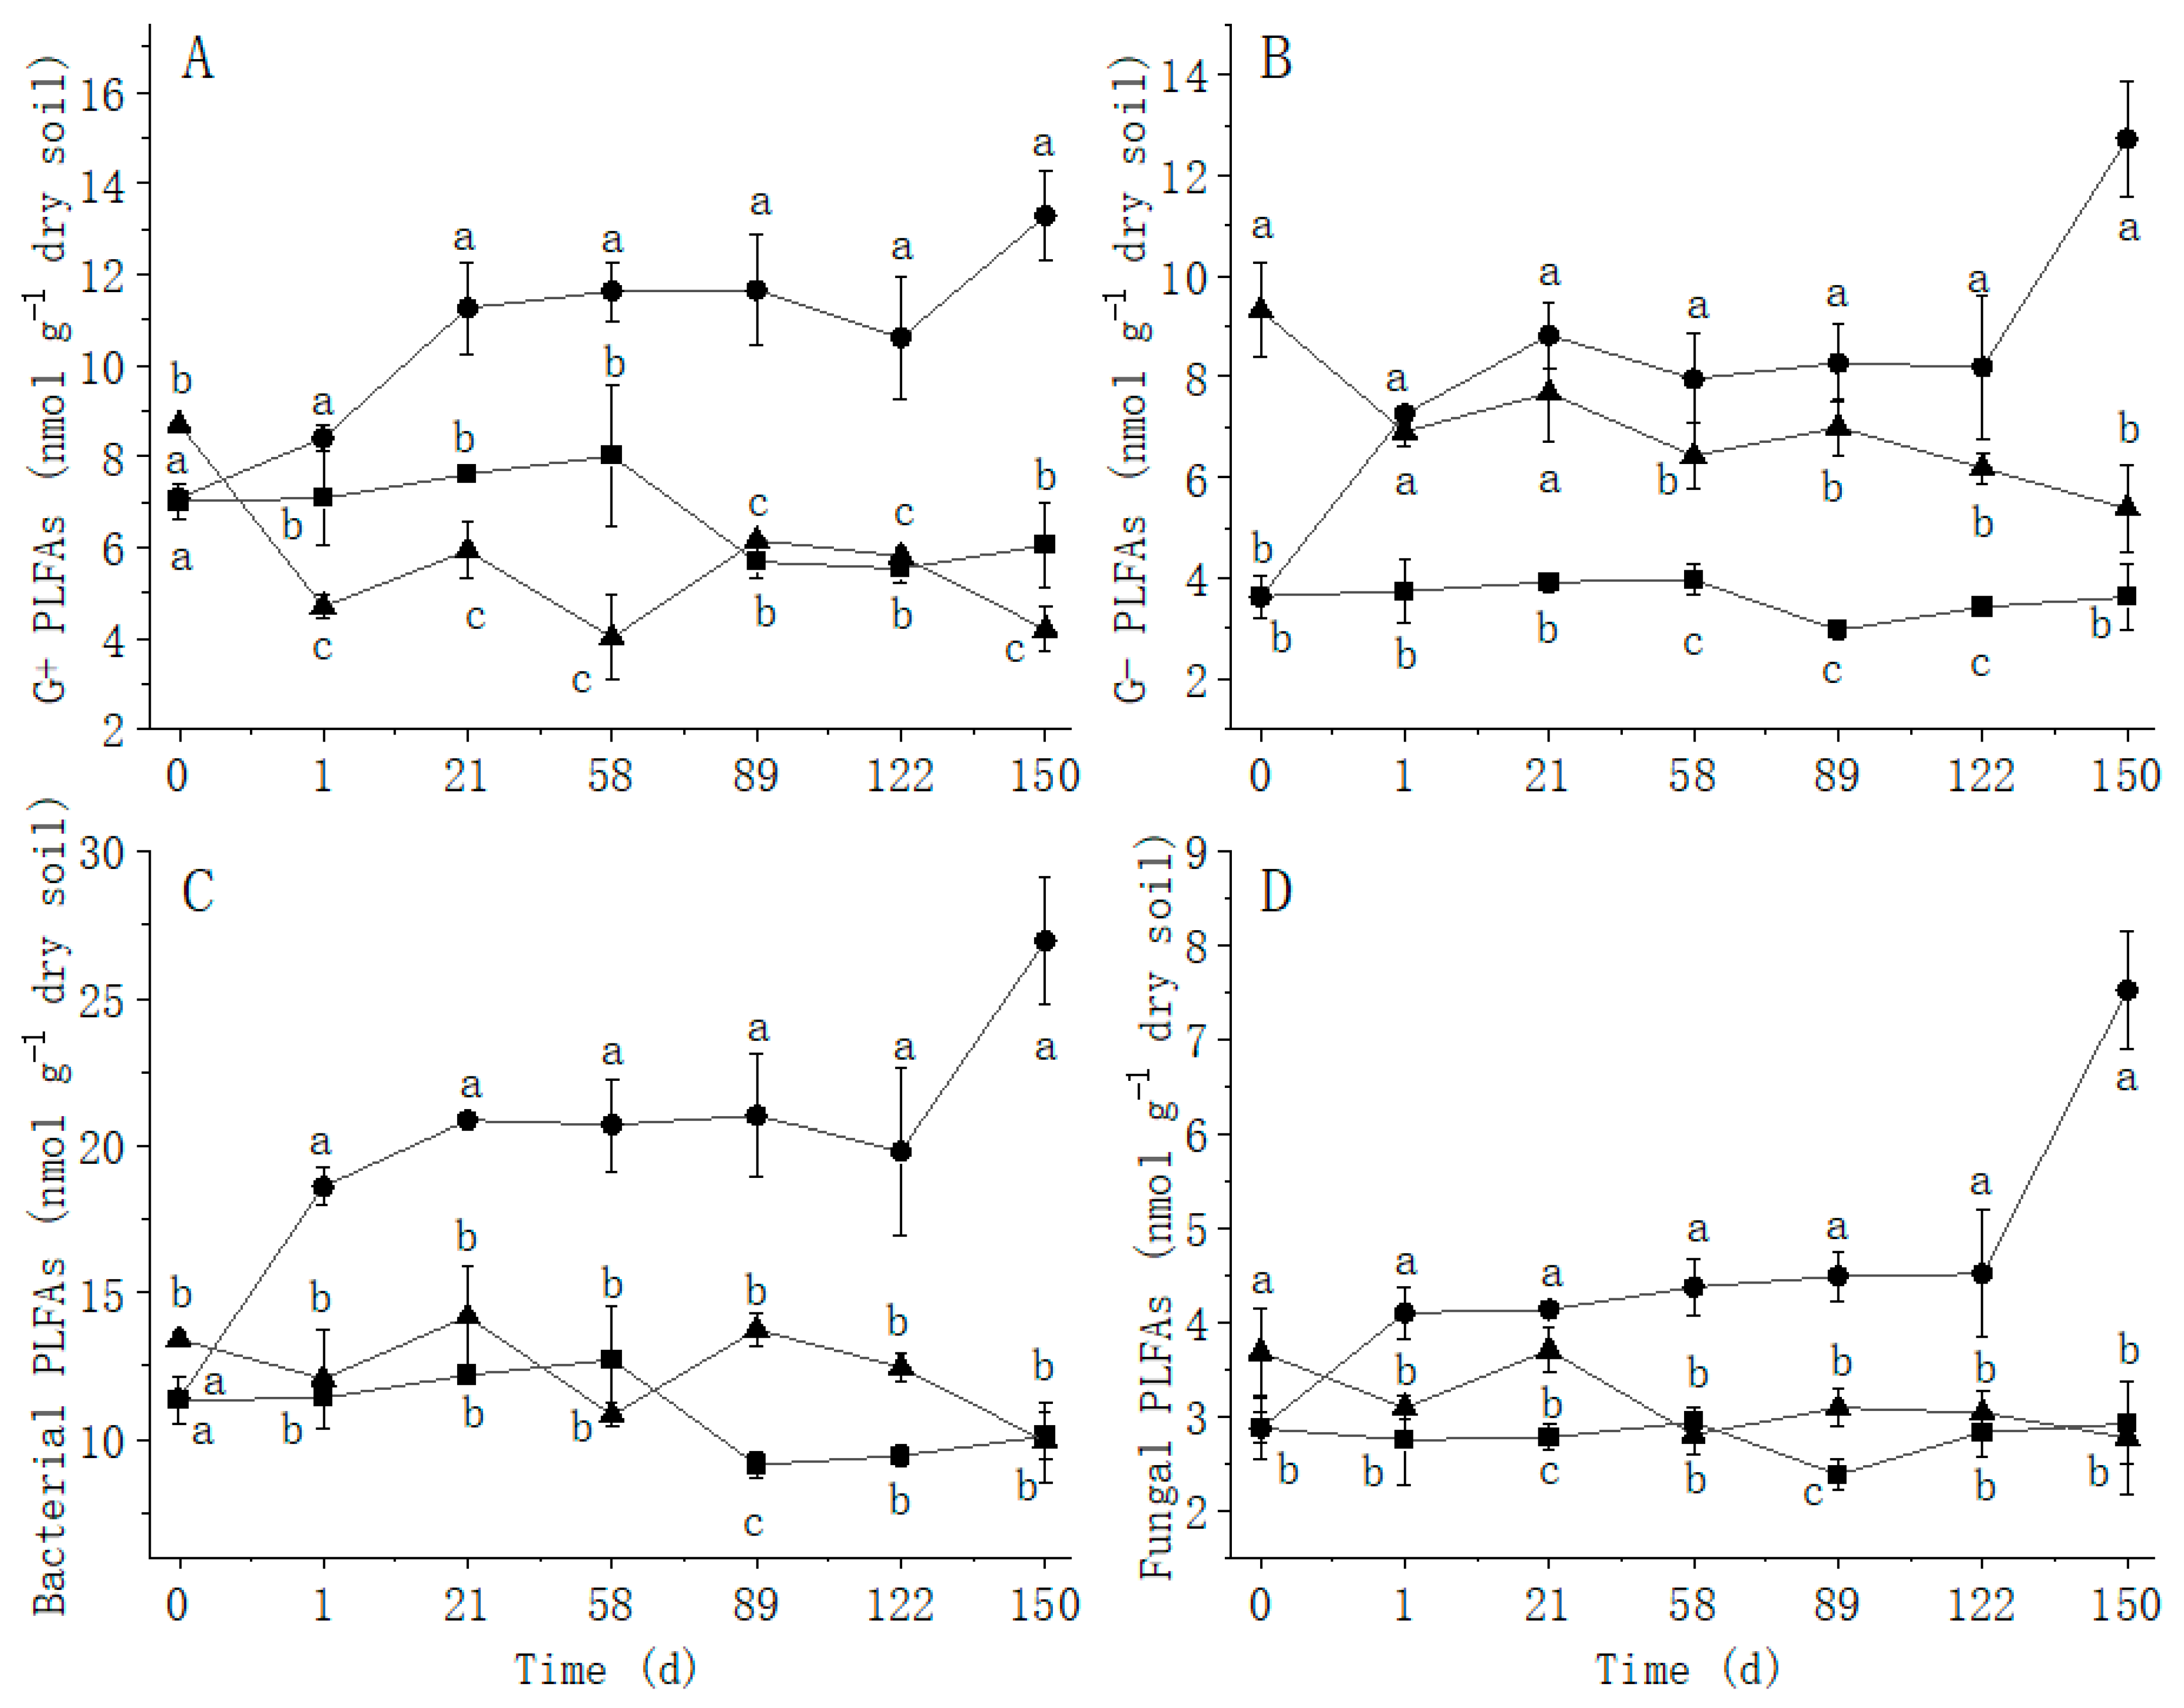 : Control; : Treat 1; : Treat 2.
: Control; : Treat 1; : Treat 2.
: Control; : Treat 1; : Treat 2.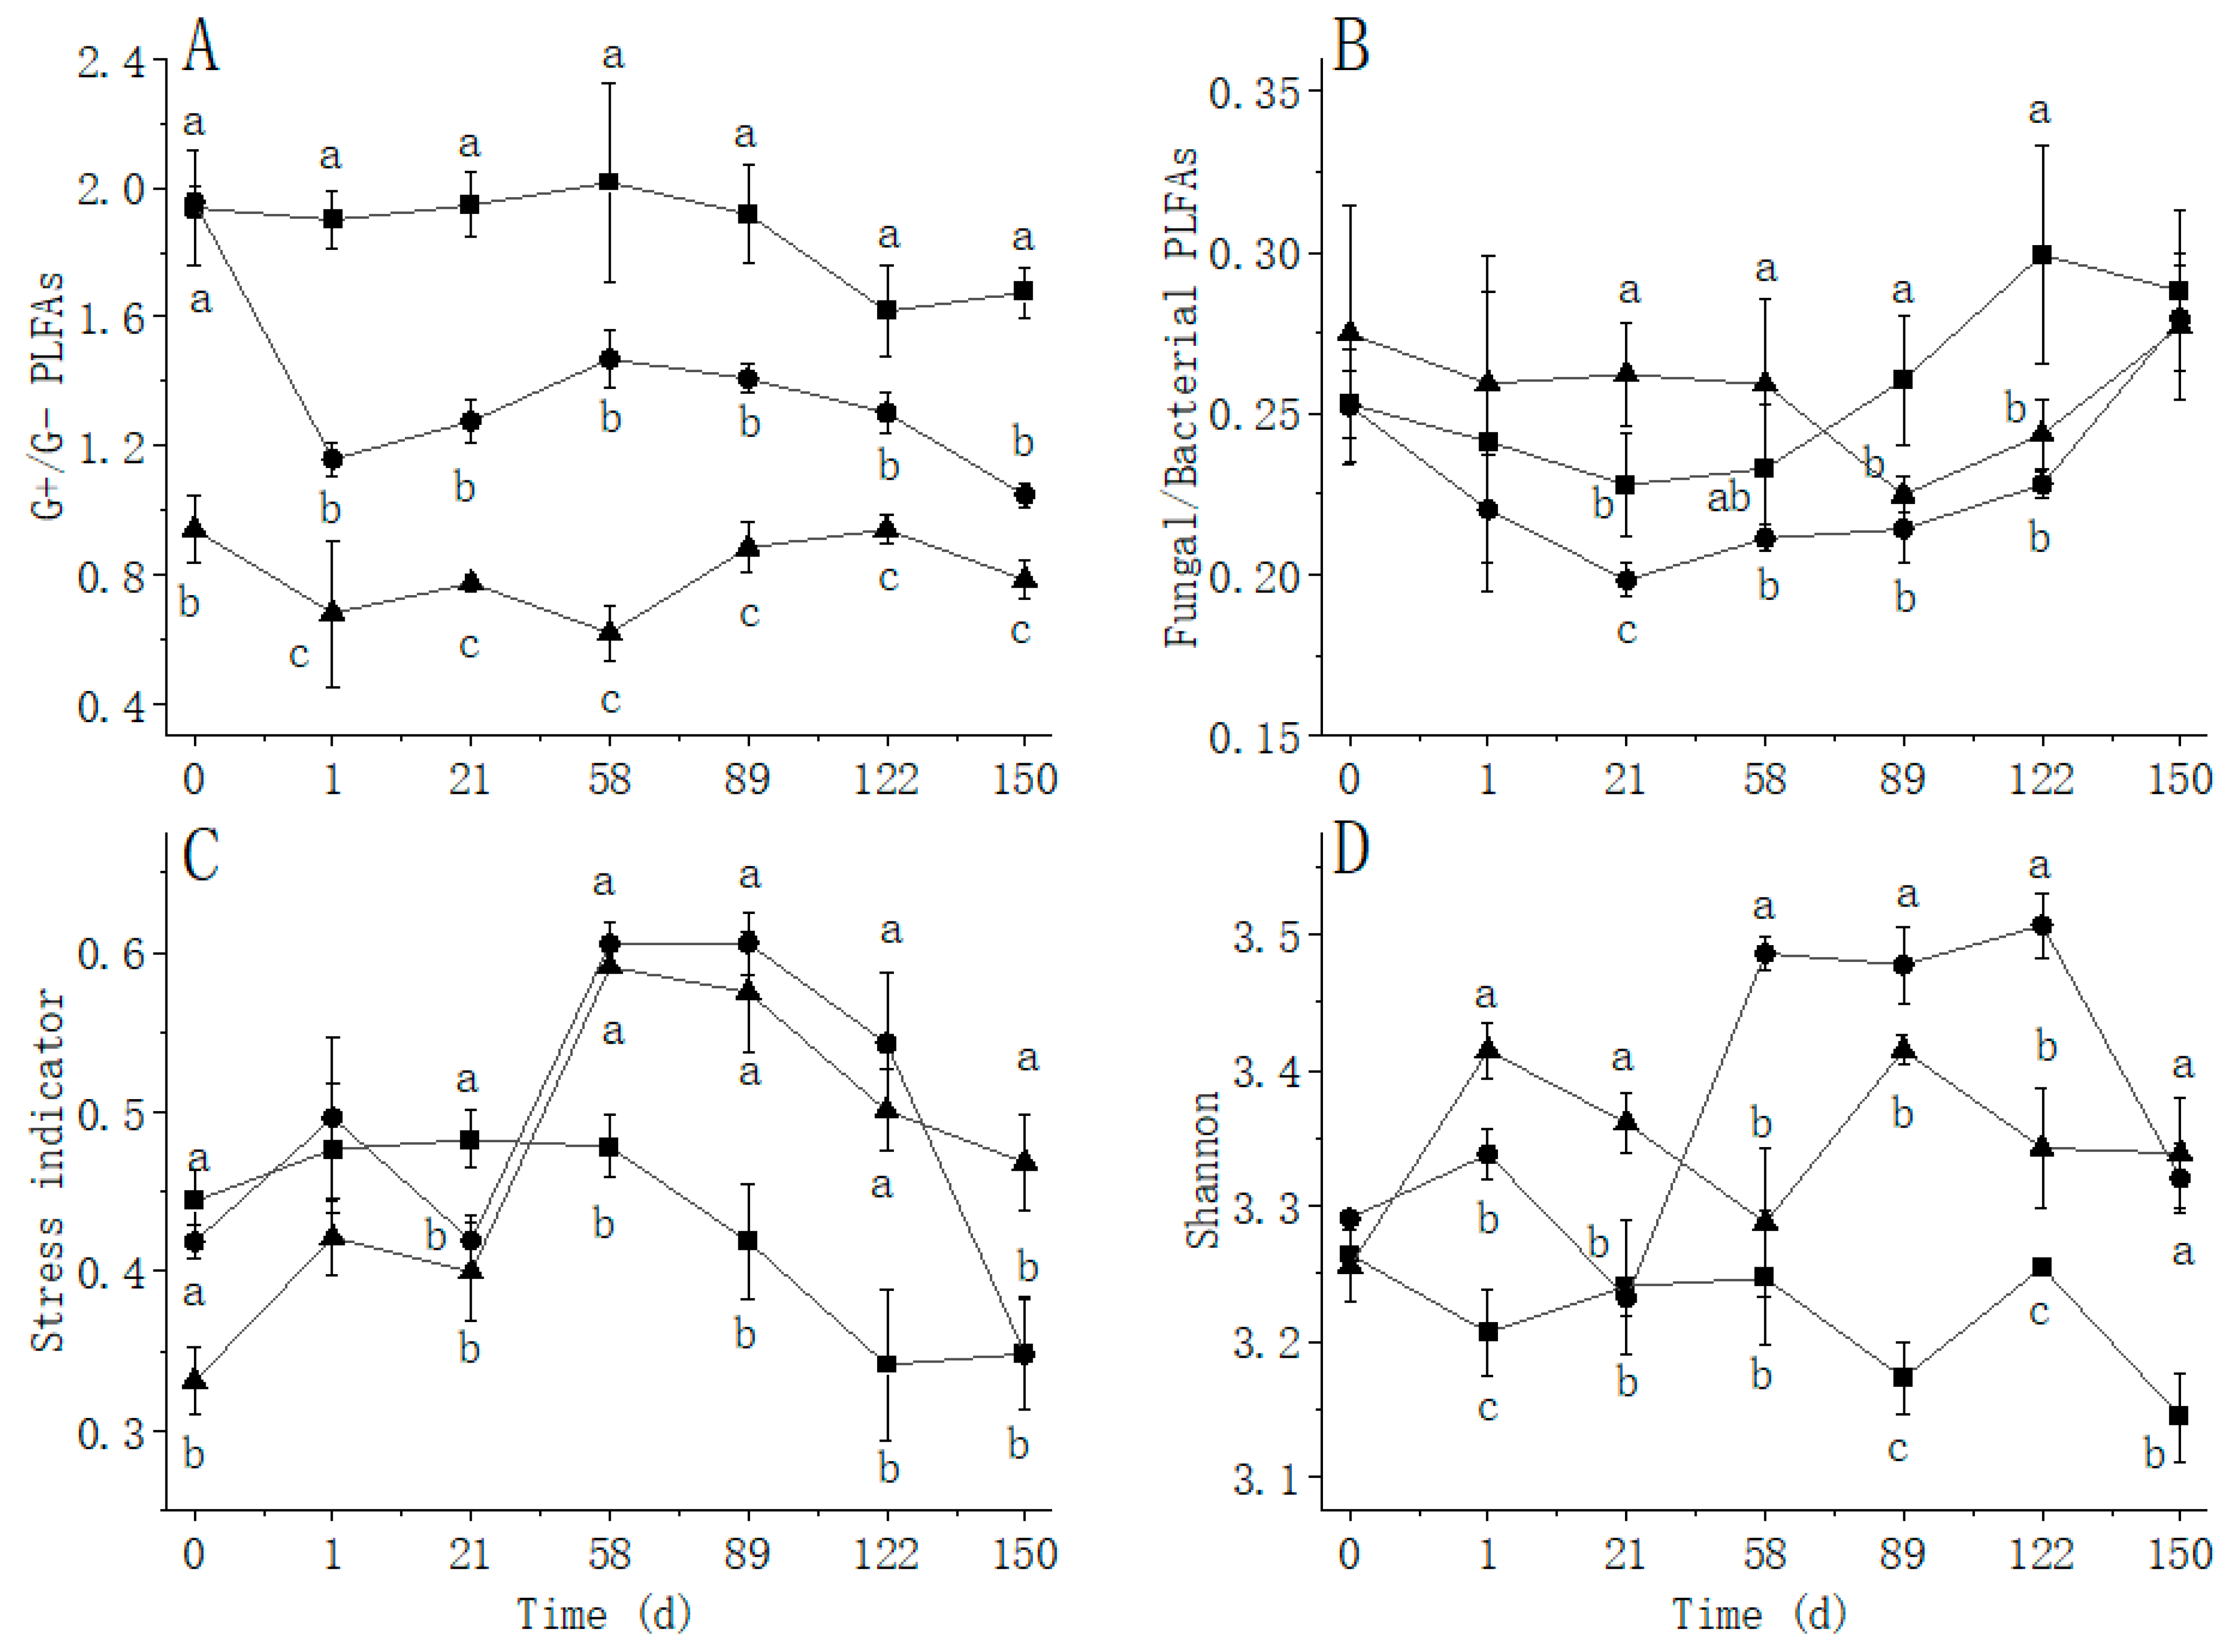 : Control; : Treat 1; : Treat 2.
: Control; : Treat 1; : Treat 2.
: Control; : Treat 1; : Treat 2.

| Index | Treat | Time | Treat × Time |
|---|---|---|---|
| Urease | 15.713 *** | 361.418 *** | 14.037 *** |
| Cellulase | 35.158 *** | 2.139 | 4.351 ** |
| Saccharase | 1.927 | 17.320 *** | 1.168 |
| Bacterial biomass | 7.794 ** | 9.196 *** | 5.174 ** |
| Fungal biomass | 0.288 | 5.722 ** | 0.727 |
| Actinomycetes biomass | 2.522 | 39.643 *** | 5.552 ** |
| G+ | 4.995 *** | 249.166 *** | 54.991 *** |
| G− | 5.476 ** | 245.163 *** | 22.981 *** |
| Bac | 25.272 *** | 306.662 *** | 38.948 *** |
| Fun | 7.023 ** | 153.387 *** | 14.321 *** |
| PLFA | 15.625 *** | 148.743 *** | 20.877 *** |
| Fun/Bac | 19.690 *** | 483.814 *** | 9.383 *** |
| G+/G− | 8.416 ** | 10.623 *** | 4.113 * |
| Shannon | 25.765 *** | 172.668 *** | 28.879 *** |
| Stress indicator | 101.162 *** | 24.608 *** | 25.229 *** |
| Index | Time | Years | Atrazine Residue | Urease | Cellulase | Saccharase | Bacterial Biomass | Fungal Biomass | Actinomycetes Biomass | G+ | G− | Bacteria | Fungi | Total PLFA | Fun/Bac | G+/G− | Shannon | Stress Indicator |
|---|---|---|---|---|---|---|---|---|---|---|---|---|---|---|---|---|---|---|
| Time | 1.000 | |||||||||||||||||
| Years | 0.000 | 1.000 | ||||||||||||||||
| Atrazine Residue | −0.417 | 0.316 * | 1.000 | |||||||||||||||
| Urease | −0.095 | −0.671 ** | −0.480 ** | 1.000 | ||||||||||||||
| Cellulase | 0.185 | −0.439 ** | −0.719 ** | 0.547 ** | 1.000 | |||||||||||||
| Saccharase | −0.501 ** | −0.048 | −0.112 | 0.336 ** | −0.047 | 1.000 | ||||||||||||
| Bacterial Biomass | −0.235 | −0.326 ** | 0.176 | 0.168 | −0.029 | −0.082 | 1.000 | |||||||||||
| Fungal Biomass | −0.350 ** | 0.019 | 0.206 | −0.070 | −0.085 | 0.048 | 0.226 | 1.000 | ||||||||||
| Actinomycetes Biomass | −0.570 ** | −0.156 | 0.006 | 0.378 ** | −0.010 | 0.602 ** | 0.081 | 0.080 | 1.000 | |||||||||
| G+ | 0.035 | −0.163 | −0.077 | −0.236 | −0.069 | −0.014 | −0.054 | 0.043 | −0.074 | 1.000 | ||||||||
| G− | 0.106 | 0.540 ** | 0.230 | −0.645 ** | −0.374 ** | −0.124 | −0.292 * | 0.096 | −0.263 * | 0.652 ** | 1.000 | |||||||
| Bacteria | 0.109 | 0.122 | 0.152 | −0.541 ** | −0.267 * | −0.194 | −0.144 | 0.107 | −0.280 * | 0.898 ** | 0.837 ** | 1.000 | ||||||
| Fungi | 0.239 | 0.138 | 0.071 | −0.432 ** | −0.193 | −0.114 | −0.222 | 0.077 | −0.271 * | 0.803 ** | 0.853 ** | 0.910 ** | 1.000 | |||||
| Total PLFA | 0.069 | −0.064 | −0.159 | −0.254 * | −0.014 | 0.078 | −0.113 | 0.102 | −0.054 | 0.899 ** | 0.682 ** | 0.846 ** | 0.817 ** | 1.000 | ||||
| Fun/Bac | 0.273 * | 0.000 | −0.170 | 0.283 * | 0.144 | 0.205 | −0.075 | −0.095 | 0.057 | −0.356 ** | −0.133 | −0.394 ** | −0.002 | −0.248 * | 1.000 | |||
| G+/G− | −0.152 | −0.899 ** | −0.403 ** | 0.712 ** | 0.459 ** | 0.239 | 0.331 ** | −0.034 | 0.339 ** | 0.162 | −0.617 ** | −0.191 | −0.253 * | 0.057 | −0.104 | 1.000 | ||
| Shannon | 0.097 | 0.506 ** | 0.257 * | −0.669 ** | −0.320 * | −0.226 | −0.330 ** | −0.217 | −0.252 * | 0.329 ** | 0.510 ** | 0.495 ** | 0.378 ** | 0.238 | −0.328 ** | −0.434 ** | 1.000 | |
| Stress Indicator | −0.001 | 0.208 | 0.026 | −0.448 ** | −0.005 | −0.385 ** | −0.224 | −0.237 | −0.188 | 0.091 | 0.063 | 0.186 | −0.064 | 0.050 | −0.591 ** | −0.130 | 0.590 ** | 1.000 |
Publisher’s Note: MDPI stays neutral with regard to jurisdictional claims in published maps and institutional affiliations. |
© 2021 by the authors. Licensee MDPI, Basel, Switzerland. This article is an open access article distributed under the terms and conditions of the Creative Commons Attribution (CC BY) license (https://creativecommons.org/licenses/by/4.0/).
Share and Cite
Yang, F.; Yang, S.; Xu, J.; Wang, Y.; Gao, M.; Zhang, M.; Dai, W.; Fu, H.; Zeng, W.; Liu, C. Dynamic Response of Soil Enzymes and Microbial Diversity to Continuous Application of Atrazine in Black Soil of a Cornfield without Rotation in Northeast China. Diversity 2021, 13, 259. https://doi.org/10.3390/d13060259
Yang F, Yang S, Xu J, Wang Y, Gao M, Zhang M, Dai W, Fu H, Zeng W, Liu C. Dynamic Response of Soil Enzymes and Microbial Diversity to Continuous Application of Atrazine in Black Soil of a Cornfield without Rotation in Northeast China. Diversity. 2021; 13(6):259. https://doi.org/10.3390/d13060259
Chicago/Turabian StyleYang, Fengshan, Siyuan Yang, Jiangli Xu, Yanbo Wang, Mengying Gao, Manxia Zhang, Wenlong Dai, Haiyan Fu, Weimin Zeng, and Chunguang Liu. 2021. "Dynamic Response of Soil Enzymes and Microbial Diversity to Continuous Application of Atrazine in Black Soil of a Cornfield without Rotation in Northeast China" Diversity 13, no. 6: 259. https://doi.org/10.3390/d13060259
APA StyleYang, F., Yang, S., Xu, J., Wang, Y., Gao, M., Zhang, M., Dai, W., Fu, H., Zeng, W., & Liu, C. (2021). Dynamic Response of Soil Enzymes and Microbial Diversity to Continuous Application of Atrazine in Black Soil of a Cornfield without Rotation in Northeast China. Diversity, 13(6), 259. https://doi.org/10.3390/d13060259