Article

The Phylogenetics and Biogeography of the Central Asian Hawkmoths, Hyles hippophaes and H. chamyla: Can Mitogenomics and Machine Learning Bring Clarity?

1
Museum of Zoology, Senckenberg Natural History Collections Dresden, Königsbrücker Landstr. 159, D-01109 Dresden, Germany
2
Tumbling Dice, Newcastle Upon Tyne NE3 4RT, UK
3
Department of Life Sciences, Natural History Museum, Cromwell Road, London SW7 5BD, UK
*
Author to whom correspondence should be addressed.
Diversity 2021, 13(5), 213; https://doi.org/10.3390/d13050213
Submission received: 10 April 2021 / Revised: 12 May 2021 / Accepted: 14 May 2021 / Published: 17 May 2021

Abstract

:
The western Palaearctic species of the hawkmoth genus Hyles (Lepidoptera: Sphingidae) have long been the subject of molecular phylogenetic research. However, much less attention has been paid to the taxa inhabiting the central and eastern Palaearctic, particularly Central Asia, where almost 50% of the species diversity of the genus occurs. Yet, many taxonomic conundrums hinder a proper assessment of the true diversity in these moths. One still unresolved group of species includes Hyles hippophaes and Hyles chamyla. Despite a largely overlapping morphology and ecology, a plethora of infraspecific taxa display some unique divergent characters over a wide geographical area. In this study, we undertook a taxonomic assessment of each population and resolved this species complex using an integrative approach. A combination of new computational techniques (DAISY-II) in comparative morphology and recent advances in DNA extraction methods and sequencing of museum specimens (WISC) alongside more traditional genetic approaches allowed testing of the three main phenotypes—bienerti, chamyla and apocyni—in terms of their morphological, mitochondrial and biogeographical integrity, and to elucidate their evolutionary relationships. Our results support the existence of two closely related species, Hyles chamyla and H. hippophaes, but the former species H. apocyni (here discussed as the ecological form apocyni of H. chamyla) is best regarded as a hybrid between H. chamyla and H. h. bienerti. The results indicate that the evolutionary relationship between H. chamyla and H. hippophaes is one of admixture in the context of ongoing ecological differentiation, which has led to shared morphological characters and a blurring of the species boundaries. These results clarify the evolutionary relationships of this species complex and open future research lines, including the analysis of nuclear markers and denser sampling, particularly of H. hippophaes and H. vespertilio in western Europe.

1. Introduction

The Western Palaearctic species of the globally distributed hawkmoth genus Hyles (Lepidoptera: Sphingidae) have long been the subject of extensive molecular phylogenetic research [1,2]. The genus has also emerged as a model for the study of mito-nuclear mismatch [3], dynamic gene flow and the effects of the heterogeneous use of molecular and morphological markers in taxonomic decisions, which in turn have influenced decisions regarding how many biological species should be recognized in the Western Palearctic [2]. However, much less attention has been paid to the taxa inhabiting the central and eastern Palaearctic, particularly Central Asia. This area encompasses not only the greatest species richness, with approximately 17 species occurring in the region [4,5], but also the greatest life history and morphological trait diversity [6,7]. Furthermore, recent research has revealed that this diversity is relatively young, at 6.5 Ma [7], and that the speciation processes are still ongoing, which has led to a complex pattern of taxa that are in the process of both merging or diverging.
Until recently, most species had only been characterized based on morphology and life-history traits (e.g., [6,8,9]), many of which show overlapping occurrence patterns among taxa. Thus, for example, the regular and frequent finding of intermediate larval phenotypes in the Western Palearctic Hyles euphorbiae complex [10], due to either hybrid origin or high phenotypic plasticity [2], led to widespread disagreement over species delimitation and the interrelationships among populations for decades. However, comprehensive molecular studies of the genus using both novel and previously available tools [1,3,7] successfully provided clarity to the systematics, biogeography and evolutionary mechanisms behind this radiation, although some species clusters remain enigmatic.
One of these species complexes comprises Hyles hippophaes (Esper [1789]) and Hyles chamyla (Denso [1913]) (named subgenus Hippophyles [6] by some authors), which has yet to be studied in detail from a molecular phylogenetic perspective. Moths in this group are characterized by a general reduction in the typical Hyles wing pattern features and an extensive overlap in the remaining characters. Nevertheless, unique adult and larval morphological features set them apart from other members of the genus. Hyles hippophaes is currently considered to have three subspecies: H. h. hippophaes, H. h. bienerti and H. h. baltistana, which differ somewhat in background shading and the intensity of markings, whereas H. chamyla appears in two forms, the nominotypical and form apocyni, which has sometimes been attributed species status (e.g., [6]; but see also [11,12] and below).
In general, H. chamyla f. apocyni is approximately the same size as H. h. bienerti (average wingspan 8 cm), whereas H. chamyla f. chamyla is smaller (average wingspan 6 cm). The overall impression of H. chamyla is of a shorter and more rounded-winged moth than H. h. bienerti, which appears more streamlined, elongated and triangular. The inner edge of the forewing triangular postmedial band between veins M2 and CuA2, especially as it passes the location of spot c/d (which is rarely present in H. h. bienerti, see Figure 8 in [13] for descriptions of the pattern elements) near the discal spot, is concave in H. chamyla and straight in H. h. bienerti. However, it can also be curved in H. h. bienerti, but in such cases, it is more evenly and shallowly curved than in H. chamyla. Additionally, the inner edge of this band hits the inner margin fairly straight in H. chamyla, whereas is H. h. bienerti, the inner edge generally turns down on vein CuA2. The costal margin in H. h. bienerti is pale and usually contrasts strongly with the triangular postmedial band, which is the condition also found in H. chamyla f. apocyni. In contrast, H. chamyla f. chamyla generally has a dark brown costal half of the forewing, only slightly paler than the triangular postmedial band [14]. Therefore, a purely visual morphological identification of individuals is often almost impossible without comparing a series of specimens, as was admitted by both authors (Figure 1 and Appendix A) in the original descriptions [11,12].
In contrast, the two species, while occurring in broadly the same habitats, segregate ecologically as their larvae appear to rely on different hostplants, with H. hippophaes feeding mainly on Elaeagnus and Hippophae species (Elaeagnaceae, Order Rosales) and H. chamyla caterpillars using species of Apocynum (Apocynaceae, Order Gentianales) [13]. These two plant families are phylogenetically distant [15] and exhibit quite different defensive chemical compounds. Apocynum species produce cardenolides that bind and inhibit Na/K-ATPase, inhibiting larval growth [16,17,18], whereas harman and esulatin are the prominent entomotoxic secondary compounds in the leaves of Elaeagnaceae [17,18]. Such observations lend support to a theory of ecological speciation driving these two taxa apart, reinforced by the different digestion chemistries needed within the caterpillars’ guts (see also [19,20] for similar findings in other Lepidoptera). Unfortunately, modern studies on the ecological differentiation of H. chamyla and H. hippophaes are lacking, given the species ranges are within either inaccessible habitats or human conflict zones. Therefore, rearing experiments of caterpillars under different conditions and on multiple food plants to test food plant preferences and choice have been impossible to accomplish to date.
For the same reason, few or no specimens, respectively, of H. hippophaes and H. chamyla have been available to previous molecular phylogenetic studies of Hyles species [1,3], as access to fresh tissue has been limited.
New computational techniques (DAISY-II) of comparative morphology and recent advances in ancient DNA extraction and sequencing now provide a window to the past and enable analyses of dry, pinned museum specimens, including valuable, often old, type material [21,22,23]. The ability to sequence valuable type material is of particular relevance to testing the genetic composition of and relationships among the various taxa included in this as yet unresolved group of moth species and ensuring correct nomenclatural application of the various names. The use of such specimens provides a whole new range of possibilities, anticipating a much-improved resolution of taxonomic conundrums, such as in this species cluster.
In this study, we bring together the results of more traditional morphological species identification with a novel approach to automated wing pattern identification and the use of multiple genomic tools with the objective of evaluating the taxonomic placement of the three main phenotypes in the H. hippophaes species-complex: bienerti, chamyla and apocyni. The phenotypical and mitochondrial genome variation of a broad sample within these taxa in Central Asia, including type material, together with an assessment of their biogeography, is used to test the previous contradictory evolutionary hypotheses put forward by Shchetkin [12], Zolotuhin and Yevdoshenko 2019 and Kitching [5], who, respectively, treat apocyni as a taxonomic subspecies, ecological subspecies or environmentally induced color form of H. chamyla (we will refer to the two phenotypes of H. chamyla as forms to be consistent with the most recent taxonomic treatment [5]). In this way, we aim to better understand the correlation between these phenotypes and their purported ecological differentiation in one of the most complex crossroads of biogeographic realms and multiple eco-zones in the Old World.

2. Materials and Methods

2.1. Taxon Sampling and Processing

Our dataset comprised 198 specimens of Hyles hippophaes, H. chamyla and the five most closely related species (H. vespertilio, H. gallii, H. nicaea, H. livornica and H. salangensis) according to the phylogeny of Hundsdoerfer et al. [7] for use as outgroups. The taxonomy follows [11]. The samples of Hyles hippophaes and H. chamyla were chosen to represent as much of the range of phenotypic variation and geographical spread of these species as possible and we also endeavored to include type material where available. All samples were photographed to enable subsequent morphological assessment and analysis by both expert opinion and a machine-learning algorithm [24]. Photographs of adult moths were taken with a Sony α6300 and a Sony E 16–50 mm F3.5–5.6 OSS. Geographical and other collecting information was extracted from specimen labels and entered into a database. Where specimen labels lacked explicit georeferences, we interpreted geographical coordinates using a variety of online mapping systems and printed atlases. This dataset was complemented with data derived from a private database curated and maintained by IJK (Table S1) and 274 occurrence points mined from the publicly available GBIF database (GBIF, 2021: https://doi.org/10.15468/dl.z2e3fn) up to 1 March 2021 (available at https://www.gbif.org/occurrence/download/0223897-200613084148143, accessed on 10 April 2021). Distribution data were imported into QGIS 2.18, optimized and exported as a vectorial map to Inkscape 1.0 (https://inkscape.org/, accessed on 10 April 2021), they were where manually edited. All sample data and photographs are also available through either GfBio (Submission ID 941b4d4f-0150-46e7-9ec1-9e30200bda75) or also in Supplementary Material (Table S1).

2.2. Species Identification and Automated Morphological Analyses

To identify each of the 198 individuals (including the 103 samples used for genetic analysis, see Whole Genome in Solution Capture below), to species, subspecies or form, we used a synergetic approach combining traditional taxonomy with the use of neural networks.
All specimens were visually scored to species by AKH and IJK using characters in a morphological matrix developed explicitly for the identification and delineation of Hyles species [25]. Subsequently, DAISY-II was run to independently determine specimen identification. DAISY-II builds a discriminatory model from images of the right forewing of each individual to provide a more objective morphological machine learning approach to specimen identification. DAISY-II is an ongoing development of the DAISY image/pattern recognition system [24,26,27] with state-of-the-art deep and dynamic learning extensions. In contrast to the original version of DAISY, images and other patterns are stochastically divided into smaller subpatterns at multiple spatial scales (Figure S1). These image/pattern sets are then used collectively to: (1) build robust models for classification; and (2) to identify ‘unknowns’. In the context of this research, these multiple spatial-scale subimages effectively represent sets of computer generated ‘characters’ that can be used to identify species on the basis of their morphology. Furthermore, as these characters are generated in an unbiased fashion, they do not suffer from issues such as confirmation bias [28], which frequently confounds manual classification schemes.
To reduce the level of noise in the model, wing images were aligned to (approximately) the same orientation prior to model generation using manual image processing tools. This model was used to generate a set of binary rules (Figure S2) that indicate how the ‘characters’ generated by DAISY-II interact with one another. This rule set was then used to generate a character interaction matrix, which was input into a force-placement inflation algorithm [29] to optimally position these ‘characters’ in a 2D ‘morph-space’; that is each character is placed at the spatial coordinate that minimizes the sum of repulsive and attractive forces acting on it (Figure S3). As a consequence, characters with similar image properties will cluster together, whereas those whose image properties are dissimilar will repel each other. Once relaxation was complete (i.e., a globally optimal self-consistent configuration of the characters within the morph-space had been found), the degree of inter- and intra-specific character clustering was visualized via a color-coding scheme.
A full description of DAISY-II and the novel deep and dynamic learning algorithms embodied within it is currently in preparation. To test the extent of overlapping morphological wing characters between the H. h. bienerti and H. chamyla, we analyzed the species both separately and grouped together into a single morphotype, ‘hipcham’.

2.3. Whole Genome in Solution Capture (WISC)

Whole Genome In Solution Capture (WISC) is an unbiased method to increase the proportion of endogenous DNA in sequencing libraries. It was first developed for ancient DNA [30], but recovering DNA from insect museum specimens presents similar limitations as ancient DNA, although generally less severely [31]. We created fresh genomic DNA “bait” libraries from seven modern specimens (preserved for molecular analyses) each representing another Central Asian Hyles species, covering as much variability of the remaining endogenous DNA as possible within the whole Central Asian Hyles species. We used adapters containing T7 RNA polymerase promoters and performed in vitro transcription of these libraries with biotinylated UTP, producing RNA baits covering the entire Hyles genome and mitochondrial genome (see RNA Bait Preparation). Analogous to exome capture technologies [32], these baits were hybridized to museum DNA libraries in solution and pulled down with magnetic streptavidin-coated beads. The unbound DNA (predominantly human, fungi and bacterial DNA) was then washed away, and the captured endogenous Hyles DNA was eluted and amplified for sequencing. By using both baits and adaptor-blocking oligos made from RNA, we were able to remove any residual baits and blockers by RNase treatment prior to PCR amplification [30].

2.3.1. RNA Bait Preparation

For bait generation, we used seven specimens representing the genetic diversity expected to be found within Central Asian Hyles (Table S2). All specimens were frozen freshly dead or conserved in pure ethanol prior to extraction to ensure high molecular DNA. Approximately 10 mm3 of whole tissue from either larvae or adult specimens was used for DNA extraction with the innuPREP DNA Mini Kit, following the manufacturer’s protocol (Analytik Jena, Jena, Germany). Fragment sizes of the extracted DNA were controlled by gel electrophoresis. Preparation of the RNA bait libraries was performed as described in Carpenter et al. (2013). Changes to that protocol included the use of the NEB (New England Biolabs, Ipswich, USA) Next Ultra II library preparation Kit for End repair, dA-tailing, adapter ligation and PCR amplification. Size selection was performed using the semi-automated E-Gel Power Snap Electrophoresis Device and the 2% SizeSelect™ II Agarose Gels (Thermo Fisher Scientific, Waltham, MA, USA). Therefore, no further cleaning of the size selected fragments was required. In vitro transcription steps, both of the libraries and the blocking oligos, were performed using the HiScribe T7 Quick High Yield RNA Synthesis Kit (NEB), followed by removal of the DNA template by DNase and purification with the Monarch RNA Clean-up Kit (NEB). Quantification of the resulting RNA bait libraries and blocking oligos was done using Nanodrop One (VWR, Radnor, PA, USA).

2.3.2. DNA Extractions, Library Preparation and Capturing of Museum Samples

DNA was extracted from entire legs or ~10 mm3 of larval tissue of the 103 samples used for genetic analysis, as previously described [22]. Whole-Genome Shotgun libraries were prepared following [33]. Hybridization capture of these libraries was done using the whole-genome shotgun RNA baits described above, following an as-yet unpublished protocol created by Tomasz Suchan [34]. The protocol is based on the MyBaits protocol (https://arborbiosci.com/wp-content/uploads/2018/04/myBaits-Manual-v4.pdf, accessed on 10 April 2021), but with slightly larger quantities of components to account for evaporation and make handling easier. The protocol was further modified to account for degraded samples and rare targets, as suggested in the protocol. We used 2 μg of 24 equimolar mixed shotgun libraries per hybridization reaction, to increase capture of rare targets. To further increase hybridization capture effectiveness, the duration was extended to 66 h as suggested in the myBaits Manual (see above). The entire protocol used for the hybridization capture can be found at https://www.protocols.io/view/capturing-protocol-bd6di9a6 (accessed on 10 April 2021). The captured and enriched libraries were pooled equimolar and sequenced through Novogene on an HiSeq4000 at 150 bp paired-end.

2.4. Data Processing

Raw sequences were trimmed for low-quality reads and adaptor sequences using BBDuk from BBTools (Bushnell B. BBMap. 2014. Available: sourceforge.net/projects/bbmap/, accessed on 10 April 2021). The cleaned sequences were mapped onto the mitochondrial reference genome of the genus Hyles [35] using Bowtie2 [36,37]. All mapped reads were filtered for mapping quality (20), leaving only unique mapped reads within the alignments and sorted by position using Samtools [38]. Picard Toolkit was used to mark and remove duplicated reads [39]. Multiallelic variant calling, normalization, merging for multisample VCF (Variant Call Format) and filtering were accomplished by using bcftools and vcftools [40,41]. The filtering of the multisample VCFs included minor allele frequency filtering to exclude SNPs (single nucleotide polymorphisms) that are supported by one sample only, and therefore are highly likely to be misincorporations due to DNA degradation typical for museum samples. Furthermore, filtering excluded sites at which only one or no alternative alleles are called for in any of the samples. Sites were also excluded if the proportion of missing data was greater than 25%, and individuals were excluded that had more than 50% of sites missing. We further removed insertions and deletions, as well as sites with mapping qualities lower than 25 and a coverage depth below three.
Phasing of the datasets and calculation of the principal component analysis (PCA) was undertaken using Plink [42] and conversion from vcf to nexus file format was done using vcf2phy [39,43]. SNPs were non-LD-pruned because SNPs on mitochondrial genomes are generally linked. Graphical plotting of the PCA was carried out using R and RStudio [44,45], including the packages ggplot2 and tidyverse [46]. PopArt was used to calculate and plot TCS haplotype networks for the mitochondrial dataset [47,48].
We included a PCA to compare the connection/hierarchical-based methods (phylogenetic trees and TCS network) with a connection-free/non-hierarchical approach. In this way, we were able to record distances between each combination of samples by summarizing the distance matrix of the SNPs to detect the underlying structuring of our data without assuming a specific structure beforehand and thus compare them [49].
Maximum likelihood phylogenies were reconstructed using IQTree2 [50]. Modelfinder was restricted to models containing ascertainment bias correction (+ASC) as only variable sites were used (SNPs). No a priori outgroups were defined. Branch support was tested using both the Bayesian-like transformation of approximate likelihood ratio test [51] and the SH-like approximate likelihood ratio test [52]. For the latter, 10,000 bootstrap replicates were performed. Bootstrap support was calculated using 1000 non-parametric bootstrap repetitions and a burn in of 100 trees. The maximum number of search iterations was set to 10,000.

2.5. Multi-Sequence Alignment of Cytochrome Oxidase Subunits

For further comparison, Sanger sequences of 9 individuals of H. hippophaes, H. chamyla and H. vespertilio were downloaded from NCBI including gene fragments of the cytochrome oxidase subunits I and II, as well as the intermediate tRNALeu. These gene fragments were also extracted from our cleaned alignments, as previously described [22] and an additional 9 unpublished Sanger sequences of these gene fragments of H. hippophaes and H. chamyla were included for comparison (Table S3). The multi-sequence alignments (MSAs) were generated, as previously described [22]. We calculated a phylogenetic tree and a TCS haplotype network for this dataset (MSA1; 2277 bp) as described above. Unresolved patterns of specimens were defined by PopArt as individuals showing more than 5% site absence, resulting in a masking of these sites and exclusion of individuals with significantly greater values.
To include a network projection of the placement of the H. h. hippophaes holotype, we generated a second MSA (MSA2; 1663 bp) of COI, tRNALeu and COII, based on MSA1, in which we excluded all missing sites of the H. h. hippophaes holotype. The network was generated using the parameters described above for MSA1.

3. Results

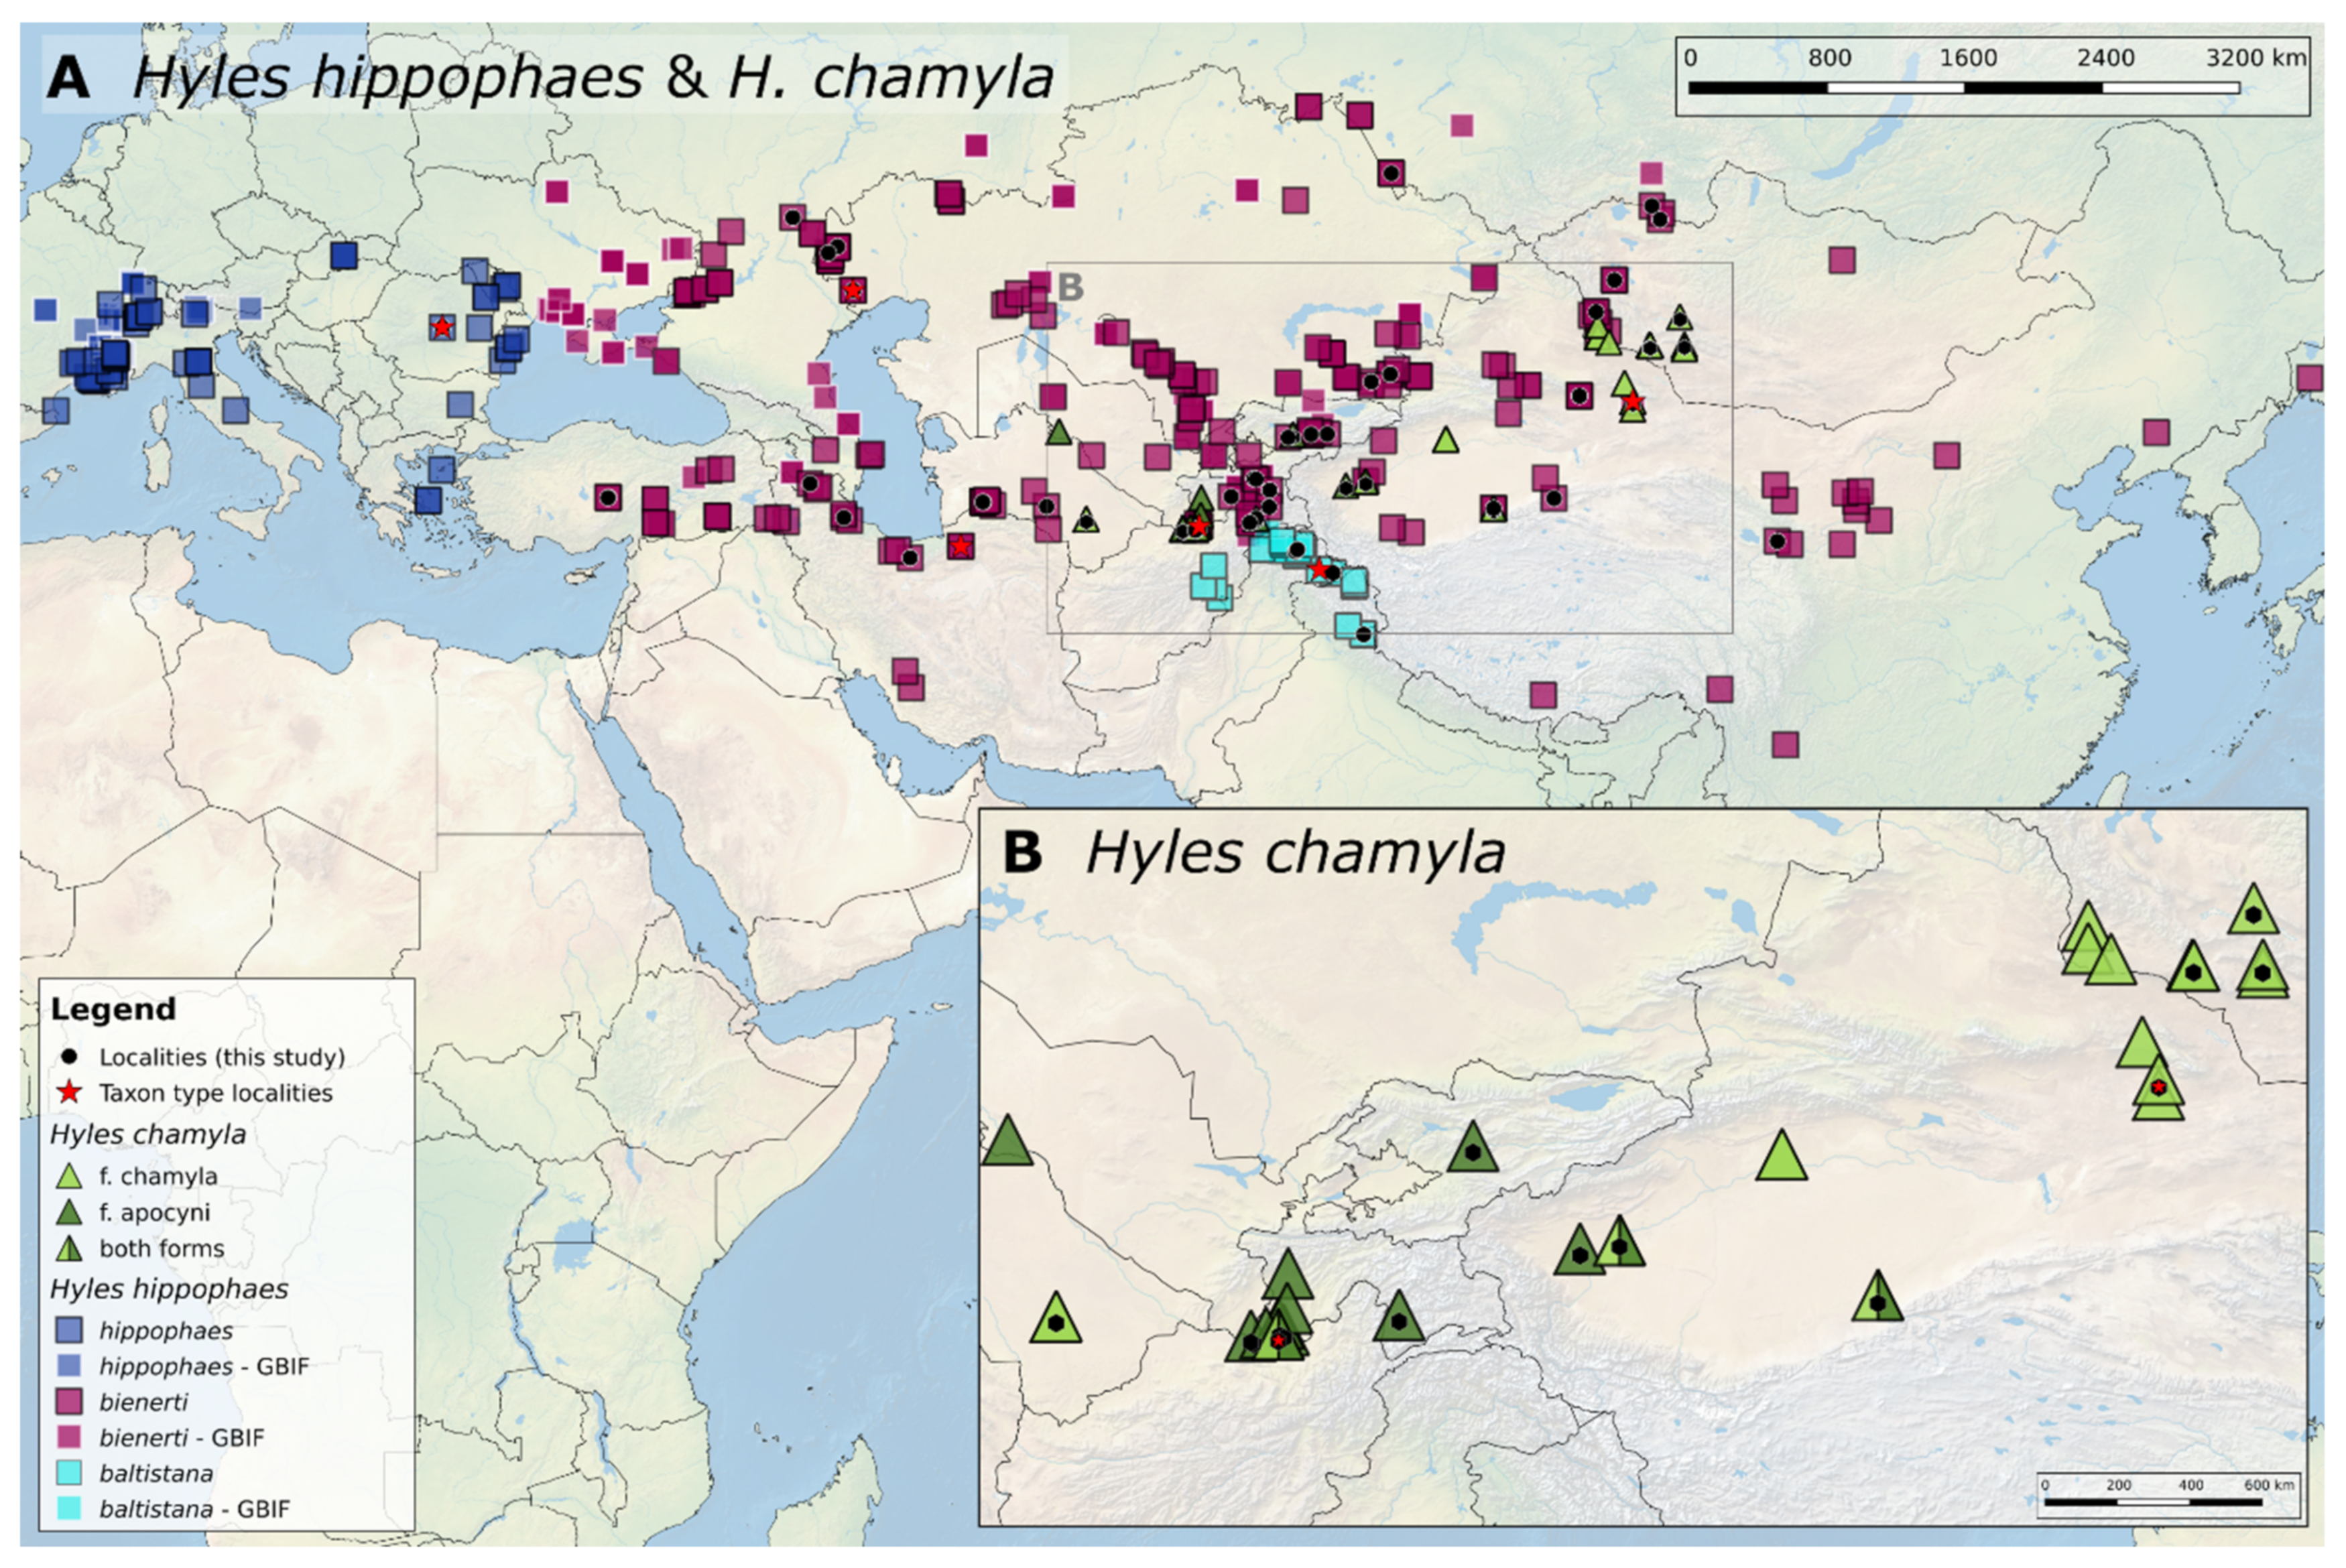
3.1. Geographic Distribution of the Hyles Hippophaes Complex

Although the geographic distribution of the three taxa has been broadly covered in [5,14], the synergistic approach presented here, where museological data are combined with citizen-science and comprehensive GBIF datasets, shows a deeper resolution, clarifying some pending uncertainties. The obtained distribution for the two species in this complex, Hyles hippophaes (with three subspecies) and Hyles chamyla (with two forms) is shown in Figure 2. Hyles hippophaes ranges from eastern Iberia (Spain) to Manchuria (China), in a highly discontinuous manner, and south to the Himalayas. Of the three subspecies, H. h. bienerti is the most widespread, from the Volga delta eastwards to China and south to south-west Iran. This taxon closely approaches and likely comes into contact with H. h. hippophaes in Ukraine and H. h. baltistana in NE Afghanistan. The latter taxon is apparently restricted to NE Afghanistan, Pakistan and NW India, but any overlap or contact zone with H. h. bienerti is still to be ascertained.
H. chamyla is a strictly Central Asian species, distributed from the river valleys of Uzbekistan eastwards to Mongolia across the southern edges of the Pamirs and Tian Shan, where it is absent from higher elevations (only H. h. bienerti occurs here). The distribution of H. chamyla shows a disjunction in the range of form chamyla, which is mostly found in the drier and hotter habitats at the western and eastern ends of the distribution, while form apocyni occupies the more humid and cooler areas in the central part of the range. However, in the west, H. chamyla is known from only two individuals, one of each form (in Uzbekistan, f. apocyni; in Turkmenistan, f. chamyla). Most individuals of form apocyni have been collected in or close to the type locality in southwest Tajikistan, but this form is also known from the north-west side of the Tarim basin and in western Uzbekistan, each in localities close to river margins with Tugai vegetation. Specimens ascribed to form chamyla have also been collected within the Tarim basin, but most are from the more arid regions of north China and western Mongolia.
The collection sites of most individuals within clade 1 can be found in mountainous river margins at above 1000 m elevation. If they are found below 1000 m, the individual collection site is more northern, following water tables (river margins/oases). Contrary to this, the individuals found in clades 2, 3, 4 and 5 are mainly found below 1000 m elevation in tugai or desert oasis habitats (excluding H. vespertilio as outgroup). Still, there are exceptions found from this general elevation pattern. Those individuals can be then found in the same habitats as the opposed clades.
Overall, the distribution of H. chamyla is contained well within the range of H. hippophaes bienerti, but they appear to be elevationally and ecologically displaced, with H. hippophaes occurring at higher altitudes than H. chamyla. However, they do occur sympatrically and syntopically at lower elevations, at least in southwestern Tajikistan.

3.2. Automated Morphological Analyses

The results of the DAISY-II analysis show that H. chamyla and H. hippophaes form a distinctive binary cluster (Figure 3), in which each subcluster contains characters from both species indicating that their morphology is very similar. It is readily apparent that there is ‘mixing’, i.e., there is a significant inter-specific correlation in morphology as inter-specific interactions occur in the cluster of the ‘other’ species.
If H. h. bienerti and H. chamyla are to be kept as two separate morphological clusters (Figure 4A), H. chamyla (yellow) appears as an elongated cluster between H. nicaea, H. livornica, H. salangensis and H. h. bienerti without any discrete delimitation between the clusters.
In contrast, the other species in the analysis form well defined unitary clusters with a low level of mixing in the morphological space (Figure S1). The nearly identical wing morphology of H. chamyla and H. hippophaes is further illustrated if the wings of the two species are grouped into a single morphotype ‘hipcham’ (Figure 4B). Then, the resulting force-placement aggregates the character set associated with the new morphotype into a well defined unitary cluster which is similar to those associated with the other Hyles species analyzed here (Figure 4). The clustering of the morphotype H. vespertilio was omitted because there were too few images in the database.

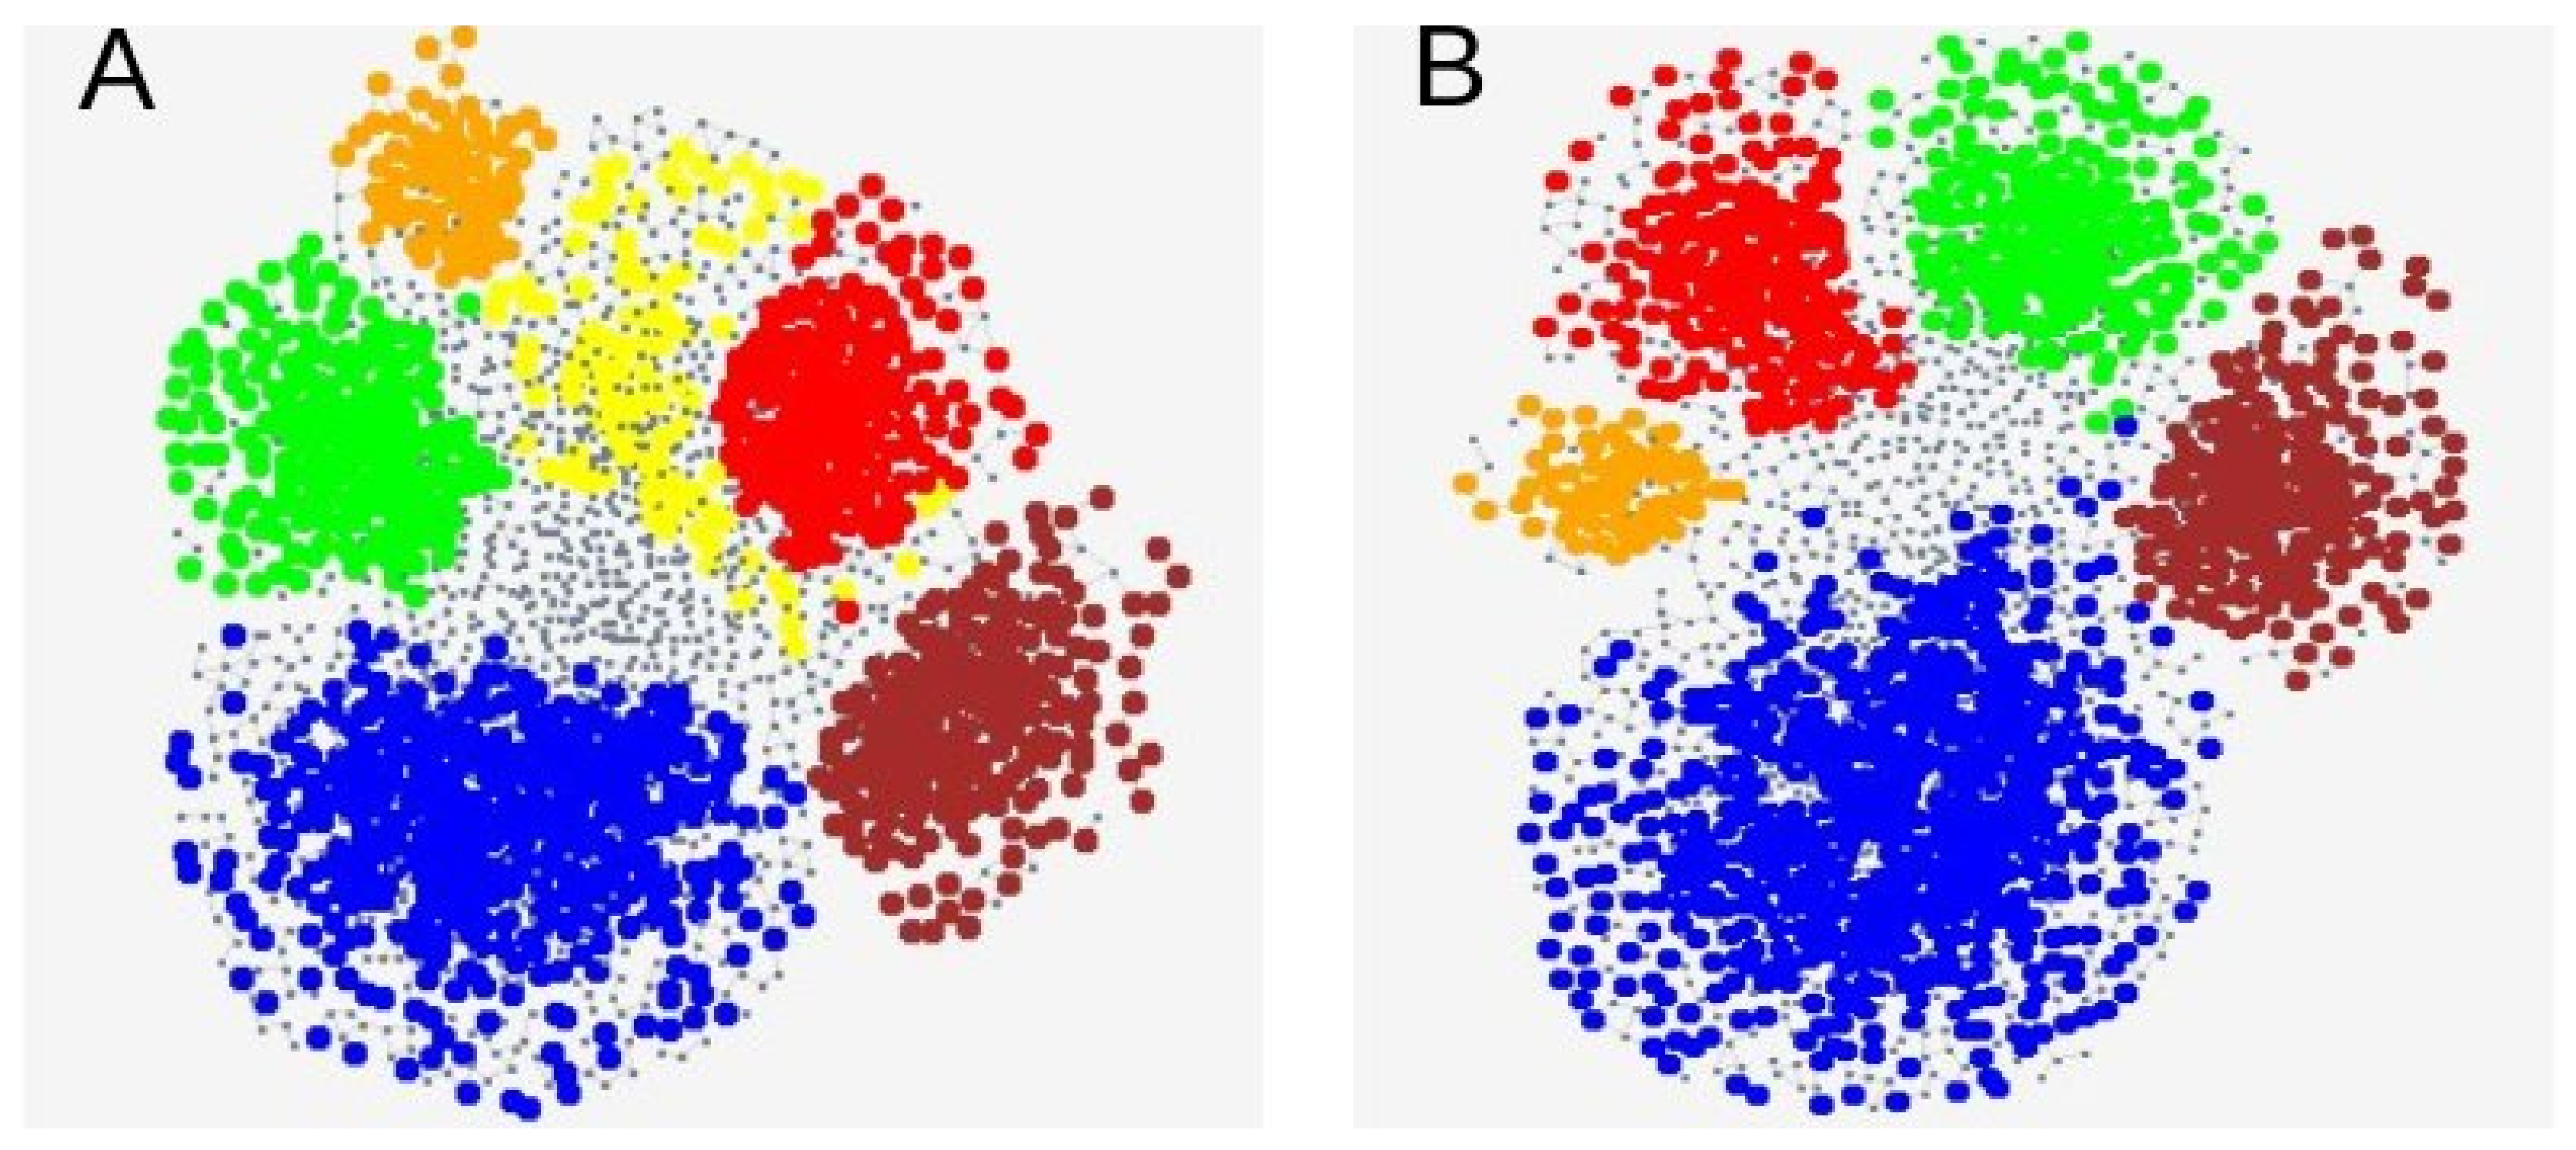
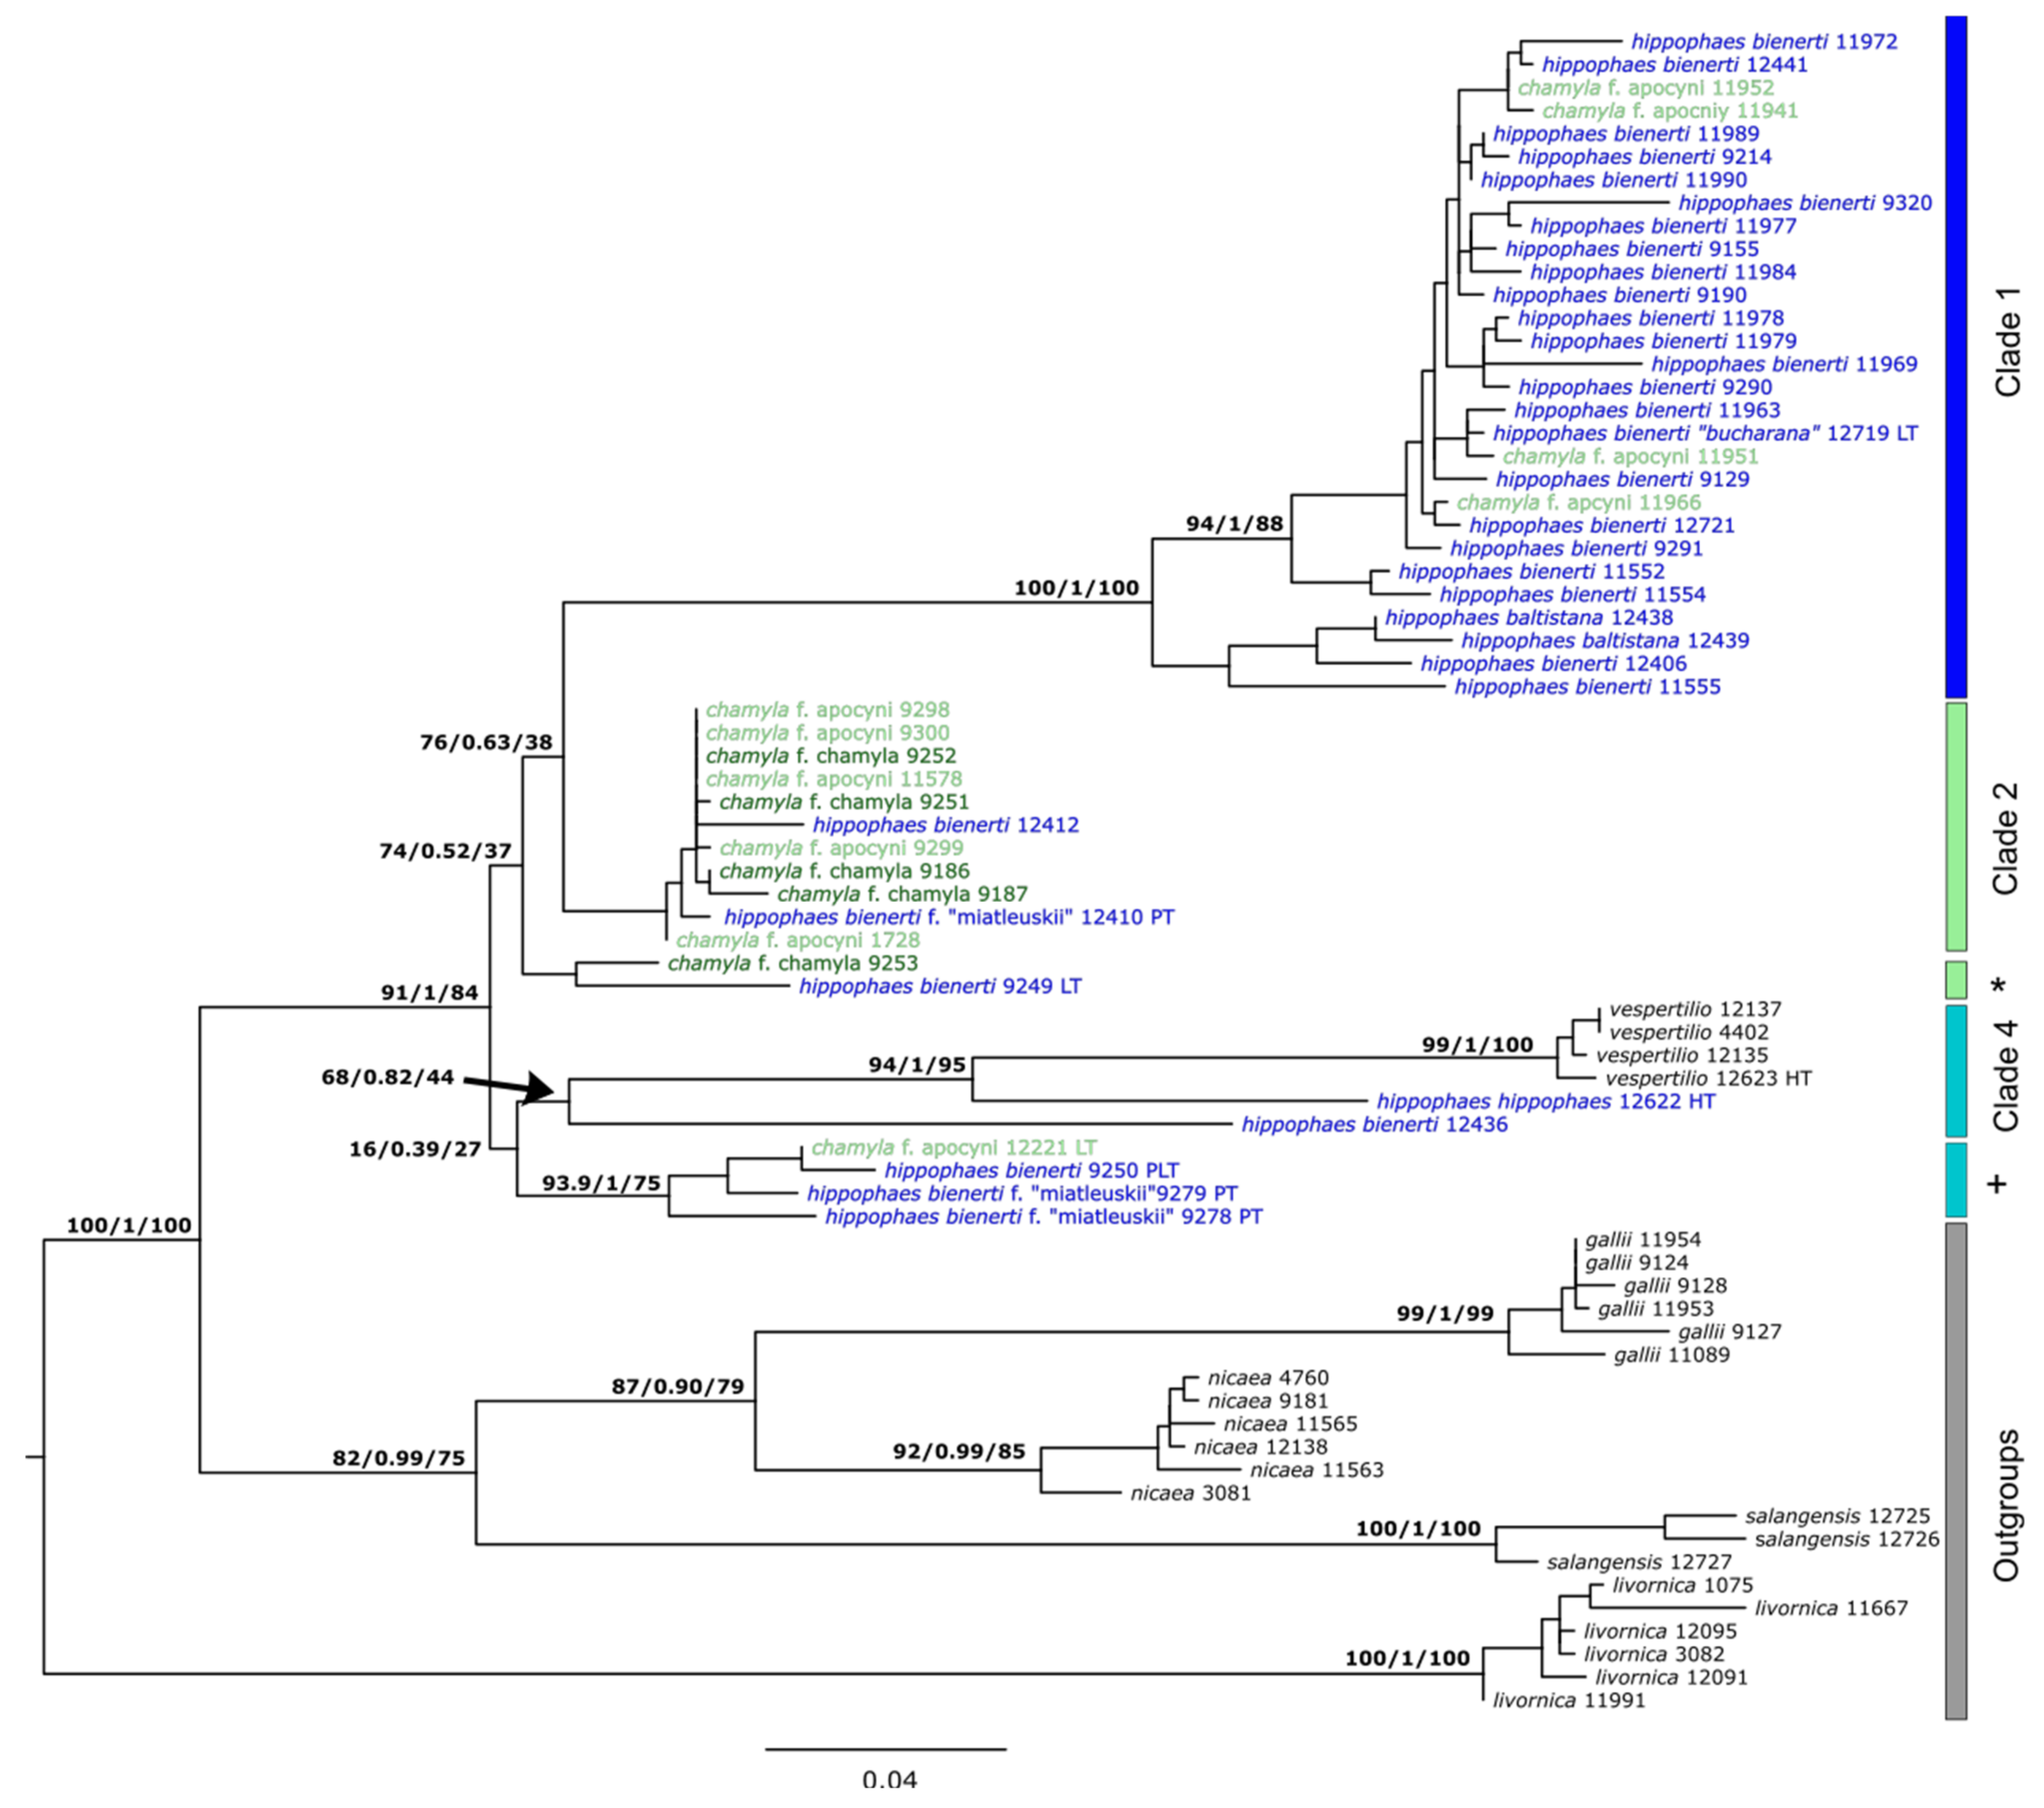
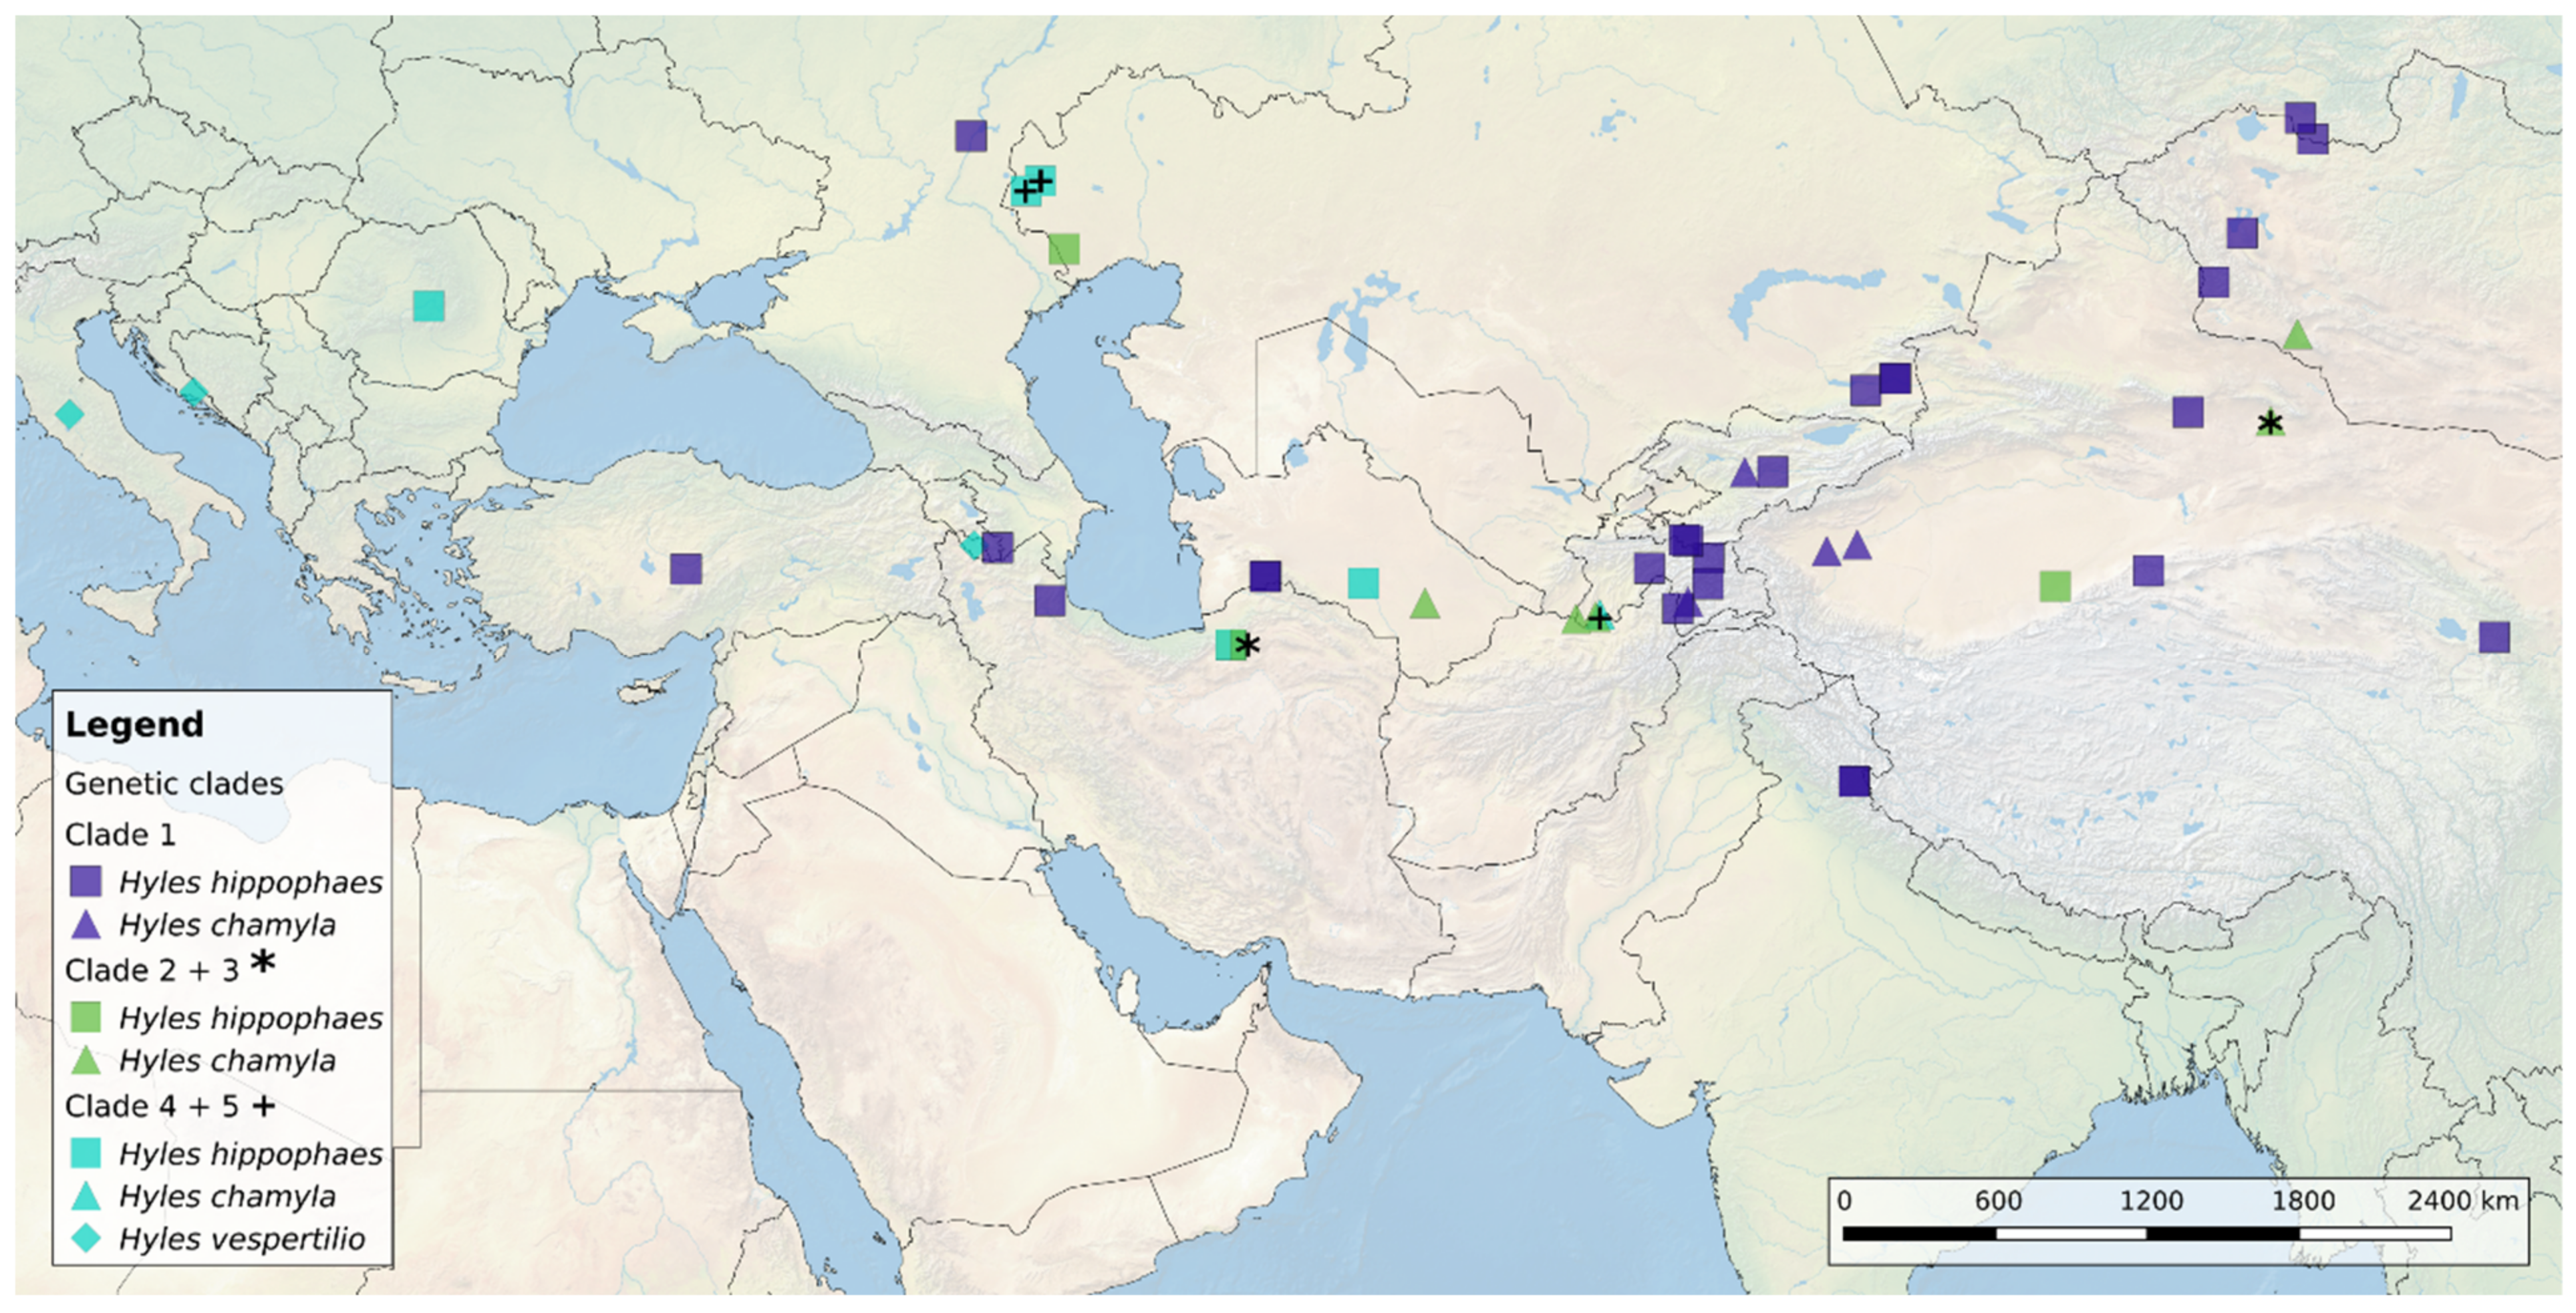
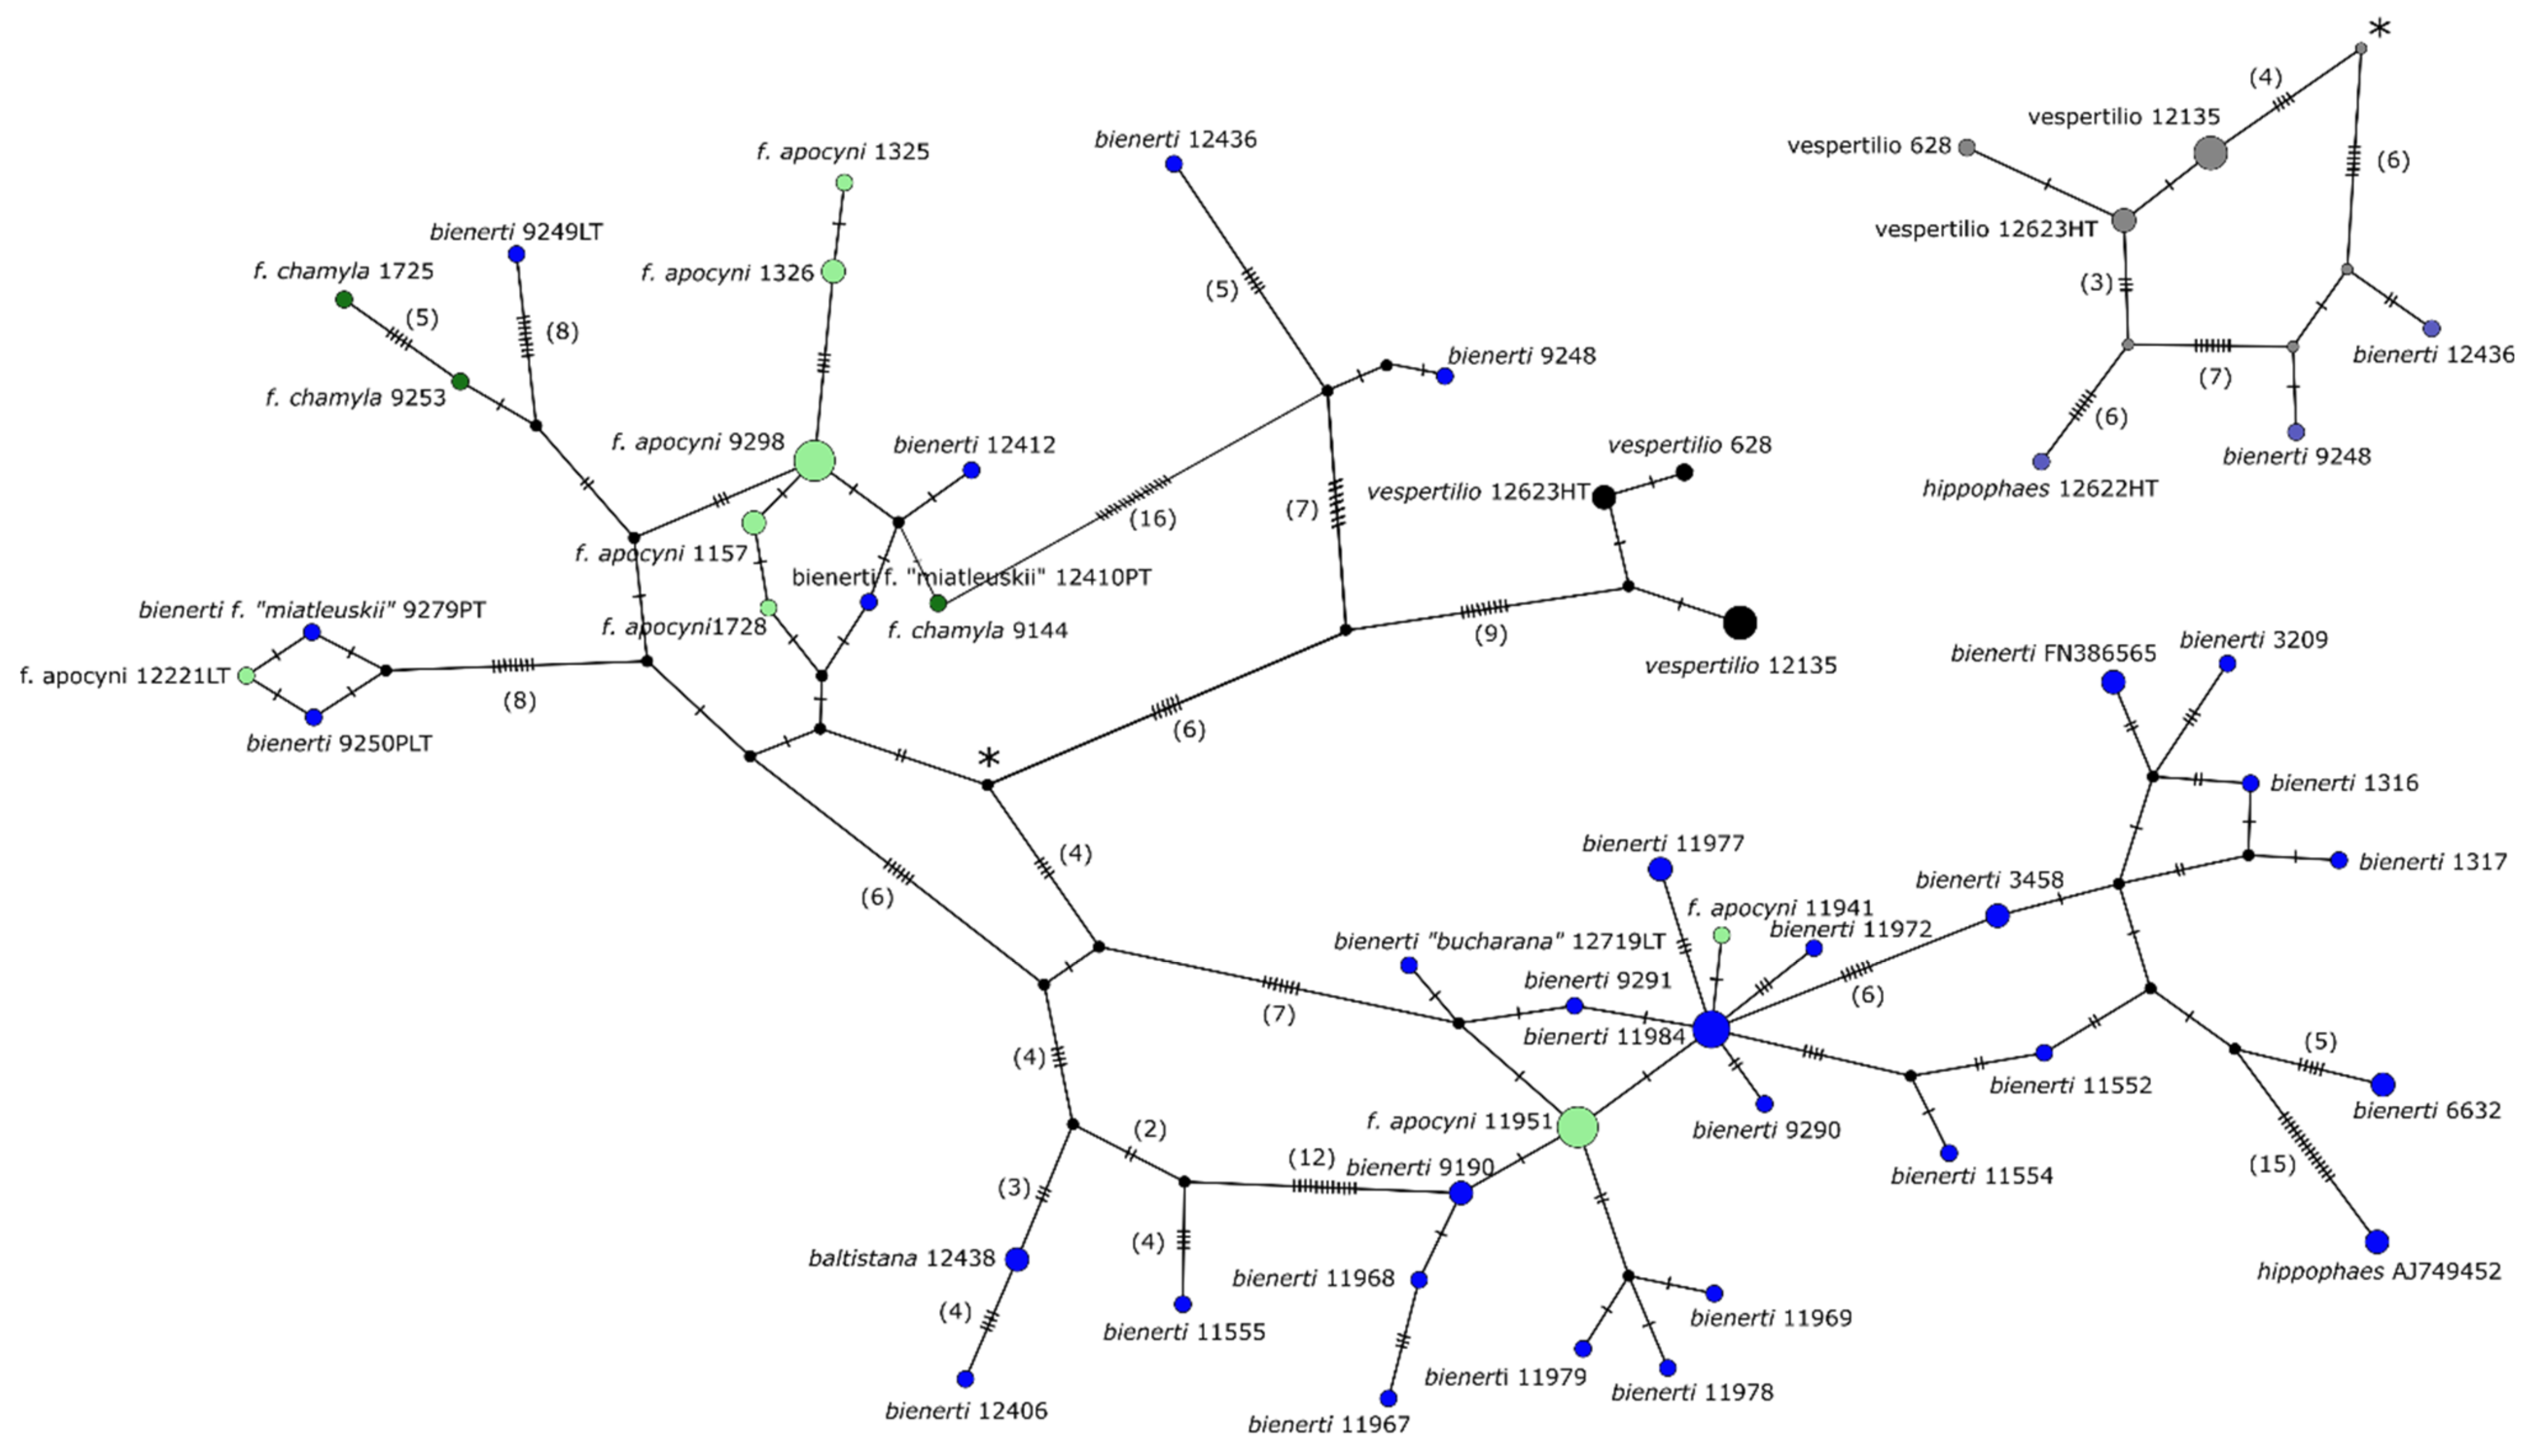
3.3. Genetic SNP Analyses

Of the 103 sequenced samples, 73 yielded a ≥ 50% coverage of the mitochondrial genome and were used for multiallelic variant calling, which resulted in 298 parsimony-informative SNPs.
In the PCA plot, PC1 accounted for 19.5% of the variation and PC2 accounted for 13.6%, resolving our samples into up to seven clusters broadly corresponding with previously published phylogenies of the genus Hyles by differentiating H. gallii, H. livornica, H. nicaea and H. salangensis into their own clusters, with H. salangensis and H. nicaea being placed closest to each other (Figure 5A). Furthermore, we found a clear differentiation pattern between H. hippophaes and H. chamyla (both forms apocyni and chamyla, Figure 5B) into two clusters. The first cluster (around PC1 −0.1) consists almost exclusively of the two H. hippophaes subspecies, bienerti and baltistana (the former including the now synonymized ssp. miatleuskii), but also includes one H. chamyla f. apocyni. The other cluster (around PC1 0.0) comprises H. chamyla f. chamyla and the remaining individuals of form apocyni, but also includes several H. hippophaes bienerti. This cluster is placed between and almost equidistant from the single individual of H. h. hippophaes (holotype), H. vespertilio and the aforementioned H. hippophaes bienerti cluster. One H. h. bienerti (MTD-TW 12436) is set further apart from the H. chamyla cluster, but is not included in either of the other clusters.
The maximum likelihood analysis (ML) resulted in a mostly resolved and generally well supported tree (Figure 6), where most identified clades had a Bayesian-like posterior probability (PP) of 1 or close to 1 (PP = 0.99–0.89). A group comprising the three outgroup species H. salangensis, H. nicaea and H. gallii, and a clade consisting of H. hippophaes + H. chamyla + H. vespertilio, is well supported (PP = 1). Although the latter group has strong support, the relationships among its five constituent clades are not well supported (Figure 3, PP = 0.39–0.63) and, essentially form a polytomy.
The majority of H. hippophaes bienerti samples form a strongly supported group on a very long branch, clade 1, but its sister relationship with clade 2 is poorly supported (PP = 0.63), perhaps because of the presence of sequences of uncertain assignment, globally integrated into clades 3–5. Likely, the same applies to the relationship between these two and clade 3 (PP = 0.52). Clade 2 mostly comprises individuals of morphologically scored Hyles chamyla, with some exceptions. In fact, some individuals of H. chamyla f. apocyni (MTD-TW 11952, 11941, 11951 and 11961) group within clade 1, whereas three H. h. bienerti (MTD-TW 12410, 12412, 9249) group within clades 2 and 3, including a H. h. bienerti (the lectotype of the junior synonym, insidiosa) that is placed with a H. chamyla f. chamyla in clade 3.
Clade 4 (PP = 1) is a very heterogeneous and poorly supported group (PP = 0.39), consisting of clusters of H. h. bienerti individuals (including the paralectotype of H. h. bienerti and two paratypes of the synonymized taxon miatleuskii, the third of which forms part of clade 2), the H. chamyla f. apocyni lectotype, the H. h. hippophaes holotype and all individuals of H. vespertilio (including its holotype). Within this group, the clade of H. vespertilio is well supported (PP = 1), as is, surprisingly, the sister relationship between H. vespertilio and the holotype of H. hippophaes (PP = 1).
We mapped the H. hippophaes/H. chamyla/H. vespertilio samples from the SNP dataset and colored them according to their clade in the ML tree (Figure 7). We found that clade 1, 2 and 3 are not geographically isolated but mostly resemble the species ranges of H. hippophaes and H. chamyla, with exceptions where individuals can be found in the other clades, as described above. Furthermore, the members of clade 2 and 3 do not divide east/west on either side of the Pamir mountains, rather we see one continuous mitochondrial lineage on both sides of the mountains. The two individuals comprising clade 3 (MTD-TW 9249 and 9253) come from Iran and northern China, and thus show no coherent geographical clustering.
Clade 4 is distributed from Italy in the west to Turkmenistan in the east, meeting the other clades around the Caspian Sea. From central Turkmenistan eastwards, only clade 1, 2 and 3 can be found.
The TCS network recovered most of the relationships found on the ML phylogenetic tree, as both clade 1 (main H. hippophaes cluster) and clade 2 (the H. chamyla cluster) are corroborated, including the disruptive positions of H. chamyla f. apocyni individuals (Figure 8). Within this cluster both the H. chamyla f. apocyni lectotype and the H. h. bienerti lectotype cluster together and are clearly separated from the H. hippophaes cluster.
H. vespertilio samples aggregate here between the two main clusters of H. chamyla and H. h. bienerti, but with 36 (H. vespertilioH. chamyla) and 46 (H. vespertilioH. hippophaes) base differences (SNPs) from these clusters, respectively. This may indicate a less close relationship among those three species than is implied by the phylogenetic tree. Indeed, H. livornica is roughly as distant from H. vespertilio and H. chamyla/H. hippophaes (32 and 42 SNPs, respectively), but not as far as is H. nicaea (34/35 and 57/58) and H. gallii (59 and 82).
H. livornica, H. gallii and H. nicaea each form their own cluster, repeating the clades found in both the PCA and the phylogenetic tree.
To calculate this network, specimens with too many unresolved states due to too missing data had to be excluded. This included the H. salangensis cluster, as well as most individuals of the H. chamyla form chamyla and the H. h. hippophaes holotype. This justification for removing these individuals is reflected by the low support values of the clades in the ML tree in which these individuals were placed.

3.4. Comparison to Published Sanger Sequences

In order to cover a wider genetic diversity in this species complex, and better ascertain the position of the different taxa using published sequences, we built a network with further specimens, using a MSA (MSA1) of the cytochrome oxidase subunits I, II and tRNALeu. It showed a broadly similar pattern to the previous analyses. Based on this partition of the mitochondrial genome, more states were, however, resolved and could be included in the analyses (Figure 9). The H. h. bienerti cluster and the essentially H. chamyla cluster (representing clade 2) remained, even when including more H. chamyla form chamyla. Despite that, the second H. h. bienerti cluster found in the ML tree (within clade 3), reappeared as a close, net-like cluster between these H. h. bienerti, the H. chamyla main cluster and H. vespertilio. All but one H. h. hippophaes, including the holotype, were excluded due to too many unresolved patterns in this analysis.
In the network based on the dataset including the H. h. hippophaes holotype, but excluding all of that sample’s missing sites (MSA2), the holotype did not cluster with the other H. h. hippophaes sample (AJ749452; main network in Figure 9, separated from the closest H. h. bienerti by 18 base pairs), but with a small cluster of highly divergent H. h. bienerti and all H. vespertilio (inset network in Figure 9). Furthermore, the differentiating mutations are fewer between the holotype of H. h. bienerti and the H. vespertilio holotype (9) than between it and other H. h. bienerti (14). However, the sites separating both species were also reduced to enable the inclusion of the H. h. hippophaes holotype. The positioning of both species on either side of the cluster might therefore be more informative than the number of individual mutations estimated in this very reduced version of the MSA.

4. Discussion

The basal split between H. livornica/H. salangensis/H. nicaea/H. gallii and the five clades of H. hippophaes/H. chamyla/H. vespertilio (Figure 6, PP = 1) is congruent with the results of previous molecular publications [1,3,25] in setting the first four species well apart both from each other and from the cluster formed of H. hippophaes/H. chamyla/H. vespertilio, thus corroborating their relative phylogenetic positions and confirming their species statuses.

4.1. Geographic Species Distribution

The distribution of H. h. bienerti found here includes both the distribution of H. h. bienerti (sensu [6]) and those of the former Central Asian subspecies (H. h. caucasica, H. h. insidiosa, H. h. shugnana, H. h. miatleuskii) as described by the original subspecies descriptions [53,54,55,56,57]. The specimens of H. h. baltistana form a distinct geographic cluster south of the Pamir and Himalyan mountain ranges at elevations of up to 2000 m. The close proximity of H. h. bienerti in lower mountain ranges to the north supports the hypothesis that H. h. baltistana is a valid high elevation subspecies rather than just an ecological or climate-induced form of H. hippophaes bienerti. However, although we found no evidence for a separate mitochondrial lineage of H. h. baltistana (Figure 5, Figure 6, Figure 7, Figure 8 and Figure 9) nor consistent phenotypic differences (beyond most specimens of H. h. baltistana being, on average, darker) to separate this subspecies from H. h. bienerti (Figure 3 and Figure 4), we nevertheless retain it as a valid subspecies pending further study.
Previously, both forms of H. chamyla were considered to be much more geographically restricted than is shown in our map (Figure 1, including their original descriptions [6,11,12]). Hyles chamyla f. chamyla was originally known only in north-west China (close to the Gobi Desert) and H. chamyla f. apocyni was considered to be restricted to a relatively small area close to the type locality (from western Tajikistan to southern Uzbekistan). We have uncovered a much broader distributional range of H. chamyla (Figure 1), which resembles that described in the most recent publication [13].

4.2. The Hybrid Origin of the Apocyni Phenotype

A close relationship between H. hippophaes and H. chamyla has often been hypothesized; indeed, H. chamyla was originally described as a subspecies of H. hippophaes (as Celerio hippophaes chamyla). It was raised to species status by Shchetkin, who then also described H. chamyla f. apocyni as a subspecies of H. chamyla,Celerio chamyla apocyni’’ [12]. However, to date, no molecular data have been used for an in-depth investigation of the relationships between H. hippophaes and H. chamyla.
In our phylogenetic tree, clade 1 represents the lineage that might best correspond to H. h. bienerti. In contrast, clade 2 best corresponds to H. chamyla, including most H. chamyla f. apocyni. However, clade 3, which is closely associated with clade 2, includes an H. chamyla f. chamyla together with an H. h. bienerti (the lectotype of the junior synonym, insidiosa. Furthermore, other individuals of H. chamyla f. apocyni are also found in H. hippophaes clade 1 and a subclade of clade 4, the latter also including the lectotype of H. chamyla f. apocyni. The supports for some of these clades are not high and the admixture of the above-mentioned individuals within the other species clusters was also found in both TCS networks. In the results of the PCA, we see two definite clusters representing clade 1 and clade 2 in the phylogenetic tree, with two H. hippophaes individuals (MTD-TW 12,622 holotype and 12436) being separated from these and with H. vespertilio also being set well apart. These differences were expected as PCAs represent only a raw, linear visualization of a distance matrix, excluding any further site contribution information to the relationship patterns [58]. This is a serious drawback when estimating the role of fine-grained relationships among samples [49], such as some of those seen in our phylogenetic tree and TCS networks. However, the differentiation of the clades not recovered by the PCA (3, 4 and 5) also have low group support in the phylogenetic tree, and samples contributing to these were also excluded from the TCS networks (Figure 7 and Figure 8). However, excluding the two samples with the highest percentage of missing data (H. h. hippophaes holotype, 51.75% and H. h. bienerti paratype, 29.53%) did not change the clade formation within the ML tree (Figure S4). Therefore, the clades need to be considered, even though the low support of the clades 3, 4 and 5 suggest a violation of the model, disrupting the hierarchical phylogenetic assumption, and creating artefacts that show up as pseudo-clades with low supports in the phylogenetic tree. The mitochondrial clades’ geographical distribution gives more insight into the correlation of the two species split (Figure 6 and Figure 7). Clade 1, presumably equal to H. h. bienerti, appears to be mostly restricted to mountainous and northern regions, while the clades 2 + 3 + 5 (a paraphyletic group in Figure 6; most likely equal to H. chamyla) include mainly specimens from deserts and tugai areas in the south. Therefore, it could be hypothesized that these two clusters represent two ecologically differentiated species.
The admixture of specimens within the clades of H. h. bienerti and H. chamyla raised suspicions that some specimens may have been incorrectly identified and named (Figure 6). Although experts in Hyles morphology (IJK, AKH) critically assessed and identified every specimen a priori based on wing pattern alone (i.e., without consideration of the genetic data), the phenotypic analysis based on machine learning showed that the three phenotypes formed a continuum without separation into discrete clusters. Therefore, phenotypic species identification based on wing pattern would be expected to differ from the species identity based on mitochondrial data.
The contradiction between species identification and mitochondrial lineages provides further insight into possible species relationships. Only H. chamyla f. apocyni can be found in both clades 1 and 2, but never f. chamyla. This could be due to the lower number of individuals analyzed of this form. However, another possible explanation of this pattern is mitochondrial introgression of H. chamyla into H. h. bienerti (and the converse), forming the phenotype that is usually referred to as H. chamyla f. apocyni. Further support for this hypothesis can be found in Figure 7, where the apocyni phenotype only occurs if H. h. bienerti also occurs in close proximity (mountains and river margins, Figure 2 and Figure 6). This suggests a hybridization scenario, in which the two species are either merging or diverging. Indeed, ongoing hybridization between two species has been shown to lead to such reticulate patterns of evolution [59,60,61,62], as found in our analysis. A reconsideration of those f. apocyni and H. h. bienerti specimens clustering in clades where they were not expected led us to the conclusion that these individuals show varying degrees of intermediate wing pattern characters between the typical phenotypes of H. h. bienerti and H. chamyla f. chamyla, thereby obfuscating correct species identification by creating a continuum of phenotypic characters, a pattern that is also reflected in the deep learning/morphological clustering analysis (Figure 3 and Figure 4). Similar results have been found in studies of other Lepidoptera, where it has been shown that in many instances, heterozygous hybrids exhibit phenotypes that look more like one of the parental forms than the other due to dominance relationships between alleles [63], rather than being absolutely intermediate. For the H. h. bienerti/H. chamyla species complex discussed here, this would result in specimens having phenotypes of H. chamyla f. apocyni, but clustering with either H. h. bienerti or H. chamyla f. chamyla according to their mitochondrial haplotype, and thus explaining the pattern of mismatches we have observed (Figure 5, Figure 7 and Figure 8, but see also Figure S5).
Additionally, despite H. chamyla being found in all four ingroup clades in our phylogenetic tree (Figure 6), and in the two main clusters of both TCS networks (Figure 8 and Figure 9), we found no evidence for two separate mitochondrial lineages of f. apocyni and f. chamyla. The geographical ranges of the two forms, their morphological differentiation (Figure 1 and Figure 2) and the phylogenetic relationships (Figure 7) are all incongruent.
Our map of H. chamyla (Figure 2), which is based on the current understanding of morphology and ecological preferences, divides the two forms according to their habitats and as such, agrees with the interpretation found in recent publications [13]. This pattern is not reflected by either the phylogenetic tree (Figure 6) or the map in which the mitochondrial clades are spatially visualized (Figure 7). We also found no evidence for a spatial splitting of mitochondrial lineages that could be interpreted as showing the two H. chamyla forms separating one from another. Moreover, we found evidence for a habitat overlap of H. chamyla and H. h. bienerti, with f. apocyni occurring at the overlapping habitats. The disjunct distribution of both forms west and east of the Pamir mountains appears not to hinder genetic exchange between the two populations. Therefore, the genetic exchange must be ongoing and could be enabled through the depressions (wide basins within the mountain systems) of western China, eastern, central and southern Kazakhstan and Uzbekistan, where Apocynum species can be found in every suitable environment.
The larvae of the two forms apparently both feed on closely related Apocynum species, depending on their local availability [13], namely Apocynum venetum venetum and A. venetum scabrum for f. apocyni in Tajikistan and Apocynum pictum for f. chamyla in Mongolia. The distributions of these three plant taxa in Central Asia mirror those of the two forms of H. chamyla, so that f. chamyla can be found in arid environments [13], co-occurring with A. v. venetum and A. pictum [64], whereas f. apocyni follows the distribution of Apocynum v. scabrum, which occurs only in the more humid river valleys [65]. These three plant species are very closely related, and so H. chamyla f. chamyla caterpillars may be able to feed on all three species. However, further research is required to test this hypothesis. If that is shown to be the case, then the overlap in habitats between H. chamyla and H. h. bienerti, mirrored by the range of Apocynum venetum scabrum, could be a hybridization zone between the two species, further supporting the pattern we have found and the conclusions we have drawn from it.
To date, f. apocyni has been treated as either a subspecies or more recently an ecological form of H. chamyla. We showed in our results that f. apocyni and f. chamyla are no valid subspecies (=geographic forms), as they do not geographic isolated, as gene flow is ongoing between the two forms (Figure 6). Ecological forms are defined through environmentally dependent phenotypic plasticity, which is well described in Lepidoptera, in which their physiological developmental processes have been shown to be sensitive to environmental variables such as temperature, pH and the availability of nutrients through their foodplants [66,67]. In Sphingidae, this generally results in larger, more intensely colored individuals in cooler/humid and paler, smaller individuals in hotter/arid environments [68]. However, although this description generally fits f. apocyni compared to f. chamyla, the phenotypic resemblance of H. h. bienerti within f. apocyni to a varying degree and the mitochondrial relationships (see above) allows us to reject this hypothesis.
Nevertheless, our dataset did not include nuclear markers, and so we have been unable to test these hypotheses in depth. Further research using nuclear markers is clearly needed to fully validate the conclusions drawn from the patterns we observed in this study.

4.3. Relationship of H. hippophaes and H. vespertilio

A close relationship between H. vespertilio and H. hippophaes has not been previously postulated, although they do share some morphological traits, such as the complete loss of the arolium on the pretarsus and significantly reduced wing patterns [7]. Furthermore, previous molecular work showed that H. vespertilio and H. hippophaes were placed in the same clade (with other species) in phylogenetic trees (PP = 0. 80 and 0.97) based on a nuclear gene (ef1-alpha) and mitochondrial genes (COI + tRNALeu + COII, [3,7]. Despite the apparently very close relationship demonstrated by all of our current analyses, the results agree with previous work in showing good support for the monophyly of H. vespertilio as a separate species from H. h. bienerti (PP = 1, [7]).
One additional observation that may be indicative of a close relationship between the two species is that one of the earliest Hyles taxa species to be described, Deilephila vespertilioides [14,69] was later determined to be a natural hybrid of H. h. hippophaes (♂) x H. vespertilio (♀). Natural hybrids between H. vespertilio and H. h. hippophaes were again recently described from the French Alps and can be found within the collection of Senckenberg Dresden. A comprehensive study of these two taxa, including much denser sampling in Europe, is thus needed to understand their interrelationships fully.

4.4. Types and Taxonomy

The placement of the lectotype of H. h. insidiosa (currently a junior synonym of H. h. bienerti) in two different positions in the two hierarchical approaches we derived using different methods (maximum likelihood and TCS) shows that its affiliation is unstable. Nevertheless, in neither topology is its sequence placed in the main H. h. bienerti clade (clade 1 in Figure 6), but instead in close proximity to the lectotype of H. chamyla f. apocyni. This incongruous pattern indicates the need for further study. However, as our molecular work was carried out in a clean room dedicated to the analysis of low-input DNA samples and sample placement was randomized, we see no source of error from, for example, sequence contamination. The results presented here suggest that H. hippophaes and H. chamyla are conspecific and should be synonymized. However, we refrain from undertaking such taxonomic changes given the pattern found above for the majority of specimens (see the discussion above). This displacement further underpins the need for nuclear genomic data and sequences from additional samples of H. h. hippophaes.
In contrast, the placement of the H. h. hippophaes holotype is similar in both the phylogenetic tree and the TCS network. However, only one other specimen of the nominotypical subspecies (AJ749452) produced sufficient data to allow it to be retained in the MSA1 TCS network (Figure 9). These two specimens were then placed in very different positions, but outside of the H. h. bienerti cluster (clade 1 in Figure 6) in both cases. The holotype is placed close to the H. vespertilio outgroup together with other highly differentiated H. h. bienerti, and the other H. h. hippophaes is set well apart from all other clusters and shows no fewer than 15 differentiating base changes compared with the closest individual of the H. h. bienerti cluster. Only in the PCA results do we observe a clear separation of the H. h. hippophaes holotype and the H. h. bienerti cluster, but as no further H. h. hippophaes specimens were included in this analysis, a more detailed investigation of the nominotypical subspecies is needed.
Finally, the paratype specimens of the former subspecies miatleuskii and bucharana all cluster within clades 1 and 2 and are not differentiated from specimens of H. h. bienerti. This lack of distinct clade formation corroborates the status of these taxa as invalid.

5. Conclusions

The combination of the results from the multiple techniques used within this study demonstrates synergy. It shows that the two taxa, H. h. bienerti and H. chamyla, form a group that is in the process of speciation, with ongoing admixture competing against continuous ecological differentiation. We conclude that the apocyni phenotype is the result of hybridization of the two species, leading to an admixed mitochondrial pattern and a phenotypic continuum blurring of the species boundaries. Consequently, we must reject both initial hypotheses of apocyni being either a subspecies or an ecological form of H. chamyla. The results we describe here provide a much more robust analysis than a molecular mitochondrial study conducted in isolation. Nevertheless, further research, including nuclear data are needed, to clarify the origin development and maintenance of the pattern we have found.
H. vespertilio and H. h. bienerti exhibit a closer relationship than previously understood, but both taxa nevertheless remain valid as all our analyses support a clear differentiation between them.
The unresolved phylogenetic position of H. h. hippophaes is most likely explained by undersampling of this European taxon that resulted from the original focus of this study being on the Central Asia populations. Future studies should include extensive sampling of the nominotypical subspecies in both western and eastern Europe.

Supplementary Materials

The following are available online at https://www.mdpi.com/article/10.3390/d13050213/s1, Figure S1: Illustration of how ‘characters’ at multiple spatial scales are generated, Figure S2: Portion of binary rule-set produced by DAISY-II, Figure S3: Example of an optimal, self consistent 2D morph-space visualisation produced by the inflater, Figure S4: Maximum Likelihood tree based on 298 parsimony-informative mitochondrial SNPs of the H. hippophaes species cluster and Hyles outgroups, Figure S5: Habitus of specimens showing conflictive assignment according to mtDNA vs phenotype data, alongside typical phenotypes of known taxa, Table S1: Samples included in Whole Genome In Solution Capture (WISC) Sequencing, Table S2: Conserved Specimens used for RNA bait generation, Table S3: Accession numbers of Sanger Sequences included for comparison.

Author Contributions

Conceptualization, A.K.H. and F.P.; Methodology, F.P., A.K.H. and M.A.O.; Raw data acquisition in the wet lab, F.P.; Formal Analysis, F.P. and M.A.O.; Investigation, F.P.; Resources, A.K.H., H.D., E.M., M.A.O. and I.J.K.; Data Curation, F.P., H.D., E.M., I.J.K. and A.K.H.; Writing—Original Draft Preparation, F.P.; Writing—Review and Editing, F.P., A.K.H., I.J.K., E.M., M.A.O. and H.D.; Visualization, F.P., E.M., H.D. and M.A.O.; Supervision, A.K.H.; Project Administration, A.K.H.; Funding Acquisition, A.K.H. All authors have read and agreed to the published version of the manuscript.

Funding

This work was financed by the Deutsche Forschungsgemeinschaft (DFG HU 1561/5-1 with support from RE 603/25-1) and benefitted from the sharing of expertise within the DFG priority program SPP 1991 Taxon-OMICS. Sequencing was performed at Novogene in cooperation with LOEWE Translational Biodiversity Genomics centre (TBG), Senckenberg Museum, Frankfurt, Germany. The publication of this article was funded in part by the Open Access Fund of the Leibniz Association. The funders had no role in study design, data collection and analysis, decision to publish, or preparation of the manuscript.

Institutional Review Board Statement

Not applicable.

Data Availability Statement

All reported data and photographs are available through either GfBio (Submission ID 941b4d4f-0150-46e7-9ec1-9e30200bda75) or in the Supplementary Material.

Acknowledgments

A.K.H. thanks M. Wink for his support during her first work on the genus Hyles during the period 2000–2005, which laid the basis for the current paper. We thank the curators and the dedicated lepidopterists who provided specimens from their collections, but particularly Ronald Brechlin (Pasewalk, Germany), Ulf Eitschberger (Entomological Museum, Marktleuthen, Germany), Axel Hausmann (Bavarian State Collection of Zoology, Munich, Germany), the late Heimo Harbich (Salz, Germany), Susanne Kridlo (Hessisches Landesmuseum für Kunst und Natur, Wiesbaden, Germany), Alexej Y. Matov (Zoological Institute, Saint-Petersburg, Russia), Tomáš Melichar and Michal Řezáč (Sphingidae museum s.r.o., Czech Republic), Wolfram Mey (Museum of Natural History Berlin, Germany), Wolfgang Nässig (Senckenberg Frankfurt a.M., Germany), Laszlo Ronkay (Hungarian Natural History Museum, Budapest, Hungary) Dmitry F. Shovkoon (Faculty of Biology, Samara University, Russia), Manfred Stroehle (private collection, Weiden, Germany), the late Thomas J. Witt (Museum Witt, Munich, Germany) and Roman V. Yakovlev (Faculty of Biology, Altai State University, Barnaul, Russia). Sequence data were obtained in cooperation with LOEWE-TBG (Frankfurt a.M.).

Conflicts of Interest

The authors declare no conflict of interest.

Appendix A. Morphological Species Definition of

  • H. hippophaes
Hyles hippophaes bienerti are large moths with wingspans around 8 cm. The inner edge of the triangular postmedial band (line PM5; see Figure 8 in Hundsdoerfer & Kitching, 2020 for labels of pattern elements) is straight, especially as it passes the position of spot c/d (which is rarely present) near the discal spot, and if it is curved, it appears to be more evenly and shallowly curved. The costal margin is pale and usually contrasts strongly with the triangular postmedial band. The hindwing margin is usually beige or grey, at best only slightly pinkish. The forewing, particularly in the males, is elongated and pointed and the outer edge is straight. The moth has the impression of being a more streamlined, elongate and triangular moth than the superficially similar H. chamyla.
  • H. chamyla f. chamyla
Typical Hyles chamyla (“form chamyla”) from Xinjiang and SW Mongolia are small moths for the genus, with wingspans of only around 6 cm. The costal half of the forewing is darkish brown, slightly paler than the triangular postmedial band (see Figure 8 in Hundsdoerfer & Kitching, 2020 for labels of pattern elements). The hindwing marginal band is generally pinkish (although not always). The inner edge of the triangular postmedial band is concave around the area of spot c/d, but hits the inner margin fairly straight, whereas it curves down strongly in H. nicaea and H. centralasiae. Spot c/d is small, if not absent. The impression is of a more rounded and shorter-winged moth than H. h. bienerti.
  • H. chamyla f. apocyni
The former species, H. apocyni (sensu Danner et al., 1998), which we refer to here as form ‘apocyni’ of H. chamyla following Kitching (2021), is similar but larger and does not show as much of the dark costal flush as H. chamyla form chamyla. Consequently, it more similar to H. hippophaes bienerti. It was treated as an “ecological subspecies” of H. chamyla by Zolotuhin & Yevdoshenko (2019), whereas Kitching (2021) interprets this term to refer to an ecological form in which the intensity of the pattern is at least partially environmentally influenced (Pittaway, 2021). It occurs in more southerly, more humid areas than form ‘chamyla’ and may also benefit from feeding on higher quality larval foodplants, thereby producing larger moths.
The caterpillars of both species only differ slightly. Both exhibit a herbaceous green ground colour with a yellowish subdorsal stripe (better expressed in European H. hippophaes populations), often expanding into yellowish or pinkish spots in the center of the segments and with a wide white substigmal stripe. In H. chamyla the numerous dots are never pinkish, it does not exhibit a lateral stripe with ocellated extensions, and lacks a teardrop-shaped yellow spot at the base of the caudal horn (Zolotuhin and Yedvoshenko, 2019).

References

  1. Hundsdoerfer, A.K.; Kitching, I.J.; Wink, M. A molecular phylogeny of the hawkmoth genus Hyles (Lepidoptera: Sphingidae, Macroglossinae). Mol. Phylogenet. Evol. 2005, 35, 442–458. [Google Scholar] [CrossRef]
  2. Hundsdoerfer, A.K.; Lee, K.M.; Kitching, I.J.; Mutanen, M. Genome-wide SNP Data Reveal an Overestimation of Species Diversity in a Group of Hawkmoths. Genome Biol. Evol. 2019, 11, 2136–2150. [Google Scholar] [CrossRef] [PubMed] [Green Version]
  3. Hundsdoerfer, A.K.; Rubinoff, D.; Attié, M.; Wink, M.; Kitching, I.J. A revised molecular phylogeny of the globally distributed hawkmoth genus Hyles (Lepidoptera: Sphingidae), based on mitochondrial and nuclear DNA sequences. Mol. Phylogenet. Evol. 2009, 52, 852–865. [Google Scholar] [CrossRef] [PubMed]
  4. Kitching, I.J.; Cadiou, J.-M. Hawkmoths of the World: An Annotated and Illustrated Revisionary Checklist (Lepidoptera: Sphingidae); Cornell University Press: Ithaca, NY, USA; Natural History Museum: London, UK, 2000; ISBN 9780801437342. [Google Scholar]
  5. Kitching, I.J. Sphingidae Taxonomic Inventory. 2021. Available online: http://sphingidae.myspecies.info/ (accessed on 10 April 2021).
  6. Danner, F. Die Schwärmer der Westlichen Palaearktis: Tafelband; U. Eitschberger: Marktleuthen, Germany, 1998; ISBN 9783923807031. [Google Scholar]
  7. Hundsdoerfer, A.K.; Päckert, M.; Kehlmaier, C.; Strutzenberger, P.; Kitching, I.J. Museum archives revisited: Central Asiatic hawkmoths reveal exceptionally high late Pliocene species diversification (Lepidoptera, Sphingidae). Zool. Scr. 2017, 46, 552–570. [Google Scholar] [CrossRef]
  8. Meerman, J.C.; Smid, G. Der Hyles euphorbiae-Komplex; die Wolfsmilchschwärmer von Kreta (Lepidoptera: Sphingidae). Entomol. Z. 1998, 161–176. [Google Scholar]
  9. Speidel, W.; Hassler, M.; Back, H.E.; Hassler, D. Die Schmetterlingsfauna der Südlichen Sahara und Ihrer Hochgebirge Hoggar und Tassili n’Ajjer (Lepidoptera); Entomologischer Verein Apollo: Frankfurt am Main, Germany, 1989. [Google Scholar]
  10. Hundsdoerfer, A.K.; Mende, M.B.; Kitching, I.J.; Cordellier, M. Taxonomy, phylogeography and climate relations of the Western Palaearctic spurge hawkmoth (Lepidoptera, Sphingidae, Macroglossinae): Western Palaearctic spurge hawkmoth relations. Zool. Scr. 2011, 40, 403–417. [Google Scholar] [CrossRef]
  11. Denso, P. Celerio Hippophaes Esp. Dt. Ent. Z. Iris 1913, 27, 22–45. [Google Scholar]
  12. Shchetkin, Y.L. On the Sphingidae Fauna of Tajikistan, Report I: Towards the systematics and the biology of hawk-moths of the Kendyr (Apocynum) and the Gissar vine. Izv. Akad. Nauk Tadzhik. Ssr Otd. Estest. Vennijkh Nauk 1956, 16, 143–156. [Google Scholar]
  13. Zolotuhin, V.V.; Yevdoshenko, S.I. Hawk Moths (Lepidoptera: Sphingidae) of Russia and Adjacent Territories; Korporatsiya Tekhnologiy Prodvizheniya: Ulyanovsk, Russia, 2019; 480p, ISBN 978-5-94655-372-8. (In Russian) [Google Scholar]
  14. Pittaway, A.R. Hyles Chamyla. Available online: https://tpittaway.tripod.com/sphinx/h_cha.htm (accessed on 7 April 2021).
  15. The Angiosperm Phylogeny Group. An update of the Angiosperm Phylogeny Group classification for the orders and families of flowering plants: APG IV. Bot. J. Linn. Soc. 2016, 181, 1–20. [CrossRef] [Green Version]
  16. Heidel-Fischer, H.M.; Vogel, H. Molecular mechanisms of insect adaptation to plant secondary compounds. Curr. Opin. Insect. Sci. 2015, 8, 8–14. [Google Scholar] [CrossRef]
  17. Cappuccino, N.; Arnason, J.T. Novel chemistry of invasive exotic plants. Biol. Lett. 2006, 2, 189–193. [Google Scholar] [CrossRef] [PubMed] [Green Version]
  18. Wrońska, A.K.; Boguś, M.I.; Kaczmarek, A.; Kazek, M. Harman and norharman, metabolites of entomopathogenic fungus Conidiobolus coronatus (Entomopthorales), disorganize development of Galleria mellonella (Lepidoptera) and affect serotonin-regulating enzymes. PLoS ONE 2018, 13, e0204828. [Google Scholar] [CrossRef] [PubMed]
  19. Ebel, E.R.; DaCosta, J.M.; Sorenson, M.D.; Hill, R.I.; Briscoe, A.D.; Willmott, K.R.; Mullen, S.P. Rapid diversification associated with ecological specialization in Neotropical Adelpha butterflies. Mol. Ecol. 2015, 24, 2392–2405. [Google Scholar] [CrossRef] [PubMed] [Green Version]
  20. Fordyce, J.A. Host shifts and evolutionary radiations of butterflies. Proc. Biol. Sci. 2010, 277, 3735–3743. [Google Scholar] [CrossRef]
  21. Gilbert, M.T.P.; Moore, W.; Melchior, L.; Worobey, M. DNA extraction from dry museum beetles without conferring external morphological damage. PLoS ONE 2007, 2, e272. [Google Scholar] [CrossRef] [Green Version]
  22. Thomsen, P.F.; Elias, S.; Gilbert, M.T.P.; Haile, J.; Munch, K.; Kuzmina, S.; Froese, D.G.; Sher, A.; Holdaway, R.N.; Willerslev, E. Non-destructive sampling of ancient insect DNA. PLoS ONE 2009, 4, e5048. [Google Scholar] [CrossRef]
  23. Patzold, F.; Zilli, A.; Hundsdoerfer, A.K. Advantages of an easy-to-use DNA extraction method for minimal-destructive analysis of collection specimens. PLoS ONE 2020, 15, e0235222. [Google Scholar] [CrossRef]
  24. Watson, A.T.; O’Neill, M.A.; Kitching, I.J. Automated identification of live moths (Macrolepidoptera) using digital automated identification System (DAISY). Syst. Biodivers. 2004, 1, 287–300. [Google Scholar] [CrossRef]
  25. Hundsdoerfer, A.K.; Kitching, I.J. Ancient incomplete lineage sorting of Hyles and Rhodafra (Lepidoptera: Sphingidae). Org. Divers. Evol. 2020, 20, 527–536. [Google Scholar] [CrossRef]
  26. Gaston, K.J.; O’Neill, M.A. Automated species identification: Why not? Philos. Trans. R. Soc. Lond. B Biol. Sci. 2004, 359, 655–667. [Google Scholar] [CrossRef] [Green Version]
  27. O’Neill, M.A. DAISY: A practical tool for semi-automated species identification. Automated Taxon Identification in Systematics: Theory, Approaches and Applications; CRC Press: Boca Raton, FL, USA, 2007; Chapter 9; pp. 131–152. [Google Scholar]
  28. Pohl, R.; Pohl, R.F. Cognitive Illusions: A Handbook on Fallacies and Biases in Thinking, Judgement and Memory; Psychology Press: London, UK, 2004; ISBN 9781841693514. [Google Scholar]
  29. Stephan, K.E.; Hilgetag, C.C.; Burns, G.A.; O’Neill, M.A.; Young, M.P.; Kötter, R. Computational analysis of functional connectivity between areas of primate cerebral cortex. Philos. Trans. R. Soc. Lond. B Biol. Sci. 2000, 355, 111–126. [Google Scholar] [CrossRef] [PubMed] [Green Version]
  30. Carpenter, M.L.; Buenrostro, J.D.; Valdiosera, C.; Schroeder, H.; Allentoft, M.E.; Sikora, M.; Rasmussen, M.; Gravel, S.; Guillén, S.; Nekhrizov, G.; et al. Pulling out the 1%: Whole-genome capture for the targeted enrichment of ancient DNA sequencing libraries. Am. J. Hum. Genet. 2013, 93, 852–864. [Google Scholar] [CrossRef] [PubMed] [Green Version]
  31. Zimmermann, J.; Hajibabaei, M.; Blackburn, D.C.; Hanken, J.; Cantin, E.; Posfai, J.; Evans, T.C., Jr. DNA damage in preserved specimens and tissue samples: A molecular assessment. Front. Zool. 2008, 5, 18. [Google Scholar] [CrossRef] [Green Version]
  32. Gnirke, A.; Melnikov, A.; Maguire, J.; Rogov, P.; LeProust, E.M.; Brockman, W.; Fennell, T.; Giannoukos, G.; Fisher, S.; Russ, C.; et al. Solution hybrid selection with ultra-long oligonucleotides for massively parallel targeted sequencing. Nat. Biotechnol. 2009, 27, 182–189. [Google Scholar] [CrossRef] [PubMed] [Green Version]
  33. Tin, M.M.-Y.; Economo, E.P.; Mikheyev, A.S. Sequencing degraded DNA from non-destructively sampled museum specimens for RAD-tagging and low-coverage shotgun phylogenetics. PLoS ONE 2014, 9, e96793. [Google Scholar] [CrossRef]
  34. Suchan, T.; Kusliy, M.A.; Khan, N.; Chauvey, L.; Tonasso-Calvière, L.; Schiavinato, S.; Southon, J.; Shapiro, B.; Keller, M.; Krause, J.; et al. Performance and automation of ancient DNA capture with RNA hyRAD probes. Submitt. Mol. Ecol. 2021. [Google Scholar]
  35. Pippel, M.; Jebb, D.; Patzold, F.; Winkler, S.; Vogel, H.; Myers, G.; Hiller, M.; Hundsdoerfer, A.K. A highly contiguous genome assembly of the bat hawkmoth Hyles vespertilio (Lepidoptera: Sphingidae). Gigascience 2020, 9. [Google Scholar] [CrossRef] [PubMed]
  36. Thornton, J. Read Recruitment Using Bowtie2 v6 (protocols.io.kevcte6). Available online: https://www.protocols.io/view/read-recruitment-using-bowtie2-kevcte6?version_warning=no (accessed on 10 April 2021).
  37. Langmead, B.; Salzberg, S.L. Fast gapped-read alignment with Bowtie 2. Nat. Methods 2012, 9, 357–359. [Google Scholar] [CrossRef] [PubMed] [Green Version]
  38. Li, H.; Handsaker, B.; Wysoker, A.; Fennell, T.; Ruan, J.; Homer, N.; Marth, G.; Abecasis, G.; Durbin, R. 1000 Genome Project Data Processing Subgroup The Sequence Alignment/Map format and SAMtools. Bioinformatics 2009, 25, 2078–2079. [Google Scholar] [CrossRef] [Green Version]
  39. Picard Toolkit. Available online: https://broadinstitute.github.io/picard/ (accessed on 10 April 2021).
  40. Danecek, P.; Auton, A.; Abecasis, G.; Albers, C.A.; Banks, E.; DePristo, M.A.; Handsaker, R.E.; Lunter, G.; Marth, G.T.; Sherry, S.T.; et al. The variant call format and VCFtools. Bioinformatics 2011, 27, 2156–2158. [Google Scholar] [CrossRef] [PubMed]
  41. Li, H. A statistical framework for SNP calling, mutation discovery, association mapping and population genetical parameter estimation from sequencing data. Bioinformatics 2011, 27, 2987–2993. [Google Scholar] [CrossRef] [PubMed] [Green Version]
  42. Purcell, S.; Neale, B.; Todd-Brown, K.; Thomas, L.; Ferreira, M.A.R.; Bender, D.; Maller, J.; Sklar, P.; de Bakker, P.I.W.; Daly, M.J.; et al. PLINK: A tool set for whole-genome association and population-based linkage analyses. Am. J. Hum. Genet. 2007, 81, 559–575. [Google Scholar] [CrossRef] [PubMed] [Green Version]
  43. vcf2phylip v2.0: Convert a VCF Matrix into Several Matrix Formats for Phylogenetic Analysis. Available online: https://github.com/edgardomortiz/vcf2phylip (accessed on 10 April 2021).
  44. RStudio: Integrated Development for R; RStudio, PBC: Boston, MA, USA; Available online: https://www.rstudio.com/ (accessed on 10 April 2021).
  45. R: A Language and Environment for Statistical Computing. Available online: https://www.r-project.org/ (accessed on 10 April 2021).
  46. Wickham, H.; Averick, M.; Bryan, J.; Chang, W.; McGowan, L.; François, R.; Grolemund, G.; Hayes, A.; Henry, L.; Hester, J.; et al. Welcome to the tidyverse. J. Open Source Softw. 2019, 4, 1686. [Google Scholar] [CrossRef]
  47. Leigh, J.W.; Bryant, D. Popart: Full-feature software for haplotype network construction. Methods Ecol. Evol. 2015, 6, 1110–1116. [Google Scholar] [CrossRef]
  48. Clement, M.; Snell, Q.; Walke, P.; Posada, D.; Crandall, K. TCS: Estimating gene genealogies. In Proceedings of the 16th International Parallel and Distributed Processing Symposium 2002, Ft. Lauderdale, FL, USA, 15–19 April 2001. [Google Scholar]
  49. Konishi, T.; Matsukuma, S.; Fuji, H.; Nakamura, D.; Satou, N.; Okano, K. Principal Component Analysis applied directly to Sequence Matrix. Sci. Rep. 2019, 9, 19297. [Google Scholar] [CrossRef] [Green Version]
  50. Nguyen, L.-T.; Schmidt, H.A.; von Haeseler, A.; Minh, B.Q. IQ-TREE: A fast and effective stochastic algorithm for estimating maximum-likelihood phylogenies. Mol. Biol. Evol. 2015, 32, 268–274. [Google Scholar] [CrossRef]
  51. Anisimova, M.; Gil, M.; Dufayard, J.-F.; Dessimoz, C.; Gascuel, O. Survey of branch support methods demonstrates accuracy, power, and robustness of fast likelihood-based approximation schemes. Syst. Biol. 2011, 60, 685–699. [Google Scholar] [CrossRef]
  52. Guindon, S.; Dufayard, J.-F.; Lefort, V.; Anisimova, M.; Hordijk, W.; Gascuel, O. New algorithms and methods to estimate maximum-likelihood phylogenies: Assessing the performance of PhyML 3.0. Syst. Biol. 2010, 59, 307–321. [Google Scholar] [CrossRef] [Green Version]
  53. Staudinger, O. Einige neue Lepidopteren des europäischen Faunengebietes. Stettin. Entomol. Ztg. 1874, 35, 87–98. [Google Scholar]
  54. Erschoff, N.G. Lepidopteren von Turkestan. Stettin. Entomol. Ztg. 1874, 35, 386–417. [Google Scholar]
  55. Sheijuzhko, L. Zwei neue Rassen von Celerio hippophaes. Esp. Mitt. Münch. Ents. Ges. 1933, 23, 43–45. [Google Scholar]
  56. Bang-Haas, O. Neubeschreibungen und Berichtigungen der Exotischen Macrolepidopterenfauna. II. Entomol. Z. Frankf. Main 1939, 52, 301–302. [Google Scholar]
  57. Eitschberger, U.; Saldatis, A. Hyles deserticola (Staudinger, 1901) auf der Kanaren-Insel Fuerteventura (Lepidoptera, Sphingidae). Neue Entomol. Nachr. 2006, 59, 398–400. [Google Scholar]
  58. Marhold, K.; Lihová, J. Polyploidy, hybridization and reticulate evolution: Lessons from the Brassicaceae. Osterr. Bot. Z. 2006, 259, 143–174. [Google Scholar] [CrossRef]
  59. Brower, A.V.Z. Alternative facts: A reconsideration of putatively natural interspecific hybrid specimens in the genus Heliconius (Lepidoptera: Nymphalidae). Zootaxa 2018, 4499, 1–87. [Google Scholar] [CrossRef] [PubMed]
  60. Fusco, G.; Minelli, A. Phenotypic plasticity in development and evolution: Facts and concepts. Introduction. Philos. Trans. R. Soc. Lond. B Biol. Sci. 2010, 365, 547–556. [Google Scholar] [CrossRef] [Green Version]
  61. Nijhout, H.F. Development and evolution of adaptive polyphenisms. Evol. Dev. 2003, 5, 9–18. [Google Scholar] [CrossRef] [PubMed]
  62. Boisduval, J.B.A.E.D. Sur cinq espèces nouvelles de Lépidoptères d’Europe. Mém. Soc. Linn. 1827, 6, 109–120. [Google Scholar]
  63. Thevs, N.; Zerbe, S.; Kyosev, Y.; Rozi, A.; Tang, B.; Abdusalih, N.; Novitskiy, Z. Apocynum venetum L. and Apocynum pictum Schrenk (Apocynaceae) as multi-functional and multi-service plant species in Central Asia: A review on biology, ecology, and utilization. J. Appl. Bot. Food Qual. 2013, 85, 159. [Google Scholar]
  64. Markus, Apocynum venetum subsp, Scabrum (Russanov) in Royal Botanic Gardens, Kew (2021), The World Checklist of Vascular Plants (WCVP). Available online: https://doi.org/10.15468/6h8ucr (accessed on 1 April 2021).
  65. Diamond, S.E.; Kingslover, J.G. Environmental dependence of thermal reaction norms: Host plant quality can reverse the temperature-size rule. Am. Nat. 2010, 175, 1–10. [Google Scholar] [CrossRef]
  66. Nijhout, H.F. The control of body size in insects. Dev. Biol. 2003, 261, 1–9. [Google Scholar] [CrossRef] [Green Version]
  67. Atkinson, D. Temperature and Organism Size: A Biological Law for Ectotherms? Advances in Ecological Research; Academic Press: London, UK, 1994; Volume 25, pp. 1–58. [Google Scholar]
  68. Partridge, L.; Barrie, B.; Fowler, K.; French, V. Evolution and development of body size and cell size in Drosophila melanogaster in response to temperature. Evolution 1994, 48, 1269–1276. [Google Scholar] [CrossRef] [PubMed]
  69. Chapman, R.F.; Simpson, S.J.; Douglas, A.E. The Insects: Structure and Function; Cambridge University Press: Cambridge, UK, 2013; ISBN 9780521113892. [Google Scholar]
Figure 1. Representations of the right forewing patterns in Hyles hippophaes sspp. and H. chamyla. A forewing of H. nicaea (outgroup) is added to illustrate the typical wing features of Hyles species and show the available patterns of Central Asian Hyles.
Diversity 13 00213 g001
Figure 2. (A) Distribution of H. hippophaes and H. chamyla in Central Asia. Blue of differing shades and magenta squares mark occurrence points of the three infraspecific taxa associated with H. hippophaes; green triangles mark occurrence points for the two H. chamyla forms; black dots indicate genetic samples used in this study; red stars mark the type localities of the taxa; white borders indicate data points derived from GBIF. (B) Distribution of Hyles chamyla, only shown for clarity.
Diversity 13 00213 g002
Figure 3. Wing clustering of H. chamyla (A) and H. hippophaes (B). Inter-specific correlations are shown in blue and intra-specific correlations are shown in red.
Diversity 13 00213 g003
Figure 4. Clustering with H. chamyla and H. hippophaes as distinct morphs (A) and as a single aggregated morph (B). The color codes are: H. salangensis—orange; H. gallii—brown; H. livornica—green; H. Nicaea—red; H. hippophaes (A)/’hipcham’ (B)—blue; H. chamyla (A)—yellow.
Diversity 13 00213 g004
Figure 5. Principal Component Analysis based upon the 298 parsimony-informative mitochondrial SNPs of the H. hippophaes species cluster (A) including outgroups, (B) excluding outgroups except for H. vespertilio.
Diversity 13 00213 g005
Figure 6. Maximum likelihood tree based on 298 parsimony-informative mitochondrial SNPs of the H. hippophaes species cluster and Hyles outgroups. Node support values from left to right are ML bootstrap, Bayesian-like posterior probability, and parsimony bootstrap. Bootstrap support values are based upon 1000 non-parametric bootstraps. The tree is unrooted but was rooted at the midpoint for illustration purposes. Clade 3 is marked by an asterisk, clade 5 is marked by a plus symbol. The black arrow points to the node to which the support values belong.
Diversity 13 00213 g006
Figure 7. Geographical distribution of the H. hippophaes, H. chamyla and H. vespertilio samples used in this study. Symbols represent species as defined by morphology, colors represent the clades found in the phylogenetic tree. Individuals of clade 3 are marked with an asterisk, and those of clade 5 are marked by a plus symbol.
Diversity 13 00213 g007
Figure 8. TCS Network from mitochondrial SNP’s including H. hippophaes, H. chamyla and outgroups. Species delimitation by morphology is indicated by color and individual name. Blue are H. hippophaes bienerti, green are H. chamyla (including form apocyni), black are H. vespertilio and grey are all other outgroup species (H. nicaea, H. livornica and H. gallii, or internal non-sampled nodes).
Diversity 13 00213 g008
Figure 9. TCS Network of the Cytochrome Oxidase Multisequence alignment (MSA1; COI, tRNALeu and COII) with additional Sanger sequenced individuals. Species delimitation by morphology is indicated by color and individual name. Blue is H. hippophaes subspecies, green are H. chamyla including form apocyni, black is H. vespertilio. A second, smaller cluster from a second analysis (MSA2) is included in grey to show positioning of the H. h. hippophaes holotype when all missing sites in the alignment were excluded. The asterisk is showing where the second smaller cluster would be connected.
Diversity 13 00213 g009
Publisher’s Note: MDPI stays neutral with regard to jurisdictional claims in published maps and institutional affiliations.

