Article

A Comparative Analysis of the Diets of a Genus of Freshwater Turtles across Africa

1
Institute for Development, Ecology, Conservation & Cooperation, via G. Tomasi di Lampedusa 33, I-00144 Rome, Italy
2
Department of Animal and Environmental Biology, Rivers State University of Science and Technology, P.M.B. Port Harcourt 5080, Nigeria
3
Department of Zoology and Animal Biology, University of Lomé, Lomé 01 BP 1515, Togo
4
Department of Wildlife, CNRES, University of Juba, Juba P.O. Box 82, South Sudan
5
AERD—Alliance for Environment and Rural Development, El Hikma Medical Centre Street, Gudele West, Juba Block II. P.O. Box 445, South Sudan
6
Ecolobby, via Edoardo Jenner 70, I-00151 Rome, Italy
7
Department of Forestry and Wildlife, University of Uyo, Uyo 520241, Nigeria
8
Department of Fisheries, Lagos State University, Ojo 10201, Nigeria
9
Ecologia Applicata Italia S.R.L., via Jevolella, 2, 90018 Termini Imerese (Palermo), Italy
*
Author to whom correspondence should be addressed.
Diversity 2021, 13(4), 165; https://doi.org/10.3390/d13040165
Submission received: 10 March 2021 / Revised: 29 March 2021 / Accepted: 8 April 2021 / Published: 12 April 2021

Abstract

:
Pelusios (Testudines: Pleurodira) is an Afrotropical endemic genus of freshwater turtles that have adapted to a variety of habitats, with savannahs and forests being their two main habitat types. Although considered generally carnivorous, these turtles have rarely been subjected to detailed field surveys for determining their quantitative diet. In this paper, by using both the literature and original data, we analyze the diet of several Pelusios populations: three P. adansonii populations from South Sudan, one P. nanus from Zambia, seven P. castaneus from Nigeria, Benin and Togo, and four P. niger from Nigeria. All species were omnivorous but with a clear preponderance of the prey items being of animal origin (e.g., amphibians, fish, arthropods and annelids). Saturation curves revealed that the diet composition of all the surveyed populations was adequately assessed, and the diversity profiles indicated that all the populations were relatively similar in terms of overall dietary diversity. General Linear Models (GLM) showed a negative effect of vegetation cover on Anura adult consumption by turtles, and showed that the frequencies of Anura tadpoles, fish, reptiles and birds on Pelusios diets increased with the increase in vegetation cover. The GLM model also showed positive effects of individual body size on algae, Bivalvia, reptiles, birds and small mammal consumption by turtles, and underlined that the predation on Arachnida decreased with the increase in turtle body size. In all species, there were no significant intersexual dietary differences, whereas there were substantial ontogenetic dietary changes in three out of four species. Small-sized individuals of P. castaneus, P. niger and P. adansonii tended to feed mainly upon insects, with the adults also taking many fish and adult frogs, and in the case of P. niger, also birds and small mammals. Conversely, in P. nanus, the diet composition did not vary substantially from the juvenile to the adult age. All species appeared substantially generalist in terms of their diet composition, although the effects of season (wet versus dry) were not adequately assessed by our study.

1. Introduction

Many recent studies have focused on the diet of freshwater turtles worldwide, including studies from North America [1,2], South America [3], Europe [4,5], Asia [6], and Africa [7], but most species remain little known and there is virtually no study summarizing from a quantitative view the dietary characteristics of any turtle family. However, these kinds of reviews/meta-analyses may uncover life-history aspects that remain hidden in individual studies at the local scale, thus considerably enhancing the knowledge on the diversity of ecological strategies of freshwater turtles worldwide.
Pelusios is an Afrotropical endemic genus of freshwater turtles (Testudines: Pleurodira) that have adapted to a variety of habitats, with savannahs and forests being their two main habitat types [8]. Although considered generally carnivorous [8], these turtles have rarely been subjected to detailed field surveys for determining their quantitative diet [9]. Because of their wide distribution and their occurrence in divergent habitat types, the Pelomedusidae species may constitute an ideal model of study for assessing the extent of variation in the foraging ecology of tropical freshwater turtles.
In this paper, by using both the literature and original data, we present a preliminary analysis of the diet of several Pelusios populations belonging to four distinct species (Figure 1): three P. adansonii populations from South Sudan, one P. nanus from Zambia, seven P. castaneus from Nigeria, Benin and Togo, and four P. niger from Nigeria. Our aims with this paper are also to provide a database that can be used for further, deeper analysis of the feeding habits of Pelusios populations across Africa. More explicitly, we ask the following key questions:
(1)
What is the taxonomic diet composition of the various Pelusios populations studied to date? More specifically, are these turtles essentially carnivorous as previously reported on the basis of general anecdotal literature [8,10]?
(2)
Is there any effect of species, sex, or habitat (vegetation cover) on the diet composition of the various populations? This question is relevant because many studies have showed that there are considerable dietary variations associated with these variables in freshwater turtles [11].
(3)
Are there any ontogenetic dietary variations in the various species? More specifically, given that there are species that exhibit large sizes as adults but very small size at hatching (P. niger) and others that are very small even at the adult stage (P. nanus), is the ontogenetic dietary variation more pronounced in the larger than in the smaller species? This question is relevant because previous studies revealed that there are considerable dietary variations associated with body size and ontogenesis in turtles [12,13], whereas in modern reptiles, important ontogenetic dietary changes are generally linked to conspicuous variations in body size between juveniles and adults [14].

2. Materials and Methods

2.1. Data Sources and Field Protocol

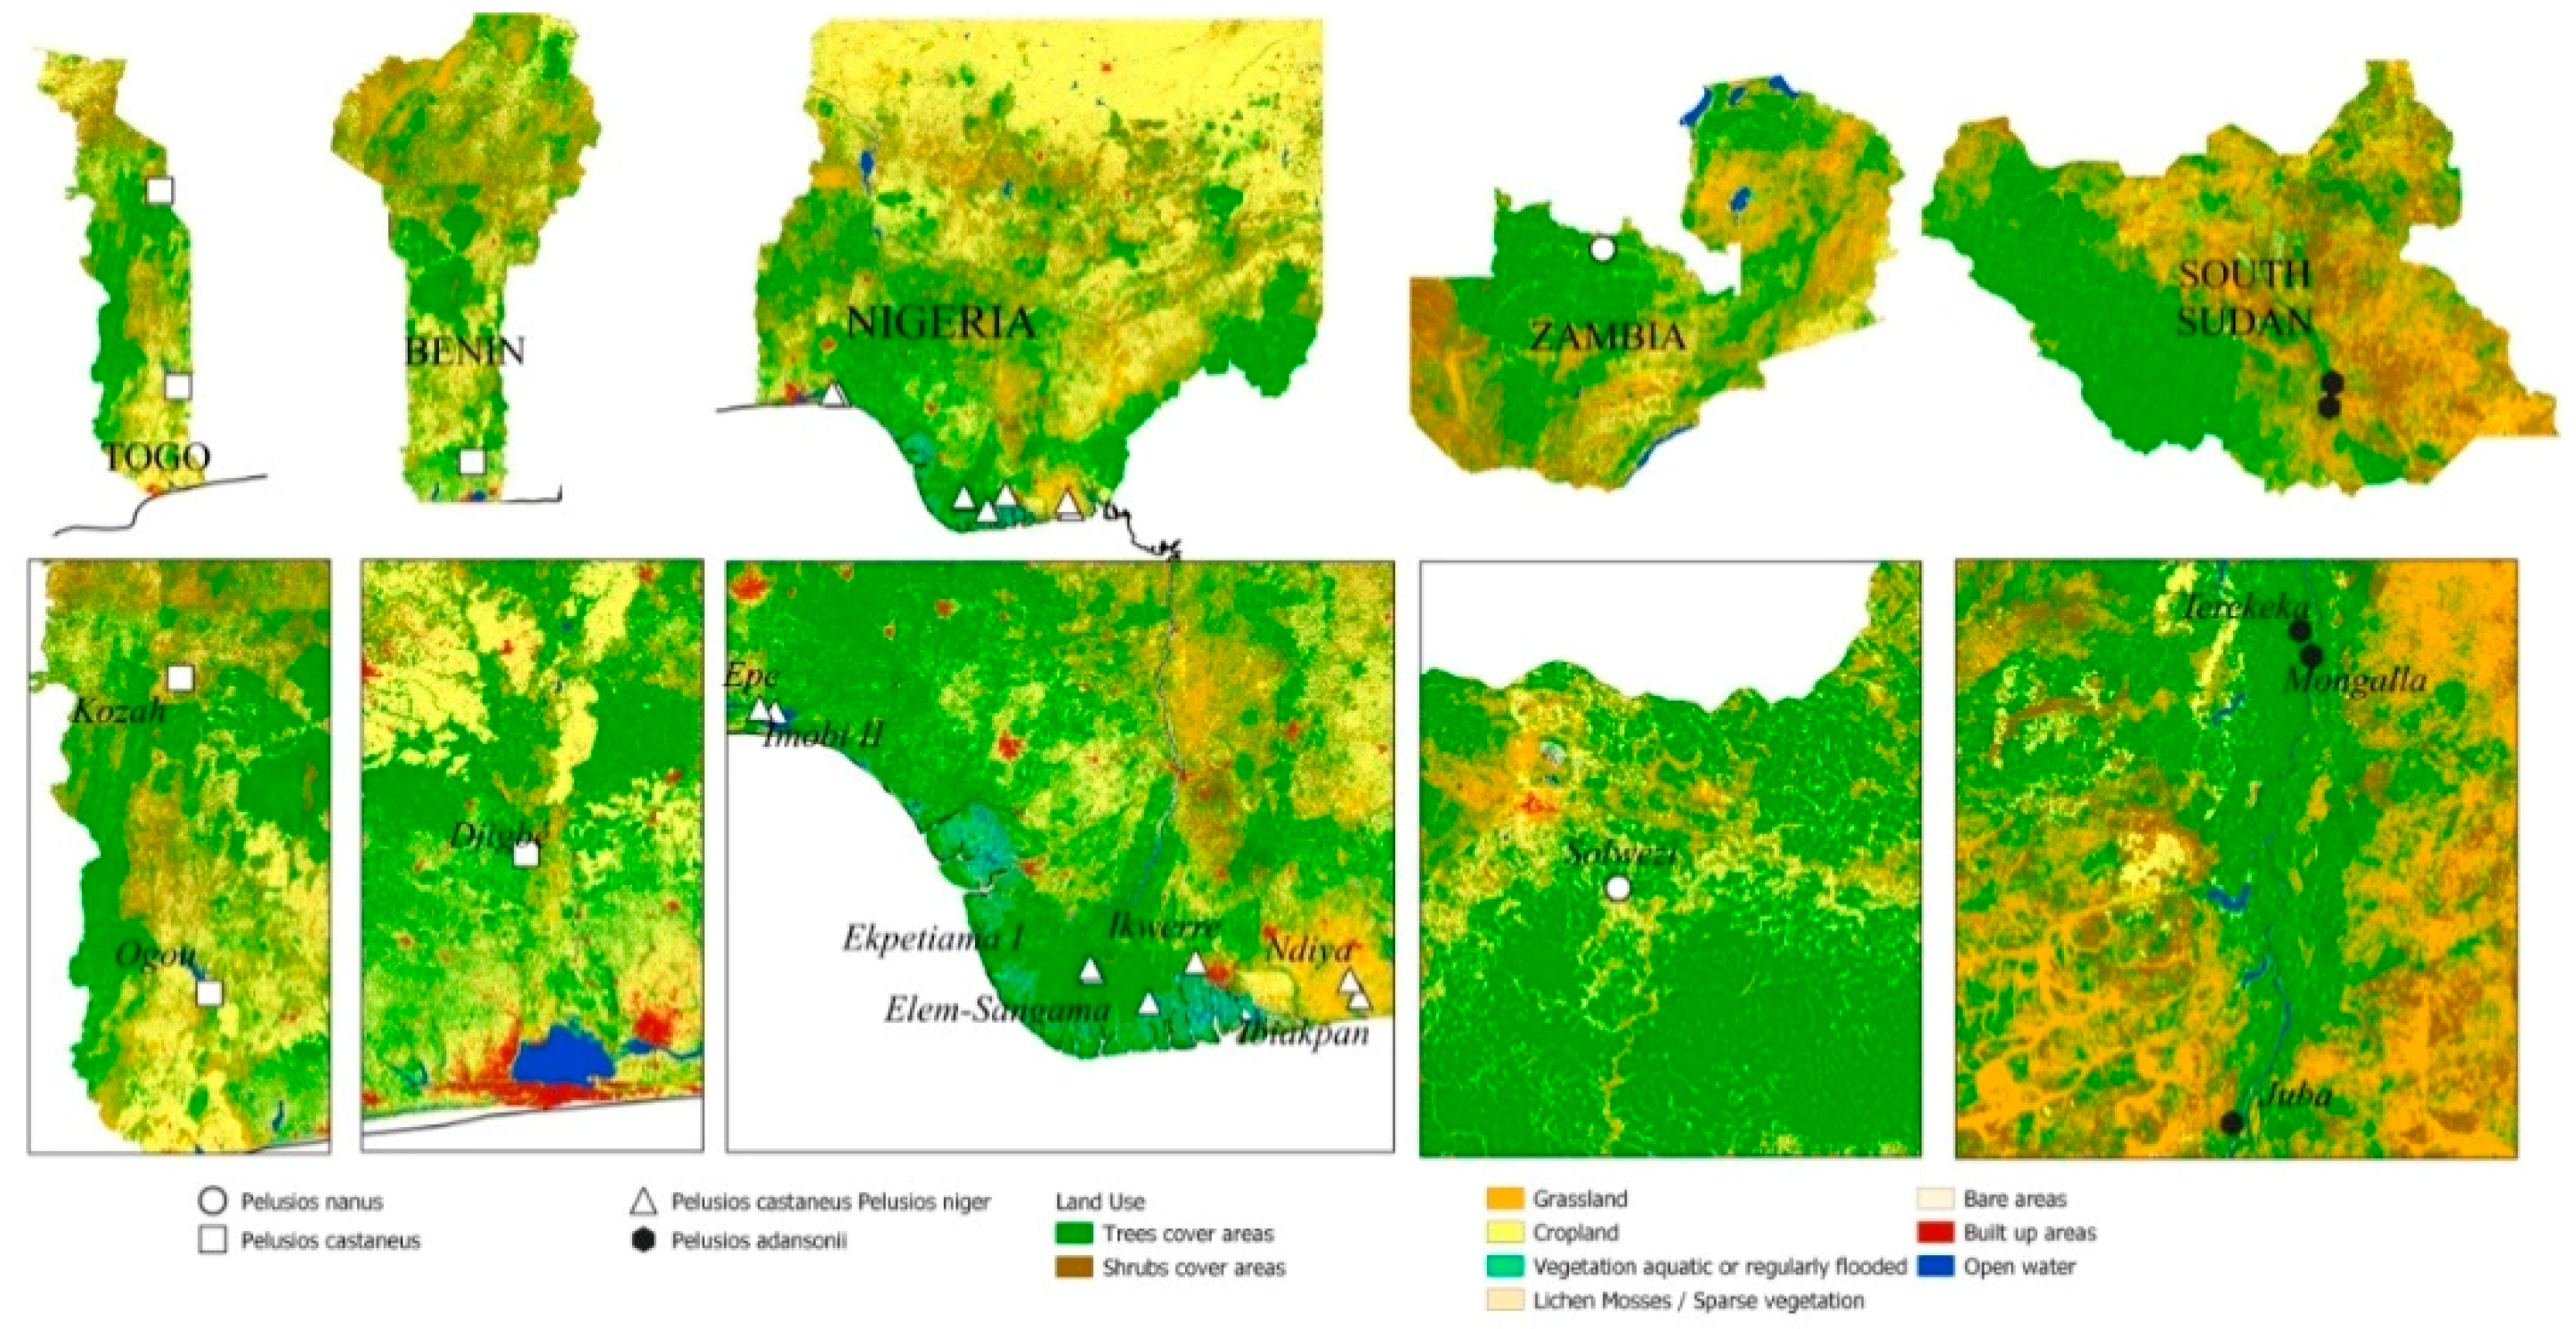
The literature data included three populations of P. castaneus and two populations of P. niger studied in the Niger Delta, Nigeria [7,9]. The original data came from additional four populations of P. castaneus, two of P. niger, and one of P. nanus. The geographic positions of the various study areas are presented in Figure 2.
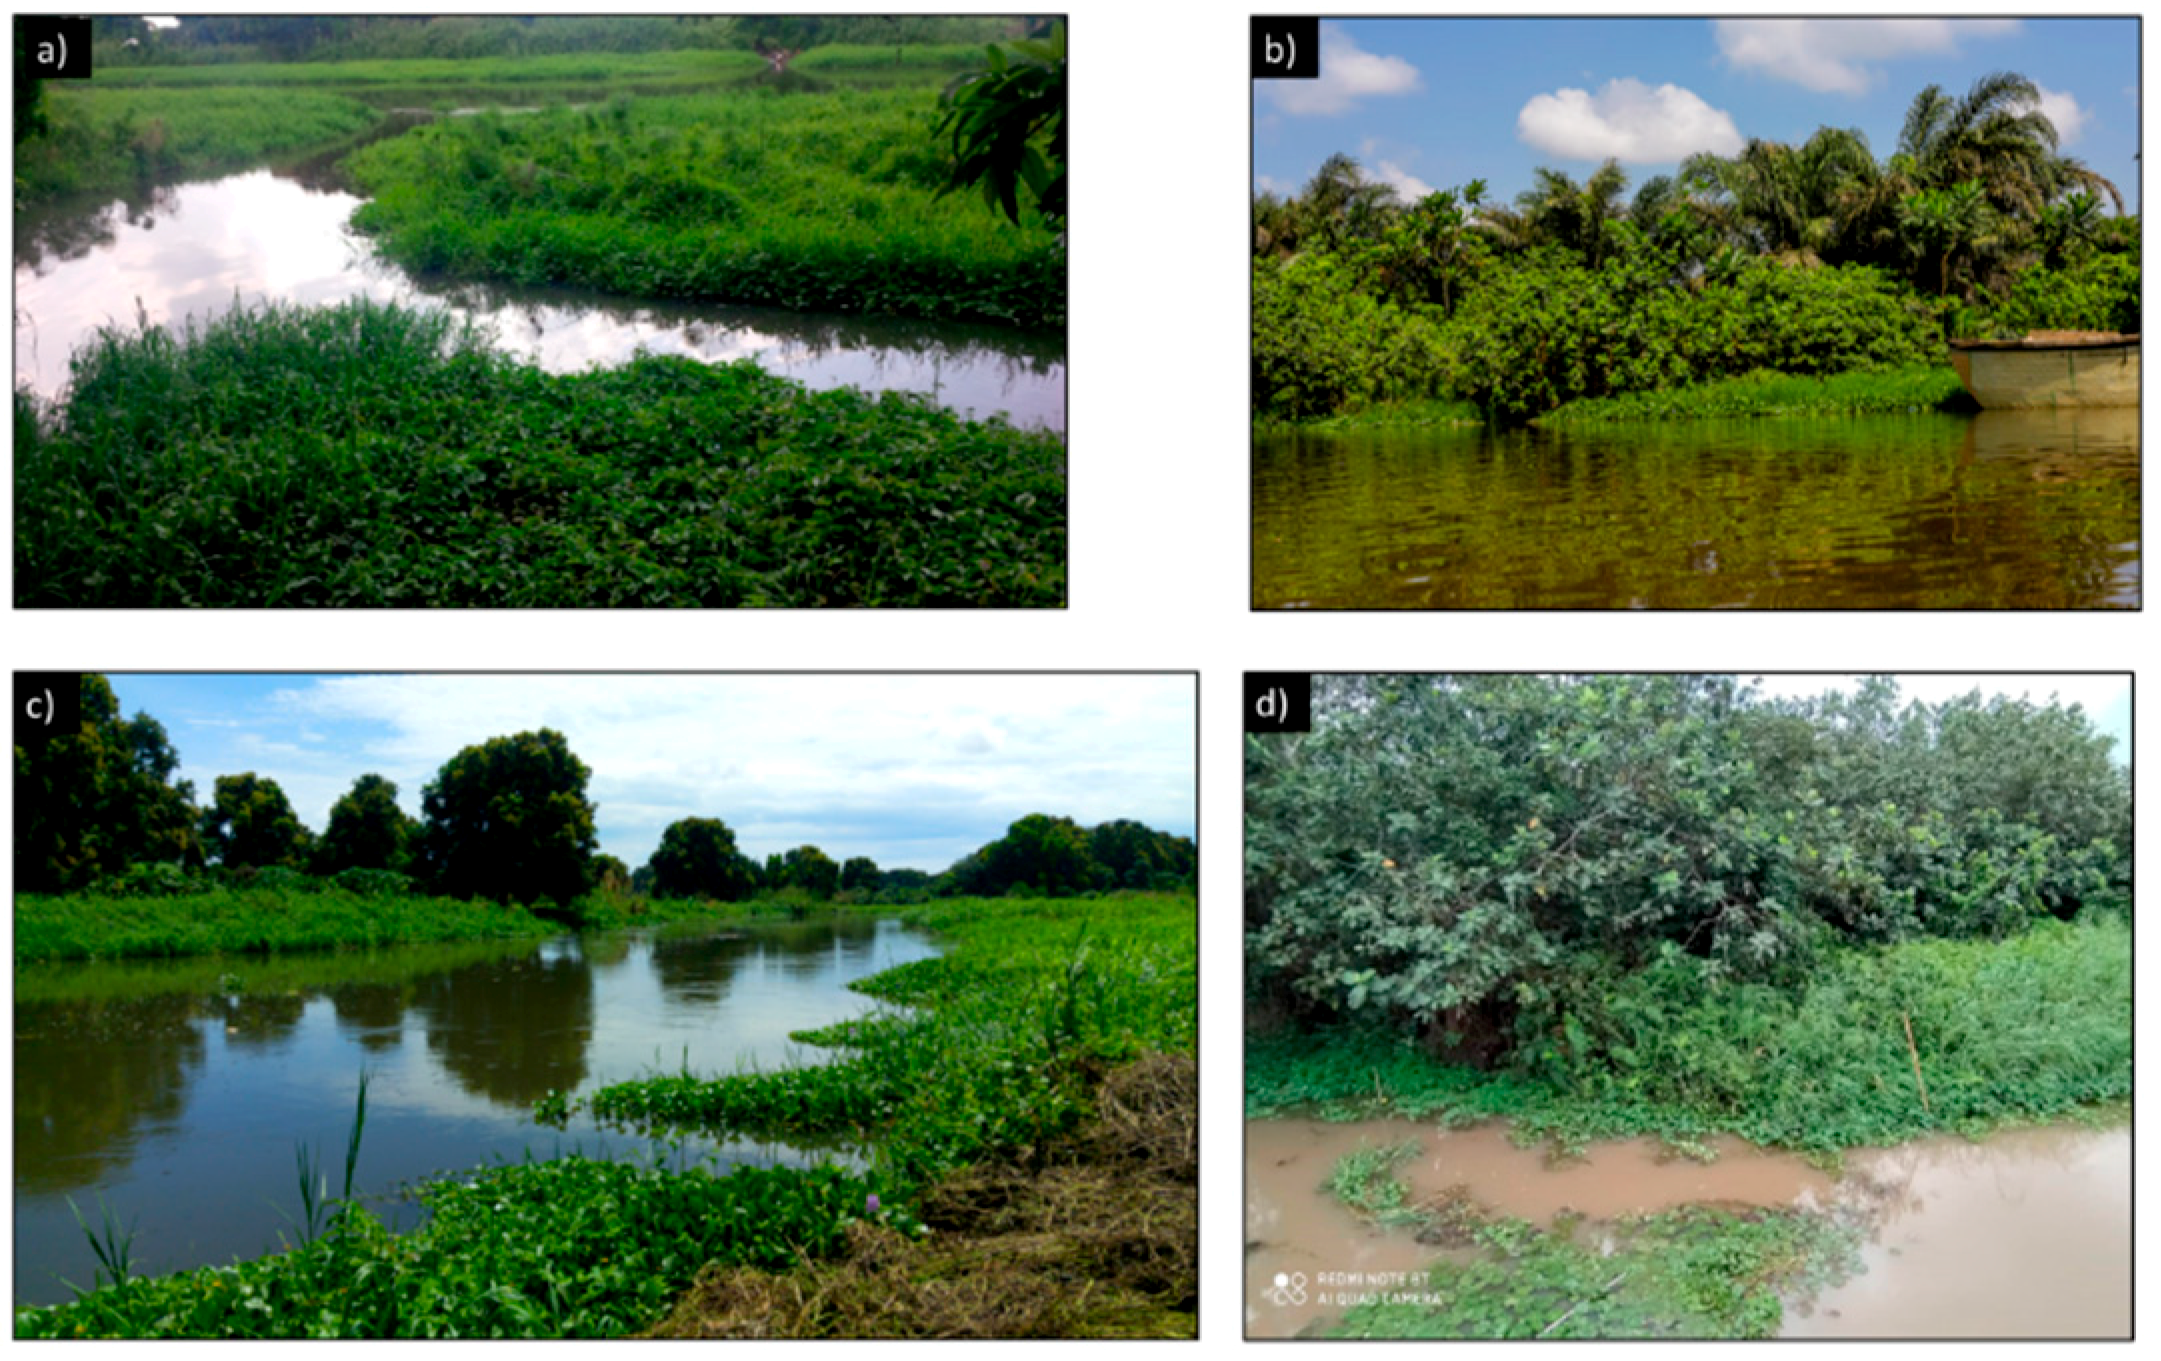
Overall, original field studies were conducted between 1996 and 2020, in some savanna sites as well as in rainforest sites, in both perennial waterbodies (rivers, streams, lakes) and in temporary ponds (Figure 3). Concerning free-ranging turtles, the methodology used for obtaining the food items were carefully described in [9, 15]. All captured turtles were sexed by examining their plastron and caudal shape, measured for curved carapace length, curved carapace width, plastron length and plastron width, and permanently individually marked by unique sequences of notches filed into the marginal scutes. Since the various morphometric measurements were significantly autocorrelated in all populations (p < 0.0001), we retained only the curved carapace length for our analyses involving turtle body size.
The dietary study is based on both the stomach analyses of a few dead specimens (generally offered in bush-meat markets or as roadkills), and stomach-flushing (as described in [16]) and fecal pellet analyses of living specimens (specimens were singly kept in plastic boxes until defecation occurred) [16]. Specimens captured into baited traps [15] were not included in the analyses, so we included in this study only those turtles that did not eat “artificially attractive” food during our studies. No specimen was killed or injured by the researchers. Each turtle was sexed by examining tail and plastron morphologies, measured for carapace length, and individually marked by scute notching and with a painted number on the carapace for identification and for excluding risks of data pseudoreplication. Food items or feces of each individual were deposited separately in test tubes (under alcohol) for laboratory dissection, and the reference number of each tube corresponded to the painted number on the turtle carapace. An example of the painted numbering on the turtle carapace is given in Figure 1c.
We included algae in our diet data analyses, although these may have been ingested secondarily by turtles, at least in some instances. Feces were examined under binocular microscope for the identification of any food items.
The diet composition of each population was described as the percentage of stomachs containing a given food item and not on the basis of the total number of items of each food category in the stomachs. This was necessary because it is often impossible to count the number of items from a feces analysis, and because the easiness of identification varied considerably by the various types of food item. Obviously, this methodology may have some shortcomings when comparing the data across studies. In fact, the stomach content corresponds to less processed material than in the feces, thus it could show different % when comparing the resources consumed. Therefore, we cannot exclude that the data obtained for the various dietary studies could be, in part, different also because of the different methodologies applied for gathering the food data, with the evidence on some consumed taxa that could have degraded and not be detected in the feces.

2.2. Statistical Analyses

We evaluated whether our sampling effort captured the true food items’ richness and diversity within each study population by building a rarefaction curve for food type discoveries at each site, using the software PAST 4.0.
Generalized Linear Models (GLM, see [17]) were used to test the relationship between body size and vegetation cover in the diet of four species of turtles (P. niger, P. castaneus, P. adansonii, P. nanus). In the models, three different vegetation classes (savannah, derived forest and forest) and three body size classes as dependent variables and the frequencies of different prey species as predictors were used. For assigning the vegetation classes to each study site, we considered the dominant vegetation type along the banks of the concerned waterbody where turtles were captured and studied. In the models, computing by an all-effects procedure, the identity link function and a normal distribution of error were used [18].
Parametric tests were used only after having verified the normality and homoscedasticity of the used variables by the Kolmogorov–Smirnov test. Intersexual differences in the frequency of consumption of food items were assessed by an observed versus expected χ2 test, with the p-value generated after 9999 Monte Carlo permutations. For analyses on the ontogenetic changes in diet composition, we divided the turtles into three body size categories: (i) <8 cm carapace length, (ii) 8.1–14 cm, and (iii) >14 cm. Since one of the study species (P. nanus) rarely exceeds 10 cm in carapace length and is one of the smallest turtle species in the world [1], for this latter species we had only size categories (i) and (ii) in our samples. In the text, the means are indicated as ± 1 Standard Deviation (S.D.), and alpha was set at 5%.

3. Results and Discussion

3.1. Diet Composition by Species

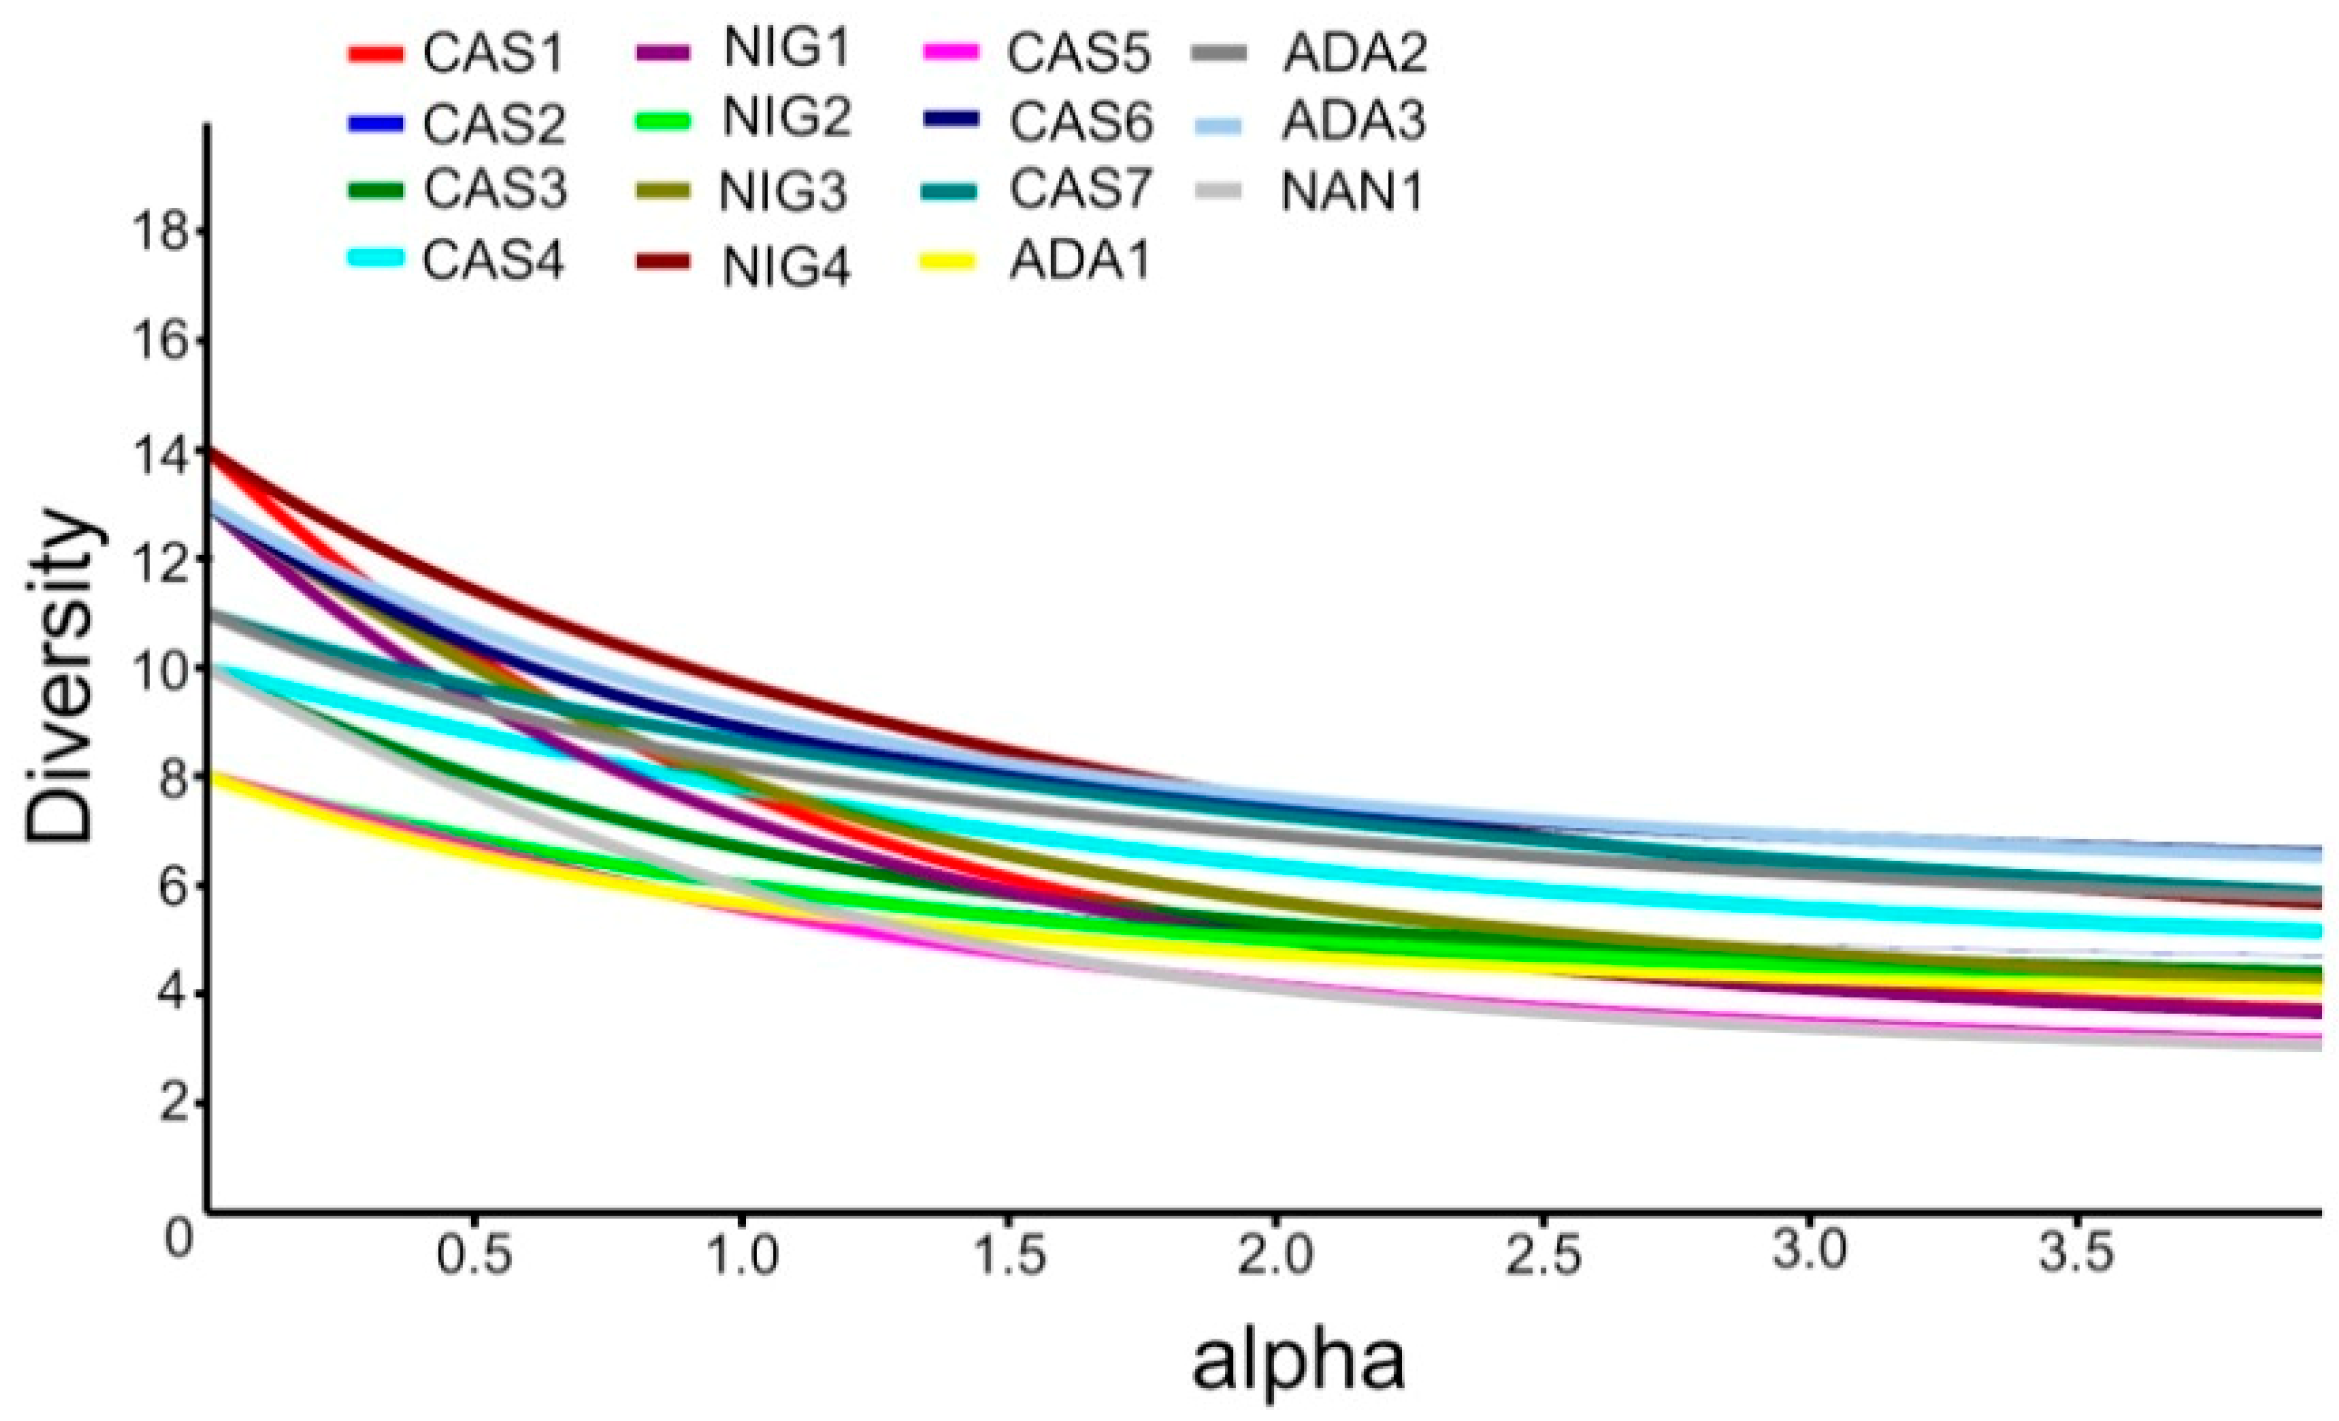
Overall, the diet data on 1260 Pelusios individuals were collected: 668 were P. castaneus, 310 were P. niger, 213 were P. adansonii, and 69 were P. nanus. A total of 705 turtle individuals were captured in Nigeria (395 P. castaneus, 310 P. niger), 56 in Benin (all P. castaneus), 217 in Togo (all P. castaneus), 213 in South Sudan (all P. adansonii) and 69 in Zambia (all P. nanus). The synopsis of the diet composition (% of stomachs containing a given food item) by species and by country/study area is given in Table 1. Saturation curves revealed that the diet composition of all the surveyed populations was adequately assessed (Figure 4), and the diversity profiles indicated that all the populations were relatively similar in terms of overall dietary diversity (Figure 5).
Pooling data from the various species, it resulted that the main bulk of the Pelusios spp. diet consisted of invertebrates (present in 75.2% of the examined specimens, n = 1260), followed by plant materials (found in 46.1% of the turtles) and by small vertebrates (22.8%) (Table 1). However, there were remarkable differences between species: Pelusios niger fed on larger sized prey types (including terrestrial vertebrates) than the other species, but this was an effect of its much larger body size. Indeed, terrestrial vertebrates were found in three out of four P. niger populations, and in up to 9.9% of the examined individuals within each population, whereas they were never observed in other Pelusios species, apart from one population of P. adansonii (2.6% of the examined individuals) (Table 1). On the other hand, P. nanus (the smallest species in the group) fed mainly upon invertebrates and was the only species that had no fish remains in stomachs or feces (Table 1). Fish remains were found in all the other 14 Pelusios populations, with frequencies of occurrence ranging from 7.4% (in a P. castaneus population from a forest-derived area) to 80.5% (in a P. niger population from a rainforest area in Nigeria) (Table 1).
Although not statistically significant at the species level (at least p > 0.05 at χ2 test), the various methods applied to gathering the food data also influenced the taxonomic dietary composition: for instance, tadpoles were detected by stomach flushing, whereas fish and arthropod remains were detected easily also with feces analyses. This pattern was consistent across species and populations.
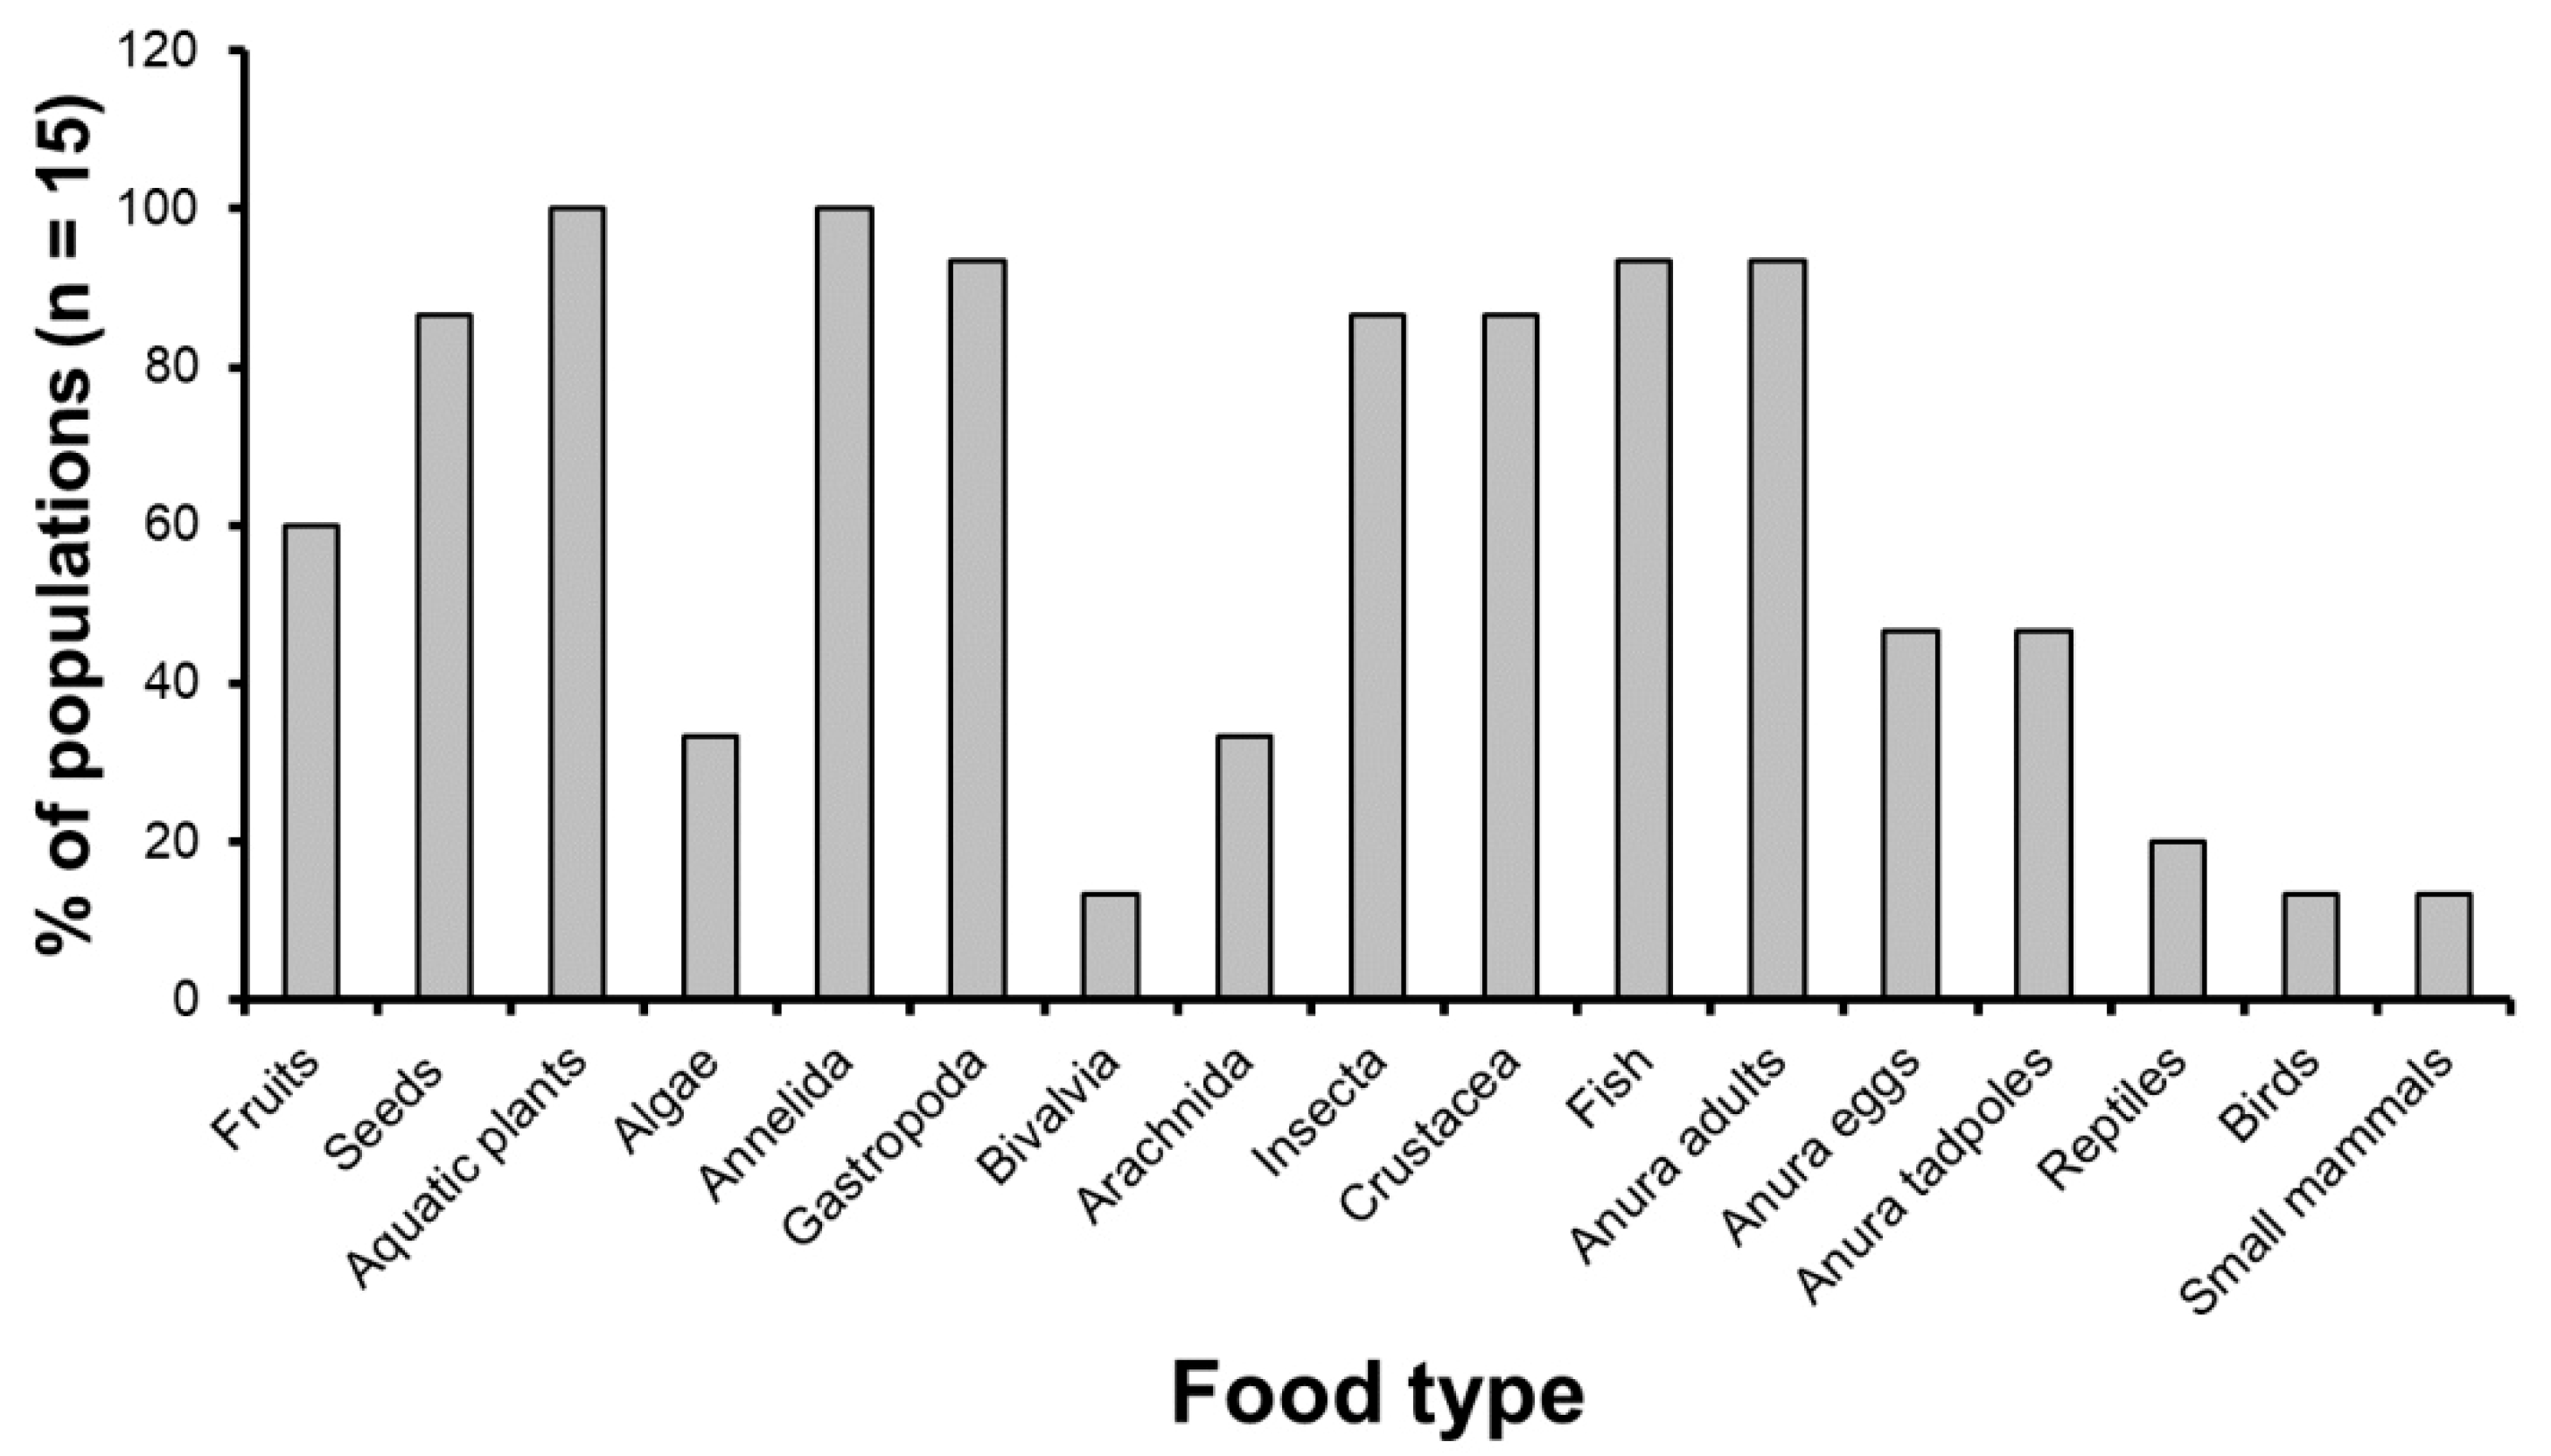
If we consider, as a metric of dietary preference by Pelusios spp., the % frequency of occurrence of a given prey type across populations (calculated based on the number of populations in which at least one individual ate a certain type of food compared to the total number of populations examined (n = 15)), it resulted that aquatic plants, Gastropoda, fish and frogs represented the main food categories for these turtles (Figure 6).
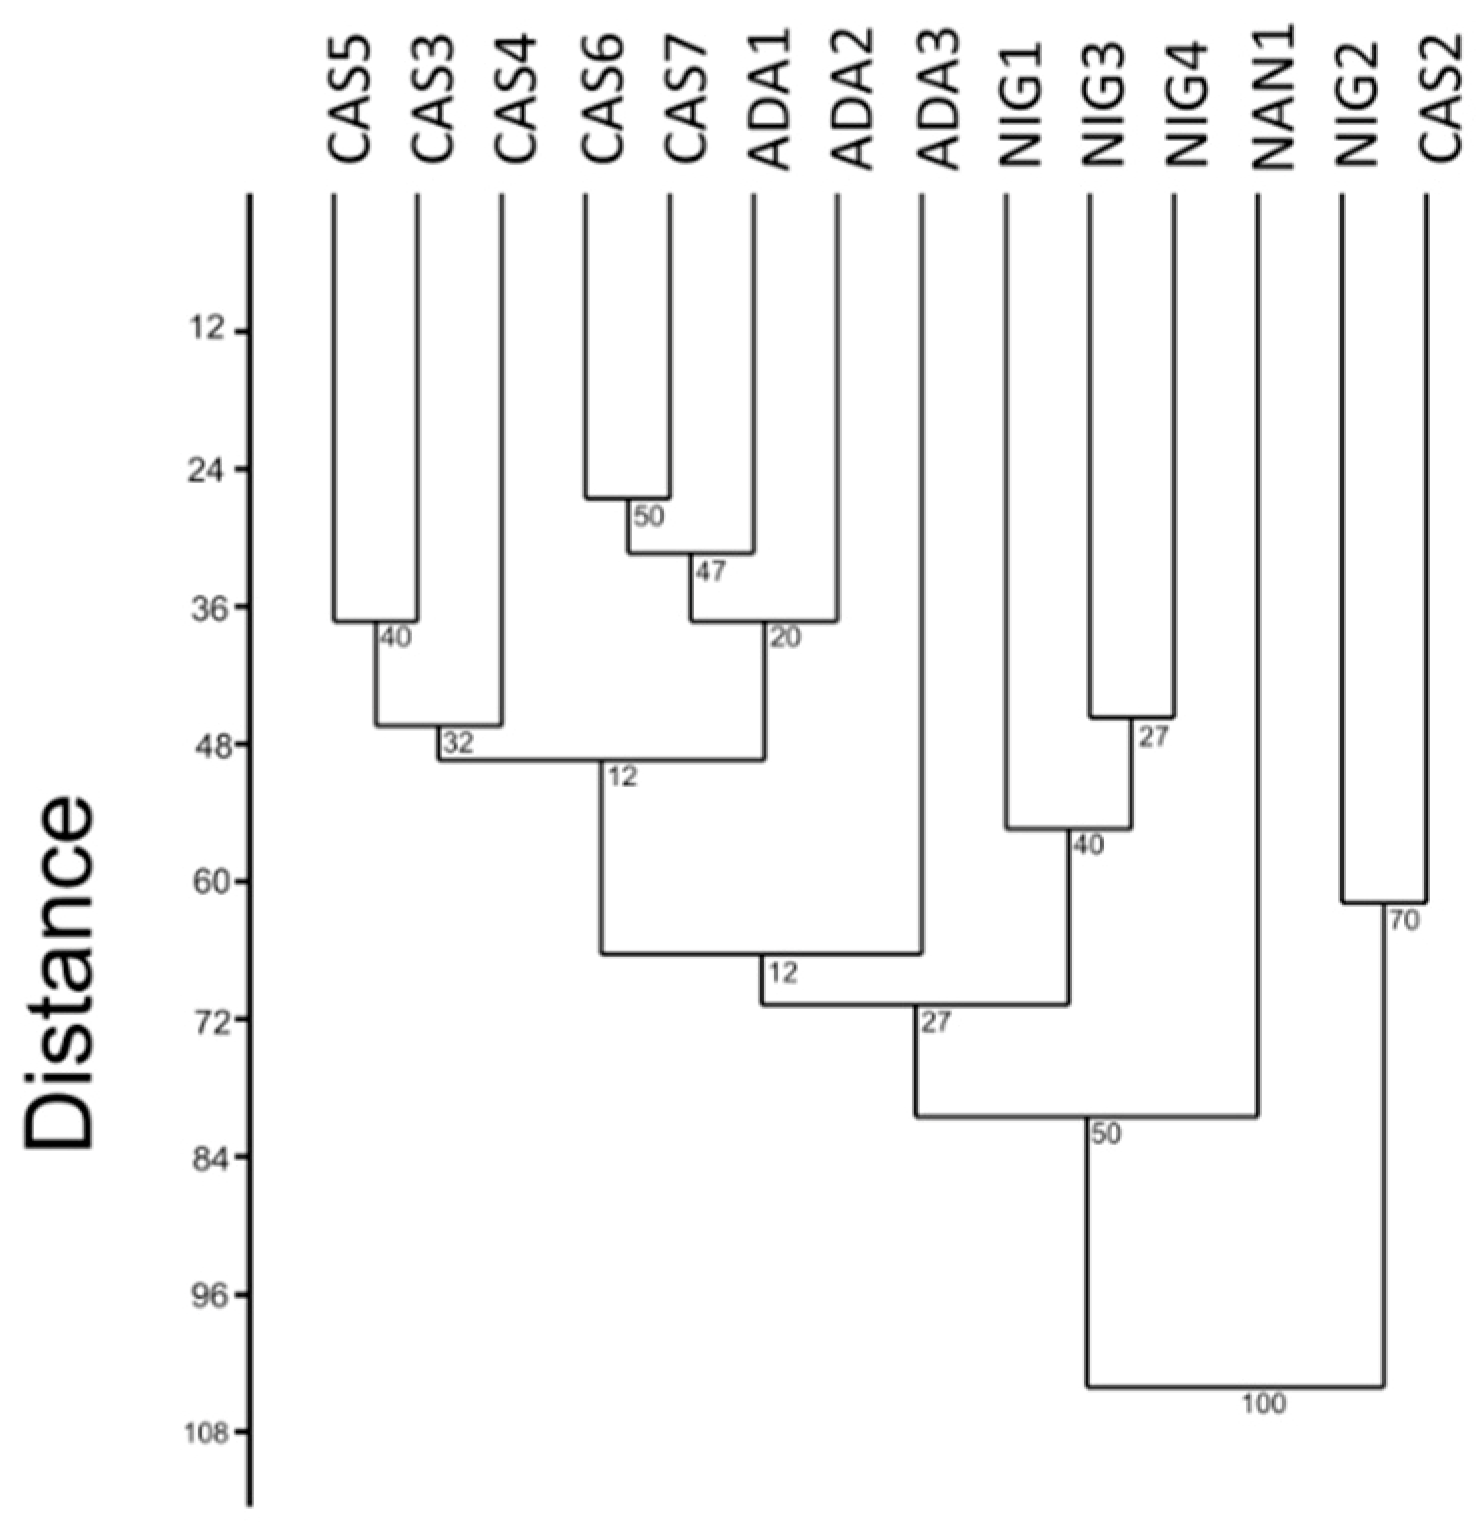
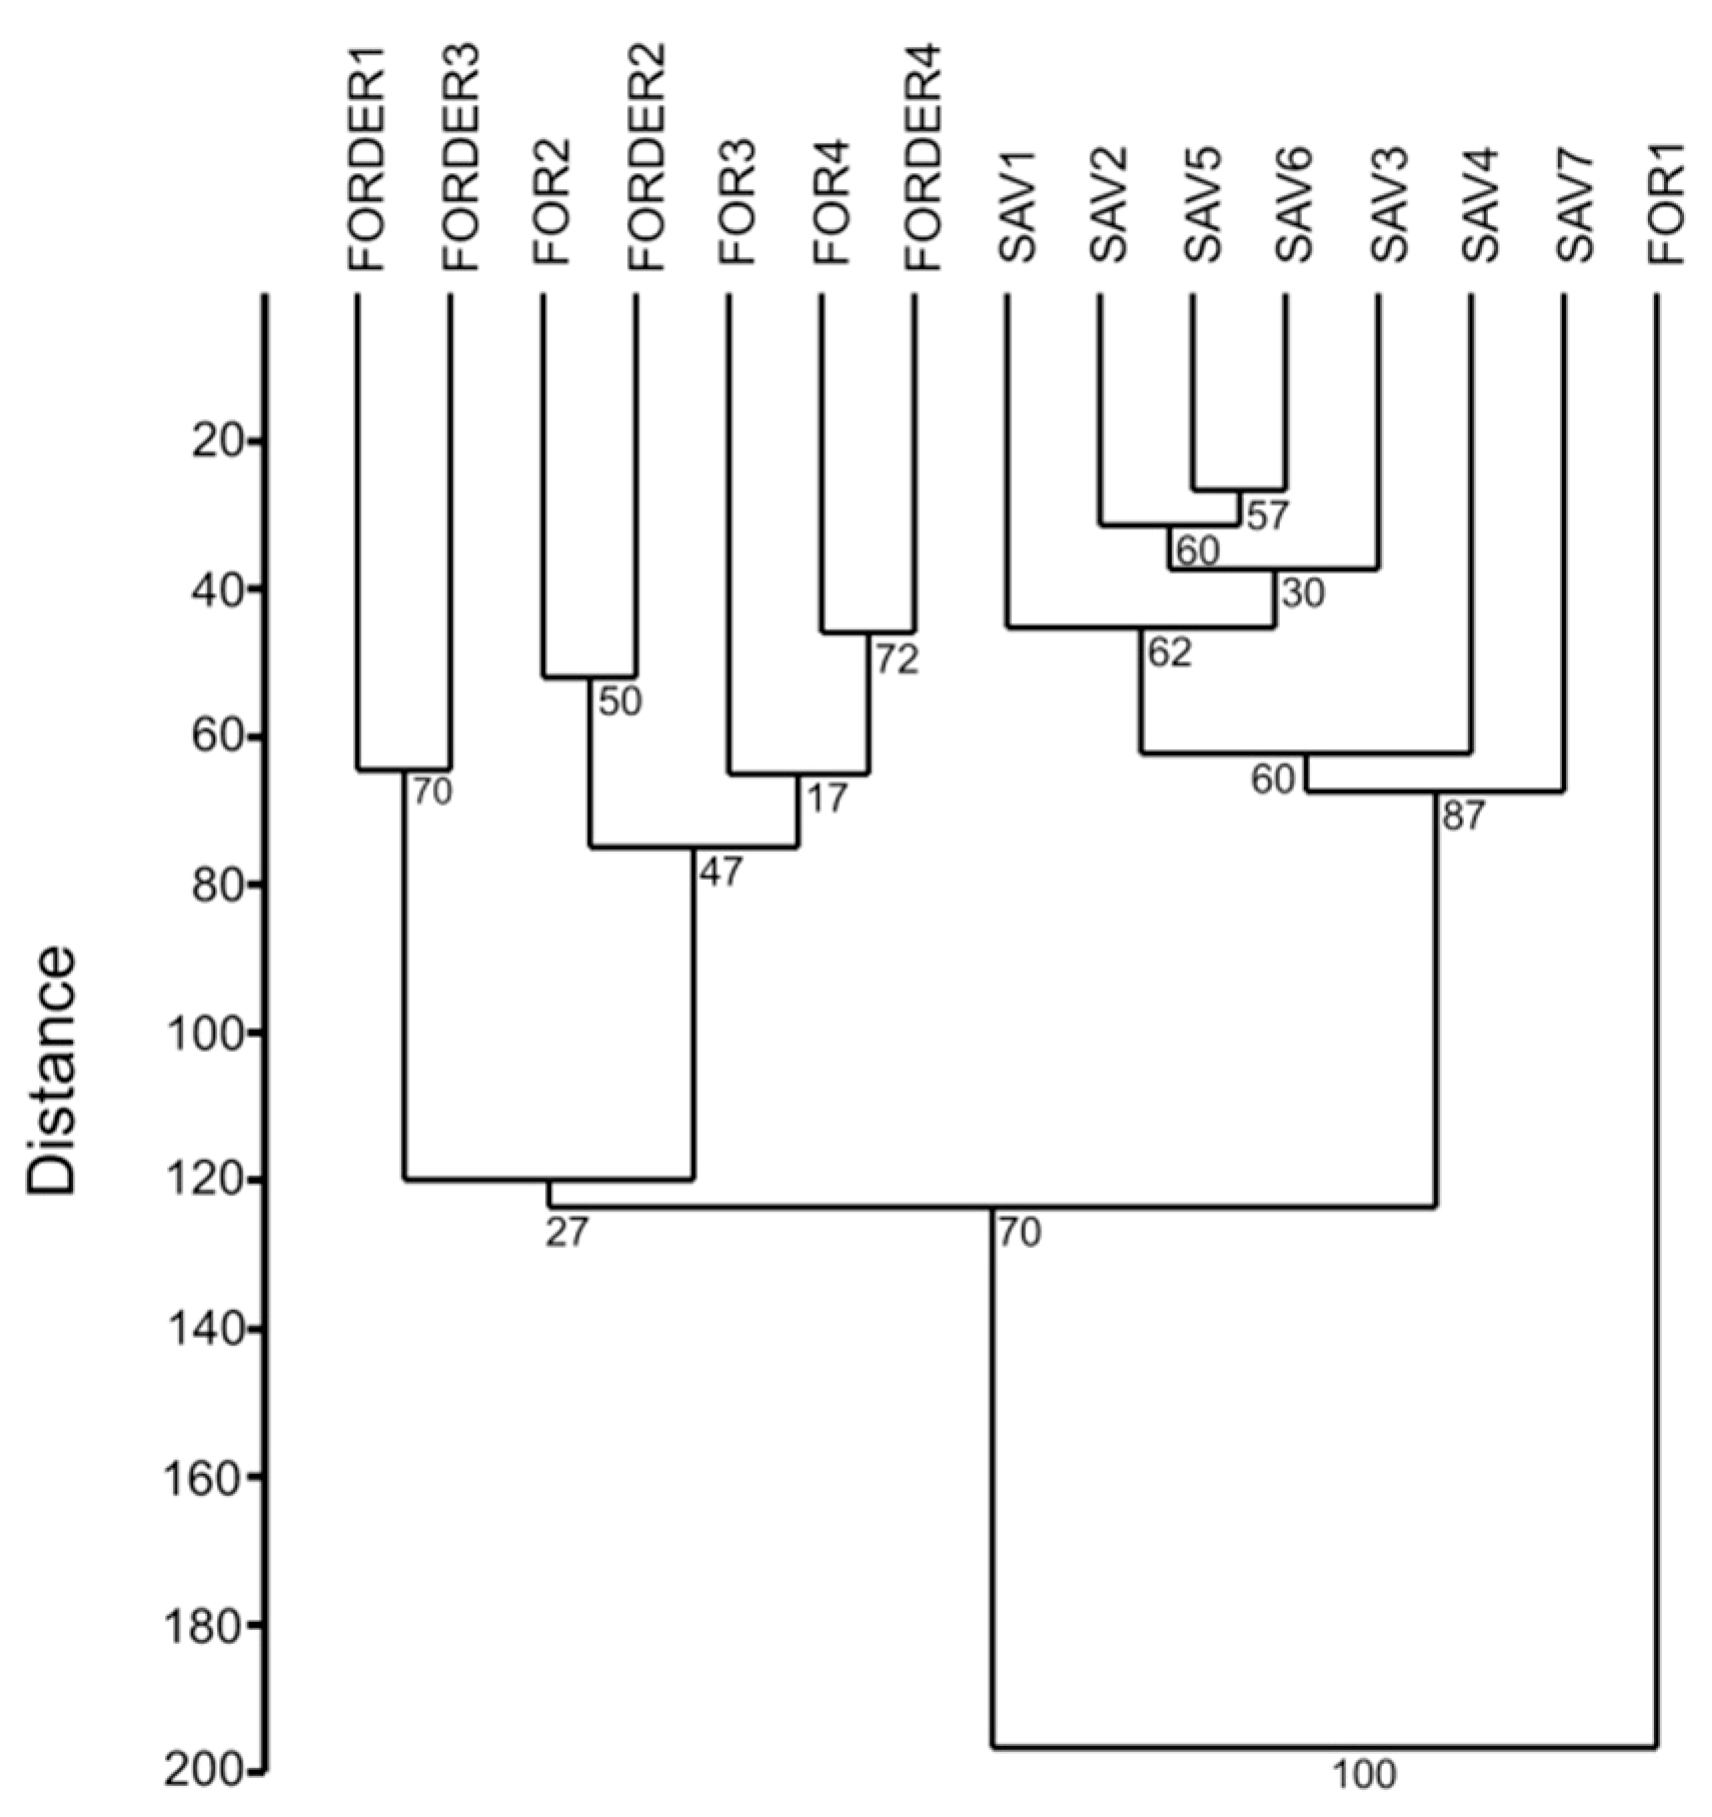
The various turtle populations did not show any clear species-specific pattern, but most P. castaneus populations clustered together, and two of out of three P. adansonii populations clustered together with P. castaneus, in a UPGMA tree-diagram with Euclidean distances (Figure 7). A UPGMA tree-diagram with Euclidean distances also showed that forest and forest-derived populations clustered together in terms of taxonomic diet composition, whereas savannah populations formed another well-defined group (Figure 8).

3.2. Effects of Vegetation Cover and Turtle Body Size

Our GLM results (Table 2) showed a negative effect of vegetation cover on Anura adults’ consumption by turtles, and showed that the frequencies of Anura tadpoles, fish, reptiles and birds on Pelusios diets increased with the increase in vegetation cover. The GLM model also showed positive effects of individual body size on algae, Bivalvia, reptiles, birds and small mammals’ consumption by turtles, and underlined that the predation on Arachnida decreased with the increase in turtle body size (Table 3).

3.3. Effects of Sex and Ontogenetic Changes in the Diet Composition

The summary of the food data collected by country and by sex, for the various Pelusios species, are presented in the Online Supplemental Tables S1–S5. We did not uncover any significant intersexual difference in the frequency of occurrence of the various prey items within the various Pelusios populations and by country (Table 4).
In terms of ontogenetic diet composition, the data for the various species are presented in the Online Supplementary Material Tables S6–S9). For these analyses, we pooled data from males and females because of no significant intersexual differences in prey composition (see Table 4 and text at above). Concerning P. castaneus, the contingency table analysis revealed that there were significant differences in the frequency of consumption of the various food types by turtle size category (Table 5), with small individuals consuming significantly more insects than the two other size categories, intermediate sized and large individuals more fish and adult anurans (Table S6). These two latter categories were similar in terms of taxonomic composition of the diet, but large individuals fed upon adult anurans more frequently than intermediate sized individuals (Table S6). In P. niger, there was also a statistically significant ontogenetic dietary change (Table 5), with adult anurans, birds and small mammals being preyed upon particularly by large sized individuals, fish by both large and intermediate sized individuals, and insects by small sized individuals (Table S7). Insects also dominated in the diet of small-sized P. adansonii, whereas insects and fish were the main prey category for the large sized individuals, and aquatic plants, insects and annelids in the diet of average sized individuals (Table S8). Overall, also in this species, the ontogenetic dietary divergence was statistically significant (Table 5). Conversely, there was no significant ontogenetic divergence in P. nanus (Table 5), with insects being the main food type for the two size categories considered in this study (Table S9).
Our comparative data showed therefore that, whereas intersexual dietary divergence is virtually non-existent among Pelusios populations, there were instead significant ontogenetic diet variations in three out of four species. Both patterns are likely linked to the fact that intersexual dietary divergence should be expected in species with remarkable sexual size dimorphism [19] or in species with “telescopic growth” from newborn to adult age [14,20,21], whereas in our studied Pelusios species (apart from P. niger with males being much larger than females) the two sexes were relatively similar in size. In this regard, it is also interesting to mention that, consistent with theory [19,20,21], the species with the smallest absolute body size (P. nanus) did not show any ontogenetic dietary shifts.
We can therefore hypothesize that, in Pleurodira species, the diet composition (1) should be similar between males and females in those species exhibiting a minor sexual size dimorphism but not in those where one sex may reach much larger size than the other, and (2) should be more ontogenetically variable in those species reaching larger adult sizes but still with small sized hatchlings. For instance, we expect a significant sexual size dimorphism in species such as Pelusios sinuatus, where the males may reach 35 cm and the females 55 cm carapace length and the size divergence between hatchlings and adults is remarkable [8,22,23].

4. Conclusions

In conclusion, our study revealed that all species of Pelusios analyzed here were substantially generalist in terms of their diet composition, although the effects of season (wet versus dry) and of other co-variates that are usually informative for field studies of turtles, including microhabitat characteristics and proximate meteorological conditions, were not assessed by our study. In addition, we showed that all species were omnivorous but with a clear preponderance of the prey items being of animal origin (amphibians, fish, arthropods and annelids), thus confirming earlier anecdotal accounts [8,10] and accounts from captivity (e.g., see <https://www.encyclo-fish.com/EN/paludarium/animals/pelusios-castaneus.php> (accessed on 10 April 2021). The relative head size and shape probably influenced the ingestion performance of the various species [24,25,26,27] and may possibly produce mechanisms of intraspecific niche partitioning [24,25]: indeed, when considering only the prey items that were found almost intact in the flushed stomachs, the species with the most massive head (P. niger) at a given body size was particularly able to ingest very large prey items compared to other species, and the larger-sized category of P. niger individuals also fed frequently upon larger size vertebrates, including even birds and small mammals. The ecological consequences (minimization of interspecific competition strength) of these differences in ingestion performance should be further analyzed by ad hoc studies.

Supplementary Materials

The following are available online at https://www.mdpi.com/article/10.3390/d13040165/s1, Table S1: Diet composition (% of stomachs containing a given food item) of male and female Pelusios species in Nigeria, Table S2: Diet composition (% of stomachs containing a given food item) of male and female Pelusios castaneus in Benin, Table S3: Diet composition (% of stomachs containing a given food item) of male and female Pelusios castaneus in Togo, Table S4: Diet composition (% of stomachs containing a given food item) of male and female Pelusios adansonii in South Sudan, Table S5: Diet composition (% of stomachs containing a given food item) of male and female Pelusios nanus in Zambia, Table S6: Diet composition (% of stomachs containing a given food item) of the three body size categories of Pelusios castaneus (all countries being pooled), Table S7: Diet composition (% of stomachs containing a given food item) of the three body size categories of Pelusios niger (Nigeria), Table S8: Diet composition (% of stomachs containing a given food item) of the three body size categories of Pelusios adansonii (South Sudan), Table S9: Diet composition (% of stomachs containing a given food item) of the three body size categories of Pelusios nanus (Zambia).

Author Contributions

Conceptualization, L.L.; methodology, L.L.; formal analysis, L.L., M.D.V.; investigation, G.S.D., J.S.B., S.N.A., N.A.; resources, L.L.; data curation, F.P., D.D.; writing—original draft preparation, L.L.; writing—review and editing, all authors; supervision, L.L., G.C.A., E.A.E.; funding acquisition, L.L., F.P.; All authors have read and agreed to the published version of the manuscript.

Funding

Chelonian Research Foundation, Mohamed Bin Zayed Species Conservation Fund, Conservation International and Turtle Conservation Fund (to L.L. and F.P.).

Institutional Review Board Statement

Not applicable.

Informed Consent Statement

Not applicable.

Data Availability Statement

Data are presented in the paper and in the Online Supplemental Materials; additional data are available from authors on request.

Acknowledgments

We thank J. E. Fa, G.H. Segniagbeto, E, M. Hema, and S. Gonedele Bi, for helpful collaboration during the various research phases of this study. Two anonymous reviewers are thanked for their helpful comments on the submitted draft.

Conflicts of Interest

The authors declare no conflict of interest.

References

  1. Aresco, M.J.; Travis, J.; MacRae, P.S. Trophic interactions of turtles in a north Florida lake food web: Prevalence of omnivory. Copeia 2015, 103, 343–356. [Google Scholar] [CrossRef]
  2. Mccoy, C.J.; Flores-Villela, O.A.; Vogt, R.C.; Pappas, M.; McCoy, J.K. Ecology of riverine turtle communities in the southern United States: Food resource use and trophic niche dimensions. Chel. Cons. Biol. 2020, 19, 197–208. [Google Scholar]
  3. Lara, N.R.F.; Marques, T.S.; Montelo, K.M.; de Ataides, A.G.; Verdade, L.M.; Malvásio, A.; de Camargo, P.B. A trophic study of the sympatric Amazonian freshwater turtles Podocnemis unifilis and Podocnemis expansa (Testudines, Podocnemidae) using carbon and nitrogen stable isotope analyses. Can. J. Zool. 2012, 90, 1394–1401. [Google Scholar] [CrossRef]
  4. Balzani, P.; Vizzini, S.; Santini, G.; Masoni, A.; Ciofi, C.; Ricevuto, E.; Chelazzi, G. Stable isotope analysis of trophic niche in two co-occurring native and invasive terrapins, Emys orbicularis and Trachemys scripta elegans. Biol. Inv. 2016, 18, 3611–3621. [Google Scholar] [CrossRef]
  5. Ducotterd, C.; Crovadore, J.; Lefort, F.; Guisan, A.; Ursenbacher, S.; Rubin, J.F. The feeding behaviour of the European pond turtle (Emys orbicularis, L. 1758) is not a threat for other endangered species. Glob. Ecol. Conserv. 2020, 23, e01133. [Google Scholar] [CrossRef]
  6. Sung, Y.H.; Hau, B.C.; Karraker, N.E. Diet of the endangered big-headed turtle Platysternon megacephalum. Peer J. 2016, 4, e2784. [Google Scholar] [CrossRef] [Green Version]
  7. Luiselli, L. Food habits of the pelomedusid turtle Pelusios castaneus castaneus in southeastern Nigeria. Chel. Cons. Biol. 1998, 3, 106–107. [Google Scholar]
  8. Branch, B. Tortoises, Terrapins and Turtles of Africa; New Holland Publishing: Cape Town, South Africa, 2008. [Google Scholar]
  9. Luiselli, L.; Akani, G.C.; Politano, E.; Odegbune, E.; Bello, O. Dietary shifts of sympatric freshwater turtles in pristine and oil-polluted habitats of the Niger Delta, southern Nigeria. Herpetol. J. 2004, 14, 57–64. [Google Scholar]
  10. Ernst, C.H.; Altenburg, R.G.; Barbour, R.W. Turtles of the World; Smithsonian Press: Washington, DC, USA, 1998. [Google Scholar]
  11. McCauley, S.J.; Bjorndal, K.A. Response to dietary dilution in an omnivorous freshwater turtle: Implications for ontogenetic dietary shifts. Physiol. Biochem. Zool. 1999, 72, 101–108. [Google Scholar] [CrossRef]
  12. Bouchard, S.S.; Bjorndal, K.A. Ontogenetic diet shifts and digestive constraints in the omnivorous freshwater turtle Trachemys scripta. Physiol. Biochem. Zool. 2006, 79, 150–158. [Google Scholar] [CrossRef]
  13. Claude, J.; Pritchard, P.H.; Tong, H.; Paradis, E.; Auffray, J.-C. Ecological Correlates and Evolutionary Divergence in the Skull of Turtles: A Geometric Morphometric Assessment. Syst. Biol. 2004, 53, 933–948. [Google Scholar] [CrossRef] [Green Version]
  14. Burke, R.L.; Luiselli, L. Ontogenetic niche shifts: Modern reptiles change diets with age too. Science 2021, 371, 941–944. [Google Scholar]
  15. Luiselli, L.; Akani, G.C.; Ajong, S.N.; George, A.; Di Vittorio, M.; Eniang, E.A.; Dendi, D.; Hema, E.M.; Petrozzi, F.; Fa, J.E. Predicting the structure of turtle assemblages along a megatransect in West Africa. Biol. J. Linn. Soc. 2020, 130, 296–309. [Google Scholar] [CrossRef]
  16. Luiselli, L.; Amori, G. Diet. In Reptile Ecology and Conservation: A Handbook of Techniques; Dodd, C.K., Jr., Ed.; Oxford University Press: Oxford, UK, 2016; pp. 97–109. [Google Scholar]
  17. Hosmer, D.W.; Lemeshow, S. Applied Logistic Regression Analysis, 2nd ed.; John Wiley and Sons: New York, NY, USA, 2000. [Google Scholar]
  18. McCullagh, P.; Nelder, J.A. Generalized Linear Models; Chapman and Hall/CRC: London, UK, 1989. [Google Scholar]
  19. Shine, R. Intersexual dietary divergence and the evolution of sexual dimorphism in snakes. Am. Nat. 1991, 138, 103–122. [Google Scholar] [CrossRef]
  20. Houston, D.; Shine, R. Sexual dimorphism and niche divergence: Feeding habits of the Arafura filesnake. J. Anim. Ecol. 1993, 62, 737–748. [Google Scholar] [CrossRef]
  21. Shine, R.; Harlow, P.S.; Keogh, J.S. The influence of sex and body size on food habits of a giant tropical snake, Python reticulatus. Funct. Ecol. 1998, 12, 248–258. [Google Scholar] [CrossRef] [Green Version]
  22. Gerlach, J.; Rhodin, A.G.J.; Pritchard, P.C.H.; van Dijk, P.P.; Saumure, R.A.; Buhlmann, K.A.; Iverson, J.B. Pelusios subniger parietalis Bour 1983–Seychelles black mud turtle. In Conservation Biology of Freshwater Turtles and Tortoises: A Compilation Project of the IUCN/SSC Tortoise and Freshwater Turtle Specialist Group; Chelonian Research Foundation: Lunenburg, MA, USA, 2008. [Google Scholar]
  23. Ceballos, C.P.; Adams, D.C.; Iverson, J.B.; Valenzuela, N. Phylogenetic patterns of sexual size dimorphism in turtles and their implications for Rensch’s Rule. Evol. Biol. 2013, 40, 194–208. [Google Scholar] [CrossRef]
  24. Tucker, A.D.; Fitzsimmons, N.N.; Gibbons, J.W. Resource partitioning by the estuarine turtle Malaclemys terrapin: Trophic, spatial, and temporal foraging constraints. Herpetologica 1995, 51, 167–181. [Google Scholar]
  25. Bulté, G.; Gravel, M.A.; Blouin-Demers, G. Intersexual niche divergence in northern map turtles (Graptemys geographica): The roles of diet and habitat. Can. J. Zool. 2008, 86, 1235–1243. [Google Scholar] [CrossRef] [Green Version]
  26. Herrel, A.; O’Reilly, J.C. Ontogenetic scaling of bite force in lizards and turtles. Physiol. Bioch. Zool. 2006, 79, 31–42. [Google Scholar] [CrossRef] [Green Version]
  27. Bulté, G.; Irschick, D.J.; Blouin-Demers, G. The reproductive role hypothesis explains trophic morphology dimorphism in the northern map turtle. Funct. Ecol. 2008, 22, 824–830. [Google Scholar] [CrossRef]
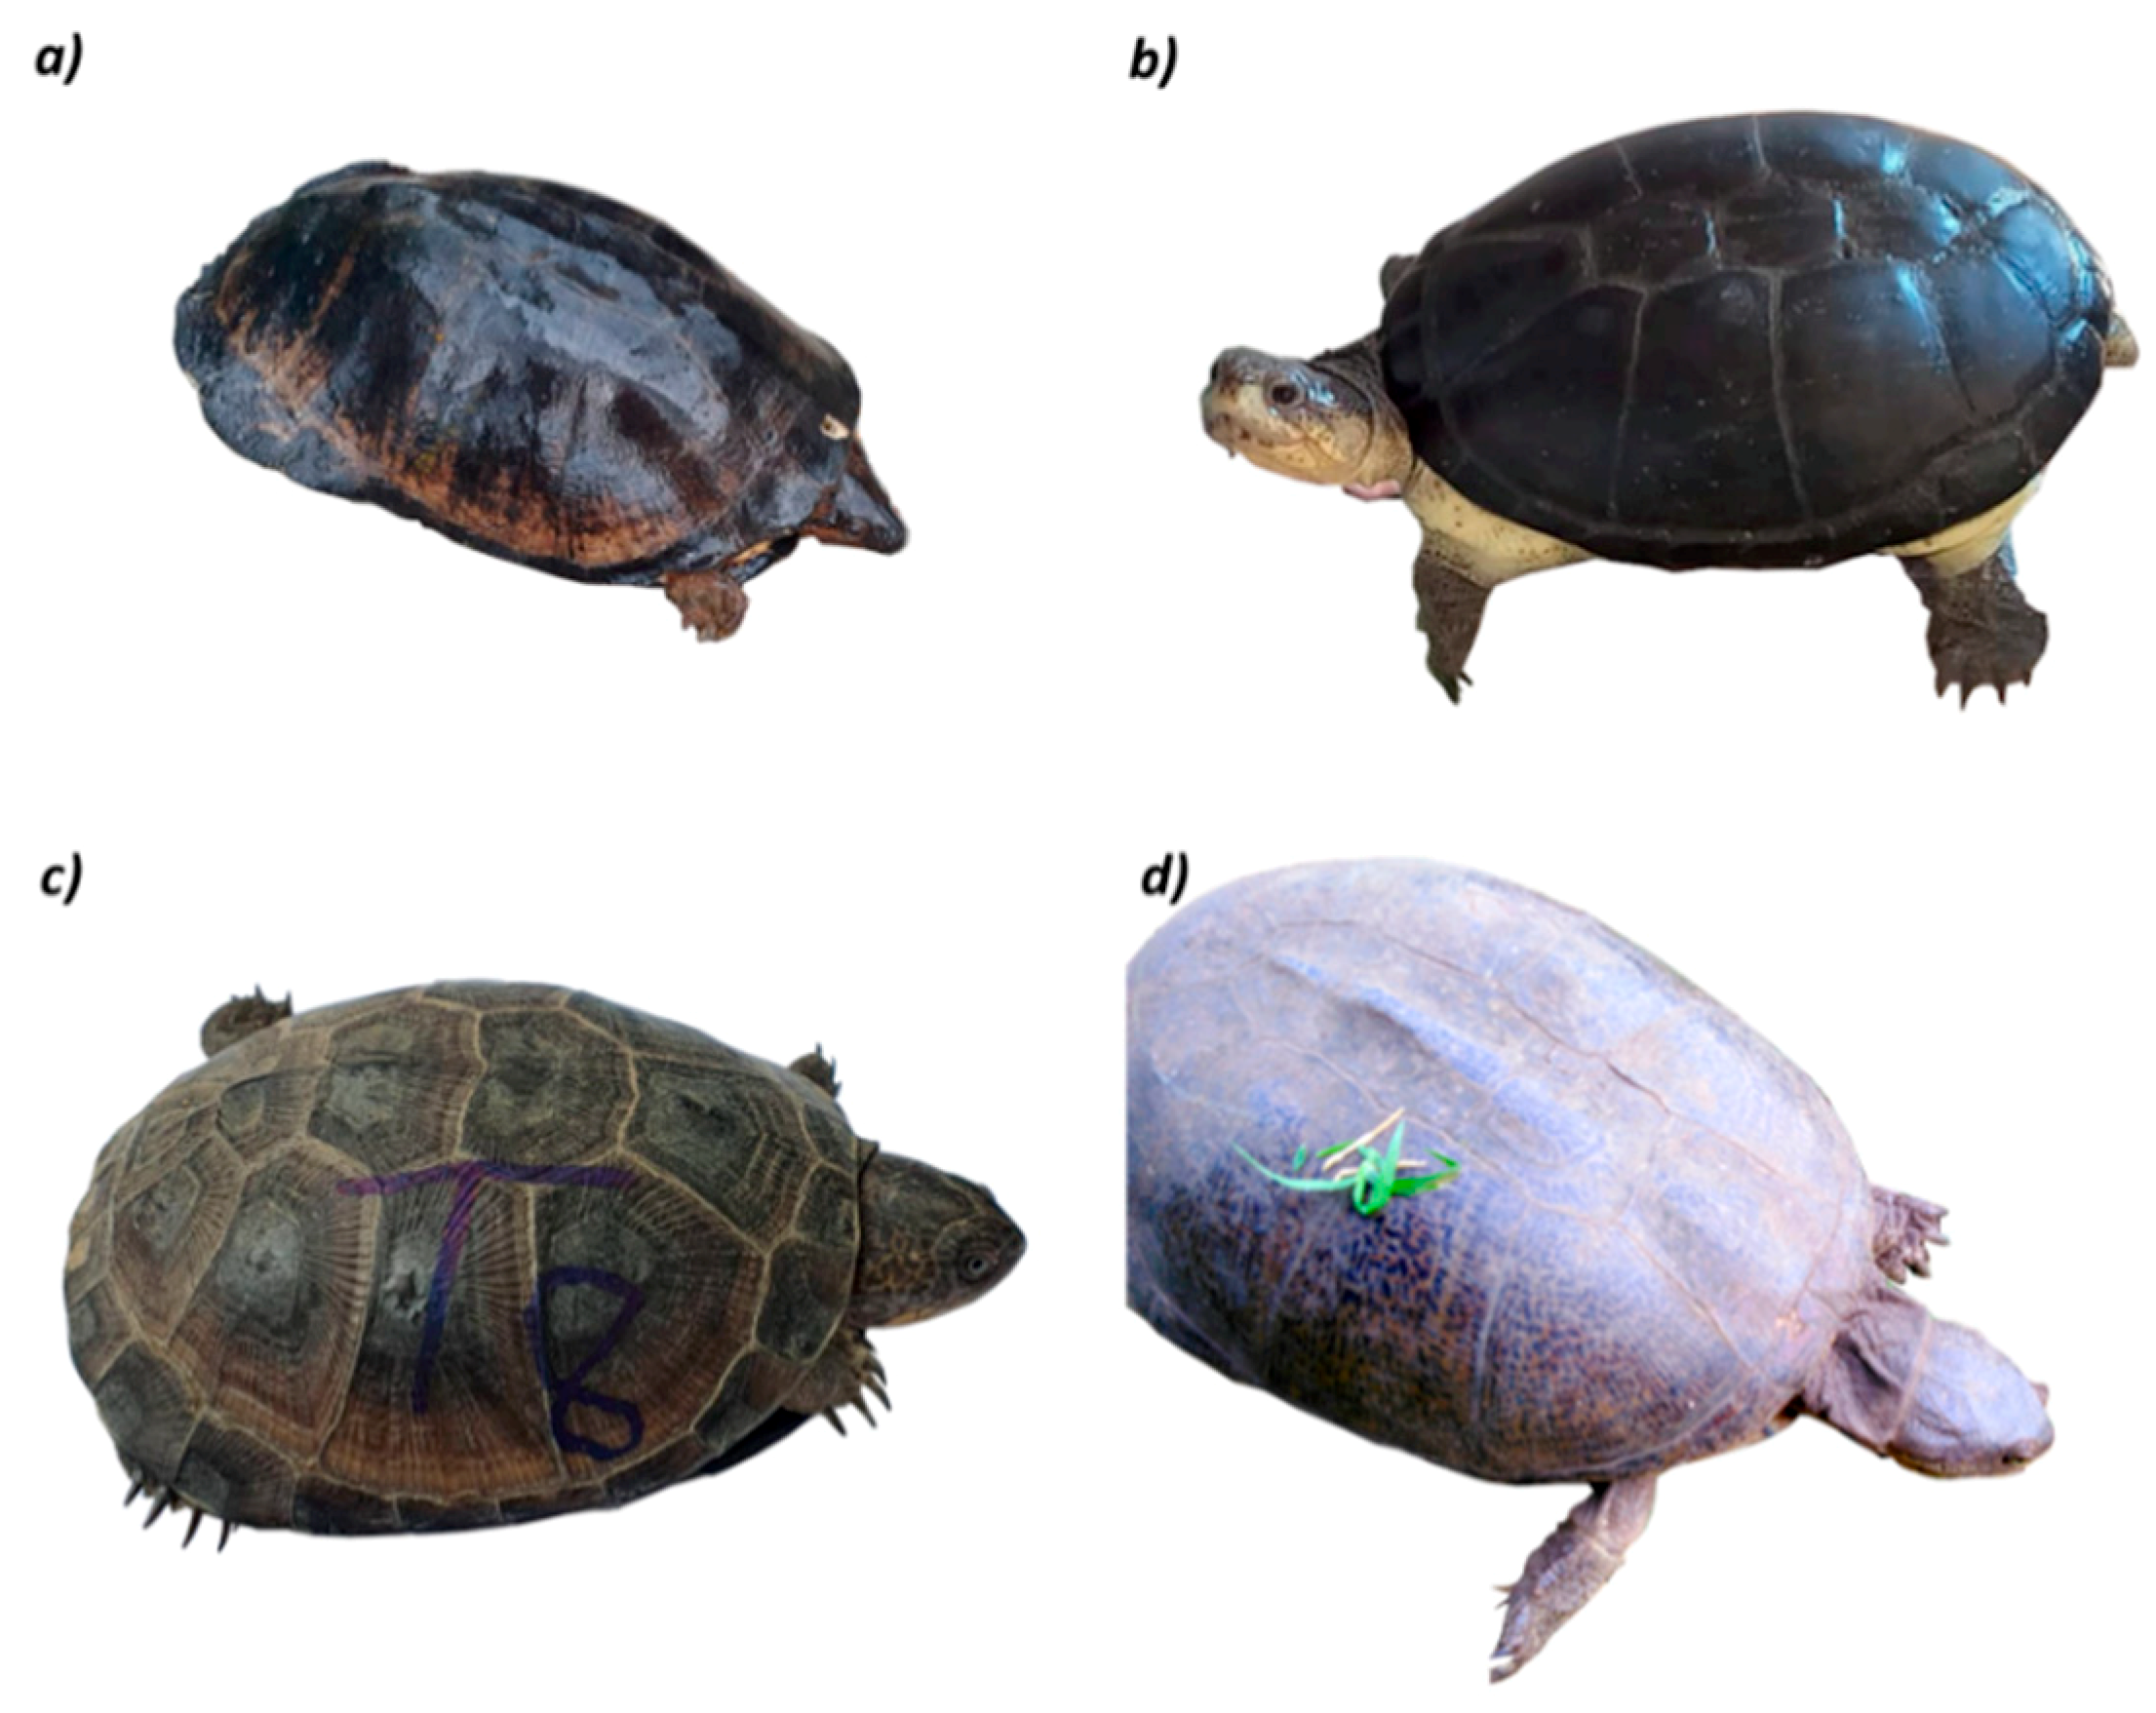
Figure 1. The four study species: (a) Pelusios niger from Nigeria; (b) Pelusios nanus from Zambia; (c) Pelusios castaneus from Nigeria; (d) Pelusios adansonii from South Sudan.
Diversity 13 00165 g001
Figure 2. Map of the countries involved in the present study, showing the location of the sites where the diets of Pelusios spp. were studied. In Togo and Benin, only Pelusios castaneus were analyzed for this study; in Nigeria both P. castaneus and P. niger, in Zambia only P. nanus and in South Sudan only P. adansonii. Land use categories are also shown on the maps. Localities for both the literature and original data are pooled in this map.
Diversity 13 00165 g002
Figure 3. Typical habitats of Pelusios spp. in tropical Africa. (a,c) habitat types of Pelusios adansonii along the White Nile river course in South Sudan; (b) habitat type of Pelusios niger and Pelusios castaneus in Southern Nigeria; (d) habitat of Pelusios nanus in Zambia.
Diversity 13 00165 g003
Figure 4. Saturation curves for the diet of the various populations of Pelusios spp. analyzed in this paper. NIG = P. niger; CAS = P. castaneus; ADA = P. adansonii; NAN = P. nanus. The numbers represent distinct populations within each species. All NIG came from Nigeria; CAS 1–4 from Nigeria, CAS5 from Benin, CAS 6–7 from Togo; ADA 1–3 from South Sudan; and NAN1 from Zambia.
Diversity 13 00165 g004
Figure 5. Diversity profiles for the diet of the various populations of Pelusios spp. analyzed in this paper. NIG = P. niger; CAS = P. castaneus; ADA = P. adansonii; NAN = P. nanus. The numbers represent distinct populations within each species. All NIG came from Nigeria; CAS 1–4 from Nigeria, CAS5 from Benin, CAS 6–7 from Togo; ADA 1–3 from South Sudan; and NAN1 from Zambia.
Diversity 13 00165 g005
Figure 6. Percentage of Pelusios spp. populations that included a given food type in the diet. In this graphic, the percentages are calculated based on the number of populations in which at least one individual in a given population ate a certain type of food. Total number of populations examined: n = 15.
Diversity 13 00165 g006
Figure 7. UPGMA, with Euclidean distances and 40 bootstraps as branching measurement, showing the dissimilarities among the various Pelusios populations as for their taxonomic composition of the diet is concerned. NIG = P. niger; CAS = P. castaneus; ADA = P. adansonii; NAN = P. nanus. The numbers represent distinct populations within each species. All NIG came from Nigeria; CAS 1–4 from Nigeria, CAS5 from Benin, CAS 6–7 from Togo; ADA 1–3 from South Sudan; and NAN1 from Zambia.
Diversity 13 00165 g007
Figure 8. UPGMA, with Euclidean distances and 40 bootstraps as branching measurement, showing the dissimilarities among the main habitats of the various study areas where Pelusios populations were studied for determining their taxonomic composition of the diet. FOR = forest; FORDER = forest-derived; SAV = savannah. FOR 1–4 and FORDER 1–4 were from Nigeria; SAV1 from Benin, SAV 2–3 from Togo, SAV 4–6 from South Sudan and SAV7 from Zambia.
Diversity 13 00165 g008
Table 1. Diet composition (% of stomachs containing a given food item) of Pelusios species across countries. N = number of individuals examined; for-derived = forest-derived savannah/plantation mosaic.
NigeriaNigeriaNigeriaNigeriaBeninTogoTogoNigeriaNigeriaNigeriaNigeriaSouth SudanSouth SudanSouth SudanZambia
ForestFor-DerivedForestFor-DerivedSavannahSavannahSavannahForestFor-DerivedForestFor-DerivedSavannahSavannahForestSavannah
castaneuscastaneuscastaneuscastaneuscastaneuscastaneuscastaneusnigernigernigernigeradansoniiadansoniiadansoniinanus
N2172165925613582113397781133413969
Fruits5.1195702.2207.17.70002.445.130
Seeds 3.776.210.315.95.3715.5613.43.330.85.2007.3210.267.25
Aquatic plants7.466.752.838.555.325.1920.77.933.327.316.030.843.938.58.7
Algae001.46.602.960.0003.913.600.000.000.00
Annelida3.742.98.34.912.512.5919.510.661.56.57.412.819.546.217.4
Gastropoda5.157.129.236.104.4415.93.569.26.525.91.519.510.34.3
Bivalvia0.900000.000.0000.01.20.00.00.00.0
Arachnida2.800000.740.02.600.00.00.00.02.630.4
Insecta6012.510.612.531.8543.90.9027.330.930.851.243.668.1
Crustacea18.9011.1910.718.892.423.9042.913.64.514.653.82.9
Fish52.514.345.87.42530.3714.669.912.880.558.015.831.720.50.0
Anura adults3.74.85.6185.3724.4425.612.410.220.823.57.514.615.40.0
Anura eggs9.200004.448.51500.07.40.02.40.04.3
Anura tadpoles22.69.50000.006.129.210.20.00.00.00.010.310.1
Reptiles0000000.0003.91.20.00.02.60.0
Birds0000000.0009.16.20.00.00.00.0
Small mammals0000000.0007.89.90.00.00.00.0
Indeterminate0.40005.362.963.70.903.96.23.012.210.35.8
Table 2. Output of the General Linear Model (GLM) on the relationship between vegetation cover and diet in four species of Pelusios from tropical Africa. Only significant variables are presented in this table.
EstimateSt. ErrorWaldp
Anura tadpoles0.0351970.00996112.484260.000410
Anura adults−0.130810.01949445.027880.000000
Fish0.0096620.00230817.520010.000028
Reptiles0.2746460.05655823.580690.000001
Birds0.2109850.02517970.212840.000000
Table 3. Output of the GLM on the relationship between turtle body size and diet in four species of Pelusios from tropical Africa. Only significant variables are presented in this table.
EstimateSt. ErrorWaldp
Algae0.1120200.009507138.83750.000000
Bivalvia1.5141300.23115742.905360.000000
Arachnida−0.0605540.01510216.07840.000061
Reptiles0.3898120.00006238,937,6000.000000
Birds0.0982720.0327579.000000.002700
Small mammals0.0848960.0282999.000000.002700
Table 4. Summary of the statistical results on the intersexual differences in taxonomic dietary composition within Pelusios populations from the various countries of Africa that were analyzed for this review. χ2 test is calculated on the frequencies of occurrence of each food type category by sex, within each population studied in a given country.
SpeciesCountryNo. MalesNo. Femalesχ2dfp
P. castaneusNigeria21117819.3130.113
P. castaneusBenin27295.670.590
P. castaneusTogo1031146.4130.929
P. nigerNigeria16214822.2160.136
P. adansoniiSouth Sudan1229115.8130.262
P. nanusZambia30398.490.494
Table 5. Summary of the statistical results on the ontogenetic body-size-related differences in the taxonomical dietary composition within Pelusios populations from the various countries of Africa that were analyzed for this review. χ2 test is calculated on the frequencies of occurrence of each food type category by turtle size category, within each population studied.
Species<8 cm (N)8–14 cm (N)>14 cm (N)χ2dfp
P. castaneus158389121426.328<0.0001
P. niger99101110162.534<0.0001
P. adansonii581223394.326<0.0001
P. nanus3138not available11.2590.259
Publisher’s Note: MDPI stays neutral with regard to jurisdictional claims in published maps and institutional affiliations.