Article

Effects of Pure and Mixed Pine and Oak Forest Stands on Carabid Beetles

Department of Forest Sciences, Faculty of Environmental Sciences, Institute of Silviculture and Forest Protection, TU Dresden, 01737 Tharandt, Germany
*
Author to whom correspondence should be addressed.
Diversity 2021, 13(3), 127; https://doi.org/10.3390/d13030127
Submission received: 26 February 2021 / Revised: 11 March 2021 / Accepted: 13 March 2021 / Published: 17 March 2021
(This article belongs to the Special Issue Faunistical and Ecological Studies on Carabid Beetles)

Abstract

:
The multiple-use approach to forestry applied in Germany aims to combine timber production and habitat management by preserving specific stand structures. We selected four forest stand types comprising (i) pure oak, (ii) equal oak–pine mixtures, (iii) single tree admixtures of oak in pine forest and (iv) pure pine. We analysed the effects of stand composition parameters on species representative of the larger carabid beetles (Carabus arvensis, C. coriaceus, C. hortensis, C. violaceus, Calosoma inquisitor). The main statistical methods used were correlation analyses and generalised linear mixed models. Cal. inquisitor was observed in pure oak forests exclusively. C. coriaceus and C. hortensis were absent from pure pine stands. High activity densities of C. arvensis and C. violaceus were observed in all four forest types. When assessed at the smaller scales of species crown cover proportions and spatial tree species effect zones, C. hortensis was found to be positively related to oak trees with a regular spatial distribution, whereas C. coriaceus preferred lower and more aggregated oak tree proportions. C. violaceus showed strong sex-specific tree species affinities. Information about preferences of carabid beetles is necessary for management activities targeting the adaptation of forest structures to habitat requirements.

1. Introduction

The promotion and protection of mixed forests is considered a high priority in forest landscapes with large areas of artificially established, even-aged coniferous forests [1,2,3]. A typical example are the single-layered Scots pine (Pinus sylvestris L.) forests with naturally occurring admixed sessile oak (Quercus petraea (Matt.) Liebl.) trees found in the lowlands of central Europe [4,5,6]. Mixed forests are characterised by the presence of at least two different tree species [7]. Tree species mixtures can generate positive impacts in terms of the stability and resilience of forest ecosystems [8,9,10]. The specific traits of tree species, and the stand compositions, increase the potential range of habitat conditions and environmental niches that can be exploited of by different species of flora and fauna [11,12]. The effects of tree species mixtures depend on species proportions, spatial distribution and the patterns of mingling [2,3]. To understand the beneficial effects of mixtures, it is important to identify links between tree species and groups of faunal species [13]. This is all the more important in light of the fact that some studies have shown that greater structural diversity or tree species richness in forest ecosystems is not necessarily associated with an increase in faunal diversity [2,14,15].
Carabid beetles are one of the best investigated groups of beetles and are recognised for their high potential to act as indicator or model species for specific environmental conditions [16,17,18]. The importance of carabid beetles in forest ecosystems is due to their function as predators and antagonists of pest insects [19,20]. Generalised statements concerning the preferences of carabid beetles in relation to habitat or forest types can lead to misinterpretations or contradictory conclusions, because previous studies of Carabid beetles reported different or unspecific results concerning the beetles’ affinities to particular tree species and forest stand types. For example, Lindroth [21] characterised Carabus violaceus (L. 1758) as a “eurytopic” species, present in deciduous and coniferous forests. Skłodowski [22] recorded this species in poor coniferous forests only, whereas Dahl [23], by contrast, wrote that C. violaceus avoids poor coniferous forests. Another example is given by the following contrasting distributions claimed for C. hortensis (L. 1758), variously described as a “dominant species in moderately dry coniferous forests” [24], a species of fertile deciduous forest habitats [22] and a species of sparse deciduous and mixed forests in central Europe [21]. The differing distributions observed for the Carabus species can be explained by species-specific behavioural patterns and high locomotory activity [24,25,26]. Other explanations may derive from the consideration of superordinate spatial levels (e.g., landscape scale), local or regional differences in climate conditions, and the limited assessment of forest stand type characteristics, especially in tree species mixtures [27,28].
More detailed measurements of forest structures will almost certainly increase the value of information concerning the habitat preferences of Carabid beetles [15,29]. One way to increase our knowledge is through an approach to forest inventory that characterises mixed forests on the basis of basic components such as age, dimensions (stem or crown), proportions and the spatial arrangement of the tree species [30,31]. These forest parameters help to characterise forest conditions at smaller spatial scales, such as at the scale of single trees or small groups of trees [32,33]. It has been proven that in the case of single tree admixtures the spatial ecological effects are influenced in particular by individual tree age, diameter at breast height and crown dimension [34,35]. These tree species effects are spatially limited [36] and characterised by distance-dependent gradients or zones [37]. Tree species affect light availability, the microclimate and soil conditions in their surroundings, all of which are relevant for flora and fauna [38,39]. The resultant gradients and zones lead to small-scale edge effects [32]. Consequently, the habitat function of mixed forests as it pertains to Carabid beetles depends on the spatial manifestation of individual tree effects [40]. Soil surface-related tree zone effects are highly relevant for Carabid beetles; for example, humus forms, leaf litter distributions [27,41,42], pH values [39,43,44], topsoil moisture as a result of crown interception [45] and ground vegetation cover [37].
For the purposes of the study of pure and mixed oak and pine forests presented in this paper, we used detailed spatial information tied to oak and pine trees to describe the differences in forest stand types and to analyse related habitat effects for Carabid beetles [27]. The study excluded the effects of different climate regions and temporal aspects such as seasonality of climate conditions or species-specific metamorphic behavior of Carabid beetles [46]. Parameters pertaining to Carabid beetles, such as activity density, body size and sex ratios (number of males to females), can be used to assess the suitability of habitats and their quality [47,48]. The term “activity density” is used in pitfall trap studies (see methods) to record mobile species such as Carabids driven by, for example, intrinsic and extrinsic motivations [25,49]. The activity density represents the conceptual approach behind the pitfall trap method, which aims to provide mobility-related data pertaining to the species present in the context of defined temporal and spatial scales [24,50]. Carabid beetles exhibit strong sex-specific habitat preferences and benefit from the available resources [51,52]. To highlight the relevance of tree species effects within pure and mixed oak and pine forests for the distribution of Carabid beetles, the research was based on the following hypotheses:
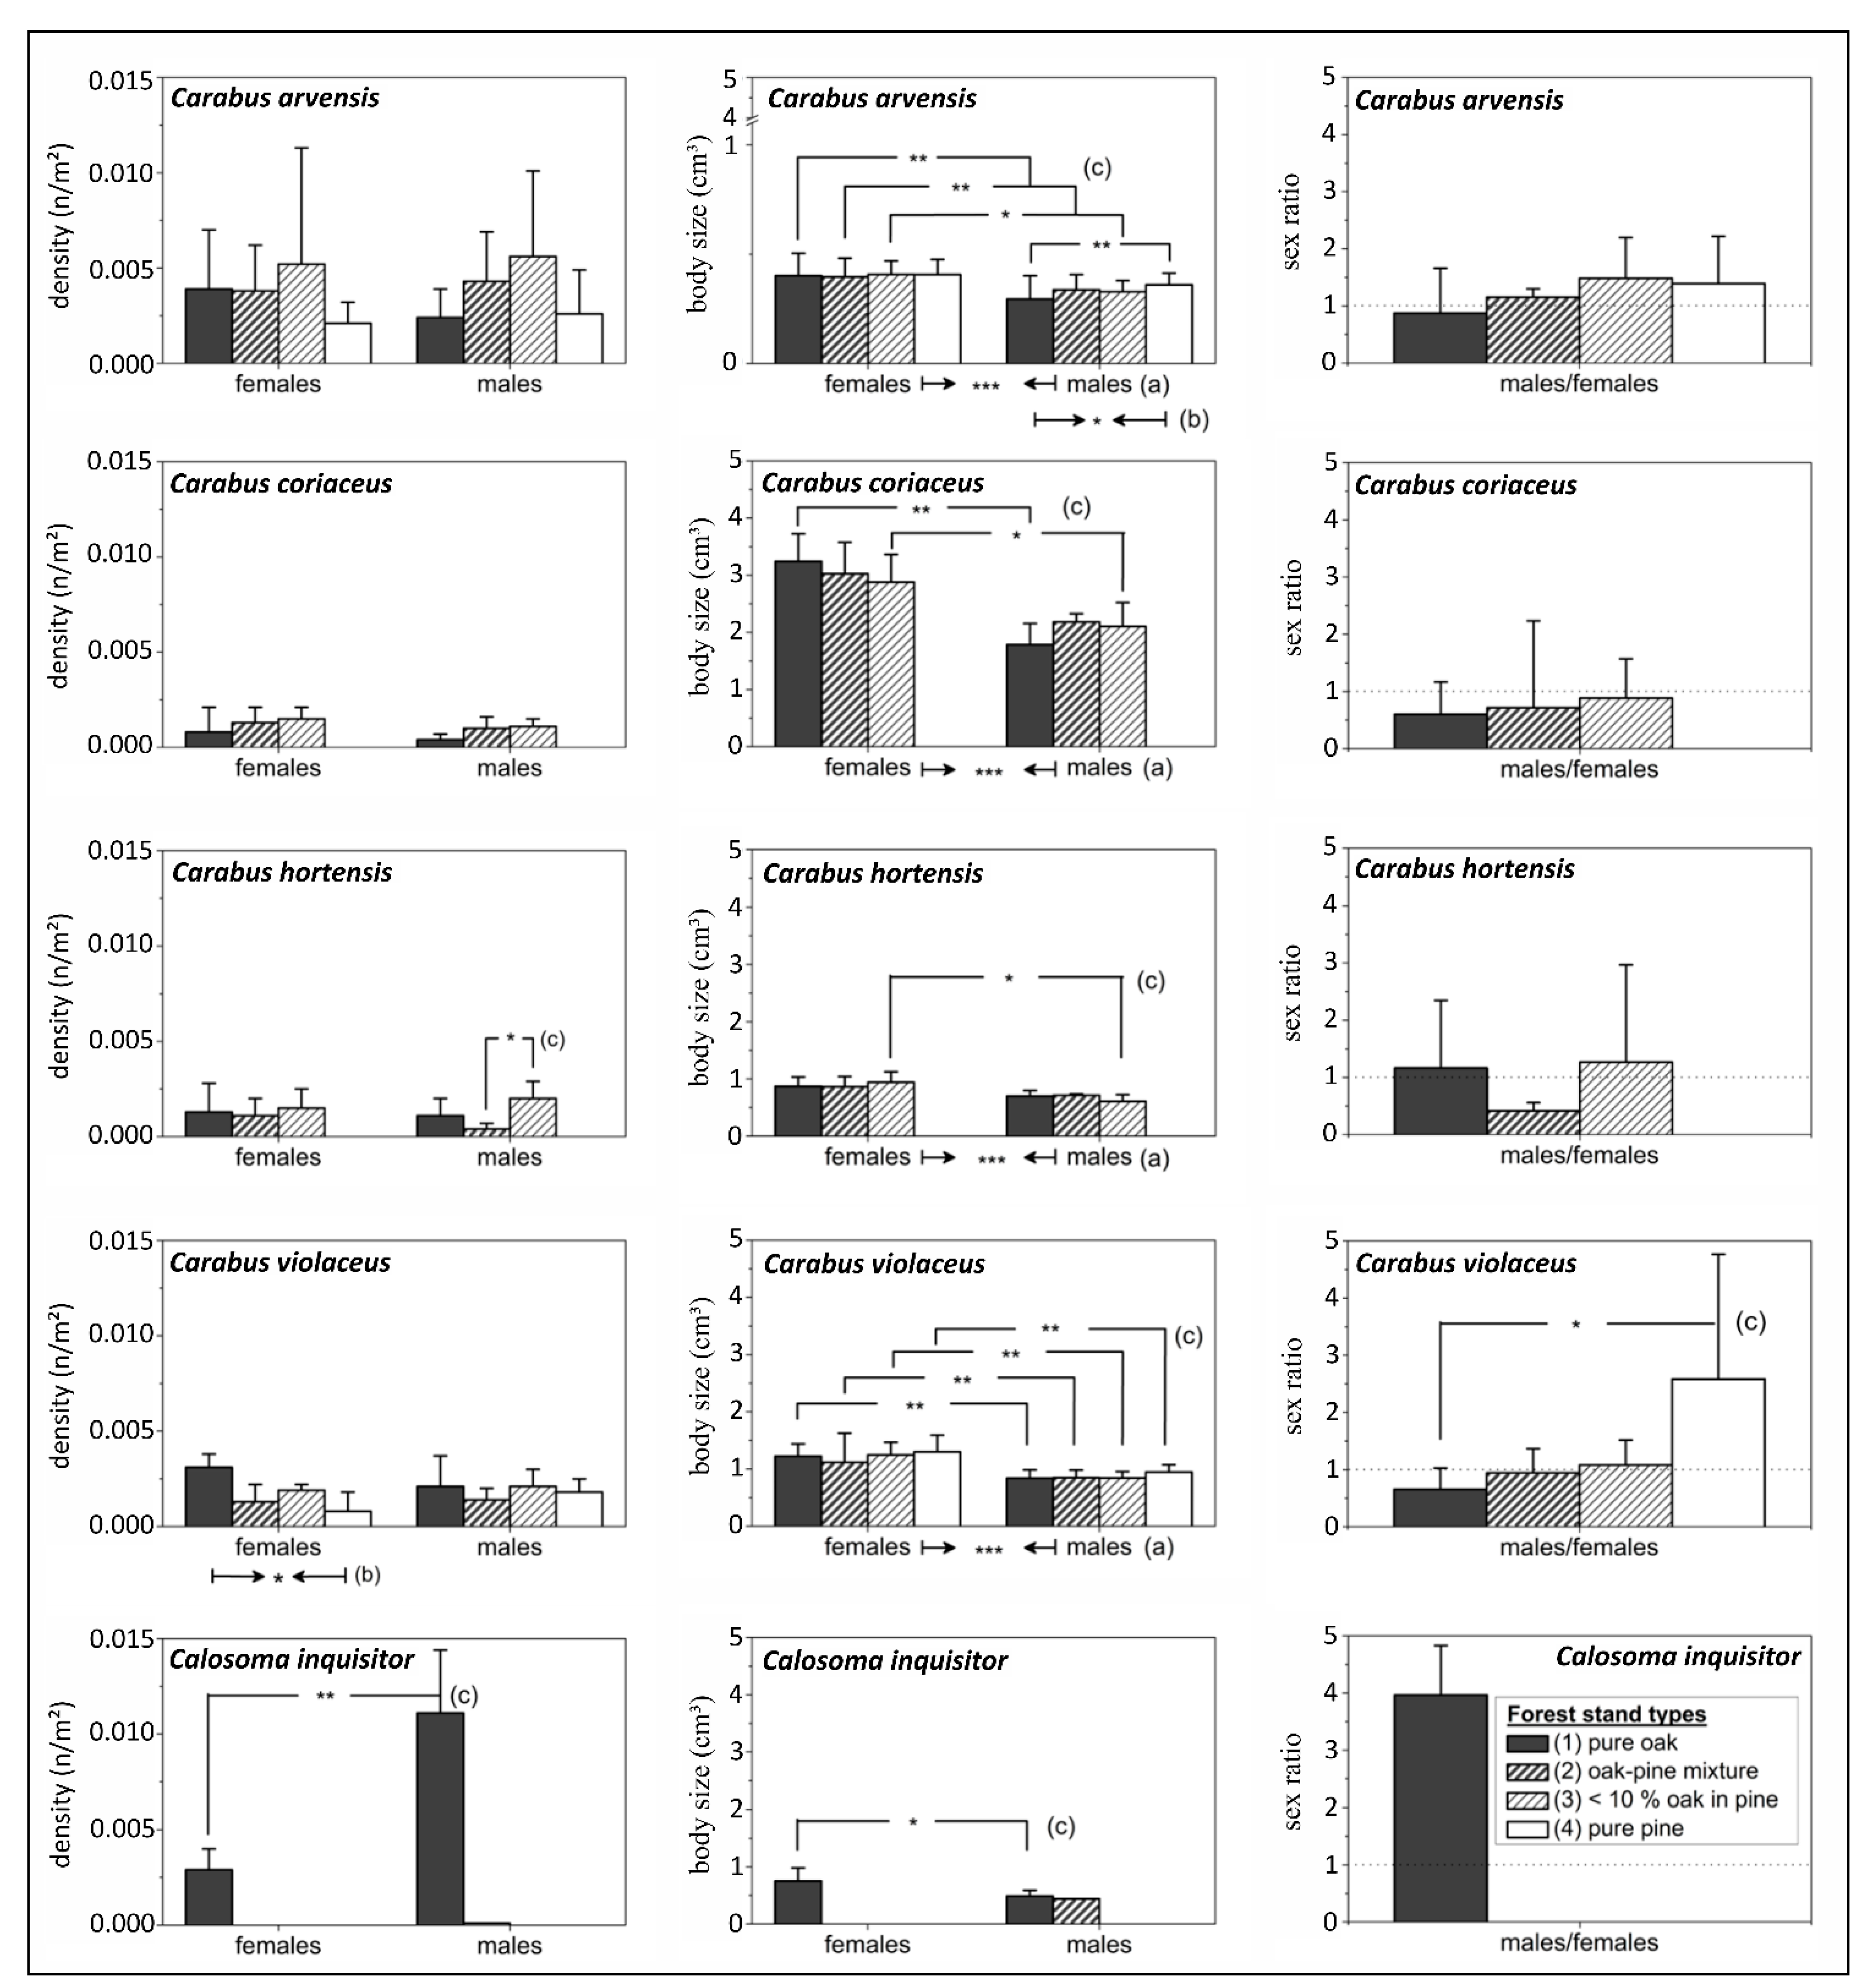
  • Differences in activity density, body size and sex ratios can be expected at the level of forest stand types for the five Carabid species analysed (Carabus arvensis (Hbst. 1784), C. coriaceus (L. 1758), C. hortensis (L. 1758), C. violaceus (L. 1758), Calosoma inquisitor (L. 1758)).
  • Tree species-specific characteristics, such as proportions of crown cover, and the nature of the tree species spatial distribution (random, regular or aggregated) are suitable parameters to highlight the affinities of Carabid beetles, especially for the mixed oak and pine forest stand types.
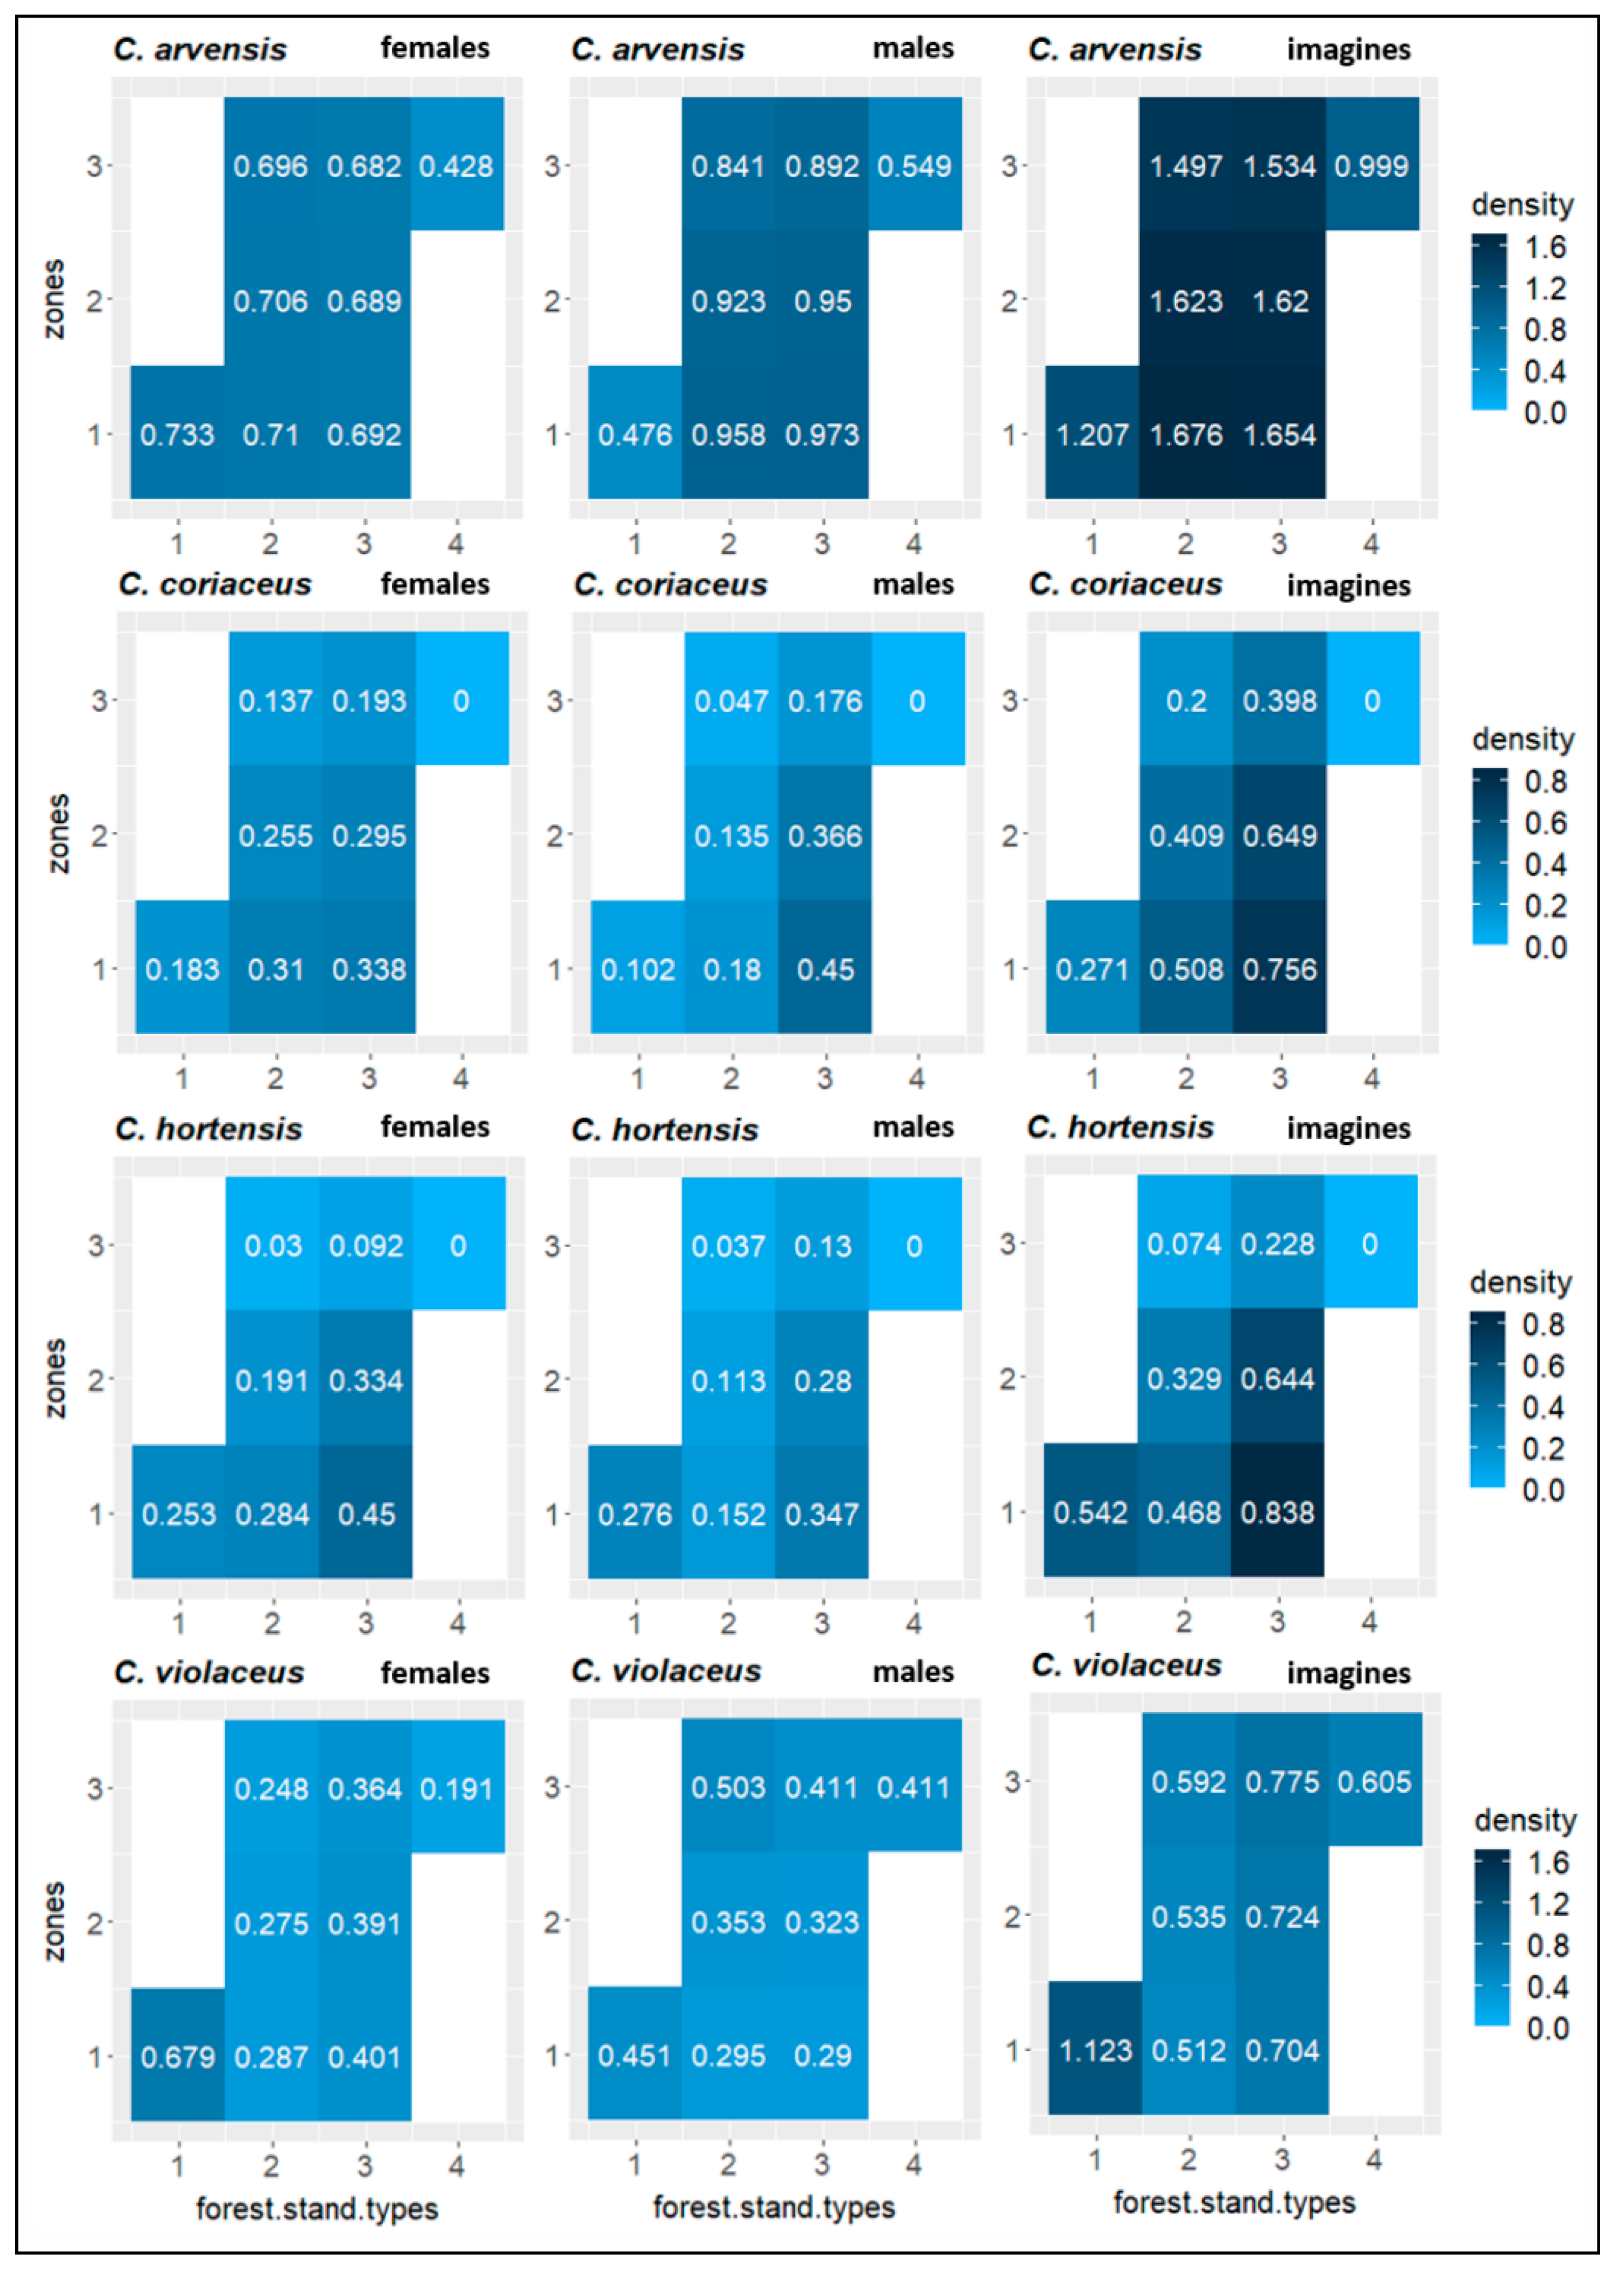
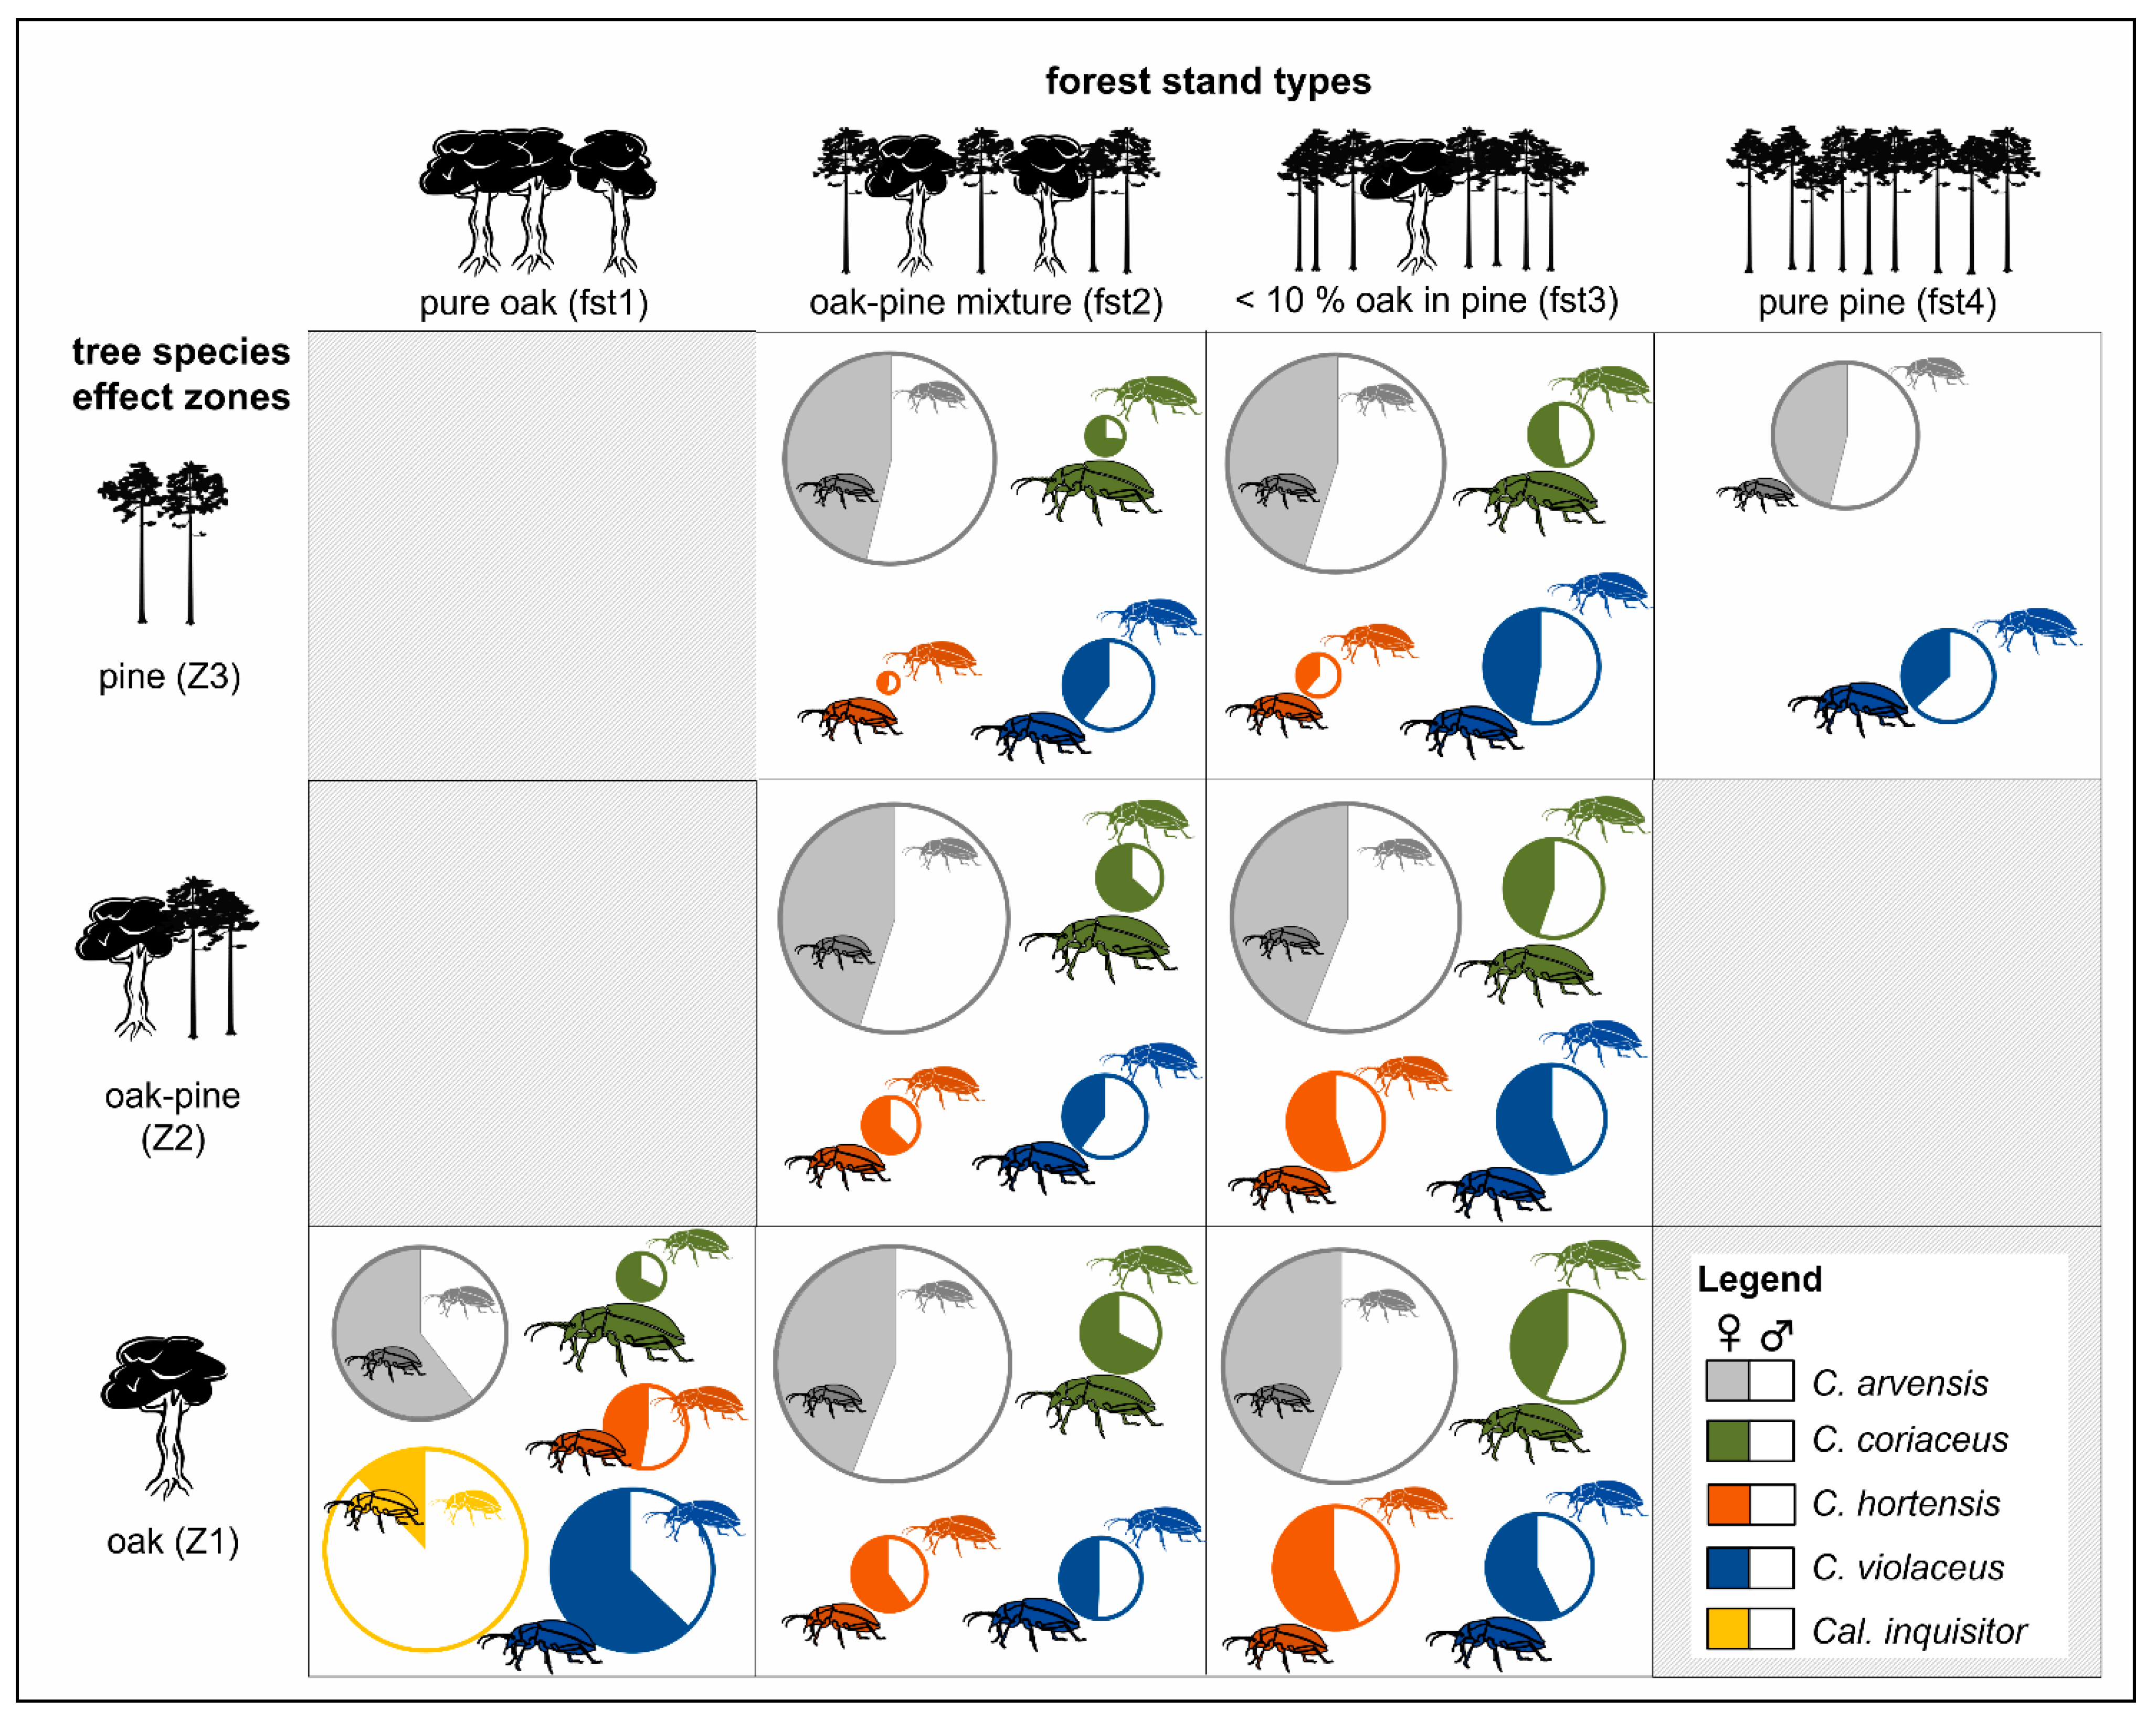
  • Superordinate analyses are possible, where tree species effect zones (Z1—pure oak effect zone, Z2—mixed oak–pine effect zone, Z3—pure pine effect zone) are used to define small-scale habitat preferences and environmental niches of Carabid species.

2. Materials and Methods

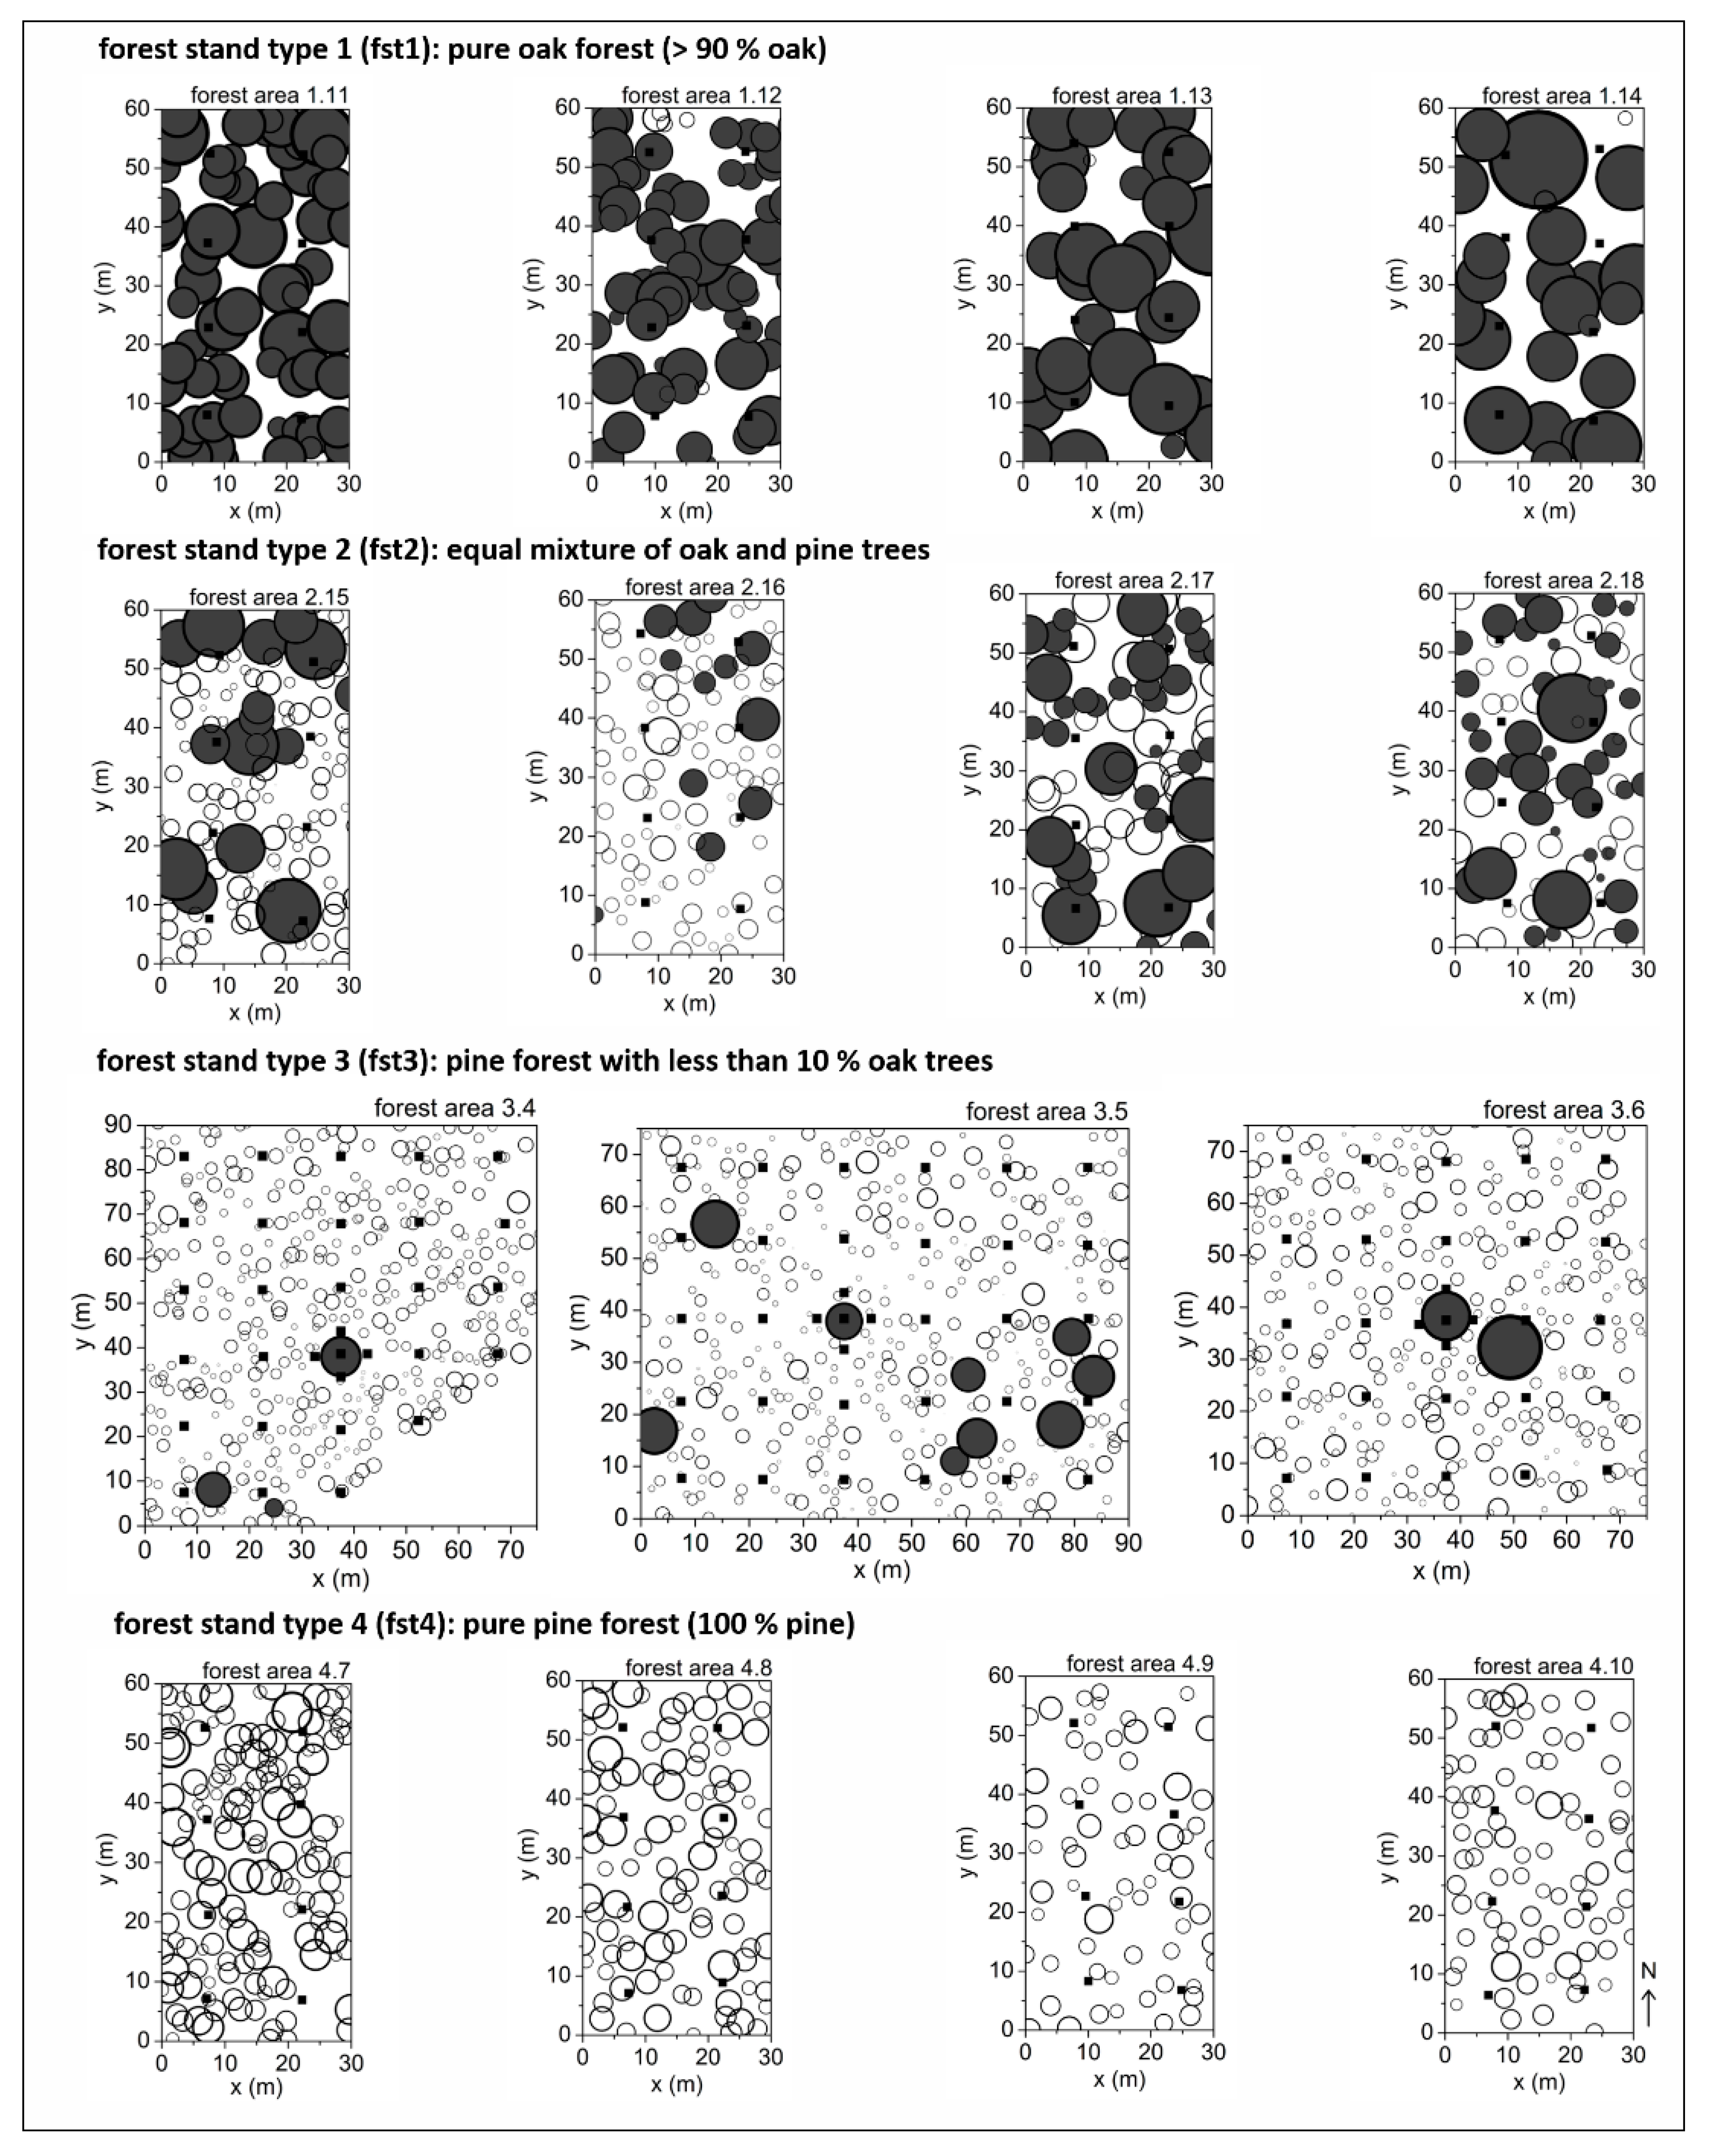
2.1. Study Areas and Tree Species Parameters

All of the sites covered in the study are located to the south of the German Federal State Brandenburg, in the Neusorgefeld forest district (51°47′15.77″ N; 13°34′37.36″ E). The mean distance between the study areas is 1605 m (sd ± 1102 m). The soils typically found in this region of the German lowlands are poor and sandy. The local mean annual temperature during the sampling period in 2011 reached 9.2 °C, and the precipitation amounted to 516 mm [53]. The ground vegetation in the herb and shrub layers of all study sites is dominated by Deschampsia flexuosa (L.), Vaccinium myrtillus (L.), Vaccinium vitis-idaea (L.) and small patches of Calamagrostis epigejos ((L.) Roth). Hypnum spp. and Pleurozium schreberi (Brid.) have the highest abundance in the moss layer. Four different managed forest stand types were considered, characterised by different proportions of the tree species P. sylvestris and/or Q. petraea: (fst1) pure oak stands, (fst2) even mixtures of oak and pine trees, (fst3) admixtures of less than 10% of oak within a pine forest matrix and (fst4) pure pine stands. Each of the chosen forest stand types included four study areas, except for the third forest stand type, which was represented by three study areas. The total number of study areas was 15, and all study areas were oriented to the north. The tree species distributions of the study areas are shown as position maps in Figure 1, combined with the tree crown dimensions. The position maps are based on polar coordinates measured using a laser-dendrometer (type LEHDA-GEO 100) with a degree of precision of 0.5° for the direction and 0.1 m for the distance. The polar coordinates were transformed into x- and y-coordinates (Cartesian coordinates) for further statistical analyses (see Section 2.3). The study areas established within the forest stand types fst1, fst2 and fst4 were 30 m × 60 m in size. The larger study areas in the forest stand type fst3 covered areas of between 4900 m² and 6300 m². Diameter at breast height, tree height and crown diameter were recorded for all trees on the 15 study areas. These parameter measurements at the individual tree level were included in further calculations carried out on other spatial scales, for example, at the level of study area (Table 1) and at the level of the areas surrounding traps (e.g., calculation of oak crown cover within 225 m²), as used in the model approach (see Section 2.3). Stem densities per hectare were calculated per tree species, as were the relative proportions of the tree species and crown covers.

2.2. Trap Design and Beetle Parameters

The positions of the pitfall traps were recorded in the same way as the tree positions (Figure 1). A trap arrangement in a 15 m × 15 m grid was employed on all study areas, according to the body size of the Carabidae [54]. The use of pitfall traps is a common method to record ground-dwelling arthropods [50,55]. Eight pitfall traps were placed at each sampling site for the forest types fst1, fst2 and fst4 with an area of 1800 m². In the case of the lager areas (4900 m² and 6300 m²) for forest stand type fst3, the same grid was used for the pitfall traps, with four additional traps placed around one large oak tree. This produced trap numbers of between 29 and 34 per forest type (Table 2). The pitfall traps, made of glass, were 7.5 cm in diameter and 9 cm in depth. They were filled to 75% with a solution of saturated benzoic acid and detergent [56] and covered by a transparent plastic roof to exclude precipitation. The use of 5% benzoic acid has proven successful as a killing liquid and preservative to record Carabids within forest ecosystems. The solution of saturated benzoic acid has the following positive properties compared to other killing liquids and preservatives: (i) no toxicity, (ii) the preservative effect prevents disintegration by fungi or putrid bacteria, (iii) no discolouration, (iv) no odour development and (v) no hardening of recorded Carabids [50,57,58,59]. The control interval for the 190 pitfall traps was 14 days, synchronised for all study areas. The related activity densities of the Carabid beetles were calculated as a number of specimens per m². The control period for the pitfall traps extended from 16 March until 27 October 2011.
The spatial relations were established using the trap coordinates. The body length (cm), height (cm) and width (cm) of all sampled Carabid beetles (imagines) were measured to calculate the sex-specific (females versus males) individual body size (volume in cm³) by means of the ellipsoid formula [60]. The sex ratio for all Carabid species was determined by dividing the number of males by the number of females [61].

2.3. Aggregation Index and Statistical Analyses

The calculation of aggregation indices based on the method of nearest-neighbour distances is one possibility to get additional information about the spatial distribution of tree species, in particular within mixed forests [62,63]. We used the Clark–Evans aggregation index (R) including the “Donnelly” edge correction and a Monte Carlo test based on 999 simulations of CSR with fixed n [64]. The null hypothesis states a completely random spatial distribution of trees, whereas the alternative hypothesis describes a clustered or regular distribution pattern. The values of the aggregation index R can be interpreted as follows: R = 1 indicates completely random distribution, R > 1 regular or even distribution and R < 1 aggregated or clustered distribution.
Following a stepwise adaptation of the data analyses to the different hierarchies of spatial scale, we started with the forest stand type level, followed by individual forest areas and finally small-scale tree effect zones. At the level of forest stand type, analyses of variance (ANOVA) and additional multiple post-hoc tests (LSD, least significant difference) were used to test for differences in the mean species- and sex-specific densities, body sizes and sex ratios of Carabid beetles between the four different forest stand types (Figure 2). Bivariate correlation analyses (Pearson’s correlation coefficient, p-value ≤ 0.05) were carried out to test the strength of the relationships between the tree species-specific parameters (crown cover proportions and aggregation indices) and the species-specific parameters (density and body size) of the Carabid beetles at the forest stand level. The value of the correlation coefficient (r) ranged between +1 and −1 [65]. Distance-dependent single tree effect zones were calculated for each forest area for the small-scale analyses [66,67]. The following three spatial effect zones were defined according to Wehnert and Wagner [42]: Z1 describes the distance between the oak trunk and the crown edge projection (0 m to < 4 m), Z2 is the distance between ≥ 4 m to < 15 m characterised by mixed oak–pine conditions and Z3 is the distance ≥ 15 m representative for pure pine parts of the stands in the study areas. Table 2 gives an overview of numbers and proportions of zones for each study area. Unexpectedly, in forest stand type fst2, with a roughly even mixture of oak and pine trees, the resultant proportions of pure pine zones (Z3) were low. The opposite is true for the study areas of the forest stand type fst3 with less than 10% oak trees.
The detailed information obtained at the small-scale was integrated employing a generalised linear mixed model (GLMM) approach [68]. The use of GLMMs allowed for the inclusion of the spatially explicit small-scale data collated gathered in the immediate surroundings of the pitfall traps, such as the effect zones and the canopy cover proportions of the tree species differentiated by the defined forest stand types [69]. The model adopted “forest stand type” and “tree effect zone” or “proportion of oak crowns” as fixed effects and “forest area” as a random effect to explain the species- and sex-specific densities of Carabid beetles. GLMMs were fitted by means of a negative-binomial error distribution and a logarithmic link. The applied GLMM structure was:
r v i , k = β 0 + β 1 f o r e s t . s t a n d . t y p e i + β 2 o a k . c r o w n . c o v e r i + μ k + ε
taken the oak effect as a metric covariate or
r v i , k = β 0 + β 1 f o r e s t . s t a n d . t y p e i + β 2 f o r e s t . z o n e i + μ k + ε
taken the oak effect as a categorical covariate with
f o r e s t . z o n e i = { 0 , o a k   d i s t a n c e < 4   m 1 , 4 o a k   d i s t a n c e < 15   m 2 , o a k   d i s t a n c e 15   m
with rvi as the response variable (i.e., species- or sex-specific number of beetles) of the ith trap and μk as the random effect parameter of the kth stand. We tested model residuals (qq-plots), heteroscedasticity in the residuals, and we checked for spatial autocorrelation by semi-variograms. Therefore, it was not necessary to adjust the original model.
The GLMM outputs were used for predictions of species- and sex-specific beetle activity densities differentiated by forest stand types and zones (Figure 3). The R package “lmmTMB” was used in combination with the package “lme4” for the calculations [70]. The models were fitted using maximum likelihood estimation via “TMB” (Template Model Builder). All calculations were conducted using R software version 4.0.3 (10 October 2020).

3. Results

3.1. Effects of Forest Stand Types, Tree Species Proportions and Effect Zones

The total numbers of adult specimens recorded per Carabid species over the whole sampling period of 7.5 months and across all of the study areas were as follows: 337 C. arvensis, 70 C. coriaceus, 75 C. hortensis, 144 C. violaceus and 102 Cal. inquisitor. C. arvensis and C. violaceus were present in all four forest stand types. C. arvensis exhibited the highest activity densities of individuals across all forest stand types. Cal. inquisitor was also present at high activity densities but occurred only in the pure oak forest stand type (fst1). The activity densities of males of Cal. inquisitor were significantly higher than of females (Figure 2). C. coriaceus and C. hortensis were completely absent from pure pine stands (fst4). The body sizes differed between the sexes of all Carabid species, females generally being larger.
For both sexes of C. arvensis the highest activity densities were observed in the forest stand type with <10% oak trees (fst3). The activity densities of females were higher in forest stand types where oaks were present, while C. arvensis males responded to higher proportions of pine trees with higher activity densities. Forest stand type had no effect on the body size of C. arvensis females. However, an increase in the proportions of pine in the different forest stand types was associated with a slight increase in the size of C. arvensis males. Indeed, a significant difference (p-value = 0.01) in male body size was observed between the pure oak and pure pine stands. The sex ratio increased to values above 1, representing the dominance of males, with an increase in the pine tree proportions across the forest stand types.
The activity densities of C. coriaceus were comparatively low but exhibited a positive trend towards the forest stand type with <10% of oak. The activity densities were low in pure oak, whereas individuals of both sexes were missing in pure pine stands. The forest stand types revealed sex-specific effects on C. coriaceus body sizes. The body size of the females was largest in pure oak stands. Males were largest in the oak–pine mixed stands (fst2). The sex ratio of C. coriaceus approached a balanced value (approx. 1) with an increasing proportion of pines in the forest stand types.
The activity density of C. hortensis was comparable to that of C. coriaceus. Females and males (imagines) of C. hortensis were missing in pure pine stands. The activity densities of females were similar across the studied forest stand types. The activity densities of males differed significantly between the mixed oak–pine stand type and the stand type with <10% oak (p-value = 0.05). The sexes of C. hortensis exhibited comparable body sizes across the different forest stand types, except the forest stand type with <10% oak. In the latter case, a significant difference between the body sizes of the sexes was observed (p-value = 0.05). In the mixed oak–pine forest stand type females predominated (sex ratio < 1), but the sex ratio of the other forest stand types highlighted a predominance of males.
The activity densities of C. violaceus females differed significantly between the forest stand types (p-value = 0.05). For both sexes the highest activity densities occurred in the forest stand types with pure oak (fst1) and with <10% oak (fst3). The sex-specific body sizes were comparable for each of the different forest stand types. Significant differences in body sizes between the sexes were observed for each forest stand type (p-value = 0.01). In forest stand types with higher proportions of pine the predominance of males increased continuously up to ratios of above 1. C. violaceus females were predominant in the pure oak stands (fst1). This resulted in significant differences in the sex ratios between the pure oak and pure pine forest stands (p-value = 0.05).
Cal. inquisitor was only observed in pure oak stands, except for one male that was recorded in the oak–pine mixed forest stand type. The significant differences (p-value = 0.01) between the sexes were reflected by a sex ratio of 3.97, which is representative of a strongly male-dominated distribution.
The relationship (Table 3) between oak crown cover proportions and the activity density of females was positively correlated for C. hortensis (r = 0.508, p-value = 0.05), C. violaceus (r = 0.676, p = 0.01) and Cal. inquisitor (r = 0.814, p = 0.001). This correlation was also positive for C. coriaceus (r = 0.236, n.s.) but not significantly so. A strongly positive correlation between the crown cover of oaks and the activity density of both sexes was determined only for Cal. inquisitor (r = 0.811, p-value = 0.001). All female activity densities (except C. arvensis) were significantly negatively correlated with the proportion of pine crown cover.
Very strong positive relationships existed between oak crown cover proportions and body sizes of Cal. inquisitor (r = 0.880, p-value = 0.001). The positive correlations between oak crown proportions and the body size of Carabids were also identified as being significant for C. hortensis (r = 0.566, p-value = 0.05), but this relationship was significantly negative with regard to the crown proportion of pine trees (r = −0.636, p-value = 0.01). Negative tendencies for the relationships between the pine crown proportion and the body size of beetles were determined for C. coriaceus imagines (r = −0.466, p-value = 0.1). Positive effects of the pine crown cover proportion were identified for the body size of males of C. arvensis (r = 0.492, p-value = 0.1) and C. violaceus (r = 0.501, p-value = 0.05). The effect of the proportion of pine crown cover was negative for the body size of females of both species.
The correlation coefficients between the aggregation indices of tree species and parameters of Carabid beetles (Table 3) revealed positive effects of more regular oak tree distributions on the activity densities of C. coriaceus (r = 0.454, p-value = 0.1) and C. hortensis (r = 0.671, p-value = 0.01). Greater regularity of spatial pine tree distribution caused significantly higher activity densities of both sexes of C. violaceus (p-value = 0.05). The negative correlation coefficients indicated higher activity densities, especially of females, of C. coriaceus (r = −0.436, p-value = 0.1), C. hortensis (r = −0.510, p-value = 0.1) and Cal. inquisitor (r = −0.782, p-value = 0.01) where the pine trees were more aggregated. The spatial distributions of tree species were less related to body sizes of Carabid beetles (Table 3).
Only the body size of C. arvensis (r = 0.811, p-value = 0.001) and C. coriaceus (r = 0.784, p-value = 0.05) males were positively correlated with the aggregation index of pine trees, which means that a more regular distribution of pine trees was linked to an increase in body sizes. The negative correlation between the oak tree aggregation index and the body sizes of Cal. inquisitor females was representative of a positive effect on body size of a greater aggregation of oak trees.
Table 4 shows additional information on the smaller spatial scale represented by the effect zones and their effects on the beetle species and sexes. The activity densities of both sexes of Cal. inquisitor (r = 0.920, p-value = 0.001) and of females of C. violaceus (r = 0.654, p-value = 0.05) were positively correlated with the proportion of the oak zone (Z1). The density of C. coriaceus imagines showed the strongest positive correlation (r = 0.502, p-value = 0.1) with the mixed oak–pine zone (Z2). A tendency towards a positive correlation was also observed for C. hortensis imagines (r = 0.273, n.s.) and the males of C. arvensis (r = 0.124, n.s.). Significantly negative correlations with Z3 were determined for C. hortensis females (r = −0.520, p-value = 0.05) and imagines (r = −0.507, p-value = 0.05) and males of C. coriaceus (r = −0.490, p-value = 0.1).
Positive correlation coefficients were determined for the body sizes of C. coriaceus females (r = 0.541, p-value = 0.1) and both sexes of C. hortensis (r = 0.537, p-value = 0.05) within the pure oak zone. Positive correlations were also found between the body sizes of males of both C. arvensis (r = 0.575, p-value = 0.05) and C. coriaceus (r = 0.593, p-value = 0.1) with an increasing proportion of pine zone (Z3), whereas the sizes of males of C. hortensis were negatively correlated with increasing pine zone (r = −0.630, p-value = 0.1).

3.2. Model-Based Effects of Forest Stand Types and Different Structural Attributes

3.2.1. Modelling the Effects of Forest Stand Types and Oak Crown Cover

The first generalised linear mixed model combined the effect of forest stand types and the proportion of oak crown cover (see formula 1). Cal. inquisitor was excluded from the following analyses, because this species was only present in the forest stand type with pure oak. This first model (Table 5) revealed no significant effects on the activity density of C. arvensis. For C. violaceus a significant effect (p-value ≤ 0.05) of the mixed oak–pine stand type (fst2) was only estimated by the model.
Forest stand type effects linked to the proportions of oak crown cover were identified for the presence of C. coriaceus and C. hortensis. The results of this GLMM revealed a significant effect of oak crown cover on the imagines of C. coriaceus (p-value ≤ 0.01) and C. hortensis (p-value ≤ 0.001). Sex-specific differences were evident. For example, the forest stand types with oak tree admixtures and higher oak crown cover proportions had a more significant effect on females of C. hortensis than on males. The opposite was observed for C. coriaceus, where the effect of forest stand type was greater for males, in particular in the pine forests with less than 10% oak (p-value = 0.01).

3.2.2. Modelling the Effects of Forest Stand Types and Effect Zones

The second GLMM (see formula 2) included the four different forest stand types and the ecological effect zones (Z1 to Z3). The GLMM components again provided no significant explanation for the number of C. arvensis individuals (Table 6). However, this model better explained the number of C. violaceus imagines, which were influenced significantly by the different forest stand types. The combination of forest stand type and tree species-related effect zones resulted once again in significant model estimations for C. coriaceus and C. hortensis. The tree effect zones were determined to be highly significant in terms of estimating the number of imagines and males of C. coriaceus and C. hortensis (p-value ≤ 0.001). The mixed forest stand type (fst2), with roughly equal proportions of oak and pine, revealed lower (C. coriaceus) to no (C. hortensis) relevance as a means to predict the number of beetles.
Finally, the model parameters were used to predict the species- and sex-specific activity densities of the Carabid species (except Cal. inquisitor). This procedure allowed predictions for combination of the different effects occurring at the level of forest stand type and the smaller-scale effects of the tree zones. The heatmaps created (Figure 3) revealed higher activity densities of C. arvensis predicted for the evenly mixed oak–pine stands (fst2) and the pine stands with oak proportions of <10% (fst3), including a low affinity to the oak effect zone. The model predictions for C. coriaceus and C. hortensis revealed clear activity density gradients. Higher densities were shown for the pine stands with <10% oak (fst3), declining towards the pure oak stand type (fst1). The higher activity densities of C. coriaceus and C. hortensis occurred in combination with a concentration of individuals within the oak tree effect zone (Z1). The activity density gradients were more pronounced for C. coriaceus and C. hortensis than for C. arvensis. In the case of C. violaceus, higher activity densities of imagines and females were predicted for the pure oak forest stand type in combination with the oak effect zone, with males possessing a higher affinity to the pine-related effect zones (Z3) across all forest stand types.
Figure 3. Carabus species- and sex-specific density (n/m²) model predictions separated by forest stand type (fst1—pure oak, fst2—oak-pine mixture, fst3—<10% oak, fst4—pure pine) and tree species effect zone (Z1—oak, Z2—oak–pine mixture, Z3—pine). Note the differences between the density scales for the various Carabid species.
Diversity 13 00127 g003

4. Discussion

4.1. Spatial Scale of Pure and Mixed Forest Stand Types

Regarding the aforementioned importance of carabids’ role as indicators, as well as their model function, [18,25] referred to at the beginning of the paper, most of the relevant studies to date were concerned with structural diversity within the landscape [29,71]. Forests, as carabid habitats, have often been studied in comparison with open field conditions and forest patches [72,73]. The edge conditions lead to a highly selective categorisation of carabid species, given the considerable differences in habitat conditions between open fields and forest patches [74,75,76,77,78]. In forest ecosystems with less pronounced environmental gradients (e.g., transition zones) between structural elements, it is considerably more difficult to find clear differences in habitat conditions and in the resultant preferences of carabid species [79,80,81]. In order to develop multiple-use forest management with integrative conservation strategies, e.g., for carabids in central European forests, it is necessary to identify relevant spatial units or effect distances [36,40,82]. The definition of relevant structural elements (e.g., tree species compositions, dead wood, canopy gaps) as small-scale units within forests also applies to the characterisation of the habitat preferences of the different carabid species associated with forest ecosystems [22,28,83]. The distinction between pure and mixed forest stand types, as used in this study, is a first simple step, with a high degree of practical relevance, towards differentiating between the forest habitats of carabids [2,33,84,85]. It is worth noting here that traditional forest inventories classify forest stands with a proportion of <10% admixed tree species as pure stands [86]. This would be the case for the pine-dominated stand type with a low oak proportion (fst3) considered as part of this study and the ecological effects of the admixed old oak trees would be neglected as a result.
The assessment of forest types for carabids appears complex, given the importance of combining beetle parameters like activity density, body size and sex ratio, all of which provide indications of the habitat suitability and the vitality and the composition of the carabid species populations [87,88,89]. The species-specific comparison of carabids on the basis of forest stand type undertaken here revealed no significant effects on activity densities or on body sizes, although Skłodowski [22] observed increasing body sizes of carabids with an increasing proportion of deciduous tree species in forest stands. Previous studies also documented species-specific sex ratios as a function of different habitat conditions and seasonality [61,90]. The appreciably higher activity density (Figure 2) of the otherwise more immobile females (e.g., C. violaceus in pure oak) can be interpreted as a sign of suitable habitat conditions (oviposition site) [91]. Other studies, for example of Pterostichus oblongopunctatus (Fabricius, 1787), assumed a predominance of females to be indicative of better habitat quality [84]. However, other authors regarded a female-biased sex ratio to be a sign of unsuitable or disturbed habitats and increasing activity of females caused by hunger [47,61]. Focusing only on a single beetle parameter (density, body size or sex ratio) may lead to contrary assumptions for habitat derivation in carabids (e.g., C. violaceus).
The habitat preference of Cal. inquisitor was clear, being present exclusively in pure oak stands, where it occurred in high activity densities and with a high proportion of males. Although Cal. inquisitor is known as a species with a good capacity for flight, no individuals were recorded within the mixed oak–pine forest type with oak crown cover proportions of >30%. Similar results depicting the close affinity of Cal. inquisitor for oak trees were documented by du Bus de Warnaffe and Dufrêne [14]. In contrast to most ground beetles, Cal. inquisitor and Cal. sycophanta (L., 1758) have a strong affinity to deciduous trees as habitat [92]. The complete absence of C. coriaceus and C. hortensis in pure pine stands confirmed for both carabid species the basic assumption that forest stand types with an admixture of deciduous tree species such as sessile oak are preferable [21,84,93]. Moreover, the scarcity of carabid species within very homogenous, single-layered and pure pine stands was demonstrated by the fact that three (Cal. inquisitor, C. coriaceus, C. hortensis) of the five carabid species were absent (Figure 4). Contradictory findings presented by Barsoum et al. [33] indicated that the proportion of admixed oak trees in pine stands has no effect on the diversity of carabid species. Comparable activity densities of C. coriaceus and C. hortensis were recorded in pure oak stands and within mixed forest stand types. Only minor differences were revealed for the body sizes and the sex ratios of both species, with the exception of a higher female proportion of C. hortensis in the oak–pine forest stand type. No differences in the habitat preferences could be described for C. coriaceus and C. hortensis at the level of forest stand type without including smaller scale forest stand parameters such as tree effect zones (Figure 4). Interspecific competition between C. coriaceus and C. hortensis can be ruled out in spite of their similar forest type preferences, because of the relatively low activity densities [25,94]. C. arvensis and C. violaceus reached high activity densities within all four forest stand types. The use of such a broad range of forest habitats was already proven for C. arvensis, a species highly abundant in coniferous as well as deciduous forests, whereas C. violaceus is dominant in pure pine forests, subdominant in mixed coniferous forests and only an accessory species in oak–lime–hornbeam [84]. However, Magura et al. [95] found C. violaceus to be more pronounced in deciduous forests [95]. The differences in body sizes, related to forest stand type and sex-specific, was recorded for both species (females > males) [96]. This was also true for the sex ratios, which described increasing predominance of males with increasing proportions of pine. Females of both species were associated more with higher proportions of oak trees. As previously stated, the significance of the role of stand type in relation to sex ratios is debated [61,88]. No conclusive statements in relation to the habitat preferences of C. arvensis or C. violaceus were possible based on the forest stand type and the beetle parameters recorded.

4.2. Spatial Scale of Single Trees and their Ecological Effect Zones

In order to improve the reliability of the information on the habitat preferences of carabid species in forests, additional data beyond the level of mere forest stand type (Figure 4) are necessary [14,27,33,79,97]. Structural heterogeneity within single-layered forest stands is mainly influenced by the proportions and spatial distributions of the different tree species present [30,32,56,98,99,100]. In this study, the pure oak and pine forest stand types were characterised by aggregation indices above 1, indicating a regular tree species distribution. Often small-scale structures of particular relevance for different carabid species, such as dead wood aggregations [101,102], habitat/retention trees [103,104] and canopy gaps [105,106] are absent from the pure stands which are managed primarily for wood production [83,107]. Cal. inquisitor was the only carabid species in a pure stand type to benefit from a more regular spatial distribution of oak trees, showing an increase in the activity density of individuals. The added value of adopting single tree-based effect zones is that it provided a more precise definition of potential niches for carabids, characterised by pure oak, mixed oak–pine and pure pine conditions within mixed forest stand types [33]. The results obtained for the mixed forest stand types revealed that the spatial heterogeneity of these zones is a decisive factor influencing the presence of carabids (Figure 4). As was shown in Table 2, the transition zone (proportion of oak–pine zone approx. 70%) was dominant within the oak–pine forest stand type (fst2), whereas Z2 attained a proportion of only 15% to 48% in the forest stand type with <10% oak (fst3). The proportion of niches was less balanced than is actually implied by the number of oak and pine trees within the mixed forest stand types, because the spatial manifestation of individual tree effect zones depends on tree traits [42,108,109]. In forest stand types with an equal number of oak and pine trees mixed amongst each other, the effect exerted by oak can be more intense for carabids, because of the greater impact of the high quantities of litter deposited seasonally on the soil surface [94,110]. Using spatial effect zones, more detailed niche differentiations are possible. C. hortensis responded more strongly to an increase in oak crown cover and oak effect zones. This manifested itself in higher individual densities and larger body sizes compared to C. coriaceus. The site preference of C. hortensis, identified at a microscale, may be explained by a greater affinity for more humid places [111] covered by mosses [112]. These microsites exist along the drip line between oak crown edges and pine trees [113]. The negative response to higher pine proportions and related effects is also stronger for C. hortensis. Effects of the spatial distribution of tree species and effect zones could be shown for both C. hortensis and C. coriaceus but in different ways. C. hortensis benefitted from a more regular distribution of oak trees, but this was less relevant for C. coriaceus.
No differences were observed between the sexes of C. arvensis in terms of forest stand type preference—in spite of the integration of smaller spatial units such as single tree effect zones. The reason for this was that this species is highly variable in its responses to different habitat conditions. This is reflected, for example, by the colour and metallic lustre of the beetle’s body, a positive adaptation to differences in light availability [96]. The more shaded surroundings of oak trees situated within the oak–pine mixed stands had no obvious effect on the small-scale presence of C. arvensis. This may have been due to the relatively high light availability under the mixed oak–pine forest canopies and the slight zone-dependent light gradient between oak and pine trees [114,115]. To test for a potential affinity of C. arvensis to variable light conditions as affected by oak–pine mixtures in a forest stand, it would be useful to include the time of bud burst of oak trees as an additional seasonality aspect in future studies incorporating this spring-active carabid species [22,116].
Sex-specific responses to habitat conditions have been documented for various insect species [61,72]. In this study, C. violaceus showed the greatest sex-specific response in relation to single trees and effect zones, expressed in the activity density of individuals and in body size [25,51,117]. The females of C. violaceus revealed a high affinity for oak tree effects and avoided pine trees. The males, by contrast, were positively correlated with pine trees and the related effect zones, whereas oak trees were only preferred as spatial aggregates [98]. Only with an increase in the proportion of the oak–pine mixed zone (Z2) was a decrease observed in the activity density of individuals of both sexes of C. violaceus. Previous studies testing the effects of beech litter in spruce forests found only weak differences in the activity density of C. violaceus individuals [95], but the importance of sex-specific substrate preferences was also described for Carabus hungaricus (Fabricius, 1792) [52] and Carabus clathratus (L., 1761) [51]. The question of the temporal continuity of habitat uses in small-scale forest habitats, as described for the sexes of C. violaceus, can only be answered by including life cycle aspects for example, sex-specific behaviour during the reproductive period [47,91,118,119]. The importance of considering sex-specific smaller-scale habitat preferences to assess the suitability of forests is highlighted by the case of C. violaceus.

5. Conclusions

The derivation of the habitat preferences of carabid beetles in managed, pure, and mixed oak and pine forest stand types was successfully demonstrated in the study. The more unambiguous results of species- and sex-specific carabid parameters as responses to tree species effect zones illustrated the particular importance of small-scale spatial analyses, especially in mixed forests. Spatial information about tree species effect zones increases the accuracy of the identification of the habitat conditions in mixed forests preferred by carabid beetles. This approach represents an option to identify spatially optimal habitats [72] but also the limits to the extent that tree species combinations in mixed forests are suited to creating high variation of suitable habitat conditions for particular target species, for example, carabid beetles. Traditional silvicultural management activities, such as the targeted aggregation of oak trees in pine stands for the favourable impact this has on timber quality, can be evaluated on the basis of their impact on the different carabid species [98,120,121,122].
For carabid beetles to serve effectively as indicators or model species in spatially complex systems such as mixed forests, additional information about the continuity of environmental conditions within the corresponding microhabitats is required [15]. This applies in particular to species- and sex-specific analyses of carabid beetles. Additional research is also necessary to include the responses to tree species-related seasonality (deciduous versus evergreen coniferous trees) in mixed forests and life cycle aspects for carabid beetles [123]. Consideration should also be given to whether the more immobile and less chitinised larvae of carabids might be more suitable as environmental indicators [17,18,91,124].
While the results presented here are valid for pure and mixed forests consisting of oak and pine, our findings cannot be directly applied to other tree species constellations, because the spatial effect zones are strictly linked to the tree species and individual tree traits. Further research focusing explicitly on spatio-temporal interactions between tree species constellations in mixed forests and the effect on carabid species would be beneficial.

Author Contributions

Data collecting and data curation, A.W.; conceptualization, A.W. and F.H.; methodology; software; validation; formal analysis; writing—original draft preparation; writing—review and editing, A.W., S.W. and F.H.; visualisation, A.W. and F.H.; supervision, S.W. All authors have read and agreed to the published version of the manuscript.

Funding

This research was funded by a private scholarship provided by the Michael-Jahr-Foundation. Open Access Funding by the Publication Fund of the TU Dresden.

Institutional Review Board Statement

Not applicable.

Data Availability Statement

The data presented in this study are available on request from the corresponding author, because the data are part of a Ph.D. Thesis (A.W.) not yet finished.

Acknowledgments

The results presented are part of a wider study into single-tree research. The authors would like to express especial thanks to the Michael-Jahr-Foundation for supporting the whole study with a scholarship. We would also like to thank the companies Gebr. Ostendorf Kunst-stoffe GmbH and Co. KG and Lentia Pirna GmbH for supporting our study by supplying materials for the pitfall traps. We are grateful to Landesbetrieb Forst Brandenburg (LFB) and Landeskompetenzzentrum Forst Eberswalde (LFE) for providing climate data. A special thanks goes to Antje Karge, Michael Wehnert-Kohlenbrenner, Andreas Möhring and Lumir Dobrovolný for helping during stem position measurements and to our proofreader David Butler Manning.

Conflicts of Interest

The authors declare no conflict of interest.

References

  1. Brockerhoff, E.G.; Jactel, H.; Parrotta, J.A.; Quine, C.P.; Sayer, J. Plantation forests and biodiversity: Oxymoron or opportunity? Biodivers. Conserv. 2008, 17, 925–951. [Google Scholar] [CrossRef]
  2. Oxbrough, A.; French, V.; Irwin, S.; Kelly, T.C.; Smiddy, P.; O’Halloran, J. Can mixed species stands enhance arthropod diversity in plantation forests? For. Ecol. Manag. 2012, 270, 11–18. [Google Scholar] [CrossRef] [Green Version]
  3. Bravo-Oviedo, A.; Pretzsch, H.; del Río, M. Dynamics, Silviculture and Management of Mixed Forests; Managing Forest Ecosystems Vol 31; Springer: Cham, Switzerland, 2018. [Google Scholar]
  4. Anders, S.; Beck, W.; Bolte, A.; Hofmann, G.; Jenssen, M.; Krakau, U.; Müller, J. Ökologie und Vegetation der Wälder Nordostdeutschlands.—Einfluß von Niederschlagsarmut und erhöhtem Stickstoffeintrag auf Kiefern-, Eichen- und Buchen-Wald- und Forstökosysteme des Nordostdeutschen Tieflandes, 1st ed.; Verlag Dr. Kessel: Oberwinter, Germany, 2002. [Google Scholar]
  5. Goris, R.; Kint, V.; Haneca, K.; Geudens, G.; Beeckman, H.; Verheyen, K. Long-term dynamics in a planted conifer forest with spontaneous ingrowth of broad-leaved trees. Appl. Veg. Sci. 2007, 10, 219–228. [Google Scholar] [CrossRef]
  6. Pretzsch, H.; Steckel, M.; Heym, M.; Biber, P.; Ammer, C.; Ehbrecht, M.; Bielak, K.; Bravo, F.; Ordóñez, C.; Collet, C.; et al. Stand growth and structure of mixed-species and monospecific stands of Scots pine (Pinus sylvestris L.) and oak (Q. robur L., Quercus petraea (Matt.) Liebl.) analysed along a productivity gradient through Europe. Eur. J. For. Res. 2020, 139, 349–367. [Google Scholar] [CrossRef] [Green Version]
  7. Bravo-Oviedo, A.; Pretzsch, H.; Ammer, C.; Andenmatten, E.; Barbati, A.; Barreiro, S.; Brang, P.; Bravo, F.; Coll, L.; Corona, P.; et al. European Mixed Forests: Definition and research perspectives. For. Syst. 2014, 23, 518–533. [Google Scholar] [CrossRef]
  8. Jactel, H.; Brockerhoff, E.G. Tree diversity reduces herbivory by forest insects. Ecol. Lett. 2007, 10, 835–848. [Google Scholar] [CrossRef] [PubMed]
  9. Knoke, T.; Ammer, C.; Stimm, B.; Mosandl, R. Admixing broadleaved to coniferous tree species: A review on yield, ecological stability and economics. Eur. J. For. Res. 2008, 127, 89–101. [Google Scholar] [CrossRef]
  10. Szmyt, J.; Tarasiuk, S. Species-specific spatial structure, species coexistence and mortality pattern in natural, uneven-aged Scots pine (Pinus sylvestris L.)-dominated forest. Eur. J. For. Res. 2018, 137, 1–16. [Google Scholar] [CrossRef] [Green Version]
  11. Butterfield, J.; Benitez Malvido, J. Effect of mixed-species tree planting on the distribution of soil invertebrates. In The Ecology of Mixed-Species Stands of Trees; Cannell, M.G.R., Malcolm, D.C., Robertson, P.A., Eds.; Special Publication Number 11 of the British Ecological Society; Oxford-Blackwell Scientific Publications: London, UK, 1992; pp. 255–265. [Google Scholar]
  12. Gamfeldt, L.; Snäll, T.; Bagchi, R.; Jonsson, M.; Gustafsson, L.; Kjellander, P.; Ruiz-Jaen, M.C.; Fröberg, M.; Stendahl, J.; Philipson, C.D.; et al. Higher levels of multiple ecosystem services are found in forests with more tree species. Nat. Commun. 2013, 4, 1340. [Google Scholar] [CrossRef]
  13. Sobek, S.; Steffan-Dewenter, I.; Scherber, C.; Tscharntke, T. Spatiotemporal changes of beetle communities across a tree diversity gradient. Divers. Distrib. 2009, 15, 660–670. [Google Scholar] [CrossRef]
  14. du Bus de Warnaffe, G.; Dufrêne, M. To what extent can management variables explain species assemblages? A study of carabid beetles in forests. Ecography 2004, 27, 701–714. [Google Scholar] [CrossRef]
  15. Lassau, S.A.; Hochuli, D.F.; Cassis, G.; Reid, C.A.M. Effects of Habitat Complexity on Forest Beetle Diversity: Do Functional Groups Respond Consistently? Divers. Distrib. 2005, 11, 73–82. [Google Scholar] [CrossRef]
  16. Rainio, J.; Niemelä, J. Ground beetles (Coleoptera: Carabidae) as bioindicators. Biodivers. Conserv. 2003, 12, 487–506. [Google Scholar] [CrossRef]
  17. Work, T.T.; Koivula, M.; Klimaszewski, J.; Langor, D.; Sweeney, J.; Hébert, C. Evaluation of carabid beetles as indicators of forest change in Canada. Can. Entomol. 2008, 140, 393–414. [Google Scholar] [CrossRef]
  18. Koivula, M. Useful model organisms, indicators, or both? Ground beetles (Coleoptera, Carabidae) reflecting environmental conditions. ZooKeys 2011, 100, 287–317. [Google Scholar] [CrossRef] [Green Version]
  19. Walsh, P.J.; Day, K.R.; Leather, S.R.; Smith, A. The Influence of Soil Type and Pine Species on the Carabid Community of a Plantation Forest with a History of Pine Beauty Moth Infestation. Forestry 1993, 66, 135–146. [Google Scholar] [CrossRef]
  20. Pearce, J.L.; Venier, L.A. The use of ground beetles (Coleoptera: Carabidae) and spiders (Araneae) as bioindicators of sustainable forest management: A review. Ecol. Indic. 2006, 6, 780–793. [Google Scholar] [CrossRef]
  21. Lindroth, C.H. Ground Beetles (Carabidae) of Fennoscandia. A Zoogeographic Study. Part 1: Specific Knowledge Regarding the Species. Translation of: Die fennoskandischen Carabidae: Eine Tiergeographische Studie I. Spezieller Teil; Amerind Publishing Co. Pvt. Ltd.: New Delhi, India, 1992. [Google Scholar]
  22. Skłodowski, J.J.W. Interspecific body size differentiation in Carabus assemblages in the Białowieża Primeval Forest, Poland. In Proceedings of the 11th European Carabidologists’ Meeting, Århus, Denmark, 21–24 July 2003; Lövei, G.L., Toft, S., Eds.; DIAS Report, No. 114. Ministry of Food, Agriculture and Fisheries: Tjele, Denmark, 2005; pp. 291–303. [Google Scholar]
  23. Dahl, F. Die Tierwelt Deutschlands und der Angrenzenden Meeresteile nach ihren Merkmalen und Lebensweise 7.Teil: Coleoptera oder Käfer I: Carabidae (Laufkäfer), 1st ed.; Verlag von Gustav Fischer: Jena, Germany, 1928. [Google Scholar]
  24. Turin, H.; Penev, L.; Casale, A. The Genus Carabus in Europe. A Synthesis; Fauna Europaea Evertebrata No. 2; Pensoft Publishers & European Invertebrates Survey: Sofia, Bulgaria, 2003. [Google Scholar]
  25. Thiele, H.-U. Carabid Beetles in Their Environments: A Study on Habitat Selection by Adaptations in Physiology and Behaviour; Zoophysiology and Ecology Volume 10; Springer: Berlin/Heidelberg, Germany, 1977. [Google Scholar]
  26. Stork, N.E. The Role of Ground Beetles in Ecological and Environmental Studies; Intercept Ltd.: Andover, MA, USA, 1990. [Google Scholar]
  27. Sroka, K.; Finch, O.-D. Ground beetle diversity in ancient woodland remnants in north-western Germany (Coleoptera, Carabidae). J. Insect Conserv. 2006, 10, 335–350. [Google Scholar] [CrossRef]
  28. Lange, M.; Türke, M.; Pašalić, E.; Boch, S.; Hessenmöller, D.; Müller, J.; Prati, D.; Socher, S.A.; Fischer, M.; Weisser, W.W.; et al. Effects of forest management on ground-dwelling beetles (Coleoptera; Carabidae, Staphylinidae) in Central Europe are mainly mediated by changes in forest structure. For. Ecol. Manag. 2014, 329, 166–176. [Google Scholar] [CrossRef]
  29. Taboada, A.; Kotze, D.J.; Tárrega, R.; Salgado, J.M. Traditional forest management: Do carabid beetles respond to human-created vegetation structures in an oak mosaic landscape? For. Ecol. Manag. 2006, 237, 436–449. [Google Scholar] [CrossRef]
  30. Clarke, R.T.; Thomas, J.A.; Elmes, G.W.; Hochberg, M.E. The Effects of Spatial Patterns in Habitat Quality on Community Dynamics within a Site. Proc. R. Soc. Lond. B 1997, 264, 347–354. [Google Scholar] [CrossRef] [Green Version]
  31. Tomppo, E.; Gschwantner, T.; Lawrence, M.; McRoberts, R.E. National Forest Inventories. Pathways for Common Reporting; Springer Science + Business Media B.V.: New York, NY, USA, 2010. [Google Scholar]
  32. Niemelä, J. Invertebrates and Boreal Forest Management. Conserv. Biol. 1997, 11, 601–610. [Google Scholar] [CrossRef] [Green Version]
  33. Barsoum, N.; Fuller, L.; Ashwood, F.; Reed, K.; Bonnet-Lebrun, A.-S.; Leung, F. Ground-dwelling spider (Araneae) and carabid beetle (Coleoptera: Carabidae) community assemblages in mixed and monoculture stands of oak (Quercus robur L./Quercus petraea (Matt.) Liebl.) and Scots pine (Pinus sylvestris L.). For. Ecol. Manag. 2014, 321, 29–41. [Google Scholar] [CrossRef]
  34. Wu, H.; Sharpe, P.J.H.; Walker, J.; Penridge, L.K. Ecological Field Theory: A Spatial Analysis of Resource Interference among Plants. Ecol. Model. 1985, 29, 215–243. [Google Scholar] [CrossRef]
  35. Pretzsch, H. Canopy space filling and tree crown morphology in mixed-species stands compared with monocultures. For. Ecol. Manag. 2014, 327, 251–264. [Google Scholar] [CrossRef] [Green Version]
  36. Laca, E.A. Multi-Scape Interventions to Match Spatial Scales of Demand and Supply of Ecosystem Services. Front. Sustain. Food Syst. 2021, 4, 607276. [Google Scholar] [CrossRef]
  37. Kuuluvainen, T.; Pukkala, T. Effect of Scots pine seed trees on the density of ground vegetation and tree seedlings. Silva Fenn. 1989, 23, 159–167. [Google Scholar] [CrossRef] [Green Version]
  38. Schua, K.; Fischer, H.; Lehmann, B.; Wagner, S. Single tree effects of sessile oak (Quercus petraea (Matt.) Liebl.) within pure stands (Pinus sylvestris L.) on topsoil properties. Allg. For. J. Ztg. 2007, 178, 172–179, (In German with English abstract). [Google Scholar]
  39. Gruba, P.; Mulder, J.; Pacanowskia, P. Combined effects of soil disturbances and tree positions on spatial variability of soil pHCaCl2 under oak and pine stands. Geoderma 2020, 376, 114537. [Google Scholar] [CrossRef]
  40. Wagner, S.; Herrmann, I.; Huth, F. Tools familiar, impact unexpected: Silviculture and ecosystem services on a small forest scale. Allg. For. J. Ztg. 2020, 190, 89–100. [Google Scholar] [CrossRef]
  41. Jonard, M.; Andre, F.; Ponette, Q. Tree species mediated effects on leaf litter dynamics in pure and mixed stands of oak and beech. Can. J. For. Res. 2008, 38, 528–538. [Google Scholar] [CrossRef]
  42. Wehnert, A.; Wagner, S. Niche partitioning in carabids: Single-tree admixtures matter. Insect Conserv. Divers. 2019, 12, 131–146. [Google Scholar] [CrossRef]
  43. Beniamino, F.; Ponge, J.F.; Arpin, P. Soil acidification under the crown of oak trees. I. Spatial distribution. For. Ecol. Manag. 1991, 40, 221–232. [Google Scholar] [CrossRef] [Green Version]
  44. Abella., S.R.; Springer, J.D. Canopy-tree influences along a soil parent material gradient in Pinus ponderosa-Quercus gambelii forests, northern Arizona. J. Torrey Bot. Soc. 2008, 135, 26–36. [Google Scholar] [CrossRef] [Green Version]
  45. Hassan, S.M.T.; Ghimire, C.P.; Lubczynski, M.W. Remote sensing upscaling of interception loss from isolated oaks: Sardon catchment case study, Spain. J. Hydrol. 2017, 555, 489–505. [Google Scholar] [CrossRef]
  46. Kádár, K.; Fazekas, J.P.; Sárospataki, M.; Lövei, G.L. Seasonal dynamics, age structure and reproduction of four Carabus species (Coleoptera: Carabidae) living in forested landscapes in Hungary. Acta Zool. Hung. 2015, 61, 57–72. [Google Scholar] [CrossRef]
  47. Paoletti, M.G.; Martin Cantarino, C. Sex ratio alterations in terrestrial woodlice populations (Isopoda: Oniscidea) from agroecosystems subjected to different agricultural practices in Italy. Appl. Soil Ecol. 2002, 19, 113–120. [Google Scholar] [CrossRef]
  48. Knapp, M.; Knappová, J. Measurement of body condition in a common carabid beetle, Poecilus cupreus: A comparison of fresh weight, dry weight, and fat content. J. Insect Sci. 2013, 13, 6. [Google Scholar] [CrossRef] [PubMed] [Green Version]
  49. Jervis, M.; Kidd, N. Insect Natural Enemies. Practical Approaches to Their Study and Evaluation; Chapman & Hall: London, UK, 1996. [Google Scholar]
  50. Leather, S. Insect Sampling in Forest Ecosystems; Blackwell Science Ltd: Malden, MA, USA, 2005. [Google Scholar]
  51. Huk, T.; Kühne, B. Substrate selection by Carabus clatratus (Coleoptera, Carabidae) and its consequences for offspring development. Oecologia 1999, 121, 348–354. [Google Scholar] [CrossRef] [PubMed]
  52. Pokluda, P.; Hauck, D.; Cizek, L. Importance of marginal habitats for grassland diversity: Fallows and overgrown tall-grass steppe as key habitats of endangered ground-beetle Carabus hungaricus. Insect Conserv. Divers. 2012, 5, 27–36. [Google Scholar] [CrossRef]
  53. LFB and LFE. 2017. Available online: http://www.forstliche-umweltkontrolle-bb.de/r3_meteo.php (accessed on 6 November 2017).
  54. Müller, J.K. Die Bedeutung der Fallenfang-Methode für die Lösung ökologischer Fragestellungen. Zool. Jb. Syst. 1984, 111, 281–305. [Google Scholar]
  55. Brown, G.R.; Matthews, I.M. A review of extensive variation in the design of pitfall traps and a proposal for a standard pitfall trap design for monitoring ground-active arthropod biodiversity. Ecol. Evol. 2016, 6, 3953–3964. [Google Scholar] [CrossRef] [PubMed] [Green Version]
  56. Ziesche, M. Effect of Forest Structure and Small-Scale Environmental Conditions on the Community of Epigeic Arthropods (Carabidae, Araneae). Ph.D. Thesis, Technische Universität Dresden, Fakultät Umweltwissenschaften, Tharandt, Germany, 2016. [Google Scholar]
  57. Heydemann, B. Agrarökologische Problematik (dargetan an Untersuchungen über die Tierwelt der Bodenoberfläche der Kulturfelder). Ph.D. Thesis, Hohen Philosophischen Fakultät an der Christian-Albrechts-Universität, Kiel, Germany, 1953. [Google Scholar]
  58. Scheller, H.V. Pitfall trapping as the basis for studying ground beetle (Carabidae) predation in spring barley. Tidsskr. Planteavl. 1984, 88, 317–324. [Google Scholar]
  59. Mühlenberg, M. Freilandökologie, 3rd ed.; Quelle & Meyer Verlag: Heidelberg/Wiesbaden, Germany, 1993. [Google Scholar]
  60. Langraf, V.; David, S.; Babosová, R.; Petrovičová, K.; Schlarmannová, J. Change of Ellipsoid Biovolume (EV) of Ground Beetles (Coleoptera, Carabidae) along an Urban–Suburban–Rural Gradient of Central Slovakia. Diversity 2020, 12, 475. [Google Scholar] [CrossRef]
  61. Szyszko, J.; Gryuntal, S.; Schwerk, A. Differences in Locomotory Activity Between Male and Female Carabus hortensis (Coleoptera: Carabidae) in a Pine Forest and a Beech Forest in Relation to Feeding State. Environ. Entomol. 2004, 33, 1442–1446. [Google Scholar] [CrossRef] [Green Version]
  62. Clark, P.J.; Evans, F.C. Distance to nearest neighbor as a measure of spatial relationships in populations. Ecology 1954, 35, 445–453. [Google Scholar] [CrossRef]
  63. Krebs, C.J. Ecological Methodology, 2nd ed.; Addison Wesley Longman Inc., University of British Columbia: Vancouver, BC, Canada, 1999. [Google Scholar]
  64. Baddeley, A.; Rubak, E.; Turner, R. Spatial Point Patterns. Methodology and Applications with R; Chapman & Hall/CRC Interdisciplinary Statistics Series; CRC Press: Boca Raton, FL, USA, 2016. [Google Scholar]
  65. Schober, P.; Boer, C.; Schwarte, L.A. Correlation Coefficients: Appropriate Use and Interpretation. Anesth. Analg. 2018, 126, 1763–1768. [Google Scholar] [CrossRef]
  66. Zinke, P.J. The Pattern of Influence of Individual Forest Trees on Soil Properties. Ecology 1962, 43, 130–133. [Google Scholar] [CrossRef]
  67. Shamsutdinov, Z.; Ubaydullaev, S.; Shamsutdinov, N.; Mirzaev, B.; Mamatov, F.; Chorshabiyev, N. The concept of the phytogenic field: Theory, research experience and practical significance. IOP Conf. Ser. Earth Env. For. Sci. 2020, 614, 012164. [Google Scholar] [CrossRef]
  68. Bolker, B.M.; Brooks, M.E.; Clark, C.J.; Geange, S.W.; Poulsen, J.R.; Stevens, M.H.H.; White, J.-S.S. Generalized linear mixed models: A practical guide for ecology and evolution. Trends Ecol. Evol. 2009, 24, 127–135. [Google Scholar] [CrossRef]
  69. Vinatier, F.; Tixier, P.; Duyck, P.-F.; Lescourret, F. Factors and mechanisms explaining spatial heterogeneity: A review of methods for insect populations. Methods Ecol. Evol. 2011, 2, 11–22. [Google Scholar] [CrossRef]
  70. Magnusson, A.; Skaug, H.; Nielsen, A.; Berg, C.; Kristensen, K.; Maechler, M.; van Bentham, K.; Bolker, B.; Sadat, N.; Lüdecke, D.; et al. glm TMB: Generalized Linear Mixed Models Using Template Model Builder. Date/Publication 2020-07-02 11:30:17 UTC. 2020. Available online: https://cran.r-project.org/web/packages/glmmTMB/glmmTMB.pdf (accessed on 19 January 2021).
  71. Barbaro, L.; Pontcharraud, L.; Vetillard, F.; Guyon, D.; Jactel, H. Comparative responses of bird, carabid, and spider assemblages to stand and landscape diversity in maritime pine plantation forest. Écoscience 2005, 12, 110–121. [Google Scholar] [CrossRef]
  72. Samways, M.J.; McGeoch, M.A.; New, T.R. Insect Conservation: A Handbook of Approaches and Methods; Techniques in Ecology & Conservation Series; Oxford University Press: London, UK, 2013. [Google Scholar]
  73. Davis, D.E.; Gagné, S.A. Boundaries in ground beetle (Coleoptera: Carabidae) and environmental variables at the edges of forest patches with residential developments. PeerJ 2018, 6, e4226. [Google Scholar] [CrossRef] [PubMed] [Green Version]
  74. Murcia, C. Edge effects in fragmented forests: Implications for conservation. Tree 1995, 10, 58–62. [Google Scholar] [CrossRef]
  75. Didham, R.K. An overview of invertebrate responses to forest fragmentation. In Forests and Insects; Watt, A.D., Stork, N.E., Hunter, M.D., Eds.; Chapman & Hall: London, UK, 1997; pp. 305–320. [Google Scholar]
  76. Hamberg, L.; Lehvävirta, S.; Kotze, D.J. Forest edge structure as a shaping factor of understorey vegetation in urban forests in Finland. For. Ecol. Manag. 2009, 257, 712–722. [Google Scholar] [CrossRef]
  77. Ries, L.; Sisk, T.D. What is an edge species? The implications of sensitivity to habitat edges. Oikos 2010, 119, 1636–1642. [Google Scholar] [CrossRef]
  78. Fahrig, L. Rethinking patch size and isolation effects: The habitat amount hypothesis. J. Biogeogr. 2013, 40, 1649–1663. [Google Scholar] [CrossRef]
  79. Niemelä, J.; Haila, Y.; Halme, E.; Pajunen, T.; Punttila, P. Small-scale heterogeneity in the spatial distribution of carabid beetles in the southern Finnish taiga. J. Biogeogr. 1992, 19, 173–181. [Google Scholar] [CrossRef]
  80. Day, K.R.; Marshall, S.; Heaney, C. Association between Forest Type and Invertebrates: Ground Beetle Community Patterns in a Natural Oakwood and Juxtaposed Conifer Plantation. Forestry 1993, 66, 37–50. [Google Scholar] [CrossRef]
  81. Hunter, M.L. Maintaining Biodiversity in Forest Ecosystems; Cambridge University Press: Cambridge, UK, 1999. [Google Scholar]
  82. Kraus, D.; Krumm, F. (Eds.) Integrative Approaches as an Opportunity for the Conservation of Forest Biodiversity; European Forest Institute: Freiburg, Germany, 2013. [Google Scholar]
  83. Niemelä, J.; Koivula, M.; Kotze, D.J. The effects of forestry on carabid beetles (Coleoptera: Carabidae) in boreal forest. J. Insect Conserv. 2007, 11, 5–18. [Google Scholar] [CrossRef]
  84. Szujecki, A. Ecology of Forest Insects; Series Entomologica; Dr. W. Junk Publishers: Dordrecht, The Netherlands, 1987; Volume 26. [Google Scholar]
  85. Jukes, M.R.; Peace, A.J.; Ferris, R. Carabid beetle communities associated with coniferous plantations in Britain: The influence of site, ground vegetation and stand structure. For. Ecol. Manag. 2001, 148, 271–286. [Google Scholar] [CrossRef]
  86. Pretzsch, H.; Forrester, D.I.; Bauhus, J. Mixed-Species Forests: Ecology and Management; Springer: Berlin/Heidelberg, Germany, 2017. [Google Scholar] [CrossRef]
  87. Schowalter, T.D. Insect Ecology. An Ecosystem Approach, 2nd ed.; Elsevier: Amsterdam, The Netherlands, 2006. [Google Scholar]
  88. Moya-Laraño, J.; Macías-Ordóñez, R.; Blanckenhorn, W.U.; Fernández-Montraveta, C. Analysing Body Condition: Mass, Volume or Density? J. Anim. Ecol. 2008, 77, 1099–1108. [Google Scholar] [CrossRef] [PubMed]
  89. Langraf, V.; Petrovičová, K.; David, S.; Ábelová, M.; Schlarmannová, J. Body volume in ground beetles (Carabidae) reflects biotope disturbance. Folia Oecologica 2017, 44, 114–120. [Google Scholar] [CrossRef] [Green Version]
  90. Loreau, M. Annual activity and life cycles of carabid beetles in two forest communities. Holarct. Ecol. 1985, 8, 228–235. [Google Scholar] [CrossRef]
  91. Lövei, G.L.; Sunderland, K.D. Ecology and behavior of Ground Beetles (Coleoptera: Carabidae). Annu. Rev. Entomol. 1996, 41, 231–256. [Google Scholar] [CrossRef]
  92. Müller-Motzfeld, G. Laufkäfer in Wäldern Deutschlands. Angew. Carab. Suppl. 2001, II, 9–20. [Google Scholar]
  93. Wehnert, A.; Wagner, S.; Huth, F. Spatio-Temporal Distribution of Carabids Influenced by Small-Scale Admixture of Oak Trees in Pine Stands. Diversity 2020, 12, 398. [Google Scholar] [CrossRef]
  94. Shibuya, S.; Kubota, K.; Ohsawa, M.; Kikvidze, Z. Assembly rules for ground beetle communities: What determines community structure, environmental factors or competition? Eur. J. Entomol. 2011, 108, 453–459. [Google Scholar] [CrossRef] [Green Version]
  95. Magura, T.; Tóthmérész, B.; Elek, Z. Effects of leaf-litter addition on carabid beetles in a non-native Norway spruce plantation. Acta Zool. Acad. Sci. Hung. 2004, 50, 9–23. [Google Scholar]
  96. Tyler, G. Variability in colour, metallic lustre, and body size of Carabus arvensis Herbst, 1784 (Coleoptera: Carabidae) in relation to habitat properties. Entomol. Fenn. 2010, 21, 90–96. [Google Scholar] [CrossRef] [Green Version]
  97. Jelaska, L.Š.; Dumbović, V.; Kučinić, M. Carabid beetle diversity and mean individual biomass in beech forests of various age. ZooKeys 2011, 100, 393–405. [Google Scholar] [CrossRef] [Green Version]
  98. Ohsawa, M. The role of isolated old oak trees in maintaining beetle diversity within larch plantations in the central mountainous region of Japan. For. Ecol. Manag. 2007, 250, 215–226. [Google Scholar] [CrossRef]
  99. Wiezik, M.; Svitok, M.; Dovčiak, M. Conifer introductions decrease richness and alter composition of litter-dwelling beetles (Coleoptera) in Carpathian oak forests. For. Ecol. Manag. 2007, 247, 61–71. [Google Scholar] [CrossRef]
  100. Worthen, W.B.; Merriman, D.C.G. Relationships between Carabid Beetle Commmunities and Forest Stand Parameters: Taxon Congruencer or Habitat Association. Southeast. Nat. 2013, 12, 379–386. [Google Scholar] [CrossRef]
  101. Skłodowski, J.; Szczeszek, J. Dead wood modifies mobility of ground beetles. Baltic J. Coleopterol. 2015, 15, 91–98. [Google Scholar]
  102. Andrési, D.; Bali, L.; Tuba, K.; Szinetár, C. Comparative study of ground beetle and ground-dwelling spider assemblages of artificial gap openings. Community Ecol. 2018, 19, 133–140. [Google Scholar] [CrossRef] [Green Version]
  103. Matveinen-Huju, K.; Niemelä, J.; Rita, H.; O´Hara, R.B. Retention-tree groups in clear-cuts: Do they constitute "life-boats" for spiders and carabids? For. Ecol. Manag. 2006, 230, 119–135. [Google Scholar] [CrossRef]
  104. Koch Widerberg, M. Oak as Retention Tree in Commercial Spruce Forests. Effects on Species Diversity of Saproxylic Beetles and Wood Production. Ph.D. Thesis, Swedish University of Agricultural Sciences, Alnarp, Sweden, 2013. No. 2013:66. [Google Scholar]
  105. Koivula, M.; Niemelä, J. Gap felling as a forest harvesting method in boreal forests: Responses of carabid beetles (Coleoptera, Carabidae). Ecography 2003, 26, 179–187. [Google Scholar] [CrossRef] [Green Version]
  106. Ulyshen, M.D.; Hanula, J.L.; Horn, S.; Kilgo, J.C.; Moorman, C.E. The response of ground beetles (Coleoptera: Carabidae) to selection cutting in a South Carolina bottomland hardwood forest. Biodivers. Conserv. 2006, 15, 261–274. [Google Scholar] [CrossRef] [Green Version]
  107. Vítková, L.; Bače, R.; Kjučukov, P.; Svoboda, M. Deadwood management in Central European forests: Key considerations for practical implementation. For. Ecol. Manag. 2018, 429, 394–405. [Google Scholar] [CrossRef]
  108. Weber, P.; Bardgett, R.D. Influence of single trees on spatial and temporal patterns of belowground properties in native pine forest. Soil Biol. Biochem. 2011, 43, 1372e1378. [Google Scholar] [CrossRef]
  109. Vrška, T.; Janík, D.; Pálková, M.; Adam, D.; Trochta, J. Below- and above-ground biomass, structure and patterns in ancient lowland coppices. iForest 2016, 10, 23–31. [Google Scholar] [CrossRef] [Green Version]
  110. García, L.V.; Maltez-Mouro, S.; Pérez-Ramos, I.M.; Freitas, H.; Marañón, T. Counteracting gradients of light and soil nutrients in the understorey of Mediterranean oak forests. Web Ecol. 2006, 6, 67–74. [Google Scholar] [CrossRef]
  111. Skłodowski, J. Consequence of the transformation of a primeval forest into a managed forest for carabid beetles (Coleoptera: Carabidae)—A case study from Białowieża (Poland). Eur. J. Entomol. 2014, 111, 639–648. [Google Scholar] [CrossRef] [Green Version]
  112. Heliölä, J.; Koivula, M.; Niemelä, J. Distribution of Carabid Beetles (Coleoptera, Carabidae) across a Boreal Forest-Clearcut Ecotone. Conserv. Biol. 2001, 15, 370–377. [Google Scholar] [CrossRef]
  113. Wagner, S.; Fischer, H.; Huth, F. Canopy effects on vegetation caused by harvesting and regeneration treatments. Eur. J. For. Res. 2011, 130, 17–40. [Google Scholar] [CrossRef]
  114. Lintunen, A.; Kaitaniemi, P.; Perttunen, J.; Sievänen, R. Analysing species-specific light transmission and related crown characteristics of Pinus sylvestris and Betula pendula using a shoot-level 3D model. Can. J. For. Res. 2013, 43. [Google Scholar] [CrossRef]
  115. Perot, T.; Mårell, A.; Korboulewsky, N.; Seigner, V.; Balandier, P. Modeling and predicting solar radiation transmittance in mixed forests at a within-stand scale from tree species basal area. For. Ecol. Manag. 2017, 390, 127–136. [Google Scholar] [CrossRef]
  116. Grüm, L. Spatial Distribution of Males and Females of Carabus arcensis Hbst. in the Breeding Season. In The Role of Ground Beetles in Ecological and Environmental Studies; Stork, N.E., Ed.; Intercept Ltd.: Andover, MA, USA, 1990; pp. 277–287. [Google Scholar]
  117. Loreau, M. Vertical distribution of activity of carabid beetles in a beech forest floor. Pedobiologia 1987, 30, 173–178. [Google Scholar]
  118. Hawes, C.; Stewart, A.J.A.; Evans, H.F. The impact of wood ants (Formica rufa) on the distribution and abundance of ground beetles (Coleoptera: Carabidae) in a Scots pine plantation. Oecologia 2002, 131, 612–619. [Google Scholar] [CrossRef]
  119. Luff, M.L. Biology and ecology of immature stages of ground beetles (Carabidae). In Proceedings of the 11th European Carabidologists’ Meeting, Århus, Denmark, 21–24 July 2003; Lövei, G.L., Toft, S., Eds.; DIAS Report, No. 114. Ministry of Food, Agriculture and Fisheries: Tjele, Denmark, 2005; pp. 183–208. [Google Scholar]
  120. Koivula, M.; Niemelä, J. Boreal Carabid Beetles (Coleoptera, Carabidae) in Managed Spruce Forests—A Summary of Finnish Case Studies. Silva Fenn. 2002, 36, 423–436. [Google Scholar] [CrossRef] [Green Version]
  121. Krissl, K.; Müller, F. Zweckmäßige Dauermischungsformen und Mischungsregulierung. Österr. Forstztg. 1990, 3, 29–32. [Google Scholar]
  122. Perot, T.; Picard, N. Mixture enhances productivity in a two-species forest: Evidence from a modeling approach. Ecol. Res. Ecol. Soc. JPN. 2012, 27, 83–94. [Google Scholar] [CrossRef] [Green Version]
  123. Šiška, B.; Eliašová, M.; Kollár, J. Carabus Population Response to Drought in Lowland Oak Hornbeam Forest. Water 2020, 12, 3284. [Google Scholar] [CrossRef]
  124. Arndt, E.; Arndt, M. Auswertung der Bodenfallenfänge von Carabidenlarven (Coleoptera) im Hakel (Nordharzvorland). Hercynia 1987, 24, 22–33. [Google Scholar]
Figure 1. Maps of tree and pitfall trap positions maps (white circles—pine trees, dark grey circles—oak trees, black squares—pitfall traps).
Diversity 13 00127 g001
Figure 2. Overview of the parameters for C. arvensis, C. coriaceus, C. hortensis, C. violaceus and Cal. inquisitor (left column: densities (n/m²), central column: body size (cm³), right column: sex ratio (males to females)) related to the four different forest stand types and including the results of the following statistical tests: (a) ANOVA for males versus females, all forest stand types included, (b) separate ANOVA for females and males across all forest stand types, and (c) multiple post-hoc tests (LSD) across all forest stand types and for both sexes (The levels of significance: ‘***’ 0.001, ‘**’ 0.01, ‘*’ 0.05).
Diversity 13 00127 g002
Figure 4. A schematic summary of the results depicting the effects of the combination of different scales (forest stand types and spatial effect zones) for C. arvensis, C. coriaceus, C. hortensis, C. violaceus and Cal. inquisitor separated by sex. The size of the circles represents the activity density of females and males. The relative body sizes of the beetles are described by the pictograms.
Diversity 13 00127 g004
Table 1. Forest stand parameters characterising the study sites representing the four different forest types (fst1—pure oak, fst2—mixed oak-pine, fst3—<10% oak, fst4—pure pine), namely age (years), number of trees per ha (n/ha) and species, proportion of trees per species, relative crown cover (%) per tree species, mean diameter at breast height—dbh (cm), mean height (m), mean crown diameter (m) and aggregation index (R) according to Clark and Evans (R = 1 random distribution, R < 1 clustered/aggregated distribution, R > 1 regular/even distribution) with CSR test, p-value ≤ 0.05 *).
Forest AreaNo. 1.11No. 1.12No. 1.13No. 1.14 No. 2.15No. 2.16No. 2.17No. 2.18
ParametersUnits PineOakPineOakPineOakPineOak PineOakPineOakPineOakPineOak
age(years)fst 1 122571113714449197fst 2629499591391048192
no. of trees(n/ha) 37228371111671112260010648367206217194256
prop. of trees(%) 1007936948928515881249514357
crown cover(%) 62.41.053.90.261.70.257.420.030.522.110.918.641.014.336.8
dbh (mean)(cm) 30.9216.4428.2517.1047.2624.0849.9323.4831.5025.6829.7838.8619.3432.5523.21
height (mean)(m) 17.6714.2116.5510.8021.7617.7020.2919.3719.3519.7817.9924.4014.5322.6719.16
crown diameter (mean)(m) 6.053.625.123.598.493.278.413.696.534.226.365.045.894.664.75
aggregation index (R) 1.0950.8771.0100.4501.1460.8561.295 *1.190 *0.9251.281 *1.1471.238 *1.0791.359 *1.008
Forest AreaNo. 3.4No. 3.5No. 3.6 No. 4.7No. 4.8No. 4.9 No. 4.10
ParametersUnits PineOakPineOakPineOak Pine Pine Pine Pine
age(years)fst 3531505715060150 fst 457 60 87 104
no. of trees(n/ha)6455547135265 817 544 433 456
prop. of trees(%)991982991 100 100 100 100
crown cover(%)24.01.819.35.824.13.6 61.5 60.9 26.4 34.5
dbh (mean)(cm)24.0538.0224.3644.0325.6948.32 24.09 24.71 30.41 29.74
height (mean)(m)20.4516.0720.1218.6621.1817.87 21.58 19.63 20.93 22.71
crown diameter (mean)(m)2.978.132.8410.333.3412.84 3.10 3.15 2.35 2.65
aggregation index (R) 1.116 *0.6351.196 *1.0291.249 *0.220 1.158 * 1.360 * 1.225 * 1.316 *
Table 2. Number of traps per zone (i) and proportions of zones (ii) per study site and specific to the particular forest stand type (fst).
No. of Traps per ZoneProportion of Zones (%)
Forest Stand TypeStand No.Z1
(oak)
Z2
(oak-pine)
Z3
(pine)
Z1
(oak)
Z2
(oak-pine)
Z3
(pine)
fst1pure oak1.1180010000
1.1280010000
1.1380010000
1.1480010000
fst2oak–pine mix.2.1535034660
2.1635026686
2.1735030692
2.1826026740
fst 3pine with
<10% oak
3.4262321484
3.51191464845
3.6182021583
fst 4pure pine4.700800100
4.800800100
4.900800100
4.1000800100
Table 3. Correlations (Pearson’s correlation coefficient r) between the proportion of species-specific canopy cover (oak and pine trees) and beetle activity density and body size. (The levels of significance: ‘***’ 0.001, ‘**’ 0.01, ‘*’ 0.05, ‘.’ 0.1; significant results are indicated by bold font).
Forest Stand ParametersCarabid ParametersCarabid SpeciesOaksPines
FemalespMalespImaginespFemalespMalespImaginesp
crown cover (%)beetle densityC. arvensis0.018n.s.−0.277n.s.−0.122n.s.−0.179n.s.0.098n.s.−0.046n.s.
C. coriaceus 0.294 n.s.0.407n.s.0.236n.s.−0.412.−0.466.−0.420.
C. hortensis0.508*0.259n.s.0.462.−0.516*−0.394n.s.−0.548*
C. violaceus0.676**−0.054n.s.0.485.−0.526*0.191n.s.−0.441.
Cal. inquisitor0.814***0.806***0.811***−0.668**−0.670**−0.670**
body sizeC. arvensis0.165n.s.−0.649**−0.335n.s.−0.340n.s.0.492.0.100n.s.
C. coriaceus0.080n.s.0.330n.s.0.204n.s.−0.360n.s.−0.487.−0.466.
C. hortensis0.446.0.560*0.566*−0.552*−0.565*−0.636**
C. violaceus0.286n.s.−0.479.0.034n.s.−0.132n.s.0.501*0.207n.s.
Cal. inquisitor0.872***0.830***0.880***NA-NA-NA-
aggregation index trees (R)beetle densityC. arvensis0.231n.s.0.132n.s.0.193n.s.−0.291n.s.0.135n.s.−0.060n.s.
C. coriaceus0.435.0.540*0.454.−0.436.−0.287n.s.−0.268n.s.
C. hortensis0.610.0.468.0.671**−0.510.−0.380n.s.−0.506*
C. violaceus0.423n.s.−0.145n.s.0.274n.s.0.507*0.492*0.497*
Cal. inquisitor0.436n.s.0.396n.s.0.406n.s.−0.782**−0.737*−0.752**
body sizeC. arvensis0.189n.s.−0.159n.s.0.007n.s.−0.217n.s.0.811***0.452.
C. coriaceus0.293n.s.−0.105n.s.0.118n.s.−0.415n.s.0.784*0.297n.s.
C. hortensis−0.003n.s.0.424n.s.−0.007n.s.0.264n.s.0.130n.s.0.130n.s.
C. violaceus0.258n.s.−0.119n.s.−0.039n.s.−0.114n.s.0.387n.s.0.155n.s.
Cal. inquisitor−0.961*0.749n.s.−0.059n.s.NA-NA-NA-
Table 4. Correlations (Pearson’s correlation coefficient r) between proportions of zones (Z1—oak, Z2—oak–pine mixture, Z3—pine) and activity densities and body sizes of carabid beetles. (The levels of significance: ‘***’ 0.001, ‘**’ 0.01, ‘*’ 0.05, ‘.’ 0.1; significant results are indicated by bold font).
Carabid SpeciesOak Zone (Z1)Oak–Pine Zone (Z2)Pine Zone (Z3)
FempMalpImagpFempMalpImagpFempMalpImagp
beetle densityC. arv.0.051n.s.−0.250n.s.−0.099n.s.0.009n.s.0.215n.s.0.124n.s.−0.052n.s.0.084n.s.0.007n.s.
C. cor.0.180n.s.0.214n.s.0.074n.s.0.341n.s.0.443.0.501.−0.390n.s.−0.490.−0.401n.s.
C. hort.0.375n.s.0.220n.s.0.358n.s.0.269n.s.0.105n.s.0.273n.s.−0.520*−0.269n.s.−0.507*
C. viol.0.654*0.004n.s.0.497*−0.277n.s.−0.305n.s.−0.339n.s.−0.408n.s.0.201n.s.−0.225n.s.
Cal. in.0.925***0.915***0.920***NA-NA-NA-NA-NA-NA-
body sizeC. arv.0.254n.s.−0.639**−0.265n.s.−0.100n.s.0.007n.s.−0.065n.s.−0.164n.s.0.575*0.284n.s.
C. cor.0.541.0.366n.s.0.475n.s.−0.077n.s.0.593.0.404n.s.−0.240n.s.0.593.0.023n.s.
C. hort.0.502.0.631*0.537*−0.004n.s.0.041n.s.−0.096n.s.−0.002n.s.−0.630.−0.035n.s.
C. viol.0.196n.s.−0.352n.s.−0.059n.s.0.269n.s.−0.142n.s.−0.012n.s.−0.088n.s.0.414n.s.0.062n.s.
Cal. in.NA-0.688n.s.0.819.NA-NA-NA-NA-NA-NA-
Table 5. Parameters for the number of carabid beetles (C. arvensis, C. coriaceus, C. hortensis, C. violaceus) using the generalised linear mixed model (GLMM) differentiated by the forest stand types (fst 1—pure oak, fst 2—oak–pine mixture, fst 3—<10% oak, fst 4—pure pine) and combined with the proportion of oak crown cover (cc in%) around each trap position. The levels of significance are indicated by: ‘***’ 0.001, ‘**’ 0.01, ‘*’ 0.05, ‘.’ 0.1.
No. of BeetlesFemalesMalesImagines
Estimatestd. Errorp-ValueEstimatestd. Errorp-ValueEstimatestd. Errorp-Value
C. arvensisinterc.−0.34860.68610.611 −0.99190.68830.150 −0.02810.55200.959
fst 2−0.01350.64990.983 0.81780.59150.167 0.43090.52550.421
fst 3−0.03360.74840.964 0.87620.69810.209 0.45490.61620.460
fst 4−0.50060.80350.533 0.39240.76660.609 0.02710.64840.967
oak cc0.00060.00790.944 0.00360.00790.651 0.00310.00600.608
C. coriaceusinterc.−3.23200.94030.001***−4.77301.04600.000***−3.04660.79340.000***
fst 21.24200.73700.092.1.70400.86710.049*1.43390.61620.020*
fst 31.58100.86800.068.3.02400.93220.002**2.11830.71730.003**
fst 4−18.750010,760.000.999 −17.68001383.000.999 −18.49169404.590.999
oak cc0.02140.01140.060.0.03440.01140.003**0.02430.00920.008**
C. hortensisinterc.−5.41801.34200.000***−3.89351.56250.013*−3.98991.16840.001***
fst 21.91100.90200.034*0.59371.06650.578 1.37330.78620.081.
fst 33.00901.11460.009**1.83701.34740.173 2.49211.20260.015*
fst 4−16.650010,720.000.999 −17.68409896.700.999 −17.53039620.490.999
oak cc0.05480.01510.000***0.03590.01850.053.0.04610.01340.001***
C. violaceusinterc.−0.66330.68560.333 0.23440.79490.768 0.39610.55290.474
fst 2−0.73160.54620.180 −0.91950.64410.153 −0.91920.44850.040*
fst 3−0.34810.64240.588 −1.12080.77600.149 −0.64680.53000.220
fst 4−0.99440.80480.217 −1.12320.85560.189 −0.89870.61310.143
oak cc0.00390.00920.668 −0.05150.01090.169 −0.00400.00750.592
Table 6. Parameters for the number of carabid beetles (C. arvensis, C. coriaceus, C. hortensis, C. violaceus) using the generalised linear mixed model (GLMM) differentiated by the forest stand types (fst 1—pure oak, fst 2—oak–pine mixture, fst 3—less than 10% oak, fst 4—pure pine) and combined with the three tree species-related effect zones (Z1—oak, Z2—oak–pine mixture, Z3—pine). The levels of significance are indicated by: ‘***’ 0.001, ‘**’ 0.01, ‘*’ 0.05, ‘.’ 0.1.
No. of BeetlesFemalesMalesImagines
EstimateStd. Errorp-ValueEstimateStd. Errorp-ValueEstimateStd. Errorp-Value
C. arvensisinterc.−0.31080.39140.427 −0.74060.37670.049*0.19220.34000.572
fst 2−0.33040.62090.595 0.43080.55280.436 0.01190.51140.981
fst 3−0.43590.66580.513 0.52750.59020.371 −0.01040.54900.985
fst 4−0.89930.70520.202 0.14460.65110.824 −0.39690.56910.486
Z20.42320.37790.263 0.34000.35760.342 0.41110.27430.134
Z30.35940.40610.376 −0.00760.39610.985 0.20100.29860.501
C. coriaceusinterc.−1.78040.50220.000***−2.36710.57740.000***−1.34910.39500.001***
fst 21.12680.65410.085.1.32510.73740.072.1.31320.50430.009**
fst 31.74440.70560.013*2.04370.67800.000***2.31430.50640.000***
fst 4−18.30999565.850.998 −15.00083718.910.997 −18.01148434.890.998
Z2−1.34910.48780.006**−1.88930.45550.000***−1.62820.37040.000***
Z3−1.74330.55350.002**−2.54020.50140.000***−2.03280.40780.000***
C. hortensisinterc.−1.22110.43090.005**−1.50700.05130.006**−0.69340.40570.087.
fst 20.32030.63900.616 −0.01890.08580.982 0.28430.59530.633
fst 31.21730.66240.066.2.04600.76100.007**1.68980.59110.004**
fst 4−16.51169282.760.999 −15.790010,690.000.999 −16.74199698.620.999
Z2−0.89880.52070.084.−1.69100.50200.001***−1.25690.37760.001***
Z3−3.89081.11160.000***−4.67701.07100.000***−4.23230.78330.000***
C. violaceusinterc.−0.38800.22430.083.−0.79020.28950.006**0.12130.18350.509
fst 2−0.80970.52800.125 −0.82440.73130.260 −1.02730.47750.032*
fst 3−0.47470.59670.426 −1.22810.81640.133 −0.95160.53770.077.
fst 4−1.14610.75710.130 −1.33300.89140.135 −1.27760.61220.037*
Z2−0.12400.54180.819 0.70720.72130.327 0.39560.48710.417
Z3−0.12280.59130.835 1.24440.79070.116 0.65980.52980.213
Publisher’s Note: MDPI stays neutral with regard to jurisdictional claims in published maps and institutional affiliations.

